11 million jobs in 2018 - Renewable Energy and Jobs Annual Review 2019 - IRENA
←
→
Page content transcription
If your browser does not render page correctly, please read the page content below

Renewable Energy and Jobs
Annual Review 2019

                11
                million jobs in 2018

                                       www.irena.org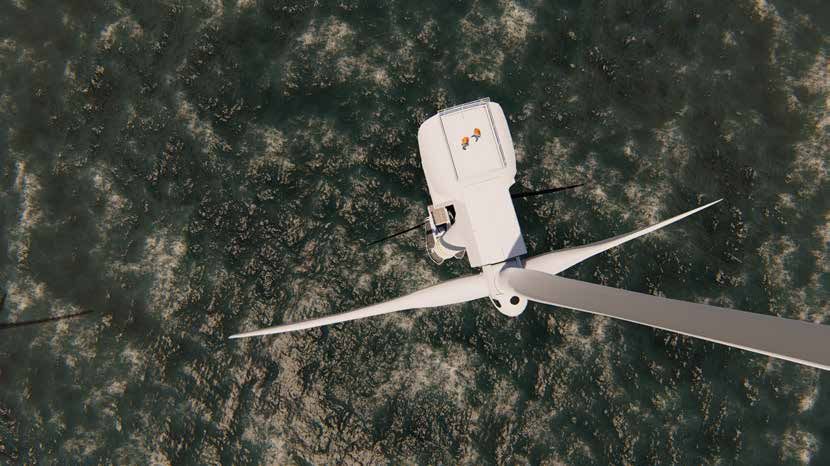
© IRENA 2019
Unless otherwise stated, material in this publication may be freely used,
shared, copied, reproduced, printed and/or stored, provided that appropriate
acknowledgement is given of IRENA as the source and copyright holder.
Material in this publication that is attributed to third parties may be subject
to separate terms of use and restrictions, and appropriate permissions from
these third parties may need to be secured before any use of such material.

ABOUT IRENA
The International Renewable Energy Agency (IRENA) is an intergovernmental
organisation that supports countries in their transition to a sustainable ener-
gy future and serves as the principal platform for international co-operation,
a centre of excellence, and a repository of policy, technology, resource and
financial knowledge on renewable energy. IRENA promotes the widespread
adoption and sustainable use of all forms of renewable energy, including bio-
energy, geothermal, hydropower, ocean, solar and wind energy, in the pursuit
of sustainable development, energy access, energy security and low-carbon
economic growth and prosperity.
www.irena.org

ACKNOWLEDGEMENTS
This report was developed under the guidance of Rabia Ferroukhi (IRENA)
and authored by Michael Renner, Celia García-Baños (IRENA), and Arslan
Khalid (consultant).
The report greatly benefitted from modelling work on hydropower by Ulrike
Lehr and Maximilian Banning (GWS). IRENA also acknowledges the valuable
contribution by William Brent (Power for All) on off-grid employment.
For further information or to provide feedback: publications@irena.org
Available for download: www.irena.org/publications

DISCLAIMER
This publication and the material herein are provided “as is”. All reasonable
precautions have been taken by IRENA to verify the reliability of the
material in this publication. However, neither IRENA nor any of its officials,
agents, data or other third-party content providers provides a warranty of
any kind, either expressed or implied, and they accept no responsibility or
liability for any consequence of use of the publication or material herein.
The information contained herein does not necessarily represent the
views of all Members of IRENA. The mention of specific companies or
certain projects or products does not imply that they are endorsed or
recommended by IRENA in preference to others of a similar nature that
are not mentioned.
The designations employed and the presentation of material herein do
not imply the expression of any opinion on the part of IRENA concerning
the legal status of any region, country, territory, city or area or of its
authorities, or concerning the delimitation of frontiers or boundaries.

Photographs are from Shutterstock unless otherwise indicated.

IRENA HEADQUARTERS
Masdar City
P.O. Box 236, Abu Dhabi, United Arab Emirates
www.irena.org

A Renewable Energy Roadmap

M ES SAGE FROM TH E
I R ENA D I R ECTO R - GEN ER AL

Renewable energy delivers on all main pillars of sustainable development:
environmental, economic and even social. Alongside declining costs
and steadily improving technologies, the transition to renewables is also
creating numerous employment opportunities.

Beyond pursuing climate goals, many governments have prioritised
renewables as a driver of low-carbon economic growth. Diversification of
the supply chain has broadened the sector’s geographic footprint beyond a
few leading markets, as more countries link sustainable technology choices   Francesco La Camera
to broader socio-economic benefits. Increasingly, countries envisage a       Director-General
domestic renewable energy industry taking the place of unsustainable         International Renewable
                                                                             Energy Agency
fossil-based industries.

The sector now employs at least 11 million people worldwide, with more
countries manufacturing, trading and installing renewable energy
technologies every year. As the global energy transformation continues
to gain momentum, this employment dimension ensures socio-economic
sustainability and provides yet another reason for countries to commit to
renewables.
Key Numbers

    		 11
      million
    		jobs in 2018

       39
      % of all renewable
    		energy jobs are
    		in China

    		 3.6
      million
    		jobs are in
    		the solar PV
    		industry

       32
      % of renewable
    		energy jobs are
    		held by women

4
KEY FACTS
    Annual Review 2019
R   The global renewable energy sector employed 11 million people in 2018. This
    compares with 10.3 million in 2017, based on available information.

R   Employment remains concentrated in a handful of countries, with China, Brazil, the
    United States, India and members of the European Union in the lead. Asian countries’
    share remained at 60% of the global total.

R   Several factors — including national deployment and industrial policies, changes
    in the geographic footprint of supply chains and in trade patterns, and industry
    consolidation trends — shape how and where jobs are created.

R   Nonetheless, the increasingly diverse geographic footprint of energy-generation
    capacities and, to a lesser degree, assembly and manufacturing plants, has created
    jobs in a rising number of countries.

R   The solar PV industry retains the top spot, with a third of the total renewable energy
    workforce. In 2018, PV employment expanded in India, Southeast Asia and Brazil,
    while China, the United States, Japan and the European Union lost jobs.

R   Rising off-grid solar sales are translating into growing numbers of jobs in the context
    of expanding energy access and spurring economic activities in previously isolated
    communities.

R   Rising output pushed biofuel jobs up 6% to 2.1 million. Brazil, Colombia, and Southeast
    Asia have labour-intensive supply chains, whereas operations in the United States
    and the European Union are far more mechanised.

R   Employment in wind power supports 1.2 million jobs. Onshore projects predominate,
    but the offshore segment is gaining traction and could build on expertise and
    infrastructure in the offshore oil and gas sector.

R   Hydropower has the largest installed capacity of all renewables but is now expanding
    slowly. The sector employs 2.1 million people directly, three quarters of whom are in
    operations and maintenance.

R   While the analysis suggests job growth in 2018, some of the increase reflects the
    continued improvement and refinement of methodologies that allows a rising share
    of employment to be captured in statistics.

                                                                                              5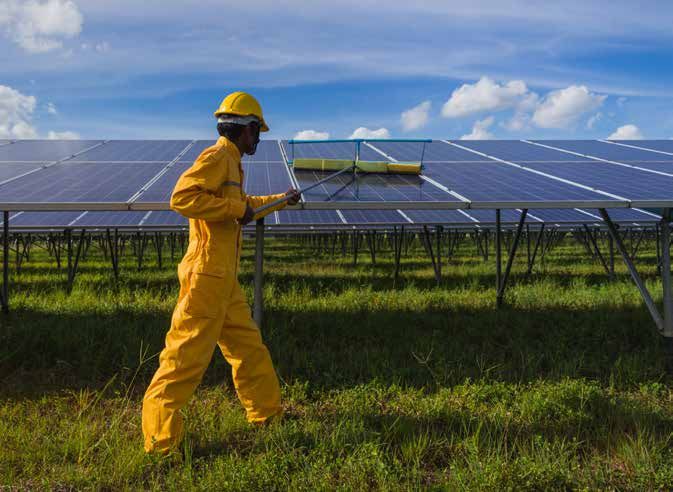
RENEWABLE
                                     ENERGY
                                     AND JOBS
                                     Annual Review 2019
                                     The renewable energy sector employed at least 11 million people, directly and indirectly, in
                                     2018.1 The total includes, for the first time, a fuller estimate of off-grid solar in parts of the
                                     developing world. Renewable energy employment has continued to grow worldwide since
                                     the first annual assessment by the International Renewable Energy Agency (IRENA) in 2012.
                                     The solar photovoltaics (PV), bioenergy, hydro, and wind power industries were the biggest
                                     employers (Figure 1).

    This sixth edition of Renewable Energy and Jobs – Annual Review provides
    the latest available estimates and calculations on renewable energy
    employment. It represents an on-going effort to refine and improve data
    and methodologies. Global numbers are based on a wide range of studies
    with varying methodologies and uneven detail and quality.

    1 	Data are principally for 2017 – 2018, with dates varying by country and technology, including some instances where only earlier information is available.
        The data for hydropower include direct employment only; the data for other technologies include both direct and indirect employment where possible.

6   RENEWA B LE EN ER GY AN D J O B S – A NNUA L RE VI E W 2 0 1 9
FIGURE 1: GLOBAL RENEWABLE ENERGY EMPLOYMENT BY TECHNOLOGY, 2012-2018

Million jobs
               7.28            8.55          9.50           10.04              10.13         10.53           10.98 Total
3
2
                               2.21          2.04             2.16             2.06          1.99            2.05
               1.66                                                                                                        Hydropower
1
0

               5.6             6.3              7.5             7.9              8.1           8.5            8.9    Subtotal

10
                                                                                                                           Solar Photovoltaic
                                                                                                             3.61
8                                                                                             3.37
                                                                               3.09
                                                                                                                           Bioenergy a
                                                              2.77
                                             2.50
                                                                                                                           Wind Energy
6                              2.27
               1.36                                                                                                        Solar Heating /
                                                                                              3.06           3.18          Cooling
                                             2.99             2.88             2.74
4              2.40            2.50                                                                                        Others b

2                                                             1.08             1.16
               0.75                          1.03                                             1.15           1.16
                               0.83
               0.89                                           0.94             0.83
       0.22            0.23 0.50       0.19 0.76       0.20             0.24            0.16 0.81       0.18 0.80
0
               2012            2013           2014             2015            2016            2017           2018
                                                                                                                       a. Includes liquid biofuels, solid biomass
                                                                                                                         and biogas.
                                                                                                                       b. Other technologies include geothermal
Source: IRENA jobs database.                                                                                             energy, concentrated solar power, heat
Note: E xcept for hydropower where a revised methodology led to revisions of job estimates, numbers shown               pumps (ground-based), municipal and
in this figure reflect those reported in past editions of the Annual Review.                                             industrial waste, and ocean energy.

The first section of this report discusses key factors
                                                                                  FACTORS SHAPING
shaping renewable energy employment. This is followed
by observations on job quality and inclusiveness, with                            RENEWABLE ENERGY
Box 1 focused on gender. The third section highlights                             EMPLOYMENT
the latest employment trends in the modern energy
                                                                                  Several factors shape how and where employment
context by technology. The fourth section presents
                                                                                  is generated along the renewable energy supply
a discussion of employment in off-grid solar for
                                                                                  chain. These include governmental policies; the
energy access. The fifth section offers insights for
                                                                                  diversification of supply chains; trade patterns; and
selected regions and countries; countries are listed in
                                                                                  industry reorganisation and consolidation trends.
order of their jobs, installations or market size, rather
                                                                                  Aside from these factors, which are discussed below,
than alphabetically. The report wraps up with a brief
                                                                                  labour productivity grows in importance over time. As
discussion of IRENA's ongoing work on the socio-
                                                                                  renewable energy industries become more mature,
economic impacts of renewable energy.
                                                                                  gain economies of scale, navigate learning curves and
                                                                                  turn more to automated processes, fewer people will
                                                                                  be needed for a given task.

                                                                                                                                                                    7
Governmental Policies                                            Trade, Supply-Chain Dynamics and
                                                                     Industry Consolidation
    Governmental measures, such as auctions, feed-in
    tariffs, subsidies, and industrial, labour and trade             Domestic installation markets are important for
    policies, are indispensable as the renewable energy              employment generation in the downstream segments of
    sector expands and matures. They thus retain strong              the value chain. Deeper domestic supply chains translate
    influence on employment prospects.                               into a lower degree of reliance on imports of equipment
                                                                     and components. On the other side of the equation,
    Feed-in tariffs were essential to the creation of many of
                                                                     however, export sales hold great significance for job
    today’s markets, but if their rates are too generous they
                                                                     creation in countries that serve as regional or global
    can become a budgetary burden. The growing embrace
                                                                     manufacturing hubs. This is particularly true for China and
    of auctions in recent years has translated into lower
                                                                     a number of European countries (EurObserv’ER, 2019).
    project costs, greater competitiveness with fossil fuels,
    and thus more deployment. But the competitive pressure           Countries’ trade profiles vary considerably from one
    of tenders also entails risks. Winning bids may not always       renewable energy technology to another (see Figure 2).
    come to fruition. Cost pressure may lead some firms to           For example, while China is the largest exporter in the
    use inexpensive but low-quality equipment, or to skimp           field of solar PV, its wind power firms mostly serve their
    on staffing levels, wages or skills-training (IRENA, IEA and     domestic market (BNEF, 2019). By contrast, Europe is a
    REN21, 2018; IRENA, 2017a)                                       net importer of solar PV equipment, but the continent’s
                                                                     wind sector (especially in Denmark, Germany, and Spain)
    Above all, policymaking needs to minimise swings
                                                                     is heavily export-oriented, and European wind firms also
    from strong supportive measures to aggressive curbs.
                                                                     have an extensive international manufacturing footprint.
    Likewise, prolonged periods of policy uncertainty can
                                                                     The United States is a minor exporter of wind equipment
    trigger job loss if they lead equipment manufacturers,
                                                                     and runs a very small negative trade balance in the sector,
    project developers, and other industry actors to
                                                                     but is a large net solar importer along with India and
    mothball or shutter facilities.
                                                                     Turkey (EurObserv’ER, 2019).
    Industrial policies leverage capabilities within an economy
                                                                     In biofuels, the United States accounted for close to
    and strengthen domestic supply chains (IRENA, 2017b;
                                                                     30% of exports in 2016, ahead of European countries
    2017c; 2018). Well-designed incentives are needed to
                                                                     (principally the Netherlands, France, Belgium, Hungary,
    nurture nascent industries, along with preferential access
                                                                     Germany and the United Kingdom). In hydropower,
    to credit, economic incubators and supplier development
                                                                     China represented a quarter of global exports, while
    programmes, as well as appropriate education, training
                                                                     European firms (primarily based in Germany, Austria,
    and labour market policies to build a capable workforce.         and Italy) commanded a 46% share. The United States
    The proper policy mix – between enabling measures and            and India contributed just under 5% each.
    mandates, and between inviting foreign investment and
    building domestic capabilities–needs to be tailored to
    country- or region-specific circumstances (IRENA, IEA
    and REN21, 2018)

    A key example of a successful industrial policy is the well-
    developed domestic supply chains and economies of scale
    in China’s solar PV industry. Manufacturing clusters in the
    Yangtze River Delta play a key role. The area’s extensive
    industrial infrastructure, low power prices, and presence of
    suppliers from sectors such as the glass industry enables
    solar firms to purchase primary and intermediate inputs
    inexpensively. Strong support from central, provincial
    and municipal governments has been critical. Many other
    countries could, in principle, imitate such policies in order
    to build viable domestic supply chains (Ball et al., 2017).

8   RENEWA B LE EN ER GY AN D J O B S – A NNUA L RE VI E W 2 0 1 9
FIGURE 2: S
           HARE OF GLOBAL EXPORTS AND NET TRADE VALUES IN THE WIND AND SOLAR PV
          SECTORS FOR SELECTED COUNTRIES, 20162

WIND

      0.02% 6%                                                  Net trade (million Euros)
   United States           Rest of the World                    3 000

 China    8%                                                     2 500                                                 Denmark
                                                                                                                       Germany
                                                                2 000
                                                                                                                       Spain
15%                                             42%              1 500                                                 China
Spain                                           Denmark
                                                                 1 000
                                                                                                                       United States
                                                                                                                       Turkey
                                                                  500

                                                                      0

                                                                 -500
               29%                                              -1000
               Germany

SOLAR PV
                                                                Net trade (million Euros)
52%                                            31%              8 000
Rest of                                        China            6 000                                China             Turkey
the
World                                                                                                Germany           India
                                                                4 000                                United Kingdom    United States
                                                                2 000                                Japan
                                                                      0
                                             7%                -2 000
                                             Japan
                                       5%                      -4 000
             United States    4%       Germany
                                                               -6 000

                                                               -8 000
Source: EurObserv’ER, 2019.

Changes along renewable energy supply chains alter the                         now accounts for 92% and 85% of global cell and
industry's geographic footprint and its trade patterns,                        module capacities, respectively3. While China remains
with consequences for where jobs are created and lost.                         dominant, a number of Southeast Asian countries have
Corporate strategies are a key driver, although some                           emerged as significant exporters (Roselund, 2018). By
countries have sought to take an active role through                           contrast, the United States, India and Europe rely heavily
local content requirements.                                                    on imports. In an effort to build or retain a domestic
                                                                               manufacturing base, some importing countries have
The footprint of the solar PV industry, for instance,                          adopted a variety of import tariffs and levies, but the
has changed significantly since 2012. The bulk of                              effectiveness of such policies can vary (Trendforce,
manufacturing capacity has shifted to Asia, which                              2019; Gupta, 2018a).

2 	Based on UN COMTRADE data. The year 2016 was chosen because the available 2017 data do not cover China.
3 	Not including India.

                                                                                                                                            9
In the face of intensifying competitive pressures,               In the offshore segment, Siemens Gamesa and MHI
     industry consolidation is changing the face of the               Vestas are the undisputed global leaders with a
     renewable energy sector. In wind power, for example,             combined 59% share in 2018, followed by three Chinese
     Siemens and Gamesa merged; Mitsubishi Heavy                      companies (Sewind, Envision, and Goldwind) that
     Industries and Vestas formed an offshore joint venture           hold a combined 35% share (see right-hand chart of
     (MHI Vestas); and GE bought Alsthom’s wind assets                Figure 3). In Europe, just two firms accounted for 93%
     and acquired Denmark’s LM Wind Power.                            of cumulative offshore turbine installations as of the
                                                                      end of 2018: Siemens Gamesa (69%) and MHI Vestas
     Just three companies (Vestas, GE and Siemens
                                                                      (24%) (Wind Europe, 2019a).
     Gamesa) have dominated the US installation market in
     recent years (BNEF and BCSE, 2019). GE and Siemens
     Gamesa together control about half of the Brazilian
     market. Just five turbine manufacturers accounted for
     two thirds of all onshore wind turbines commissioned
     globally during 2018: Vestas (Denmark), Goldwind
     (China), GE (United States), Siemens Gamesa (Germany
     and Spain), and Envision (China) (see left-hand chart of
     Figure 3).

     FIGURE 3: M ARKET SHARES, ONSHORE AND OFFSHORE WIND, 2018

                                                                                          6% All others

       33%
     All others
                                                                      35%
                                                                     Seewind
                                                                     Envision
                                                     48%            Goldwind
                                                                                                                 59%
                               ONSHORE               Vestas                              OFFSHORE
                                                     Goldwind                                                    Siemens
                                                                                                                 Gamesa
                                                     GE Wind Energy                                              Renewable
                                                                                                                 Energy
                       19%                                                                                       MHI Vestas
                       Siemens Gamesa
                       Renewable Energy
                       Envision                          Top tier          Second tier       All others

     Source: Wood Mackenzie, 2019.

10   RENEWA B LE EN ER GY AN D J O B S – A NNUA L RE VI E W 2 0 1 9
Quality and Inclusion that affect their lives and equality of opportunity and
treatment for all women and men”.
As important as it is to shed light on the quantity of
jobs created in renewable energy, job quality must As is true for the economy at large, job quality in
be examined as well. Although detailed information renewable energy varies widely across the industries
remains quite limited, job quality is a critical aspect. and companies that make up the sector and its
A well-paying job that requires well-honed skills diverse supply chain. Variations in required skills
and is performed in a safe, rewarding workplace is a and occupational patterns explain some of this. The
greater multiplier of socio-economic benefits than one significant role of the agricultural supply chain gives
that pays little, carries few benefits, or is temporary. bioenergy a very different profile from the solar, wind,
Employment also needs to be inclusive, providing hydropower, and geothermal industries.
opportunities for people with different talents and skills, With respect to issues like wage levels and workplace
and ensuring that no population group, such as women, protections, national regulations can make a big
is systematically excluded. IRENA has emphasised the difference, as can corporate management culture and
importance of gender equity in particular (see Box 1). the presence of labour representatives. A friendly
What makes for good jobs? The International Labour workplace tends to minimise staff turnover rates
Organization (ILO, n.d.) defines “decent work” as work and is more likely to yield high-quality performance
that is “productive and delivers a fair income, security in equipment manufacturing, construction and
in the workplace and social protection for families, installation, and operations and maintenance.
better prospects for personal development and
social integration, freedom for people to express their
concerns, organize and participate in the decisions
11BOX 1. ENGENDERING THE ENERGY TRANSITION
The global shift to renewables demands a growing The report found that
array of skills – technical, business, administrative, because of its multi-
economic and legal, among others. Widening the disciplinary dimension,
talent pool is thus a pragmatic reason for boosting the the renewable energy
participation of women in renewable energy, coming field appeals to women
on top of considerations of greater gender equity and in ways that the fossil
fairness. fuel industry does
not. Women currently
Over the years, IRENA has addressed the gender
represent 32% of the
dimension of renewable energy in multiple
renewable energy
publications and programmatic activities to help fill
workforce, substantially
the knowledge gap in this field. Based on an in-depth
higher than the 22%
literature review and a ground-breaking survey of
average reported for the global oil and gas industry (see
over 1 400 employees, companies and institutions,
Figure 4). The finding is consistent with national level
Renewable Energy: A Gender Perspective (IRENA,
surveys. In the United States, for example, the share of
2019a) contributed to a better understanding of
women among all solar workers has risen from about
challenges and opportunities at the intersection of
19% in 2013 to 26% in 2018 (Solar Foundation, 2019).
gender and renewable energy.
FIGURE 4: SHARES OF WOMEN IN STEM, NON-STEM AND ADMINISTRATIVE JOBS
IN RENEWABLE ENERGY
% shares of women
100
80
60 28% 35% 45%
40
32% renewable energy
average share in
20 22% average share in
oil and gas
0
STEM jobs Non-STEM Administrative
technical jobs jobs
Source: IRENA, 2019b.
STEM = science, technology, engineering and mathematics.
12 RENEWA B LE EN ER GY AN D J O B S – A NNUA L RE VI E W 2 0 1 9Yet, much remains to be done to boost women’s Gender diversity in renewable energy can be
participation, ease their entry into the industry, and substantially improved in both the modern and access-
improve their career prospects to allow their talents to deprived contexts by action at several levels:
be fully utilised. At 28%, women’s presence in science,
• Mainstreaming gender in policy design and project
technology, engineering and mathematics (STEM)
implementation, backed by solid disaggregated data
jobs is far lower than in non-STEM positions (35%) and
gathering and monitoring;
administrative jobs (45%).
•
Tailoring training and skills, a task requiring
IRENA survey respondents highlighted barriers
government coordination of all actors;
that prevent women from entering the workforce
and advancing in their careers – prominent among •
Implementing policies to attract and retain talent
them social and cultural norms, prevailing hiring and thereby ensure a supportive environment in the
practices, a lack of relevant skills, lack of awareness workplace;
of job opportunities and lack of access to professional •
Supporting women to become agents of change
networks.
and to challenge cultural and social norms in their
A persistent glass ceiling remains the most significant environment;
barrier to retention and career advancement. In close
• Unlocking new livelihood opportunities in the access
to half of the private sector organisations participating
context, such as financing and market entry. Beyond
in the survey, at least three-quarters of board members
gender-sensitive changes in the renewable energy
are men. Other challenges relate to the lack of a
sector, social and economic policies must address
supportive environment, such as flexible work hours,
family-friendly measures, mentoring, networking, legal and social barriers that limit women’s education,
training opportunities and gender equity targets. asset and land ownership and access to credit.
Wage inequalities were flagged as an issue as well, with In 2019, IRENA will present a new report based on
close to two-thirds of respondents expressing the view ground-breaking primary data on how large-scale
that women in renewable energy earn less than men for solar and wind projects in Sub-Saharan Africa can
the same position. The remaining third believe that men benefit women in rural communities (IRENA, 2019c
and women are paid equally. forthcoming).
In the access context (i.e., where modern energy Adapted from IRENA, 2019a
services are limited or non-existent), decentralised
renewable energy solutions offer tremendous
opportunities for women’s engagement in multiple
segments of the value chain. Here, too, however,
barriers exist: cultural and social norms, the lack of
gender-sensitive programmes and policies, insufficient
skills and training opportunities, inequity in ownership
of assets, and lack of access to finance. For example,
a study of the Indian solar rooftop sector found that
women accounted for just 11% of the workforce (a
low share, but higher than women’s presence in the
country’s fossil fuel sector). Segments of the solar value
chain where office-based occupations predominate
(design and pre-construction) attract women much
more than construction or operations and maintenance
(Nobuoka, Patnaik, Jha and Kuldeep, 2019).
13RENEWABLE ENERGY SOLAR PHOTOVOLTAICS
EMPLOYMENT BY Globally, the solar PV industry installed 94 gigawatts
(GW) of capacity during 2018, the same amount as in
TECHNOLOGY 2017. China, India, the United States and Japan were
This section highlights employment trends by the most important installation markets, followed by
Australia, Germany, the Republic of Korea, and Turkey
technology (Figure 5). It discusses employment
(IRENA, 2019b).
in solar PV, liquid biofuels, wind, solar heating and
cooling, and hydropower. The remaining renewable A recent listing reveals that 50 leading solar PV panel
energy technologies — biogas, geothermal energy and manufacturers maintain factories in 23 countries
ground-based heat pumps, CSP, waste-to-energy, and (Solar Power World, n.d.). China remains dominant,
ocean or wave energy — employ far fewer people, and accounting in 2018 for 69% and 64% of global cell and
module capacities, respectively. All Asian countries as
less information is available for them.
a group (excluding India) held shares of 92% and 85%,
respectively (Trendforce, 2019). Japan, the Republic
of Korea, and Chinese Taipei are important producers.
Driven by Chinese and other foreign investment,
Malaysia, Thailand and Viet Nam are playing significant
roles as producers and exporters4. Viet Nam hosts
4 Module manufacturing capacities are 7.2 GW in Viet Nam, 6.5 GW in Malaysia, and 1.8 GW in Thailand (Beetz, 2018a).
FIGURE 5: RENEWABLE ENERGY EMPLOYMENT BY TECHNOLOGY
Solar
Photovoltaic 3 605
Off-grid solar for
energy access
Liquid Biofuels
2 063
Hydropower
2 054
Wind Energy
1 160
Solar Heating/
Cooling 801
Solid Biomass
787
Biogas
334
Geothermal
Energy 94
Municipal and
industrial waste 41
CSP
34
Tide, Wave and
Ocean Energy 1
0 500 1 000 1 500 2 000 2 500 3 000 3 500 4 000
Jobs (thousands)
Source: IRENA jobs database.
Note: Another 7 600 jobs, not shown separately here, cannot readily be broken down by individual renewable energy technology.
14 RENEWA B LE EN ER GY AN D J O B S – A NNUA L RE VI E W 2 0 1 9facilities owned by 11 different manufacturers; Malaysia, two-thirds of PV employment worldwide, or some
9; and Thailand, 6 (Solar Power World, n.d.). 2.2 million jobs (CNREC, 2019). A strong pace of capacity
IRENA estimates that global solar PV employment stood additions in India (9.2 GW in 2018) led IRENA to raise its
at 3.6 million jobs in 20185. Of the leading ten countries on-grid solar employment estimate from 92 400 jobs
shown in Figure 6, eight are Asian (for the purposes of to 115 000 jobs, a number that could double if off-grid
this report, Turkey is counted as part of Asia). Overall, deployments were included.
Asia is home to almost 3 million solar PV jobs (85% of the Solar PV employment in the European Union declined
global total), followed by North America’s 6.4% share, by about 5% to 90 800 jobs in 2017, reflecting a drop of
Africa’s 3.9% and Europe’s 3.2%. This year’s global total more than 10% in installations6 (EurObserv’ER, 2019).
is not directly comparable to the figure reported in last Policy uncertainties caused US employment to fall for
year’s edition. It includes an off-grid jobs estimate of a second year in 2018, to an estimated 225 000 jobs7.
372 000 jobs for South Asia and parts of Africa (see the Japan’s solar PV industry continues to face difficulties,
section on "Renewable Energy Employment: Focus on including shortages of available land for deployment.
Access" further below). Earlier editions did not have fully Although the country’s installation market is still one
comparable estimates for these regions. of the world’s largest, additions in 2018 were below
China, the leading producer of PV equipment and the those of 2017. IRENA estimates that employment fell to
world’s largest installation market, accounted for about 250 000 jobs in 2018.
5 The countries for which IRENA’s database has solar PV employment estimates represent 464 GW of cumulative installations in 2018, or 97% of the global total.
They represent 99.6% of the 94 GW of new installations in 2018.
6 The jobs data for the European Union and its member states throughout this report are for 2017, the most recent year for which such information is available.
Details are at the EurObserv’ER website, https://www.eurobserv-er.org/category/all-annual-overview-barometers/.
7 This is an IRENA estimate based on the all-solar (PV, solar heating and cooling, and concentrated solar power) estimate of 242 300 jobs published by Solar
Foundation, 2019.
FIGURE 6: TOP 10 COUNTRIES IN SOLAR PV EMPLOYMENT
Million jobs
2.3
2.2 61 %
of PV
jobs
2.1 Top 10:
2.0 84% of
PV jobs
0.3
0.2
0.1
0
ina
n
es
h
ia
sia
y
y
m
i
ipe
rke
an
pa
es
Ind
Na
tat
lay
Ch
lad
Ta
rm
Ja
Tu
dS
t
Ma
Vie
se
Ge
ng
ite
ine
Ba
Un
Ch
Source: IRENA jobs database.
15LIQUID BIOFUELS the energy sector, and their end-use may therefore
vary from year to year without people losing jobs. On
The leading bioethanol producers all reached new
the other hand, when people are displaced from their
output peaks in 2018. Biodiesel production also
land by expanding biofuels plantations, agricultural
rose in many of these countries, but declined in
livelihoods may be lost irretrievably.
Argentina and the European Union, and remained
level in Australia, China, Malaysia and the Philippines8. The regional profile of biofuels employment differs
Worldwide employment in biofuels is estimated at considerably from that of the solar PV sector. Latin
2 million, an increase of 6% from 2017. Most of these America accounts for half of all jobs worldwide,
jobs are generated in planting and harvesting of whereas Asia (principally labour-intensive Southeast
feedstock. Fuel-processing facilities tend to offer fewer Asian feedstock supply) accounts for 23%, North
jobs than does feedstock supply, but those jobs typically America for 16% and Europe for 10%. Figure 7 includes
require higher technical skills and offer better pay. the top 10 countries, which together account for about
91% of global estimated employment.
Annual changes in biofuels employment, notably, do
not always equate to net job gains or losses. Oil palm, With 832 000 jobs, Brazil has the world’s largest
soybean, corn, and other feedstocks are used for a liquid biofuel workforce. Record production drove
range of agricultural and commercial purposes outside up employment in the United States to more than
8 The 2018 production estimates are derived from the national biofuel reports published by the US Department of Agriculture’s Foreign Agriculture Service,
available at https://www.fas.usda.gov/commodities/biofuels.
FIGURE 7: TOP 10 COUNTRIES FOR EMPLOYMENT IN LIQUID BIOFUELS
Million jobs
0.9
40%
of biofuel Top 10:
0.8
jobs
91 % of
total biofuels
jobs
0.3
0.2
0.1
0
il
es
ia
bia
nd
ina
ia
ia
nd
sia
az
es
Ind
an
tat
ila
la
lay
Ch
lom
Br
on
m
Po
a
dS
Ma
Th
Ro
Ind
Co
ite
Un
Source: IRENA jobs database.
16 RENEWA B LE EN ER GY AN D J O B S – A NNUA L RE VI E W 2 0 1 9WIND
Most of the wind industry’s activity still occurs on land.
The 540 GW of cumulative onshore capacity compares
with about 23 GW in offshore projects (IRENA, 2019b).
But offshore is gaining traction, receiving USD 25.7
billion of investments in 2018, or 20% of the wind total.
For the first time, China led the way with offshore
projects worth USD 11.4 billion. European projects
attracted spending of USD 3.3 billion (Efstathiou, 2019).
Offshore wind farms tend to require more labour inputs
than onshore projects. In addition to the construction,
assembly, and deployment of new equipment such
as platforms, they can leverage existing technical
capacities and skills (IRENA, 2018) and use converted
and upgraded existing infrastructure from the offshore
oil and gas and shipping industries (Froese, 2018).
Offshore wind development in northern Europe, for
311 000 jobs. Biofuel employment in the European example, utilises the expertise of workboats that
Union was estimated at 208 000 jobs in 2017, the most provide surveying, lifting and other services, and draws
recent year for which data are available (EurObserv’ER, on the know-how of companies that build foundations
for production platforms (O’Connell, 2018).
2019).
Together, onshore and offshore wind employ
For Southeast Asian producers, IRENA uses an
1.16 million people worldwide, up 1% from 2017 11. Most
employment-factor calculation that distinguishes
wind jobs are found in a small number of countries,
labour requirements at plantations and smallholder
although the concentration is less than in the solar PV
farms. Backed by rising output (USDA-FAS, 2018a),
sector. China accounts for 44% of the global total; the
Indonesia’s biodiesel sector is estimated to employ
top five countries represent 75%. The regional picture
237 000 people in 2018, a 12% gain9. In Malaysia, the
is also more balanced than in the solar PV industry.
Philippines and Thailand, IRENA estimates a combined
Asia’s 620 000 wind jobs make up about half the total,
workforce of some 176 000 people10.
while Europe accounts for 28% and North America for
Colombia’s biofuel output rose to a new peak of about 10%. Of the top 10 countries shown in Figure 8, five are
1.1 billion litres in 2018 (USDA-FAS, 2018b). Employment European, three are Asian, and one each is from North
factors based on data published by Federación Nacional and South America.
de Biocombustibles de Colombia (FNBC, n.d.) suggest China remained the leader in new installations during
the number of people active in biofuels may have been 2018, adding 20 GW, of which 1.8 GW offshore (IRENA,
as high as 202 000 jobs in 2018, but could include 2019b). The country’s total wind employment was
some part-time employment not converted to full-time estimated to hold steady at 510 000 jobs (CNREC,
equivalents. 2019), followed by Germany (140 800 jobs) and the
9 The calculation relies on revisions of an employment factor initially developed by APEC (2010). This factor is applied as a constant each year for smallholder
production, which accounts for 45% of volume (WWF, 2012) and is more labour intensive than large-scale plantations. For plantations, IRENA applies an
assumed “decline” factor of 3% per year as a proxy for rising labour productivity.
10 In Thailand, IRENA estimates 111 000 jobs. Smallholders have a 73% production share, an average of values reported by Termmahawong (2014) and by RSPO
(2015). In Malaysia, smallholders account for roughly 35% of production (WWF, 2012). IRENA estimates 28 600 jobs in Malaysia, and 36 600 jobs in the Philippines.
Analysing only the construction and operations of biofuels processing facilities, the Philippine government estimates direct employment of 2 328 jobs.
11 The countries for which IRENA’s database has estimates of wind power employment represent 561 GW of cumulative installations, or 99.6% of the global total.
They also cover 99.3% of the 49 GW of new installations in 2018.
17United States, where wind employment grew 8% to a
new peak of 114 000 jobs (AWEA, 2019).
Based on EurObserv’ER (2019) and national-level
reports, IRENA estimates European employment at
314 200 jobs in 2017, the year with the latest available
data. The continent’s cumulative capacity reached
189 GW in 2018 (Wind Europe, 2019b). Europe is not
only a leader in domestic installations but also holds a
strong position in exports of turbines and foundations.
In Denmark, export sales support the majority of wind
manufacturing jobs (EurObserv’ER, 2019).
FIGURE 8: TOP 10 COUNTRIES FOR WIND EMPLOYMENT
Million jobs
0.55
44%
0.50 of wind
jobs Top 10:
0.45 85%
of wind
jobs
0.20
0.15
0.10
0.05
0
om
ark
il
ain
e
es
ina
y
es
ia
az
nc
an
Ind
tat
pin
Sp
Ch
nm
gd
Br
Fra
rm
dS
ilip
Kin
De
Ge
ite
Ph
d
Un
ite
Un
Source: IRENA jobs database.
18 RENEWA B LE EN ER GY AN D J O B S – A NNUA L RE VI E W 2 0 1 9HYDROPOWER markets has slowed, the sector nonetheless experienced
a growth of 3% over the previous year (Figure 10).
Of all renewable energy technologies, hydropower
continues to have the largest installed capacity. In 2018, The distribution of employment across different
it accounted for almost 50% of renewable energy in the segments of the value chain remains similar to previous
world, but the share has declined as other renewables, years. More than 70% of the jobs are in operations and
in particular solar PV and wind, have grown faster than maintenance. Construction and installation represent
hydropower (Figure 9). 23% of the total; manufacturing is characterised by
lower labour intensity and contributes just 5%.
The analysis suggests that in 2018, over 2 million people
were directly employed in the hydropower sector Employment shares by country in 2018 provide
worldwide. Although the pace of new construction in key interesting insights (Figure 11). India’s labour-intensive
Previous editions of Renewable Energy and Jobs provided separate employment estimates for small
and large hydropower. However, differentiating between them is difficult because of the scarcity of
data and for lack of a universally agreed threshold (set variably by different countries at 10, 20, 30
and even 50 MW).
This edition combines both. The total is calculated by IRENA with the help of an econometric model
based on capacity data, employment factors, and various national estimates and statistics.
FIGURE 9: H
YDROPOWER CAPACITY, TOTAL AND RELATIVE TO ALL
RENEWABLE ELECTRICITY CAPACITY, 2012-2018
Share of hydropower of total Cumulative hydropower
renewable energy capacity (%) capacity (GW)
100 1 200
80 1 150 Share
Installed capacity
60 1 100
40 1 050
20 1 000
0 950
2012 2013 2014 2015 2016 2017 2018
Source: IRENA, 2019b.
19hydropower sector is the largest employer, accounting players are Viet Nam (6%), Pakistan (5%), the European
for 17% of the total, followed by China (15%) which Union and the Russian Federation (4% each), and Iran
experienced a decline in new installations. Brazil, where (Islamic Republic of) and the United States (3% each).
hydropower provides 77% of electricity supply (IRENA,
2019b), accounts for 10 % of the total. Other large
FIGURE 10: H
YDROPOWER EMPLOYMENT, 2014-2018
Million jobs
2.5
2.16
2.04 2.06 1.99 2.05
2.0
1.5
1.0
0.5
0
2014 2015 2016 2017 2018
Source: IRENA jobs database.
Note: Employment in hydropower is derived from a macroeconomic model and adjusted with national and regional data.
FIGURE 11: H
YDROPOWER EMPLOYMENT
BY COUNTRY, 2018
17% India
34%
Rest of
the World
15%
China
Iran (Islamic
3%
Republic of)
10% Brazil
United States 3%
Russian Federation 4% 6% Viet Nam
4% 5%
European Union Pakistan
Source: IRENA jobs database.
20 RENEWA B LE EN ER GY AN D J O B S – A NNUA L RE VI E W 2 0 1 9SOLAR HEATING AND COOLING According to Eurobserv’ER (2019), the number of
people working in the industry in the European Union
Major solar heating and cooling markets, including
declined from 29 000 in 2016 to 21 900 in 2017 (the
China and Brazil, continued their downward trend in
latest year for which data are available)12. In the United
2018, while India and several other markets showed
States, employment was estimated by IRENA at
increased activity (Malaviya 2019; Zhang 2019;
12 100 jobs in 2018.
Sother 2019). IRENA’s estimates indicate that global
employment in the sector declined to 801 400 jobs. Brazil and Turkey are among the key markets. The
Brazilian market dropped by 1.1% in 2018, the third
The top five countries account for 93% of all jobs. Asia is
straight year of reductions (ABRASOL, 2019). IRENA’s
home to 711 000 jobs, 88% of the world total. Of the top
employment-factor-based estimates13 suggest that the
10, three countries are from Asia and three from Europe.
country’s employment in this sector also fell slightly,
Estimates for China suggest that employment held to about 40 630 jobs. Turkey reported a major loss
steady in 2018 from the previous year (CNREC, 2019). of employment, with the number of jobs down to just
With more than 70% of global installed capacity and 8 660 in 2018 from 16 600 in 2017 (Akata, 2019).
a strong position in export markets, the country also
India had the sixth-largest installed capacity in 2017.
remains dominant in employment. In cumulative terms,
IRENA’s employment-factor calculation suggests that
the US is the second largest national market, followed
the country may have employed some 20 700 people
by Turkey, Germany, Brazil, India and Australia (Weiss
in 2018, when annual collector additions reached a
and Spörk-Dür, 2018).
new peak of almost 1.8 million square metres. However,
since imports of Chinese-manufactured equipment have
captured a growing share of the market, this calculation
may over-estimate domestic jobs (Malaviya, 2019).
12 E
urobserv’ER does not differentiate between solar heating and cooling and concentrated solar power. National-level reports suggest a higher figure of
29 300 in 2017. For Spain, APPA (2018) puts employment at 6 200, lower than the 8 100 reported by Eurobserv’ER. For the United Kingdom, REA (2018)
offers a much higher figure of about 9 500 jobs compared with the 200 jobs estimated by Eurobserv’ER.
13 IRENA uses an employment factor of one full-time job per 87 square metres (m2) installed, as suggested by IEA SHCP (2016).
21RENEWABLE ENERGY Information remains relatively sparse on the full
employment impacts of off-grid renewable projects.
EMPLOYMENT: Some 130 million off-grid solar lanterns, SHS, and
FOCUS ON ACCESS other products had been sold worldwide by 2017
(Dalberg Advisors and Lighting Global, 2018). Through
Renewable energy plays an increasingly important
the use of sales data, survey information from close
role for improving energy access. Global renewable off-
to 40 companies and in-depth interviews, GOGLA
grid capacity more than doubled in the past decade,
and Vivid Economics (2018) estimated direct off-grid
to 8.8 GW in 2018; off-grid solar PV expanded 10-fold,
solar employment in parts of Sub-Saharan Africa and
to 2.9 GW (IRENA, 2019b).
in South Asia at 372 000 full-time equivalent jobs (see
In South Asia, public sector programmes have had a Figure 12). Some 56% of these jobs are located in rural
strong role in improving energy access. By contrast, areas and 27% are filled by women.
private sector “pay-as-you-go” (PAYG) business
models predominate in Sub-Saharan Africa (see This employment estimate covers sales and distribution,
Box 2). Worldwide, investment in private off-grid installation and maintenance, and customer support,
ventures grew from USD 10 million in 2010 to USD but excludes manufacturing and assembly. The jobs
511.5 million in 2018, for a cumulative USD 1.7 billion. span a wide skills spectrum across sales, management,
Nearly four fifths of the money went to Sub-Saharan finance, logistics, engineering, technical support and
Africa, compared with 15% to South Asia and 5% to software development. Cash-based transactions
Latin America. The top 10 firms, including Zola, typically create more employment in the sales and
M-KOPA, d.light, Mobisol, BBOXX, and others, secured distribution segments, whereas the PAYG model
two thirds of the total investment (St. John, 2019). relies more on technical jobs such as software design,
BOX 2. PAY AS YOU GO
Companies operating under the PAYG model are Rising disposable incomes will grow the off-grid
creating growing numbers of jobs (IRENA, 2016). market. But PAYG companies need to adjust in
A recent example is BBOXX’s contract under the the face of the rapidly falling costs of new solar
Democratic Republic of Congo’s “Energie pour Tous” products and growing competition from new
rural electrification initiative to provide energy access market entrants (Dizard, 2019).
through solar home systems (SHS) and mini grids to
2.5 million people by 2020. This venture could create
some 10 000 jobs (Tisheva, 2018).
However, the bankruptcy of Mobisol in April 2019
raises a cautionary note. Affordability is key, as prices
and payment schedules are typically set to match
households’ cash flow. Customers make regular
micropayments over a period of one, two or more
years. Given the need for upfront financing, the model
relies on continuous injections of capital for deploying
additional systems.
22 RENEWA B LE EN ER GY AN D J O B S – A NNUA L RE VI E W 2 0 1 9FIGURE 12: D
IRECT EMPLOYMENT IN OFF-GRID permanency of jobs and levels of compensation, current
SOLAR, 2018 AND 2022 skill demand, recruitment challenges, and gender and
youth representation. The study maps areas of indirect
employment impacts in upstream activities such as
Thousand Jobs (Full-time equivalent direct employment)
equipment suppliers, or service providers such as
1.400 training and education (Power for All, 2019).
South Asia 745 Direct or indirect formal jobs are only the tip of the
1.200
Central Africa iceberg of the DRE sector’s employment impact. In
emerging economies, the informal sector is a major
1.000 West Africa
driver of the economy14. According to the survey
East Africa and sector experts, companies selling SHS and solar
800 lanterns are heavily dependent on a large network of
informal workers such as field technicians and sales
600 agents to distribute their products (Power for All, 2019).
67
150 Another key area of the DRE sector’s employment
400
262
350
impact is among rural DRE end-users. Newly acquired
200 or improved energy access can benefit rural business
7 performance, free up workers’ time, encourage more
26
0
77 studying hours for children, and create or enhance jobs
2018 2022 (proj.) as a result. Despite the lack of systematic reporting of
induced jobs as an impact metric, 71% of the literature
Source: GOGLA and Vivid Economics, 2018. studying productive use impact found increased
employment from energy access (Willcox et al., 2015).
A 2018 study (GOGLA and Altai Consulting, 2018)
logistics, and customer service. In general, wages in found that 7% of households owning an SHS reported
off-grid solar are substantially higher than the average that ownership of such a system had enabled a
wages in the countries where these jobs are created family member to take on a new job. Among 44%
(Vivid Economics, 2019). of households, an SHS also unlocked more time for
people to work, and 24% of households use the energy
Additional analysis is needed to gain a more fine-
generated directly in a business or other income-
grained understanding of the socio-economic impacts
generating activity.
in different countries. In 2018, Power for All launched
an annual jobs census on the decentralised renewable Most developing economies have ambitious
energy (DRE) sector in low-energy access countries electrification goals that necessitate rapid expansion of
(Power for All, 2018). It covers a wide range of solar DRE solutions. Kenya’s National Electrification Strategy
technologies. Initially focused on Kenya, India and established a goal of 100% electrification by 2022; in
Nigeria, the geographic scope is to expand to 10 Nigeria, a total capacity of 8 GW of DRE solutions is
countries in 2019 and 25 the following year. The study needed to achieve its 30:30:30 Vision (World Bank,
surveys nearly 150 DRE organisations and includes 2018b; Federal Republic of Nigeria, 2016). Based on
focus group discussions with stakeholders from an analysis of energy access policies, the Power for
All study estimates future job creation potential and
government, the skills and training sector, civil society,
demand for talent. With a demand for more than two-
finance, and industry (Power for All, 2019).
thirds of its workforce skilled, the DRE workforce is
The research analysis, to be released later in 2019, facing a skills gap that is no longer a future threat but a
will yield valuable insights on total DRE employment, challenge today.
14 In India, 88.2% of the employed population are informal workers, 82.7% in Kenya and 92.9% in Nigeria (ILO, 2018; World Bank, 2016).
23RENEWABLE ENERGY
EMPLOYMENT IN
SELECTED COUNTRIES
This section presents key country-level trends and
observations. It first discusses leading countries –
China, Brazil, the United States, India, and members of
the European Union (see Figure 13) – and then presents
information on additional countries by region. Overall,
the bulk of renewable energy employment is in Asian
countries, which accounted for 60% of jobs in 2018.
FIGURE 13: RENEWABLE ENERGY EMPLOYMENT IN SELECTED COUNTRIES
China
EU
Jobs (thousands)
United States
of America 1 235 4 078
Germany 291
855 India
267
Brazil
719 Japan
29
North
1125 Africa
Rest of 227
Africa
66
South Africa
11
million jobs in 2018
Source: IRENA jobs database.
Disclaimer: Boundaries and names shown on this map do not imply any official endorsement or acceptance by IRENA.
24 RENEWA B LE EN ER GY AN D J O B S – A NNUA L RE VI E W 2 0 1 9LEADING MARKETS Employment in the Chinese solar water heating industry
held steady at 670 000 jobs. Following a sharp drop in
new domestic capacity additions in 2014 from a peak of
CHINA close to 45 GWth, subsequent years saw more marginal
39%
reductions; in 2018, 24.8 GWth was added (Zhang, 2019).
of global renewable energy jobs However, these small reductions in market volume are
not assumed to have translated into job losses. Changes
Solar PV: 2.2 million jobs
in the product mix and greater efforts to integrate such
technology into buildings have required additional
Solar Water Heating: 670 000 jobs
labour inputs that offset volume reductions.
Wind: 510 000 jobs China’s 2018 wind employment is estimated at 510 000
jobs, roughly the level of the previous year. Although
the pace of new installations picked up (IRENA, 2019b),
China remains the clear leader in renewable energy policy changes (such as more competitive bidding
employment worldwide, accounting for 39% of the processes and subsidy cuts) may have discouraged
world’s total. The country’s total number of jobs, at companies from additional hiring. Meanwhile, the strong
4.1 million, dipped below last year’s level (CNREC, 2019). growth in the offshore segment did not fully translate
In large part, this reflects the drop in solar PV from into more domestic jobs, as imported components play
2.216 million jobs to 2.194 million (CNREC, 2019). In a greater role than they do for onshore projects.
May 2018, the government announced that it was
suspending advantageous arrangements for utility- BRAZIL
scale solar, imposing a cap on subsidised distributed
solar, and reducing feed-in tariffs in response to Largest biofuels employer
continuous growth in solar subsidies. Subsidies had
expanded in part because the authority that approves Biofuels: 832 000 jobs
solar farms was delegated to the local level in 2013,
making policy coordination difficult (Bin, 2018).
Solar Water Heating: 41 000 jobs
The country installed 43 GW of solar PV during 2018, 18%
less than the previous year. Although rooftop PV saw Solar PV: 15 600 jobs
gains, utility-scale deployment dropped significantly.
Overall production of solar PV modules still grew by Wind: 34 000 jobs
21% in 2018 to 87 GW (Yuanyuan, 2019), but substantial
overcapacities in the supply chain led to some factory
closures and layoffs (Hutchins, 2018; Lin, 2018).
In Brazil, the biofuels sector remains the most important
Offsetting lower domestic sales to a large extent,
renewable energy employer. Output of fuel ethanol
exports rose by 30%, to about 41 GW, during 2018.
rose to record levels in 2018, and plans are to increase it
PV exports to emerging markets are being promoted
further from 27.8 billion litres to 47.1 billion litres in 2028.
through China’s newly unveiled International
Investment Alliance for Renewable Energy15. Chinese Biodiesel production of 5.4 billion litres also hit a record
PV manufacturers are also increasing their global in 2018 (ABIOVE, 2019), driven by a rise in the biodiesel
footprint, with production facilities in close to blend to 10% (USDA-FAS, 2018c). Output is expected to
20 countries (Yuanyuan, 2019). double to 11.1 billion litres over the next decade. To meet
these targets, new ethanol and corn mills and soybean
15 T
he Alliance is a joint initiative by the National Development and Reform Commission, the National Energy Agency, the Ministry of Commerce and the
Chinese Chamber of Commerce, and includes PV module manufacturer Jinko, and other Chinese PV and wind manufacturers, as well as companies specialis-
ing in engineering, planning and construction or operations and maintenance (Enkhardt, 2018).
25oil extracting plants are needed; these could create
an additional 1.4 million jobs over the coming decade
(USDA-FAS, 2018c). Biodiesel employment rose to
an estimated 257 000 jobs in 201816, while ongoing
mechanisation of the feedstock supply chain caused
bioethanol jobs to decline to about 575 000 jobs in 201717.
New additions to Brazil’s wind power generating capacity
ran to 2.1 GW in 2018, the fifth-largest amount worldwide
(IRENA, 2019b), bringing cumulative capacity to 14.7 GW.
More than 85% of this capacity is located in the northeast.
The wind sector can bring industrial development and
job creation to an area with comparatively low economic
development, but skills deficits are an obstacle to local
hiring (ABEEólica, 2019; Lucena and Lucena, 2019).
IRENA estimates the country’s wind workforce at close
to 34 000 people18. Roughly one third of the jobs are in
manufacturing, 42% in construction, and the remainder
in operations and maintenance.
Trade statistics suggest that in 2014, domestic content
in Brazil’s wind energy manufacturing sector was about
But the country is ramping up activities in solar PV,
89%19 (CEMAC, 2017; CEMAC, n.d.). Brazil’s national
installing 828 MW of large-scale capacity and 318 MW
development bank BNDES offers subsidised loans if
of distributed capacity during 2018. In operation since
developers meet local content requirements of 65%.
mid-2018, the country’s 399 MW Pirapora solar complex
Over the years, this requirement has stimulated the
in Minas Gerais is one of Latin America’s largest, and
emergence of a domestic supply chain of more than
uses domestic modules (Power Technology, 2018).
300 companies20 (Cuff, 2018; Ferreira, 2017). Among
IRENA’s employment factor calculations suggest that
the foreign manufacturers investing in Brazil, LM Wind
Brazil presently has close to 15 600 jobs in solar PV,
Power’s blade facility in the Suape Port Complex of
mostly in construction and installation. According to
Pernambuco today employs nearly 900 people (Suape,
the industry group Associação Brasileira de Energia
n.d.; LM Wind Power, 2018).
Solar Fotovoltaica, about 1 GW of capacity will likely
New installations in Brazil’s solar heating market be installed during 2019, and ABSOLAR projects that
declined by 1.1% in 2018, and employment is estimated 15 000 new jobs could be created as a result (ABSOLAR,
to have declined, to 40 630 jobs (ABRASOL, 2018)21. 2019a and 2019b).
16 The calculation is based on employment factors for different feedstocks (Da Cunha et al., 2014). The shares of feedstock raw materials are derived from
ABIOVE (2019). Soybean oil accounts for the bulk (about 70%), followed by beef tallow (16%) and cotton seed and vegetable oils (14%).
17 Employment data are not yet available for 2018. In 2017, Brazil had around 217 000 workers in sugarcane cultivation and 158 000 in ethanol processing (MTE/
RAIS, 2019). IRENA’s employment estimate also includes an estimate of 200 000 indirect jobs in equipment manufacturing, though the figure is rough and dated.
18 This calculation is based on employment factors published by Simas and Pacca (2014).
19 Net imports were USD 254 million, out of total value-added of USD 2 400 million that year.
20 Domestic firms are well-established in tower production, but less so in turbine manufacturing, which is more technologically demanding (WEG, established in
2012, holds a small turbine market share; it acquired expertise through technology transfer and benefited from incentive programmes for local wind technology
development, including an R&D programme by ANEEL (Agência Nacional de Energia Elétrica) and the Economic Subsidy for Innovation Programme operated
by FINEP (Financiadora de Estudos e Projetos) (Ferreira, 2017).
21 This IRENA calculation of installation jobs is based on Brazilian market data and a solar heating and cooling employment factor. The estimate for manufacturing
jobs is derived from an original 2013 estimate by Alencar (2013).
26 RENEWA B LE EN ER GY AN D J O B S – A NNUA L RE VI E W 2 0 1 9You can also read