Framework for assessing ecological and cumulative effects - of offshore wind farms Cumulative effects of impulsive underwater sound on marine ...
←
→
Page content transcription
If your browser does not render page correctly, please read the page content below
Framework for assessing
ecological and cumulative effects
of offshore wind farms

Cumulative effects of impulsive underwater
sound on marine mammals

                                       Version 1.1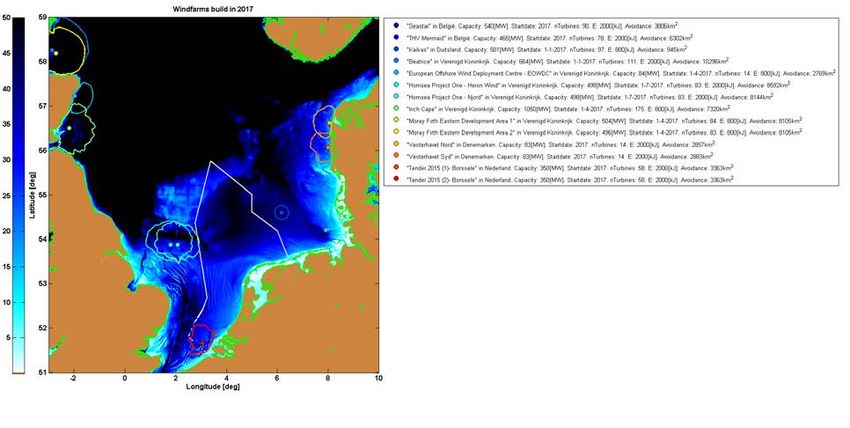
Technical Sc
                                                                                              Oude Waalsd
                                                                                              2597 AK Den
                                                                                              P.O. Box 968
                                                                                              2509 JG The
TNO report
                                                                                              The Netherla

TNO 2015 R10335-A                                                                             www.tno.nl

Cumulative effects of impulsive underwater                                                    T +31 88 866
                                                                                              F +31 70 328
sound on marine mammals

Datee                 April 2015

Author(s)             F. Heinis, C.A.F. de Jong
                      & Rijkswaterstaat Underwater Sound Working Group

Copy no
No. of copies
Number of pages       86 (incl. appendices)
Number of             2
appendices
Sponsor               Rijkswaterstaat Zee en Delta
Project name          ‘
                      Cumulatie onderwatergeluid’(zaaknummer 31097523)
Project number        060.11480 & 060.14412

  This report provides an approved English translation by Pete Thomas
  of the original report TNO 2015 R10335 ‘Cumulatieve effecten van
  impulsief onderwatergeluid op zeezoogdieren’ .
  In case of differences in interpretation between the English and Dutch
  versions of this report, the original Dutch version shall prevail.

All rights reserved.
No part of this publication may be reproduced and/or published by print, photoprint,
microfilm or any other means without the previous written consent of TNO.

In case this report was drafted on instructions, the rights and obligations of contracting
parties are subject to either the General Terms and Conditions for commissions to TNO, or
the relevant agreement concluded between the contracting parties. Submitting the report for
inspection to parties who have a direct interest is permitted.

© 2015 TNO
TNO report | TNO 2015 R10335-A                                                                                                        2 / 74

          Contents

          Abstract .................................................................................................................... 4

          Glossary ................................................................................................................... 5

          Abbreviations ........................................................................................................... 6

1         Introduction .............................................................................................................. 7
1.1       Background ............................................................................................................... 7
1.2       Objective .................................................................................................................... 8
1.3       Boundary conditions .................................................................................................. 8
1.4       Report structure ......................................................................................................... 9

2         Staged procedure for the determination of the cumulative effects of impulsive
          underwater sound on marine mammal populations .......................................... 10
2.1       Overview of stages .................................................................................................. 10
2.2       Quantification of sound propagation ........................................................................ 11
2.3       Determining the size of the affected area: effect parameters and threshold values 13
2.4       Quantification of the number of affected animals and animal disturbance days ..... 22
2.5       Extrapolation of effects on individuals to the population .......................................... 26

3         Application to harbour porpoises ........................................................................ 33
3.1       Piling ........................................................................................................................ 33
3.2       Scenario calculation for seismic surveying .............................................................. 46
3.3       Calculation results ................................................................................................... 48
3.4       Conclusions from the Interim PCoD results ............................................................. 51

4         Possible approach for seals ................................................................................. 53
4.1       Introduction .............................................................................................................. 53
4.2       Sound propagation and disturbance area ............................................................... 53
4.3       Seal populations and distribution ............................................................................. 54
4.4       Number of disturbed animals and animal disturbance days .................................... 56
4.5       Extrapolation of disturbance to population effects ................................................... 57

5         Staged approach/guideline for writers of environmental impact assessments
          ................................................................................................................................. 59
5.1       Calculation of sound propagation per piling strike ................................................... 59
5.2       Calculation of the disturbance area per piling strike ................................................ 60
5.3       Calculation of the potential number of disturbed harbour porpoises and seals per
          piling strike ............................................................................................................... 60
5.4       Calculation of the number of animal disturbance days per project .......................... 60
5.5       Estimation of the possible effect on the population on the basis of the number of
          animal disturbance days .......................................................................................... 61
5.6       Calculation of the distance within which there is a risk of PTS in animals .............. 62

6         Knowledge gaps .................................................................................................... 63
6.1       Introduction .............................................................................................................. 63
6.2       Quantification of sound propagation ........................................................................ 63
6.3       Threshold values for disturbance/changes in behaviour ......................................... 64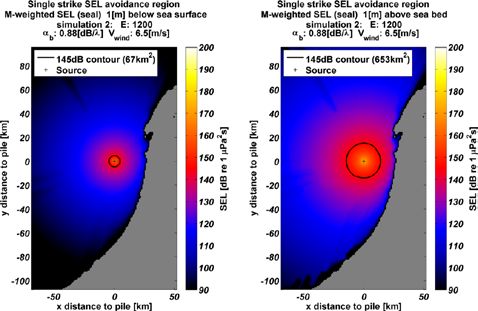
TNO report | TNO 2015 R10335-A                                                                                                   3 / 74

6.4       Threshold values for hearing threshold shifts .......................................................... 65
6.5       Quantification of the number of disturbed animals and animal disturbance days ... 65
6.6       The size of the vulnerable sub-population ............................................................... 66
6.7       Extrapolation of animal disturbance to vital rates .................................................... 66
6.8       Assumptions in Interim PCoD model about population development and
          demographic parameters ......................................................................................... 68

7         Literature ................................................................................................................ 69

          Appendices
          A Members of the Underwater Sound Working Group + participants at the
            workshop on 10-10-2014
          B Background to TTS/PTS in harbour porpoises and seals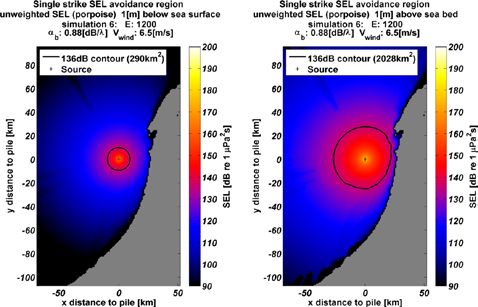
TNO report | TNO 2015 R10335-A 4 / 74
Abstract
Piling work on foundations for wind turbines during the construction of wind farms in
the North Sea generates high levels of underwater sound that can disturb harbour
porpoises and seals. Given the expected developments in the Netherlands and
other countries, it cannot be excluded that the accumulated effects of this impulsive
sound as a result of multiple initiatives may impact entire populations.
At the request of the Ministry of Economic Affairs, Rijkswaterstaat agreed to
develop an ‘Ecology and accumulation of effects assessment framework’for Round
3 offshore wind energy. As part of that process, the Underwater Sound Working
Group developed a 'line of reasoning' (in other words, a staged procedure) for
determining the cumulative effects of impulsive underwater sound on relevant
populations of marine mammals in the North Sea. In doing so, it used the Interim
PCoD model, which was developed recently in the United Kingdom by researchers
from the University of Saint Andrews and SMRU Marine.
As a guideline for environmental impact assessments and appropriate assessments
for future Dutch Offshore Wind Energy projects, the following phased approach has
been recommended:
1 Calculation of sound propagation per piling strike
2 Calculation of disturbance area for harbour porpoises and seals
3 Calculation of number of harbour porpoises and seals possibly suffering
disturbance
4 Calculation of number of animal disturbance days (in other words, the number
of disturbed animals per day multiplied by the number of impulse days)
5 Estimation of the possible effect on the population on the basis of the number of
animal disturbance days using the Interim PCoD model or the estimation
formula described in this report
6 Calculation of the cumulative exposure of harbour porpoises and seals in the
vicinity of the pile and the determination of the distance within which there is a
PTS risk for animals; investigation and description of how this risk will be
mitigated.
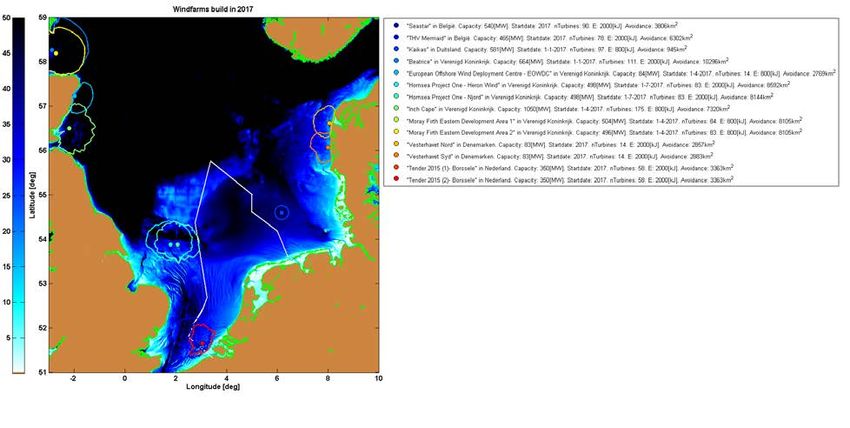
The staged procedure (the 'line of reasoning') was applied to obtain an initial
estimate of the possible extent of the cumulative effects of impulsive underwater
sound on the harbour porpoise population of a number of scenarios for both the
construction of wind farms on the DCS and in the rest of the North Sea and for
seismic surveying in the period 2016-2022.
In addition, this report also discusses a possible approach for seals and provides an
overview of the current knowledge gaps and areas of uncertainty in the proposed
approach.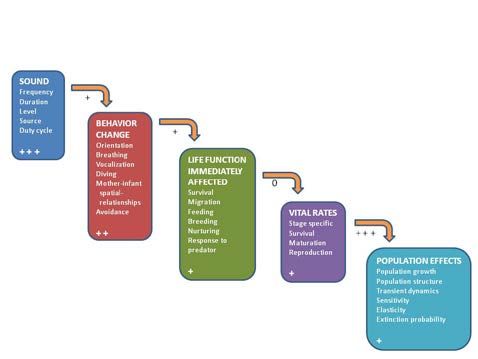
TNO report | TNO 2015 R10335-A                                                            5 / 74

          Glossary

          Animal            Product of the number of impulse days per farm multiplied by the
          disturbance       number of disturbed harbour porpoises per impulse day (taking
          days              the seasons into account) and by the duration of the disturbance
                            per impulse day (=1/3 of a day, 1 or 2 days).
          Impulse day       A day upon which impulsive sound is produced, for example by
                            offshore piling or seismic surveying.
          Percentile        The kth percentile of an ordered statistical data set is the number
                            that separates the k% smaller data from the (100−k)% larger data.
          PTS onset         In this context, we define ‘ PTS onset’as an increase in the
                            hearing threshold (at any frequency) of 40 dB measured within 4
                            minutes after the exposure. According to [Southall et al., 2007],
                            there is a major risk of permanent damage to hearing when there
                            is a threshold shift of this size.
          Residual days     The number of days after the impulse day during which the
          of disturbance    behaviour of the animals is affected by the impulsive sound.
          Sound             10 times log10 of the ratio of the integral of the sound pressure
          Exposure          squared during a defined interval of time (or during a defined
                                                                        2
          Level             event) to the reference value E0 = 1 µPa s.
          TTS onset         In this context, we define ‘ TTS onset’as an increase in the
                            hearing threshold (at any frequency) of 6 dB measured within 4
                            minutes after the exposure
          Vital rates       In general, the probabilities of mortality and reproduction used in
                            the population dynamic models. In the Interim PCoD model,
                            disturbance as a result of impulsive sound affects only the
                            probability of mortality in young calves and juveniles and the
                            probability of adult females producing offspring.
          Vulnerable        The part of the population that may be disturbed by impulsive
          sub-population    sound from a specific project. The size of the vulnerable sub-
                            population is linked to the mobility of the animals: how many
                            different animals could be within the disturbance area during the
                            course of the project?
TNO report | TNO 2015 R10335-A                                                         6 / 74

          Abbreviations

          BE        Belgium
          CPOD      Continuous Porpoise Detector
          DE        Germany
          DK        Denmark
          EIA       Environmental Impact Assessment
          DCS       Dutch Continental Shelf
          NL        The Netherlands
          AA        Appropriate Assessment
          PCAD      Population Consequences of Acoustic Disturbance
          PCoD      Population Consequences of Disturbance
          PL        Propagation Loss
          PTS       Permanent Threshold Shift
          RWS       Rijkswaterstaat
          SEL1      Sound Exposure Level for a single impulsive sound (N.B. SELSS is also
                    used here, with ‘
                                    SS’standing for ‘
                                                    single strike’)
          SELCUM    Cumulative Sound Exposure Level resulting from multiple impulsive
                    sounds
          SLE       Energy Source Level
          SMRU      Sea Mammal Research Unit (University of Saint Andrews)
          SPL       Sound Pressure Level
          TNO       Netherlands Organisation for Applied Scientific Research
          TTS       Temporary Threshold Shift
          UK        United Kingdom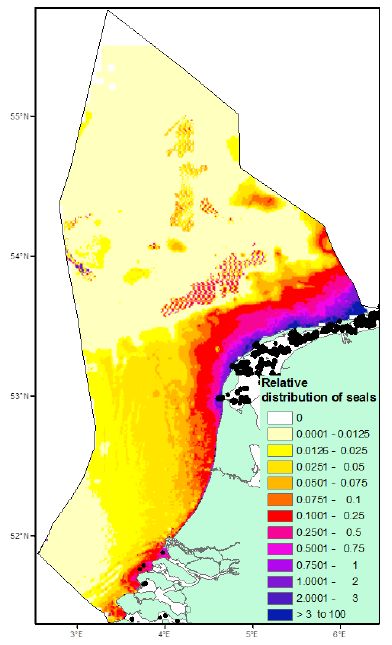
TNO report | TNO 2015 R10335-A                                                                           7 / 74

1         Introduction

    1.1   Background

          Large amounts of sound are produced during piling work on foundations for wind
          turbines and seismic surveying, resulting in very high levels of sound in the
                             1
          surrounding area. Depending upon how far animals are located from the source,
          this can affect behaviour or induce physiological effects such as a temporary or
          permanent increase in the hearing threshold (TTS = temporary threshold shift and
          PTS = permanent threshold shift).

          It is not known whether, and if so to what extent, these sub-lethal physiological or
          behavioural effects have a quantitative knock-on effect on the populations as a
          whole of the predominant species of marine mammals found in the North Sea (the
          harbour porpoise, the harbour seal and the grey seal). These possible population
          effects have therefore not been quantified in the environmental impact assessments
          and appropriate assessments that have been published until now.

          In the case of the ‘ Round 2’offshore wind farms (2009), the competent authority
          decided that it could not exclude the possibility of cumulative and significant
          negative effects resulting from underwater sound generated by piling for the twelve
          initiatives receiving permits. It therefore decided to introduce conditions for the
          permits with the aim of eliminating any significant negative effects. These conditions
          were:
          •   the construction of a maximum of one wind farm a year;
          •   a seasonal restriction on piling activity (construction permitted between 1 July
              and 31 December).

          This approach is no longer adequate for the ‘Round 3’wind farms because the
          Netherlands aims to focus primarily on the construction of offshore wind farms in
          order to achieve sustainable energy objectives. The objective for 2023 in the SER
                     2
          agreement of September 2013 is to have a total of 4,450 MW operational, possibly
          increasing to 6,000 MW in subsequent years. In order to achieve that goal, the
          Dutch government intends to enter into contracts from 2015 onwards for

          1
            Piling and seismic surveying result in regularly repeated impulsive sounds. A number of other
          activities that also produce impulsive sounds have not been included in this report. As pointed out
          in Part I of the Marine Strategy for the Netherlands (2012), sonar systems in the Dutch Section of
          the North Sea make only a very minor contribution to the total amount of underwater sound, as is
          shown by the inventory of sound sources [Ainslie et al., 2009]. The Marine Strategy states that it is
          not considered necessary to take specific measures in the Dutch section of the North Sea. For the
          time being, sonar has not been included in this cumulative assessment. In the future monitoring of
          impulsive sound sources for the Marine Strategy, defence activities will be included and it will
          therefore be possible to include the possible harmful effects of sonar in a cumulative assessment.
          The sound associated with clearing ordnance has not been included because this activity always
          involves a short sound burden in which damage to hearing is a more important factor than
          disturbance (see also Section 2.3.4 of this report) and because the effects of the sound of
          explosions will be described in a parallel study conducted by the Ministry of Defence. The
          continuous sound of shipping has not been included because it is unclear whether, and how, the
          effects of this other type of sound can be accumulated with the effects of impulsive sound.
          2
            https:// http://www.ser.nl/nl/publicaties/overige/2010-2019/2013/energieakkoord-duurzame-
          groei.aspx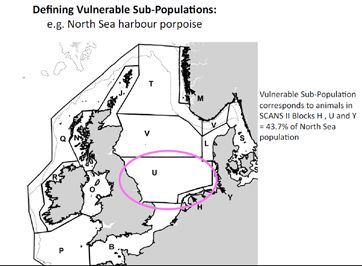
TNO report | TNO 2015 R10335-A                                                                    8 / 74

          approximately ten new wind farms (3,450 MW) on the Dutch Continental Shelf
          (DCS). This cannot be achieved in time if the conditions formulated in Round 2 are
          left in place.

          As a result, research is required to determine whether more wind farms can be built
          annually, and whether additional conditions need to be formulated for the
          construction phase. Given the expected developments in the Netherlands and other
          countries, the possibility cannot be excluded of an impact on entire populations as a
          result of the accumulation of the effects of impulsive sound generated by multiple
          initiatives.

          At the request of the Ministry of Economic Affairs, Rijkswaterstaat agreed to
          develop an ‘Ecology and Accumulation of Effects Assessment Framework’for
          Round 3 offshore wind energy. This is a project that comprises several
          components. The formulation of an approach for the determination of the
          cumulative effects of impulsive underwater sound on relevant populations of marine
          mammals in the North Sea is one of those components. This project is being
          conducted by the Underwater Sound Working Group that was established in early
                3
          2013.

   1.2    Objective

          The aims of the Underwater Sound Working Group were:
          • The development of a staged procedure (a 'line of reasoning') for the
             quantification of the possible cumulative effects of 'impulsive' underwater sound
             during the construction of wind farms in the North Sea on the relevant
             populations of marine mammals (focusing in particular on the harbour
             porpoise);
          • Estimating the size of the cumulative effects of impulsive underwater sound on
             the harbour porpoise population using selected scenarios for the construction of
             wind farms on the DCS and in the rest of the North Sea and for seismic
             surveying in the period 2016-2022. Mitigation measures have been included in
             the scenarios;
          • The establishment of an overview of knowledge gaps.

   1.3    Boundary conditions

          The Underwater Sound Working Group met on a monthly basis between May and
          November 2014 (on 16 May, 19 June, 15 July, 9 September, 23 October and 7
          November). There were informal consultations on 10 September at the ESOMM
          congress between a few members and John Harwood and Cormac Booth of SMRU
          Marine about the possible application of the Interim PCoD model. On 10 October,
          John Harwood presented the results of a number of exploratory calculations with
          Interim PCoD during the ecologists workshop organised in the context of the
          activities of the Working Group. During the period that followed, the calculations for
          the study presented in this report were conducted in a very short time. Given the

          3
            The Underwater Sound Working Group was established in early 2013 at the initiative of RWS
          Sea and Delta. The members of the group come from Rijkswaterstaat Spatial Development and
          Water Affairs, TNO, HWE, SEAMARCO, IMARES, Arcadis, Royal HaskoningDHV and Deltares.
          See Annex 1 for a list of the members.
TNO report | TNO 2015 R10335-A 9 / 74
fact that an Interim PCoD calculation takes some hours to complete, the number of
different scenarios for which it was possible to conduct calculations was, of
necessity, limited. The aim was to select the scenarios in such a way that the
possible bandwidth of effects was covered. Given the time limitations, the
parameters advised by SMRU for the population model and for the dose-effect
relationship were applied without any further investigation of the background to, or
the consequences of, this decision. For the same reason, this study calculated only
the effects on harbour porpoises.
1.4 Report structure
Chapter 2 describes the procedure (‘ line of reasoning’
) for determining the
cumulative effects of underwater sound from piling at sea and seismic surveying on
marine mammals. That procedure is then implemented in Chapter 3 to determine
the effects of the construction of wind farms and seismic surveying in the years
2016 to 2022 on the harbour porpoise population in the southern section of the
North Sea. Chapter 4 looks at the possible application of the procedure to the seal
populations. In Chapter 5, we present a summary of the procedure in the form of a
staged plan/guideline for writers of environmental impact reports. Chapter 6 gives
an overview of the knowledge gaps.TNO report | TNO 2015 R10335-A 10 / 74
2 Staged procedure for the determination of the
cumulative effects of impulsive underwater sound
on marine mammal populations
2.1 Overview of stages
When determining the cumulative effects of impulsive underwater sound on marine
mammal populations, an assessment of relevance is required for all the possible
steps in the chain of effects, from the primary abiotic factors – the sound emission –
up to and including the effect on population size. When the stages are relevant, an
assessment of the effect size is required. The following stages can be
distinguished:
1 Quantification of the relevant sources of impulsive underwater sound in time
and space: where, when and how long are the various piling activities and
seismic surveys, and what does the acoustic field associated with the activities
in question look like?
2 Determination of the relevant effect parameters in terms of behaviour and
hearing that ultimately affect the vital rates of individual animals.
3 Determination of acoustic threshold values for the occurrence of a change in
these effect parameters.
4 Determination of the number of affected animals and the duration of the effect.
5 Determination of the size of the total relevant population.
6 Extrapolation of effects on individuals to the effect on the population with the
Interim PCoD model and the principles and assumptions used in the model.
In 2013, the Underwater Sound Working Group drew up assumptions for the first
four steps on the basis of the scientific knowledge available at the time. To ensure
that the new staged procedure, which was extended to include quantified
population effects, included the latest insights, the various assumptions were
submitted to and discussed with a group of ecologists at a workshop (see annex 1
for the participants). The focus here was on determining the cumulative effects of
the construction of offshore wind farms and seismic surveying on the harbour
4
porpoise population in the North Sea . See Figure 2-1.
It was decided to opt for the harbour porpoise because the probability of this
population being impacted by the cumulative effects of impulsive sound is higher
than is the case with seals. This is because, at the locations where the activities are
planned, the relative population density of harbour porpoises is much higher than in
the case of the two seal species, which are primarily found in coastal waters (see
Section 2.4 and Chapter 4). The aim of the meeting was to establish a consensus
about the ecological principles and assumptions in the proposed staged procedure
and to determine the uncertainties (steps 2 to 6 (incl.) of the overview). Given the
uncertainties identified by the group, bandwidths were adopted for the model input
parameters, the effects of which were later studied using different calculation
scenarios (see also Chapter 3).
4
Taking into consideration activities in the United Kingdom, Denmark, Germany, Belgium and the
Netherlands.stranded animal deaths between 2005-2010 (of 478 post mortem examinations) whilst 5.4%
were the result of physical trauma (including vessel strikes) (Deaville & Jepson, 2011). Given
that the cause of death could not be identified in all cases, these are minimum estimates.
Other anthropogenic activities that require consideration are marine industries, such as
renewable energy developments and the potential disturbance that associated noise can
cause.
Based on the information in Appendix A, three MUs are appropriate (Figure 3). The MUs are
defined as:
1. North Sea (NS) (comprising ICES area IV, VIId and Division IIIa [Skagerrak and
northern Kattegat]). Noting that the northern and western boundary with Division VIa
is arbitrary and that there will an interchange of animals here with the ‘West Scotland’
MU.
TNO report | TNO 2015 R10335-A
2. West Scotland (WS) (comprising ICES area VIa and b). Noting that the boundary 11 / 74
with the North Sea MU is arbitrary and that there will an interchange of animals here
and also with the Irish Sea and Celtic Sea MUs.
3. Celtic and Irish Seas (CIS) (comprising ICES area VI and VII, except VIId)
Figure 3: Harbour porpoise management units.
Figure 2-1 Overview of the North Sea ‘ Management Unit’from [IMMWG, 2013]. See also
[Harwood et al., 2014].
IAMMWG Management Units for Marine Mammals 6
Sections 2.2 to 2.5 (inclusive) set out the arguments underlying the selection of the
principles and assumptions. Section 2.2 looks at the quantification of sound
propagation, Section 2.3 explains the reasons for the selection of relevant effect
parameters, together with the associated threshold values for occurrence of the
effects (in harbour porpoises and seals), and Section 2.4 describes how it is
possible to determine the number of affected animals and animal disturbance days
for harbour porpoises. Finally, Section 2.5 describes how effects on individuals can
be extrapolated to the population as a whole using the Interim PCoD model. This
section also looks at the size of the population that may be affected.
2.2 Quantification of sound propagation
2.2.1 Modelling with AQUARIUS
The AQUARIUS computer model developed by TNO was used to estimate the
levels of underwater sound generated during the construction of wind farms or
during seismic surveying. That model is based on the method described in Weston
[1971, 1976]. It calculates the spatial propagation of the sound using information
about the source of the sound, the bathymetry, the sediment and the wind strength.
Underwater sound charts are generated, where required for a range of depths in the
water column.
2.2.2 Basic principles relating to piling sound
The modelling of the propagation of underwater sound associated with offshore
piling is still under development [Reinhall & Dahl, 2011; Lippert et al., 2014]. The
hybrid model developed by TNO [Zampolli et al., 2013], which calculates piling
sound using detailed data about the pile, the piling hammer and the locality, still
requires further validation. In the study described here of the cumulative effects of
the construction of wind farms in the future, detailed information of this kind is not
yet available.
As a result, this study used the AQUARIUS model to extrapolate the acoustic field
using the existing monitoring data at relatively short distances from the pile to largerTNO report | TNO 2015 R10335-A 12 / 74
distances. Although the AQUARIUS model has not yet been validated
experimentally for the sound propagation of piling sound over distances of more
than approximately 6 km (the maximum distance measured in [De Jong & Ainslie,
2012]), this model is expected to provide a more realistic estimate of sound
propagation than models that do not factor in the frequency of the sound, the
bathymetry, the sediment or the wind strength.
For the calculation of the propagation of the piling sound, it is provisionally assumed
that the piling sound as measured at the Prinses Amalia wind farm (Q7) [De Jong &
Ainslie, 2012] can be adopted as a basis for estimating the underwater sound
associated with driving monopiles in the North Sea (see [Ainslie et al., 2009]). Using
the AQUARIUS model, [Ainslie et al., 2012] estimated the propagation loss PL of
the sound between a point source in the middle of the water column at the piling
location and the various monitoring locations for Q7 (21 m water depth, ‘ medium
sand’sediment, 4.5 m/s wind at a height of 10 m). Totalling the calculated
propagation loss (PL) at the measured sound level (SEL1) resulted in estimates of
the spectrums of an energy source strength SLE = SEL+PL per piling strike for the
various monitoring locations. The upper limit of these estimates (Figure 2-2) is used
here as a spectrum for the piling sound in the AQUARIUS calculations. The SLE per
2 2
piling strike totalled for the frequency bands is 221 dB re 1 µPa s m . The lowest
estimate of the broadband SLE from the various measuring locations in Q7 is 215
2 2
dB re 1 µPa s m . Adopting the upper limit means that the calculated SEL1 is
overestimated by a maximum of 6 dB.
Figure 2-2 Estimated upper limit for the energy source level spectrum (1/3 of an octave) for the
underwater sound from piling at sea based on the measurement results obtained
during the construction of the Prinses Amalia wind farm (Q7), see the text above.
For the time being, monitoring data for offshore piling for a range of wind-turbine
foundations [Ainslie et al., 2009; Betke, 2014; Bellmann et al., 2014] show that the
spectrum distribution is not substantially different from this spectrum. The
associated level does vary depending on the sizes of the pile and the hammer and
on the properties of the seabed where the piling takes place. The level is estimated
on the basis of the plausible assumption that a fixed percentage of the hammer
strike energy is converted into sound energy. The data in Figure 2-2 apply to aTNO report | TNO 2015 R10335-A 13 / 74
hammer strike energy of 800 kJ. When estimating the SLE spectrum for a different
value for hammer strike energy Ehammer, a factor of 10log10(Ehammer/800 kJ) is added
to the spectrum from Figure 2-2.
2.2.3 Basic principles for sound from seismic surveying
At the request of RWS, an initial estimate was made – in the context of the present
study – of underwater sound generated in the North Sea by airgun arrays used in
seismic surveying for the purposes of mapping out the seabed in the search for oil
and gas. These surveys have been going on for many years [DNZ, 2011]. The
underwater sound generated by seismic surveying was estimated to establish a
broad picture of the relative importance of this sound with respect to the sound
produced during planned piling work for the construction of offshore wind farms.
Underwater sound from seismic surveying was estimated on the basis of highly
simplified assumptions. As with piling sound, the calculations were made using the
AQUARIUS model. The source strength of the airgun sound was estimated on the
basis of the calculations made previously by TNO in a project for Wintershall
[Ainslie et al., 2012b]. It was assumed that the source strength of the sound from an
3
airgun array with a volume of 3,090 in , a pressure of 2.000 psi and a depth of 6 m
is representative for the average configuration used. The estimate of the source
strength was based on the results of detailed model calculations conducted by PGS
and stated by TNO as an equivalent acoustic point source with the direction
dependence relevant for propagation over larger distances. In that way, it was
calculated that the most of the sound energy produced by the airguns is directed
into the seabed for the purposes of surveying and does not therefore contribute to
sound propagation in the vicinity.
2.3 Determining the size of the affected area: effect parameters and threshold
values
2.3.1 Relevant effect parameters
As a result of the developments associated with offshore wind energy and the
associated monitoring and research programmes, we have learnt an enormous
amount in recent years about the effects of impulsive sound on marine animals.
This is knowledge acquired both in the field and in laboratory conditions about the
effect of the sound on the behaviour and the hearing of individual animals
(particularly harbour porpoises). See the publications of [Kastelein et al. (2013,
2014)]; [Diederichs et al., 2014]; [Dähne et al., 2013] and [Thompson et al., 2013a].
The effects on individual animals observed in the study can have an impact on the
population size, for example because foraging abilities are impaired, with a knock-
on negative effect on survival chances or reproductive success because of the
animal's condition. Changes in behaviour can also have acute effects on the
chances of survival, for example if young animals lose their mothers [Miller et al.,
2012].
The staged procedure in recent Dutch environmental impact assessments and
appropriate assessments has been based on the latest research results. The
staged procedure presented here looks at both the effects on the behaviour
(avoiding the sound source) and the effects on hearing (particularly PTS) because it
is supposed that these are the effect types that determine the size of the
population. See Section 2.3.4.TNO report | TNO 2015 R10335-A 14 / 74
2.3.2 Threshold values for avoidance and effects on hearing (TTS/PTS)
Threshold values for avoidance and TTS or PTS have been derived as much as
possible from recent ‘ peer-reviewed’literature. Table 2-1 contains an overview of
the criteria that are important for the determination of effects on harbour porpoises
and seals, together with the associated values. For the arguments underlying the
values included in the table, the reader is referred to the Intermezzo ‘ Threshold
values for the effects of underwater sound on marine mammals’ . An important
parameter for the determination of the cumulative SEL is the speed at which
animals swim away from the sound source. The assumed speeds are 3.4 m/s for
the harbour porpoise and 4.9 m/s for seals. The Underwater Sound Working Group
determined these values using a range of sources.
Table 2-1 Threshold values for estimating effects on harbour porpoises and seals. SEL1 = sound
dose as a result of a single piling strike; SELCUM = sound dose received by the
swimming animal as a result of the driving of the entire pile; SEL1/CUM,w = M-weighted
SEL for seals in water. See [Southall et al., 2007]
Species type of effect value source
2
Harbour Avoidance SEL1 > 140 dB re 1 µPa s see Intermezzo
5
porpoise Threshold values
TTS onset SEL CUM > 164 dB re 1 Lucke et al., 2009
2
µPa s
TTS-1 hour SEL CUM > 169 dB re 1 TTS onset + 5 dB
2
µPa s
PTS onset SEL CUM > 179 dB re 1 TTS onset + 15 dB
2
µPa s
Seals Avoidance SEL1,w > 145 dB re 1 Kastelein et al., 2011
2
µPa s
TTS onset SELCUM,w > 171 dB re 1 PTS onset – 15 dB
2
µPa s
TTS-1 hour SELCUM,w > 176 dB re 1 TTS onset + 5 dB
2
µPa s
PTS onset SELCUM,w > 186 dB re 1 Southall et al., 2007
2
µPa s
Intermezzo Threshold values for the effects of underwater sound on marine
mammals
THRESHOLD VALUES FOR AVOIDANCE
Harbour porpoise
In the past few years, relatively large amounts of research data have become
available that can be used to derive threshold values for avoidance. These data
5
The calculations made for this report (Chapter 3) adopted a threshold value for
avoidance/disturbance in harbour porpoises of SEL1 = 136 dB re 1 µPa2s. These calculations had
already been completed when the Underwater Sound Working Group decided to assume a rise of
4 dB in the threshold value to SEL1 = 140 dB re 1 µPa2s in environmental impact assessments in
the future.TNO report | TNO 2015 R10335-A 15 / 74
come from research in both controlled conditions and field studies.
Experimental study
The threshold value for avoidance used in the Dutch environmental impact
assessments in 2013 and in the calculations in the present report was derived from
the results of research by SEAMARCO [Kastelein et al., 2013e]. In that study, a
harbour porpoise with good hearing was exposed to 5 levels of recorded piling
sound. A range of behavioural responses were studied, including breathing,
jumping out of the water and the average distance from the loudspeaker. Jumping
out of the water was seen as the best indicator of avoidance behaviour. Given
figure 8b in [Kastelein et al., 2013e], it was then decided to adopt a threshold value
2
of SEL1 = 136 dB re 1 µPa s (SPL = 145 dB re 1 µPa). This value is the average of
the lowest sound level at which the animal in the study started to jump out of the
water and the sound level at which the frequency of jumping was significantly higher
than in the control condition. This is a conservative value based on the results of a
controlled experiment in quiet conditions. For example, when harbour porpoises are
exposed to sonar sound, it has emerged that masking by background sound can
result in a lower response [Kastelein et al., 2011].
Field study
There was also extensive research during the construction of the Borkum West II
6
wind farm looking at the response of harbour porpoises to piling [Diederichs et al.,
2014]. That involved the installation of CPODs (Continuous POrpoise Detectors) at
7
26 stations at a range of distances from the piling locations. This field study did not
indicate any statistically significant change in harbour porpoise activity at an SEL1 of
2
less than 144 dB re 1 µPa s. That activity was expressed as the number of
8
'porpoise positive minutes' an hour with respect to baseline values.
International threshold values
9
The German Schallschutzkonzept [BMU, 2013] concludes on the basis of results
from a range of studies that the threshold value for disturbance is somewhere
2
between SEL1 = 134 and 145 dB re 1 µPa s. It is not entirely feasible to determine
the precise threshold value on the basis of individual differences in response. In
addition, the 'context' plays a role. However, it is assumed that a threshold value for
2
disturbance of 140 dB re 1 µPa s is plausible [BMU, 2013]. This is higher than the
2
value of SEL1 = 136 dB re 1 µPa s used in the Dutch environmental impact
assessment in 2013 and in the calculations for the present report but that it is still
2
well below the value of SEL1 = 145 dB re 1 µPa s at which Kastelein et al. [2013e]
observed a significant increase in jumping frequency.
Threshold value for avoidance by the harbour porpoise for future Dutch impact
6
BW II was built between 3 September 2011 and 28 March 2012, with 40 wind turbines on tripod
foundations. The piles have a diameter of 2.4 m and they were driven with a maximum piling
energy of 1,200 kJ. The piling time for each pile was an average of two hours.
7
Harbour porpoises constantly send out high-frequency clicks (echo location) to track their food.
These sounds can be recorded with CPODs.
8
‘
Porpoise positive minutes’are minutes during which CPODs detect the clicks emitted by harbour
porpoises
9
This document contains the policy guidelines for granting permits in Germany.TNO report | TNO 2015 R10335-A 16 / 74
assessments
During the meeting of the Underwater Sound Working Group on 7 November 2014,
2
it was decided to adopt the higher threshold value of SEL1 = 140 dB re 1 µPa s for
future environmental impact assessments because it has become clear that the
2
value previously adopted of SEL1 = 136 dB re 1 µPa s is probably very conservative
2
and the value of SEL1 = 144 dB re 1 µPa s may not be conservative enough (in
case of doubt, the precautionary principle should apply). Furthermore, the same
threshold value will then be used in the Netherlands and Germany, easing the way
to international harmonisation in the future.
Seal
2
The threshold value for avoidance behaviour in seals of SEL1 = 145 dB re 1 µPa s
is derived from observations of the behaviour of seals when exposed to recorded
2
piling sound [SEAMARCO, 2011]. At SEL1 = 142 dB re 1 µPa s, it was found that
one of the two harbour seals exposed to the sound swam away and left the pool.
Because the other seal did not respond and therefore had a higher threshold for
disturbance, the Underwater Sound Working Group decided to adopt an SEL1,w of
2
145 dB re 1 µPa s.
THRESHOLD VALUES FOR EFFECTS ON HEARING
In the calculations for the Round 2 wind farms, three thresholds with increasingly
higher values for the size of the effect were used to study the occurrence of effects
on the hearing sensitivity of harbour porpoises and seals. These thresholds were
values for the occurrence of a temporary or permanent increase in the hearing
threshold: TTS (Temporary Threshold Shift) and PTS (Permanent Threshold Shift)
respectively. They are based on the following criteria:
1. TTS onset: in exposed animals, an increase in the hearing threshold of 6 dB at
any frequency is measured between 1 to 4 minutes after exposure.
2. TTS (1 hour): in exposed animals, an increase in the hearing threshold of 18
dB at any frequency is measured between 1 to 4 minutes after exposure.
Given a trend estimated on the basis of measurements in the recovery of
hearing, TTS falls to 6 dB after 1 hour. With a trend estimated using
measurements in the increase in the threshold shift, this threshold value is 5
dB higher than the threshold value for ‘
TTS onset’(see Annex 2).
3. PTS onset: the level at which a rise in the hearing threshold of 40 dB is thought
to occur in exposed animals after 1-4 minutes (for ethical reasons, this is not
actually measured). Given data relating to land mammals, this threshold is
estimated to be 15 dB above the value for ‘ TTS onset’ .
Harbour porpoise
The threshold value for TTS onset assumed for harbour porpoises is based on the
results of the research of Lucke et al. (2009). The exposure levels reported in that
study for TTS onset are expressed as an unweighted SEL1 caused by a single
pulse. Because, among other things, the recovery of hearing between strikes is not
taken into account, this can be seen as a conservative threshold for ‘TTS onset’
after the cumulative exposure to the 2500-3000 piling strikes involved in driving one
pile. Recent, as yet unpublished, research [Kastelein et al., 2014] shows that the
threshold values for the occurrence of TTS and PTS upon exposure to a series of
pulses (recorded piling sound) are probably a lot higher than assumed here (seeTNO report | TNO 2015 R10335-A 17 / 74
below, Section 2.3.4). In other words: the hearing of the harbour porpoise has
proven to be less sensitive to the accumulation of a series of pulses than to a single
pulse with the same exposure level.
Seals
The threshold adopted for TTS onset in the harbour seal is the one derived
indirectly in [Southall et al., 2007] from the data of Kastak et al. (2005). In a harbour
seal, they found a 6 dB TTS onset after exposure to continuous sound at a SELCUM
2 2
of 184 dB re 1 µPa s (25 min, SPL 152 dB re 1 µPa ). On that basis, Southall et al.
estimated a threshold value for TTS resulting from impulsive sound by deducting
the difference of 13 dB between the threshold values measured in bottlenose
dolphins for TTS as a result of continuous sound and TTS caused by impulsive
sound. As is also stated in [Southall et al., 2007], that is probably a conservative
estimate. This threshold value is used for the cumulative unweighted SELCUM,W,
totalled for all pulses to which an animal is exposed during the driving of a single
pile.
PTS onset
The threshold value adopted for PTS onset is, in line with [Southall et al., 2007], 15
dB above the threshold for TTS onset (see also the considerations in the TNO
memorandum included as Annex 2 to this report). The threshold for PTS is
2
therefore SELCUM = 179 dB re 1 µPa s for the harbour porpoise and SELCUM,W = 186
2
dB re 1 µPa s for the seal. Adopting this threshold implies that PTS in seals will, in
addition to a form of permanent damage, also imply severe TTS in which recovery
10
will take days.
Frequency weighting
For the harbour porpoise, given the data from [Lucke et al., 2009] and [Kastelein et
al., 2013e], we assume unweighted threshold values that do not take hearing
sensitivity as a function of the frequency into account. In the case of the seal, in line
with [Southall et al., 2007], Mpw-weighted SELW values have been used, with ‘ pw’
standing for ‘pinnipeds in water’ . This weighting takes a bandwidth for hearing
underwater of between 75 Hz and 75 kHz into account. At the distances at which
avoidance can occur, the effect of this weighting for impulsive sound from piling and
seismic surveying is small because the sound at the frequencies covered by the
weighting is also weakened by propagation effects. Frequency weighting is
discussed in further detail in conjunction with the knowledge gaps in Section 6.3
and Section 6.4.
2.3.3 Application of threshold values in the determination of the sizes of the affected area
In the environmental impact assessments and appropriate assessments drafted in
2013, the effects of piling sound on behaviour were calculated with underwater
sound charts generated using AQUARIUS, which showed the distribution of the
10
In recent research, Kastelein et al. (2013a) have shown that a harbour seal nevertheless
recovered from a very high TTS (44 dB) after 4 days. Because of the possible ecological
consequences of a chronic threshold shift and because 1 measurement in which the limit of 40 dB
TTS is exceeded is not yet enough to exclude the possibility of PTS, the definition of PTS used in
Southall et al. (2007) has been adopted (Underwater Sound Working Group).TNO report | TNO 2015 R10335-A 18 / 74
spatial sound imissions as a result of a single piling strike (SEL1). It was assumed
that the sound energy from a single, maximum, piling strike determines behavioural
changes. In the next step, the distance from the piling location at which the
threshold values for avoidance are exceeded was determined for harbour
porpoises and seals.
In addition, the possible cumulative sound burden during the driving of a single pile
was calculated for harbour porpoises and seals that are in the proximity of the piling
location and then swim away at a given speed. The total sound burden on the
animal as a result of the cumulative energy generated by all piling strikes for a
single foundation (SELCUM) was compared with limit values above which the sound
could lead to a temporary or permanent threshold shift (TTS and PTS
respectively) in harbour porpoises and seals.
2.3.3.1 Determining the avoidance area (effect on behaviour)
An example of the calculated distribution of the sound during piling for the
construction of a wind farm off the Dutch coast, taken from [Arends et al., 2013],
can be found for harbour porpoises in Figure 2-3. The distribution at 1 m below the
water surface can be found on the left of the figure, with the distribution at 1 m
above the seabed being on the right. The black lines show the contour within which
2
a threshold value for avoidance by harbour porpoises of 136 dB re 1 µPa s is
exceeded. The sound tails off faster towards the coast because of the reduction in
the depth of the water. The figure shows that, at local average wind conditions (=
6.5 m/s) and a piling energy of 1,200 kJ, the piling location could be avoided by
2
harbour porpoises near the seabed in an area of 2,028 km . At 1 m below the
2
surface of the water, this area is 290 km . The avoidance distance is shorter closer
to the surface because sound tails off more higher in the water column than deeper
down. See the example in Figure 2-4. In Figure 2-3, the maximum distances at
which avoidance of the piling location is found are approximately 27 km (close to
the seabed) and 10 km (1 m below the surface).
In this procedure proposed in this report, we have decided to use disturbance in the
bottom part of the water column as the basic assumption for the determination of
the disturbance area because we assume that the natural behaviour of harbour
porpoises is to dive when foraging and that they can be disturbed in that behaviour
by the higher sound levels found deeper in the water column.TNO report | TNO 2015 R10335-A 19 / 74
Figure 2-3 Calculated distribution from [Arends et al., 2013] of SEL1 around a piling location (+) in
the North Sea at a depth of 1 m below the surface (left) and 1 m above the seabed
(right). Wind speed 6.5 m/s. The black lines show the contour within which the
threshold value for avoidance (see Table 2-1) is exceeded for harbour porpoises. The
grey area shows the Dutch coast.
Figure 2-4 Example11 of an SEL1 distribution as a function of distance from the pile and depth in
the water column calculated by AQUARIUS. The black line is the contour at which the
SEL1 is 136 dB re 1 µPa2s.
2.3.3.2 Determining the area in which TTS or PTS can occur
In addition to the calculation of avoidance distances, it is also possible to calculate
the total sound dose (SELCUM) to which harbour porpoises are subjected if they are
exposed to several piling strikes during the driving of a single pile. Their location
when the piling starts and assumptions about their behaviour in response to the
piling sound determine the total sound dose received and therefore the occurrence
11
N.B. The example in Figure 2-4 relates to a location other than the example in Figure 2-3.TNO report | TNO 2015 R10335-A 20 / 74
of TTS and PTS. The following assumptions apply to this calculation for this
example:
• a maximum of 1,200 kJ piling energy / a maximum of 3,500 piling strikes;
• piling complies with a realistic ‘
soft start’scenario, based on current practice
for driving monopiles for wind turbine foundations;
• when piling starts, the animals are located close to the seabed (worst case
scenario);
• animals within the contour line in which avoidance occurs swim quickly to the
surface of the water during the first two piling strikes;
• these animals then swim in a straight line away from the piling location at a
depth of 1 m below the surface as piling continues;
• animals stop swimming as soon as they reach a point away from the piling
location at which the sound dose as a result of 1 piling strike is lower than or
equal to the threshold value at which avoidance occurs.
Figure 2-5 states, for the same example as in Figure 2-3, the results of the
calculations for harbour porpoises in average wind conditions. It can be seen from
the figure that TTS may occur in harbour porpoises near the seabed when piling
starts within a radius of approximately 16 km. The distance within which PTS may
occur in a harbour porpoise is 0.5 km. N.B. The results shown here have been
calculated for a specific farm at a specific location and they are not generally
applicable.
Figure 2-5 Calculated distribution from [Arends et al., 2013] of SEL1 at a depth of 1 m below the
surface (continuous green curve) and at 1 m above the seabed (dotted green curve)
and the SELCUM to which a harbour porpoise is exposed during the complete piling
scenario for a single wind turbine foundation (continuous red line) as a function of the
distance to the pile at which an animal is located when piling starts at 1 m above the
seabed (worst case scenario). The horizontal lines show the threshold values for
avoidance behaviour (green), TTS onset (orange) and PTS onset (red) for harbour
porpoises (see also Table 2-1). The intersections of the green curves (SEL1) with the
green horizontal line show the avoidance distance for harbour porpoises at 1 m below
the surface (~10 km) and at 1 m above the seabed (~27 km). The intersections of the
red line with the red and orange dotted lines show the ‘PTS distance’(~0.5 km) and
the ‘TTS distance’(~16 km).TNO report | TNO 2015 R10335-A 21 / 74
2.3.4 Assumptions for determining population effects
To determine the effects of piling sound on the populations of marine mammals, the
approach for Round 3 wind farms takes the approach developed in early 2013
further. In effect, the staged procedure developed at that time was supplemented by
the Interim PCoD 'population module'.
The approach underlying the Interim PCoD model is used internationally, making
our results and approach comparable with those of other countries. Furthermore,
the Interim PCoD model is currently the only model available.
On the basis of ongoing developments and research results published recently, the
Underwater Sound Working Group concluded that the previous staged procedure
requires some amendments in terms of the effect parameters and the threshold
values in order to allow the most recent insights to be taken into account:
• In the Interim PCoD model, the primary effect to be entered in the model is
expressed by the number of animals disturbed by sound; an animal is
considered to be 'disturbed' if there is a 'significant behavioural response'
[Harwood et al., 2014]; the Interim PCoD model defines this ‘ significant
behavioural response’as a behaviour with a score of 5 or higher on the
behaviour response scale in [Southall et al., 2007]; these are behaviours
such as changes in swimming behaviour and breathing, avoiding a particular
area and changes in vocal behaviour (for the purposes of communications
and foraging). In the workshop for ecologists referred to above, it was
concluded that the threshold value used in the past for avoidance is based on
similar principles. The concept of ‘significant behavioural response’
(disturbance) as used in the Interim PCoD model can therefore be
considered to be equivalent to the concept of ‘ avoidance’as used thus far in
the staged procedure for the effects of underwater sound on marine
mammals;
• The calculations made for this report adopted a threshold value for
2
avoidance/disturbance in harbour porpoises of SEL1 = 136 dB re 1 µPa s.
These calculations had already been completed when the Underwater Sound
Working Group decided to assume a rise of 4 dB in the threshold value to
2
SEL1 = 140 dB re 1 µPa s in environmental impact assessments in the future.
See the arguments given in the Intermezzo ‘ Threshold values for the effects
of underwater sound on marine mammals’in Section 2.3.2;
• Effects on behaviour (disturbance/avoidance) probably determine the effects
on populations. On the basis of the arguments described below, the
calculations of the cumulative effects of the construction of several wind
farms in the North Sea no longer take into account any knock-on effects of
TTS and PTS on the population as a whole.
The arguments for disregarding TTS are as follows:
• The calculated TTS onset contours are much smaller than the maximum
avoidance contours, which means that the number of harbour porpoises with
hearing that is temporarily affected is also smaller than the number of
harbour porpoises disturbed;
• On condition that mitigation measures are implemented to prevent PTS (see
below), all the harbour porpoises that may be affected will recover their
hearing in full (with the vast majority of them doing so within a few hours after
leaving the area affected or after piling ceases);TNO report | TNO 2015 R10335-A 22 / 74
• The threshold value adopted for ‘ TTS onset’in harbour porpoises is based on
the results of the experimental exposure of harbour porpoises to airgun
sound by Lucke et al. (2009). This is the sound dose (SELCUM) at which a
temporary increase in the hearing threshold of 6 dB is measured (in other
words, hearing is 6 dB less sensitive). However, it has emerged from the
results of recent research by SEAMARCO that, with recorded piling sound, a
minor TTS of 2.3 – 4 dB can be observed in harbour porpoises at a SELCUM
2
of 180 dB re 1 µPa s [Kastelein et al., 2014]. This value is much higher than
the value assumed in the calculations and this could imply that the effect
areas for TTS are much smaller than those calculated until now, which
2
assume a threshold value for SELCUM of 164 dB re 1 µPa s;
• The frequencies at which TTS can occur in harbour porpoises after exposure
to piling sound are not in the frequency range that is important for finding
food using echo location. In the case of a harbour porpoise exposed to
recorded piling sound, it has emerged that the shift is limited to a relatively
small band of low frequencies [Kastelein et al., 2014]. A statistically
significant TTS was found only at frequencies of 4 kHz and 8 kHz, and not at
the higher measured frequencies (16 kHz and 125 GHz, the echo-location
frequency) and the lower frequency (2 kHz). It is striking that, at frequencies
in which most of the sound energy of the delivered piling sound is located,
namely the 600 – 800 Hz frequency band, there is no TTS. These
observations are important for the assessment of the ecological relevance of
a predicted hearing threshold shift. A temporary shift in the low-frequency
range of the hearing spectrum is probably much less relevant for harbour
porpoises in terms of foraging than it is in the high-frequency range. High-
frequency sounds of about 125 kHz and the audibility of those sounds are
essential in this species for locating prey (using echo location).
As for the possible effects of PTS, it has been assumed that the effects will be
prevented by mitigation measures. At present, this is safeguarded by means of a
regulation in the existing permits. It emerges from the calculations made for various
wind farms that the distance at which harbour porpoises could suffer PTS is
relatively small. This distance is approximately 500 m at an average wind speed
and approximately 1.5 km in windless conditions. At distances of this kind, the effect
can probably be prevented by piling with a ‘ soft start’and by using an ‘
acoustic
12
deterrent device’(ADD) . This will probably drive harbour porpoises away to a
distance outside the PTS contour line. If this were not to be done, one or two
harbour porpoises per driven pile could suffer PTS given the population densities on
the DCS.
2.4 Quantification of the number of affected animals and animal disturbance days
2.4.1 Calculation of the number of harbour porpoises affected by piling sound
It has been assumed in the calculations of the number of animals affected by piling
sound that these are all the animals present inside the contour line where the
threshold value for disturbance/avoidance is exceeded in the lower half of the water
column (worst case scenario). The lower sound levels near the surface have not
been taken into account in the estimate of effect distances in the supposition that
12
Because ADDs produce sound in another frequency range than piling sound, the possibility of
cumulative effects on hearing is negligible.You can also read