Markov models of molecular kinetics: Generation and validation
←
→
Page content transcription
If your browser does not render page correctly, please read the page content below
THE JOURNAL OF CHEMICAL PHYSICS 134, 174105 (2011)

Markov models of molecular kinetics: Generation and validation
          Jan-Hendrik Prinz,1 Hao Wu,1 Marco Sarich,1 Bettina Keller,1 Martin Senne,1
          Martin Held,1 John D. Chodera,2 Christof Schütte,1 and Frank Noé1,a)
          1
           FU Berlin, Arnimallee 6, 14195 Berlin, Germany
          2
           California Institute of Quantitative Biosciences (QB3), University of California, Berkeley, 260J Stanley Hall,
          Berkeley, California 94720, USA
          (Received 4 August 2010; accepted 22 February 2011; published online 4 May 2011)

          Markov state models of molecular kinetics (MSMs), in which the long-time statistical dynamics of
          a molecule is approximated by a Markov chain on a discrete partition of configuration space, have
          seen widespread use in recent years. This approach has many appealing characteristics compared to
          straightforward molecular dynamics simulation and analysis, including the potential to mitigate the
          sampling problem by extracting long-time kinetic information from short trajectories and the ability
          to straightforwardly calculate expectation values and statistical uncertainties of various stationary and
          dynamical molecular observables. In this paper, we summarize the current state of the art in genera-
          tion and validation of MSMs and give some important new results. We describe an upper bound for
          the approximation error made by modeling molecular dynamics with a MSM and we show that this
          error can be made arbitrarily small with surprisingly little effort. In contrast to previous practice, it
          becomes clear that the best MSM is not obtained by the most metastable discretization, but the MSM
          can be much improved if non-metastable states are introduced near the transition states. Moreover, we
          show that it is not necessary to resolve all slow processes by the state space partitioning, but individ-
          ual dynamical processes of interest can be resolved separately. We also present an efficient estimator
          for reversible transition matrices and a robust test to validate that a MSM reproduces the kinetics of
          the molecular dynamics data. © 2011 American Institute of Physics. [doi:10.1063/1.3565032]

I. INTRODUCTION                                                          single molecule experiments) or the ability to resolve het-
                                                                         erogeneity of populations (in ensemble experiments). As a
     Conformational transitions are essential to the function
                                                                         result, molecular dynamics (MD) simulations are becoming
of proteins and nucleic acids. These transitions span large
                                                                         increasingly accepted as a tool to investigate structural de-
ranges of length scales, timescales, and complexity, and
                                                                         tails of molecular processes and relate them to experimentally
include folding,1, 2 complex conformational rearrangements
                                                                         resolved features.21–23
between native protein substates,3, 4 and ligand binding.5
                                                                               Traditionally, MD studies often involved “look and see”
Experiments have borne out the decade-old proposal that
                                                                         analyses of a few rare events via molecular movies. Although
biomolecular kinetics are complex, often involving tran-
                                                                         visually appealing, these analyses may be misleading as they
sitions between a multitude of long-lived, or “metastable”
                                                                         do not supply the statistical relevance of such observations
states on a range of different timescales.6 With the ever
                                                                         in the ensemble, and may miss rare but important events
increasing time resolution of ensemble kinetics experiments
                                                                         altogether. Another frequent approach, especially common in
and the more recent maturation of sensitive single-molecule
                                                                         protein folding analyses, is to project the dynamics onto one
techniques in biophysics, experimental evidence sup-
                                                                         or two user-defined order parameters (such as the root mean
porting the near-universality of the existence of multiple
                                                                         square distance [RMSD] to a single reference structure, ra-
metastable conformational substates and complex kinetics
                                                                         dius of gyration, principal components, or selected distances
in biomolecules has continued to accumulate.7–13 Enzyme
                                                                         or angles) with the notion that these order parameters allow
kinetics has been shown to be modulated by interchanging
                                                                         the slow kinetics of the molecule to be resolved. While the
conformational substates.14 Protein folding experiments have
                                                                         ability to directly visualize the results of such projections
found conformational heterogeneity, hidden intermediates,
                                                                         on chemically intuitive order parameters is appealing, these
and the existence of parallel pathways.15–20
                                                                         projection techniques have been shown to disguise the true
     While laboratory experiments can resolve both fast
                                                                         and often complex nature of the kinetics by artificially
kinetic processes and, in the case of single-molecule exper-
                                                                         aggregating kinetically distinct structures and hiding barriers,
iments, heterogeneity of some of these processes, the obser-
                                                                         thus creating a distorted and often overly simplistic picture
vations are always indirect; only spectroscopically resolvable
                                                                         of the kinetics.24–26
probes can be monitored, and inherent signal-to-noise is-
                                                                               In order to resolve complex kinetic features such as
sues generally require sacrificing either time resolution (in
                                                                         low-populated intermediates, structurally similar metastable
                                                                         states, or structurally distinct parallel pathways, it is essential
a) Author to whom correspondence should be addressed. Electronic mail:
                                                                         to employ analysis techniques that are sensitive to such de-
 frank.noe@fu-berlin.de.
                                                                         tails. While some reduction of high-dimensional biomolecular

0021-9606/2011/134(17)/174105/23/$30.00                          134, 174105-1                           © 2011 American Institute of Physics

        Author complimentary copy. Redistribution subject to AIP license or copyright, see http://jcp.aip.org/jcp/copyright.jsp
174105-2     Prinz et al.                                                                             J. Chem. Phys. 134, 174105 (2011)

dynamics, perhaps obtained from large quantities of MD tra-          model can be used to adaptively guide model construction,
jectory data, is certainly necessary to generate a humanly           reaching the desired statistical precision with much less
understandable analysis, such reduction must be guided by            total effort than would be necessary with a single long
the specific structural or kinetic information in these data,        trajectory.22, 47, 48
rather than by the subjectivity of the analyst. A natural ap-             Finally, computation of statistical quantities of interest
proach toward modeling the kinetics of molecules is by first         from Markov models is straightforward, and includes:
partitioning the conformation space into discrete states.25–35
                                                                          • Time-independent properties such as the stationary, or
Although this step could still disguise information when
                                                                            equilibrium, probability of states or free energy differ-
lumping states that have an important distinction, it is clear
                                                                            ences between states.22, 25, 49
that a “sufficiently fine” partitioning will be able to resolve
                                                                          • Relaxation timescales that can be extracted from ex-
“sufficient” detail.36 Subsequent to partitioning, transition
                                                                            perimental kinetic measurements using various tech-
rates or probabilities between states can be calculated, either
                                                                            niques such as laser-induced temperature jumps, flu-
based on rate theories,4, 27, 37 or based on transitions observed
                                                                            orescence correlation spectroscopy, dynamic neutron
in MD trajectories.24, 26, 34, 35, 38–40 The resulting models are
                                                                            scattering, or NMR.22, 25
often called transition networks, master equation models or
                                                                          • Relaxation functions that can be measured with
Markov (state) models (MSM), where “Markovianity” means
                                                                            nonequilibrium perturbation experiments or correla-
that the kinetics are modeled by a memoryless jump process
                                                                            tion functions that can be obtained from fluctuations
between states.
                                                                            of single molecule equilibrium experiments.22, 45
     This paper focuses on “Markov models” (abbreviated
                                                                          • Transition pathways and their probabilities, e.g., the
here by “MSM”41 ), which model the kinetics with an n × n
                                                                            ensemble of protein folding pathways.22, 50
transition probability matrix that contains the conditional
                                                                          • Statistical uncertainties for all observables.45, 47, 48, 51
probabilities that the system will, given that it is in one of its
                                                                          • The precision and accuracy with which MSMs repro-
n discrete substates, be found in any of these n discrete sub-
                                                                            duce the true kinetics can be tested to verify the mod-
states a fixed time τ later. An essential feature of a MSM is
                                                                            eling error and remains small.22, 52
that it abandons the view of the single trajectories and replaces
it by an ensemble view of the dynamics.42, 43 Consider an ex-              In this paper we summarize the current state of the art of
periment that traces the equilibrium dynamics of an ensemble         theory and methodology for MSM generation and validation,
of molecules starting from a distribution that is out of equilib-    and fill some important methodological gaps.
rium, such as a laser-induced temperature-jump experiment.44               Section II discusses the essential properties of the
Here the sequence of microscopic events occurring during             true full-dimensional continuous dynamics and how these
the trajectory of any individual molecule may be of little rele-     properties may be affected by details of the simulation.
vance, as these individual trajectories all differ in microscopic    Section III examines the effect of discretizing the state space
detail. Instead, the relevant physical details are statistical       to produce a discrete-state Markov chain approximation to
properties of this ensemble: time-dependent averages of spec-        the true dynamics. This is the key numerical approximation
troscopically observable quantities, statistical probabilities       step, and we give a detailed analysis of the error incurred
quantifying with which conformationally similar states are           in doing so, as well as ways this error can be controlled.
populated at certain times and probabilities of how many tra-        Finally, Section IV describes strategies for estimation of
jectories follow similar pathways. All of these statistical prop-    the Markov model with finite quantities of MD simulation
erties can be easily computed from Markov models, as these           data, the statistical step in building a Markov model. Sec-
models already encode the ensemble dynamics.22, 45 At the            tions II and III develop Markov models from a theoretical
same time, because it is sometimes helpful in aiding the devel-      perspective, and practitioners may wish to skip directly to
opment of human intuition, individual realizations of almost         Sec. IV, where generation and validation of Markov models
arbitrary length can be easily obtained, simply by generating        from actual trajectory data are discussed.
a random state sequence according to the MSM transition                    The main novelty of the present study is a detailed analy-
probabilities.                                                       sis of the discretization error (Sec. III), i.e., the effect of lump-
     Because only conditional transition probabilities be-           ing state space points into discrete sets on the accuracy of re-
tween discretized states are needed to construct a Markov            producing quantities of the original continuous dynamics. We
model, the computational burden can be divided among many            give quantitative upper bounds for the approximation error of
processors using loosely coupled parallelism, facilitating a         the time evolution and the relaxation timescales of the slow
“divide and conquer” approach. Trajectories used to estimate         dynamical processes. It is shown that this error can be made
these transition probabilities only need to be long enough           arbitrarily small with surprisingly little effort. In contrast to
to reach local equilibrium within the discrete state, rather         previous practice,38–40, 52 it is seen that the best MSM, in the
than exceed global equilibrium relaxation times that may be          sense of minimizing this discretization error, is not obtained
orders of magnitude longer. In other words, the dependency           by the most metastable discretization; instead the accuracy of
between simulation length and molecular timescales is                the MSM can be improved if nonmetastable states are intro-
largely lost; microsecond- or millisecond-timescale processes        duced near the transition states. Moreover, it is shown that
can be accurately modeled despite the model having been              it is not necessary to resolve all slow processes by the state
constructed from trajectories orders of magnitude shorter.22, 46     space partitioning, but individual dynamical processes of in-
Moreover, assessment of the statistical uncertainty of the           terest can be described separately. These insights provide a

       Author complimentary copy. Redistribution subject to AIP license or copyright, see http://jcp.aip.org/jcp/copyright.jsp
174105-3     Markov models: Generation and Validation                                               J. Chem. Phys. 134, 174105 (2011)

theoretical basis for the development of efficient adaptive dis-          time-discrete dynamics with time step t), is cal-
cretization methods for MSMs.                                             culated based on x(t) alone and does not require the
     Additionally, we provide a new estimator for transition              previous history. As a result of Markovianity in , the
matrices for reversible dynamics, i.e., Markov models that                transition probability density p(x, y; τ ) is well defined:
fulfill detailed balance, which is more efficient than the
reversible estimators presented previously.49, 51, 53 Detailed                p(x, y; τ ) dy = P [x(t + τ ) ∈ y + dy | x(t) = x]
balance is expected for molecular processes taking place in                                  x, y ∈ , τ ∈ R0+ ,                   (1)
thermal equilibrium54 and using this property in the estima-
tion of MSMs will generally enhance the model quality as                  i.e., the probability that a trajectory started at time
unphysical models are excluded. Finally, we take up the topic             t from the point x ∈  will be in an infinitesimal
of validating MSMs. Several past studies have attempted to                region dy around a point y ∈  at time t + τ . Such a
find robust tests for the “Markovianity” of the true dynamics             transition probability density for the diffusion process
projected onto the discrete state space,40, 55 a concept which            in a one-dimensional potential is depicted in Fig. 1(b).
has been proven problematic both formally and practically.                When p(x, y; τ ) is a smooth probability density the
Here, we instead suggest a simple and robust direct test of               stochastic transition probability to a set A ⊆  is also
the error of the model in reproducing the observed dynamics.              well defined and formally given by integrating the
                                                                          transition probability density over region A:

II. ANALYSIS OF THE CONTINUOUS DYNAMICS                                            p(x, A; τ ) = P [x(t + τ ) ∈ A|x(t) = x]

     This section reviews the continuous dynamics of a molec-                                  =      dy p(x, y; τ ).              (2)
ular system in thermal equilibrium, and introduces the dynam-                                      y∈A
ical propagator, whose approximation is our primary concern.
While this section is important for understanding the subse-         2. x(t) is ergodic, i.e., the space  does not have two or
quent formal theory of discretization (Sec. III), practitioners         more subsets that are dynamically disconnected, and
wishing only to learn how to construct such models may                  for t → ∞ each state x will be visited infinitely often.
skip directly to the discussion of Markov model estimation              The fraction of time that the system spends in any of
(Sec. IV).                                                              its states during an infinitely long trajectory is given
                                                                        by its unique stationary density (invariant measure)
                                                                        μ(x) :  → R0+ that corresponds to the equilibrium
A. Continuous dynamics                                                  probability density for some associated thermodynamic
     A variety of simulation models that all yield the same             ensemble (e.g., NVT, NpT). For molecular dynamics
stationary properties, but have different dynamical behaviors,          at constant temperature T , the dynamics above yield a
are available to study a given molecular model. The choice              stationary density μ(x) that is a function of T , namely,
of the dynamical model must therefore be guided by both a               the Boltzmann distribution
desire to mimic the relevant physics for the system of interest                        μ(x) = Z (β)−1 exp (−β H (x)) ,             (3)
(such as whether the system is allowed to exchange energy
with an external heat bath during the course of dynamical               with Hamiltonian H (x) and β = 1/k B T where k B is
evolution), balanced with computational convenience (e.g.,              the Boltzmann    constant and k B T is the thermal energy.

the use of a stochastic thermostat in place of explicitly               Z (β) = dx exp (−β H (x)) is the partition function.
simulating a large external reservoir).56 Going into the details        By means of illustration, Fig. 1(a) shows the stationary
of these models is beyond the scope of the present study, and           density μ(x) for a diffusion process on a potential with
therefore we will simply state the minimal physical properties          high barriers.
that we expect the dynamical model to obey.                          3. x(t) is reversible, i.e., p(x, y; τ ) fulfills the condition of
     Consider a state space  which contains all dynamical              detailed balance:
variables needed to describe the instantaneous state of the
system.  may be discrete or continuous, and we treat the                             μ(x) p(x, y; τ ) = μ(y) p(y, x; τ ),         (4)
more general continuous case here. For molecular systems,
                                                                          i.e., in equilibrium, the fraction of systems transition-
usually contains both positions and velocities of the species
                                                                          ing from x to y per time is the same as the fraction
of interest and surrounding bath particles. x(t) ∈  will de-
                                                                          of systems transitioning from y to x. Note that this
note the dynamical process considered, which is continuous
                                                                          “reversibility” is a more general concept than the
in space, and may be either time-continuous (for theoreti-
                                                                          time-reversibility of the dynamical equations, e.g.,
cal investigations) or time-discrete (when considering time-
                                                                          encountered in Hamiltonian dynamics. For example,
stepping schemes for computational purposes). For the rest
                                                                          Brownian dynamics on some potential are reversible
of the paper, we will assume that x(t) has the following
                                                                          as they fulfill Eq. (4), but are not time-reversible in
properties:
                                                                          the same sense as Hamiltonian dynamics are, due to
 1. x(t) is a Markov process in the full state space , i.e.,             the stochasticity of individual realizations. Although
    the instantaneous change of the system (dx(t)/dt                      detailed balance is not essential for the construction of
    in time-continuous dynamics and x(t + t) in                          Markov models, we will subsequently assume detailed

       Author complimentary copy. Redistribution subject to AIP license or copyright, see http://jcp.aip.org/jcp/copyright.jsp
174105-4 Prinz et al. J. Chem. Phys. 134, 174105 (2011)
(a) (b)
(c) (d)
(e)
FIG. 1. (a) Potential energy function with four metastable states and corresponding stationary density μ(x). (b) Density plot of the transfer operator for a simple
diffusion-in-potential dynamics defined on the range = [1, 100] [see supplementary material (Ref. 65)], black and red indicates high transition probability,
white zero transition probability. Of particular interest is the nearly block-diagonal structure, where the transition density is large within blocks allowing rapid
transitions within metastable basins, and small or nearly zero for jumps between different metastable basins. (c) The four dominant eigenfunctions of the
transfer operator, ψ1 , . . . , ψ4 , which indicate the associated dynamical processes. The first eigenfunction is associated with the stationary process, the second to
a transition between A + B ↔ C + D, and the third and fourth eigenfunction to transitions between A ↔ B and C ↔ D, respectively. (d) The four dominant
eigenfunctions of the transfer operator weighted with the stationary density, φ1 , . . . , φ4 . (e) Eigenvalues of the transfer operator, the gap between the four
metastable processes (λi ≈ 1) and the fast processes is clearly visible.
balance as this allows much more profound analytical law of thermodynamics. Thus, equilibrium molecular
statements to be made. The rationale is that we expect dynamics must be reversible and fulfill detailed balance.
detailed balance to be fulfilled in equilibrium molecular
dynamics based on a simple physical argument: for The above conditions do not place overly burdensome restric-
dynamics that have no detailed balance, there exists a tions on the choice of dynamical model used to describe equi-
set of states which form a loop in state space which is librium dynamics. Most stochastic thermostats are consis-
traversed in one direction with higher probability than in tent with the above assumptions, e.g., Andersen57 (which can
the other direction. This means that one could design a be employed with either massive or per-particle collisions,
machine which uses this preference of direction in order or coupled to only a subset of degrees of freedom), Hybrid
to produce work. However, a system in equilibrium Monte Carlo,58 overdamped Langevin (also called Brownian
is driven only by thermal energy, and conversion of or Smoluchowski) dynamics,59, 60 and stepwise-thermalized
pure thermal energy into work contradicts the second Hamiltonian dynamics.40 When simulating solvated systems,
Author complimentary copy. Redistribution subject to AIP license or copyright, see http://jcp.aip.org/jcp/copyright.jsp174105-5 Markov models: Generation and Validation J. Chem. Phys. 134, 174105 (2011)
a weak friction or collision rate can be used; this can often be factor of the stationary density μ(x), i.e.,
selected in a manner that is physically motivated by the heat
pt (x) = μ(x)u t (x). (7)
conductivity of the material of interest and the system size.57
We note that the use of finite-timestep integrators for The relationship between the two densities and operators is
these models of dynamics can sometimes be problematic, as shown in the scheme below:
the phase space density sampled can differ from the density Q(τ )
desired. Generally, integrators based on symplectic Hamilto- pt −→ pt+τ probability densities
nian integrators (such as velocity Verlet61 ) offer greater sta- ↓ ·μ−1 ↑ ·μ
T (τ )
bility for our purposes. ut −→ u t+τ densities in μ-weighted space.
While technically, a Markov model analysis can be con-
Alternatively to Q and T which describe the transport of
structed for any choice of dynamical model, it must be noted
densities exactly by a chosen time-discretization τ , one could
that several popular dynamical schemes violate the assump-
investigate the density transport with a time-continuous
tions above, and using them means that one is (currently) do-
operator L called the generator which is the continuous
ing so without a solid theoretical basis, e.g., regarding the
basis of rate matrices that are frequently used in physical
boundedness of the discretization error analyzed in Sec. III
chemistry31, 64 and is related to the Fokker–Planck equation.54
below. For example, Nosé-Hoover and Berendsen are either
Here, we do not investigate L in detail, but describe some of
not ergodic or do not generate the correct stationary distri-
its basic properties in the supplementary material.65
bution for the desired ensemble.62 Energy-conserving Hamil-
Equation (6) is a formal definition. When the particular
tonian dynamics, even when considering a set of trajectories
kind of dynamics is known it can be written in a more spe-
that are in initial contact with a heat bath, is not ergodic and
cific form.42 However, the general form (6) is sufficient for
therefore has no unique stationary distribution. While it is
the present analysis. The continuous operators have the fol-
possible that future work will extend the present theoretical
lowing general properties:
analysis to these and other models of dynamics, we currently
advise practitioners to choose a model which unambiguously
• Both Q(τ ) and T (τ ) fulfill the Chapman–Kolmogorov
fulfills these conditions, yet provides physically reasonable
equation
kinetics.
pt+kτ (x) = [Q(τ )]k ◦ pt (x), (8)
B. Transfer operator approach and the u t+kτ (x) = [T (τ )]k ◦ u t (x), (9)
dominant spectrum
where [T (τ )]k refers to the k-fold application of the
At this point we shift from focusing on the evolution of operator, i.e., Q(τ ) and T (τ ) can be used to propagate
individual trajectories to the time evolution of an ensemble the evolution of the dynamics to arbitrarily long times
density. Consider an ensemble of molecular systems at a point t + kτ .
in time t, distributed in state space according to a proba- • Q(τ ) has eigenfunctions φi (x) and associated eigenval-
bility density pt (x) that is different from the stationary den- ues λi [see Figs. 1(c) and 1(e)]:
sity μ(x). If we now wait for some time τ , the probability
distribution of the ensemble will have changed because each Q(τ ) ◦ φi (x) = λi φi (x), (10)
system copy undergoes transitions in state space according
while T (τ ) has eigenfunctions ψi (x) with the same
to the transition probability density p(x, y; τ ). The change of
corresponding eigenvalues:
the probability density pt (x) to pt+τ (x) can be described with
the action of a continuous operator. From a physical point of T (τ ) ◦ ψi (x) = λi ψi (x). (11)
view, it seems straightforward to define the propagator Q(τ )
as follows:
• When the dynamics are reversible, all eigenvalues λi
are real-valued and lie in the interval −1 < λi ≤ 142 .
pt+τ (y) = Q(τ ) ◦ pt (y) = dx p(x, y; τ ) pt (x). (5)
x∈ Moreover, the two types of eigenfunctions are related
by a factor of the stationary density μ(x):
Applying Q(τ ) to a probability density pt (x) will result in a
modified probability density pt+τ (x) that is more similar to φi (x) = μ(x)ψi (x), (12)
the stationary density μ(x), to which the ensemble must relax and their lengths are defined by the normalization con-
after infinite time. An equivalent description is provided by dition that the scalar product (see Table I) is unity for
the transfer operator T (τ ),42 which has nicer properties from all corresponding eigenfunctions: φi , ψi = 1 for all
a mathematical point of view. T (τ ) is defined as63 : i = 1, . . . , m (see Table I for definition of scalar prod-
uct). Due to reversibility, noncorresponding eigenfunc-
1
u t+τ (y) = T (τ ) ◦ u t (y) = dx p(x, y; τ ) μ(x) u t (x). tions are orthogonal: φi , ψ j = 0 for all i = j. When
μ(y) x∈
T (τ ) is approximated by a reversible transition matrix
(6)
on a discrete state space, φi (x) and ψi (x) are approxi-
T (τ ) does not propagate probability densities, but instead mated by the left and right eigenvectors of that transi-
functions u t (x) that differ from probability densities by a tion matrix, respectively [compare Figs. 1(c) and 1(d)].
Author complimentary copy. Redistribution subject to AIP license or copyright, see http://jcp.aip.org/jcp/copyright.jsp174105-6 Prinz et al. J. Chem. Phys. 134, 174105 (2011)
TABLE I. Important symbols. yields
Symbol Meaning u t+kτ (x) = Tslow (kτ ) ◦ u t (x) + Tfast (kτ ) ◦ u t (x), (15)
Continuous state space (positions and momenta)
x(t) Continuous state in (positions and momenta) at time t
μ(x) Continuous (in state space) stationary density of x.
m
p(x) Continuous (in state space) probability density. = λik u t , φi ψi (x) + Tfast (kτ ) ◦ u t (x), (16)
τ Lag time, time resolution of the model. i=1
p(x, y; τ ) Transition probability density to y ∈ after time τ given
the system in x ∈ .
m
T (τ ) Transfer operator, propagates the continuous dynamics = λik u t , ψi ψi (x) + Tfast (kτ ) ◦ u t (x). (17)
μ
for a time τ .
i=1
m Number of dominant eigenfunctions/eigenvalues
considered. Here, Tslow is the dominant, or slowly decaying part consist-
ψ(x) Eigenfunctions of T (τ ). ing of the m slowest processes with λi ≥ λm , while Tfast con-
φ(x) Density-weighted eigenfunctions of T (τ ). tains all (infinitely many) fast processes with λi < λm that
χi (x) Degree of membership of x to discrete state i. are usually not of interest. The weighted scalar product ap-
S1 , . . . , Sn Discrete sets which partition state space . pearing above is defined in Table I. This decomposition re-
μi (x) Local stationary density restricted to discrete state i.
quires that subspaces Tslow and Tfast are orthogonal, which is
f, g Scalar product f, g = f (x) g(x) dx.
a consequence of detailed balance. This decomposition per-
f, g μ Weighted scalar product f, g μ = μ(x) f (x) g(x) dx.
n Number of discrete states.
mits a compelling physical interpretation: the slow dynamics
π Discrete stationary density in Rn . are a superposition of dynamical processes, each of which can
p(t) Discrete probability vector in Rn at time t. be associated with one eigenfunction ψi (or φi ) and a corre-
C(τ ) Transition count matrix (row-dominant) in Rn×n , sponding eigenvalue λi [see Figs. 1(c)–1(e)]. These processes
elements ci j (τ ) count the number of i → j transitions decay faster with increasing time index k. In the long-time
during lag time τ . limit where k → ∞, only the first term with λ1 = 1 remains,
T(τ ) Discrete transition matrix (row-stochastic) in Rn×n , recovering the stationary distribution φ1 (x) = μ(x). All other
elements Ti j (τ ) give the i → j transition probability
during lag time τ .
terms correspond to processes with eigenvalues λi < 1 and
T̂(τ ) Estimate of T(τ ) from trajectory data. decay over time, thus the associated eigenfunctions corre-
ψi ith right eigenvector of T(τ ) in Rn . spond processes that decay under the action of the dynam-
φi ith left eigenvector of T(τ ) in Rn . ics and represent the dynamical rearrangements taking place
while the ensemble relaxes toward the equilibrium distribu-
tion. The closer λi is to 1, the slower the corresponding
process decays; conversely, the closer it is to 0, the faster.
Thus the λi for i = 2, . . . , m each corresponds to a phys-
• Since both operators are continuous, they possess
ical timescale, indicating how quickly the process decays or
a continuous spectrum of eigenvalues. By conven-
transports density toward equilibrium [see Fig. 1(e)]:
tion, we only distinguish a finite number of m dom-
τ
inant eigenvalue/eigenfunction pairs and sort them ti = − , (18)
by nonascending eigenvalue, i.e., λ1 = 1 > λ2 ≥ λ3 ln λi
≥ · · · ≥ λm , while the remainder of the spectrum is which is often called the ith implied timescale.40 Thus,
confined within in a ball of radius r ≤ λm centered Eq. (15) can be rewritten in terms of implied timescales as:
on 0.
There is one eigenvalue λ1 = 1 that has the greatest
m
kτ
norm (i.e., it is simple and dominant). The associated u t+kτ (x) = 1 + exp − u t , ψi μ ψi (x)
eigenfunction corresponds to the stationary distribu- i=2
ti
tion μ(x) [see Fig. 1(d), top]:
+ Tfast (kτ ) ◦ u t (x). (19)
Q(τ ) ◦ μ(x) = μ(x) = φ1 (x), (13) This implies that when there are gaps among the first
m eigenvalues, the system has dynamical processes acting
and the corresponding eigenfunction of T (τ ) is a con- simultaneously on different timescales. For example, a sys-
stant function on all state space [see Fig. 1(c), top]: tem with two-state kinetics would have λ1 = 1, λ2 ≈ 1 and
λ3 λ2 (t3 t2 ), while a system with a clear involvement
of an additional kinetic intermediate would have λ3 ∼ λ2
T (τ ) ◦ 1 = 1 = ψ1 (x), (14) (t3 ∼ t2 ).
In Fig. 1, the second process, ψ2 , corresponds to the slow
due to the relationship φ1 (x) = μ(x)ψ1 (x) = μ(x).
(λ2 = 0.9944) exchange between basins A + B and basins
To see the significance of the other eigenvalue/eigenfunc- C + D, as reflected by the opposite signs of the elements of ψ2
tion pairs, we exploit that the dynamics can be decomposed in these regions [Fig. 1(c)]. The next-slowest processes are the
exactly into a superposition of m individual slow dynami- A↔B transition and then the C↔D transition, while the sub-
cal processes and the remaining fast processes. For T (τ ), this sequent eigenvalues are clearly separated from the dominant
Author complimentary copy. Redistribution subject to AIP license or copyright, see http://jcp.aip.org/jcp/copyright.jsp174105-7 Markov models: Generation and Validation J. Chem. Phys. 134, 174105 (2011)
spectrum and correspond to much faster local diffusion pro- in accurately describing the relaxation kinetics, even for very
cesses. The three slowest processes effectively partition the large and complex molecular systems.
dynamics into four metastable states corresponding to basins In practical use, the Markov model is not obtained by
A, B, C, and D, which are indicated by the different sign struc- actually discretizing the continuous propagator. Rather, one
tures of the eigenfunctions [Fig. 1(c)]. The metastable states defines a discretization of state space and then estimates
can be calculated from the eigenfunction structure, e.g., using the corresponding discretized transfer operator from a finite
the Perron Cluster Cluster Analysis (PCCA) method.30, 38 quantity of simulation data, such as several long or many
Of special interest is the slowest relaxation time, t2 . This short MD trajectories that transition between the discrete
timescale identifies the worst case global equilibration or states. The statistical estimation error involved in this estima-
decorrelation time of the system; no structural observable can tion will be discussed in Sec. IV; the current section focuses
relax more slowly than this timescale. Thus, if one desires only on the approximation error due to discretization of the
to calculate an expectation value E[a] of an observable a(x) transfer operator.
which has a non-negligible overlap with the second eigen-
function, a, ψ2 > 0, a straightforward single-run MD tra-
A. Discretization of state space
jectory would need to be many times t2 in length in order to
compute an unbiased estimate of E[a]. Here we consider a discretization of state space into
n sets. In practice, this discretization is often a simple parti-
tion with sharp boundaries, but in some cases it may be de-
III. DISCRETIZATION AND DISCRETIZATION ERROR sirable to discretize into fuzzy sets.66 We can describe both
cases by defining membership functions χi (x) that quantify
While molecular dynamics in full continuous state space the probability of point
n x to belong to set i (Ref. 43) which
is Markovian by construction, the term Markov model is have the property i=1 χi (x) = 1. In the present study we
due to the fact that in practice, state space must be somehow will concentrate on a crisp partitioning with step functions:
discretized in order to obtain a computationally tractable de-
scription of the dynamics. The Markov model then consists of crisp 1 x ∈ Si
χi (x) = χi (x) = . (20)
the partitioning of state space used together with the transition 0 x∈ / Si
matrix modeling the jump process of the observed trajectory
projected onto these discrete states. However, this jump pro- Here we have used n sets S = {S1 , . . . , Sn } which entirely
n
cess (Fig. 2) is no longer Markovian, as the information where partition state space ( i=1 Si = ) and have no overlap (Si
the continuous process would be within the local discrete state ∩ S j = ∅ for all i = j). A typical example of such a crisp
is lost in the course of discretization. Modeling the long-time partitioning is a Voronoi tessellation,67 where one defines n
statistics of this jump process with a Markov process is an centers x̄i , i = 1, . . . , n, and set Si is the union of all points
approximation, i.e., it involves a discretization error. In the x ∈ which are closer to x̄i than to any other center using
current section, this discretization error is analyzed and it is some distance metric [illustrated in Figs. 3(b) and 3(c)]. Note
shown what needs to be done in order to keep it small. that such a discretization may be restricted to some subset of
The discretization error is a systematic error of a Markov the degrees of freedom, e.g., in MD one often ignores veloci-
model since it causes a deterministic deviation of the Markov ties and solvent coordinates when discretizing.
model dynamics from the true dynamics that persists even The stationary probability πi to be in set i is then given
when the statistical error is excluded by excessive sampling. in terms of the full stationary density as:
In order to focus on this effect alone, it is assumed in this sec-
πi = dx μ(x),
tion that the statistical estimation error is zero, i.e., transition x∈Si
probabilities between discrete states can be calculated exactly.
and the local stationary density μi (x) restricted to set i [see
The results suggest that the discretization error of a Markov
Fig. 3(b)] is given by
model can be made small enough for the MSM to be useful ⎧ μ(x)
⎨ πi x ∈ Si
μi (x) = . (21)
⎩
0 x∈/ Si
2
3 7 Ω
4 5
1 These properties are local, i.e., they do not require informa-
6
tion about the full state space.
projection
state
7
6 B. Transition matrix
5
4 Together with the discretization, the Markov model is
3
2 defined by the row-stochastic transition probability matrix,
1 time T(τ ) ∈ Rn×n , which is the discrete approximation of the
transfer operator described in Sec. II B via
FIG. 2. Scheme: The true continuous dynamics (dashed line) is projected
onto the discrete state space. MSMs approximate the resulting jump process χ j , (T (τ ) ◦ χi ) μ
Ti j (τ ) = .
by a Markov jump process. χi , χi μ
Author complimentary copy. Redistribution subject to AIP license or copyright, see http://jcp.aip.org/jcp/copyright.jsp174105-8 Prinz et al. J. Chem. Phys. 134, 174105 (2011)
Potential
10 Stationary distribution μ(x)
energy/density
5 30
0 25
–5 20
(a)
15
2 μ1(x)
Partition/density
μ2(x) 10
1.5
5
1
0.5 5 10 15 20 25 30
(c)
0
0 20 40 60 80 100
(b) x (arbitrary units)
FIG. 3. Crisp state space discretization illustrated on a one-dimensional two-well and a two-dimensional three-well potential [see supplementary material for
details of potential and dynamics (Ref. 65)]. (a) Two-well potential (black) and stationary distribution μ(x) (red). (b) Characteristic functions v 1 (x) = χ1 (x),
v 2 (x) = χ2 (x) (black and red). This discretization has the corresponding local densities μ1 (x), μ2 (x) (blue and yellow), see Eq. (21). (c) Three-well potential
(black contours indicate the isopotential lines) with a crisp partitioning into three states using a Voronoi partition with the centers denoted (+).
Physically, each element Ti j (τ ) represents the time-stationary from the right while the probability densities pt [Eq. (7)] cor-
probability to find the system in state j at time t + τ given respond to row vectors that are multiplied to the matrix from
that it was in state i at time t. By definition of the conditional the left. Suppose that p(t) ∈ Rn is a column vector whose el-
probability, this is equal to ements denote the probability, or population, to be within any
set j ∈ {1, . . . , n} at time t. After time τ , the probabilities will
Ti j (τ ) = P [x(t + τ ) ∈ S j | x(t) ∈ Si ] (22) have changed according to
n
P [x(t + τ ) ∈ S j ∩ x(t) ∈ Si ] p j (t + τ ) = pi (t)Ti j (τ ), (26)
= (23)
P [x(t) ∈ Si ] i=1
or in matrix form
dx μi (x) p(x, S j ; τ ) pT (t + τ ) = pT (t) T(τ ). (27)
=
x∈Si
, (24)
x∈Si dx μi (x) Note that an alternative convention often used in the literature
where we have used Eq. (2). Note that in this case the is to write T(τ ) as a column-stochastic matrix, obtained by
integrals run over individual sets and only need the local taking the transpose of the row-stochastic transition matrix
equilibrium distributions μi (x) as weights. This is a very defined here.
powerful feature: in order to estimate transition probabilities, The stationary probabilities of discrete states, πi , yield
we do not need any information about the global equilibrium the unique discrete stationary distribution of T for any τ :
distribution of the system, and the dynamical information π T = π T T(τ ). (28)
needed extends only over time τ . In principle, the full
dynamical information of the discretized system can be All equations encountered so far are free of approximation.
obtained by initiating trajectories of length τ out of each state We wish now to model the system kinetics of long times by
i as long as we draw the starting points of these simulations approximating the true dynamics with a Markov chain on the
from a local equilibrium density μi (x).42, 43, 68 space of n states. Using T(τ ) as a Markov model predicts that
The transition matrix can also be written in terms of cor- for later times, t + kτ , the probability distribution will evolve
relation functions:40 as
E[χi (x(t)) χ j (x(t + τ ))] cicorr
j (τ ) pT (t + kτ ) ≈ pT (t)Tk (τ ), (29)
Ti j (τ ) = = , (25)
E[χi (x(t))] πi
which can only approximate the true distribution p(t + kτ )
where the unconditional transition probability cicorr j (τ ) that would have been produced by the continuous transfer
= πi Ti j (τ ) is an equilibrium
time correlation function which operator, as Eq. (29) is the result of a state space discretiza-
is normalized such that i, j cicorrj (τ ) = 1. For dynamics ful- tion. The discretization error involved in this approximation
filling detailed balance, the correlation matrix is symmetric thus depends on how this discretization is chosen and is ana-
j (τ ) = c ji (τ )].
[cicorr corr
lyzed in detail below. A description alternative to that of tran-
Since the transition matrix T(τ ) is a discretization of the sition matrices quite common in chemical physics is using
transfer operator T (Refs. 36, 42, and 63; Sec. II B), we can rate matrices and master equations.31, 64, 69, 70 The relationship
relate the functions that are transported by T [functions u t in between this and the current approach is discussed in the Sup-
Eq. (6)] to column vectors that are multiplied to the matrix plementary Information.65
Author complimentary copy. Redistribution subject to AIP license or copyright, see http://jcp.aip.org/jcp/copyright.jsp174105-9 Markov models: Generation and Validation J. Chem. Phys. 134, 174105 (2011)
C. Discretization error and non-Markovianity degrees of freedom and discretization of the resolved degrees
of freedom. Markov models typically only use atom positions,
The Markov model T(τ ) is indeed a model in the sense
thus the velocities are projected out.38, 39 So far, Markov mod-
that it only approximates the long-time dynamics based
els have also neglected solvent degrees of freedom and have
on a discretization of state space, making the dynamical
only used the solute coordinates,22, 39 and the effect of this was
equation (29) approximate. Here we analyze the approxima-
studied in detail.71 Indeed, it may be necessary to incorporate
tion quality of Markov models in detail and obtain a descrip-
solvent coordinates in situations where the solvent molecules
tion that reveals which properties the state space discretization
are involved in slow processes that are not easily detected in
and the lag time τ must fulfill in order to obtain a good model.
the solute coordinates.72 Often, Markov models are also based
Previous works have mainly discussed the quality of a
on distance metrics that only involve a subset of the solute
Markov model in terms of its “Markovianity” and introduced
atoms, such as RMSD between heavy atom or alpha carbon
tests of Markovianity of the process x(t) projected onto the
coordinates,22, 39, 49 or backbone dihedral angles.31, 38 Possibly
discrete state space. The space-continuous dynamics x(t) de-
the strongest approximation is caused by clustering or lump-
scribed in Sec. II is, by definition, Markovian in full state
ing sets of coordinates in the selected coordinate subspace
space and it can thus be exactly described by a linear op-
into discrete states.22, 31, 39, 49, 73 Formally, all of these opera-
erator, such as the transfer operator T (τ ) defined in Eq. (6).
tions aggregate sets of points in continuous state space into
The problem lies in the fact that by performing a state space
discrete states, and the question to be addressed is what is the
discretization, continuous states x ∈ are grouped into dis-
magnitude of the discretization error caused by treating the
crete states si (Sec. III A), thus “erasing” information of the
non-Markovian jump process between these sets as a Markov
exact location within these states and “projecting” a contin-
chain.
uous trajectory x(t) onto a discrete trajectory s(t) = s(x(t)).
Consider the diffusive dynamics model depicted in
This jump process, s(t), is not Markovian, but Markov mod-
Fig. 4(a) and let us follow the evolution of the dynamics given
els attempt to approximate s(t) with a Markov chain.
that we start from a local equilibrium in basin A [Fig. 4(b)],
Thus, non-Markovianity occurs when the full state space
either with the exact dynamics, or with the Markov model
resolution is reduced by mapping the continuous dynamics
dynamics on the discrete state space A and B. After a step
onto a reduced space. In Markov models of molecular dy-
τ , both dynamics have transported a fraction of 0.1 of the
namics, this reduction consists usually of both, neglect of
(a) 4 4 (e)
Energy (kT)
Energy (kT)
2 2
0 0
–2 –2
–4 A B –4 A B
–6 –6
0 20 40 60 80 100 0 20 40 60 80 100
(b) 0.05 0.05 (f)
0.04 0.04
0.03 0.03
p0
p0
0.02 1 0 0.02 1 0
0.01 0.01
0 0
0 20 40 60 80 100 0 20 40 60 80 100
(c) 0.05 0.05 (g)
0.04 0.04
p250, MSM
p250, exact
0.03 0.03
0.02 0.95 0.05 0.02 0.95 0.05
0.01 0.01
0 0
0 20 40 60 80 100 0 20 40 60 80 100
(d) 0.05 0.05 (h)
0.04 0.04
p500, exact
p50, MSM
0.03 0.03
0.02 0.912 0.088 0.02 0.905 0.095
0.01 0.01
0 0
0 20 40 60 80 100 0 20 40 60 80 100
x x
FIG. 4. Illustration of the discretization error by comparing the dynamics of the diffusion in a double-well potential (a, e) [see supplementary material for setup
(Ref. 65)] at time steps 0 (b), 250 (c), 500 (d) with the predictions of a Markov model parameterized with a too short lag time τ = 250 at the corresponding
times 0 (f), 250 (g), 500 (h). (b, c, d) show the true density pt (x) (solid black line) and the probabilities associated with the two discrete states left and right
of the dashed line. The numbers in (f, g, h) are the discrete state probabilities pi (t + kτ ) predicted by the Markov model while the solid black line shows the
hypothetical density pi (t + kτ )μi (x) that inherently assumed by the Markov model by using the discrete state probabilities to correspondingly weight the local
stationary densities.
Author complimentary copy. Redistribution subject to AIP license or copyright, see http://jcp.aip.org/jcp/copyright.jsp174105-10 Prinz et al. J. Chem. Phys. 134, 174105 (2011)
ensemble to B. The true dynamics resolves the fact that much projected onto discrete states, Qp0 (x), then transport this den-
of this is still located near the saddle point [Fig. 4(c)]. The sity either with the true or with the Markov model dynamics
Markov model cannot resolve local densities within its dis- for some time kτ . Subsequently, the densities are again pro-
crete states, which is equivalent to assuming that for the next jected onto discrete states by Q and then compared:
step the ensemble has already equilibrated within the dis-
• The true dynamics transports the initial density Qp0 (x)
crete state [Fig. 4(g)]. This difference affects the discrete state
to [T (τ )]k Qp0 (x).
(basin) probabilities at time 2τ : in the true dynamics, a signif-
• The Markov model dynamics transports the initial
icant part of the 0.1 fraction can cross back to A as it is still
density Qp0 (x) to QT (τ )Qp0 (x) in one step and to
near the saddle point, while this is not the case in the Markov
Q[T (τ )Q]k p0 (x) in k steps using the identity for pro-
model where the 0.1 fraction is assumed to be relaxed to states
jections Q ◦ Q = Q.
mostly around the minimum [compare Fig. 4(d) and (h)]. As a
• Projecting both densities to local densities and com-
result, the probability to be in state B is higher in the Markov
paring yields the difference
model than in the true dynamics. The difference between the
Markov model dynamics and the true dynamics is thus a result (k) = Q[T (τ )]k Qp0 (x) − Q[T (τ )Q]k p0 (x) μ,2
of discretization, because the discretized model can no longer
resolve deviations from local equilibrium density μi (x) within = [Q[T (τ )]k Q − Q[T (τ )Q]k ] p0 (x) μ,2
. (33)
the discrete state.
This picture suggests the discretization error to have two
properties: (a) the finer the discretization, the smaller the In order to remove the dependency on the initial dis-
discretization error is, and (b) when increasing the coarse- tribution p0 (x), we assume the worst case: the maximum
graining time, or time resolution, of our model, τ , the er- possible value of (k) among all possible p0 (x) is given
rors for any fixed point in time t should diminish, because by the operator-2-norm of the error matrix [Q[T (τ )]k Q
we have less often made the approximation of imposing local − Q[T (τ )Q]k ], where Aμ,2 ≡ max Axμ,2 (Ref. 74),
x=1
equilibrium. thus the Markov model error is defined as:
E(k) := Q[T (τ )]k Q − Q[T (τ )Q]k μ,2
, (34)
D. Quantifying the discretization error
which measures the maximum possible difference between
Figure 4 also suggests a practical measure to quan-
the true probability density at time kτ and the probability den-
tify the discretization error. Densities, eigenfunctions, or any
sity predicted by the Markov model at the same time.
other function f (x) of the continuous state x, are approx-
In order to quantify this error, we declare our explicit
imated through the discretization S1 , . . . , Sn . Let Q be the
interest in the m slowest processes with eigenvalues 1 = λ1
projection onto the discretization basis which produces this
< λ2 ≤ λ3 ≤ · · · ≤ λm . Generally, m ≤ n, i.e., we are inter-
approximation fˆ(x):
ested in less processes than the number of n eigenvectors that
n
a Markov model with n states has. We define the following
fˆ(x) = Q f (x) = ai χi (x), (30) quantities:
i=1
• δi := ψi (x) − Qψi (x)μ,2 is the eigenfunction ap-
where the coefficients are given by the projection weighted by
proximation error, quantifying the error of approxi-
the probability of each state:
mating the true continuous eigenfunctions of the trans-
f, χi μ S dx μ(x) f (x) fer operator, ψi (see Fig. 5 for illustration), for all
ai = = i . (31) i ∈ {1, . . . , m}.
1, χi μ Si dx μ(x)
• δ := maxi δi is the largest approximation error among
In the case of a crisp partitioning of state space, functions these first m eigenfunctions.
f (x) are approximated by step functions that are constant • η(τ ) := λm+1 (τ )
λ2 (τ )
is the spectral error, the error due
within the discrete states. The approximation error that is to neglecting the fast subspace of the transfer
caused by the discretization is then defined as the μ-weighted operator, which decays to 0 with increasing lag time:
Euclidean norm ·μ,2 of the difference between discretized limτ →∞ η(τ ) = 0.
and original function:
2 1/2 The Markov model error E(k) can be proven36 to be
δ f ≡ f (x) − f (x) μ,2 =
ˆ dx μ(x) f (x) − f (x)
ˆ . bounded from above by the following expression:
(32) E(k) ≤ min{2, [mδ + η(τ )] [a(δ) + b(τ )]} λk2 (35)
When the projection Q is applied to probability densities with
p(x), it effectively measures how much density is in each of √
the discrete states and replaces the true density within each a(δ) = m(k − 1)δ (36)
state with a local stationary density of corresponding ampli-
tude. This projection allows the comparison between true and
Markov model dynamics to be made exactly as suggested by η(τ )
b(τ ) = (1 − η(τ )k−1 ). (37)
Fig. 4: in both cases we start with an arbitrary initial density 1 − η(τ )
Author complimentary copy. Redistribution subject to AIP license or copyright, see http://jcp.aip.org/jcp/copyright.jsp174105-11 Markov models: Generation and Validation J. Chem. Phys. 134, 174105 (2011)
This implies two observations: 20
Potential
Stationary Density (not normalized)
1. For long times, the overall error decays to zero with λk2 , 10
where 0 < λ2 < 1, thus the stationary distribution (re-
covered as k → ∞) is always correctly modeled, even if 0
the kinetics are badly approximated. 0.2
Error
2. The error during the kinetically interesting timescales 0.1 Eigenfunction (x)
(x)
2
consists of a product whose terms contain separately the 0 Approxim. Q (x)
2
2
2= 0.011
discretization error and spectral error. Thus, the overall –0.1
error can be diminished by choosing a fine discretiza- –0.2
tion (where fine means it needs to closely approximate 0.1
(x)
the slow eigenfunctions), and using a large lag time τ . 0
2
2= 0.047
–0.1
Depending on the ratio λm+1 (τ )/λ2 (τ ), the decay of the –0.2
spectral error η(τ ) with τ might be slow. It is thus inter- 0.1
(x)
esting to consider a special case of the discretization where 0
2
2= 0.0023
n = m and δ = 0. This would be achieved by a Markov model –0.1
–0.2
that uses a fuzzy partition with membership functions derived
0.1
from the first m eigenfunctions ψ1 , . . . , ψm .68 From a more
(x)
0
2
practical point of view, this situation can be approached by 2 = 0.0017
–0.1
using a Markov model with n >> m states located such that –0.2
they discretize the first m eigenfunctions with a vanishing dis- 0 20 40 60 80 100
cretization error, and then declaring that we are only interested x
in these m slowest relaxation processes. In this case we do not FIG. 5. Illustration of the eigenfunction approximation error δ2 on the slow
need to rely on the upper bound of the error from Eq. (35), but transition in the diffusion in a double well (top, black line). The slow-
directly obtain the important result E(k) = 0. est eigenfunction is shown in the lower four panels (black), along with
the step approximations (green) of the partitions (vertical black lines) at
In other words, a Markov model can approximate the ki-
x = 50; x = 40; x = 10, 20, . . . , 80, 90; and x = 40, 45, 50, 55, 60. The
netics of slow processes arbitrarily well, provided the dis- eigenfunction approximation error δ2 is shown as red area and its norm is
cretization can be made sufficiently fine or improved in a printed.
way that continues to minimize the eigenfunction approxima-
tion error. This observation can be rationalized by Eq. (15)
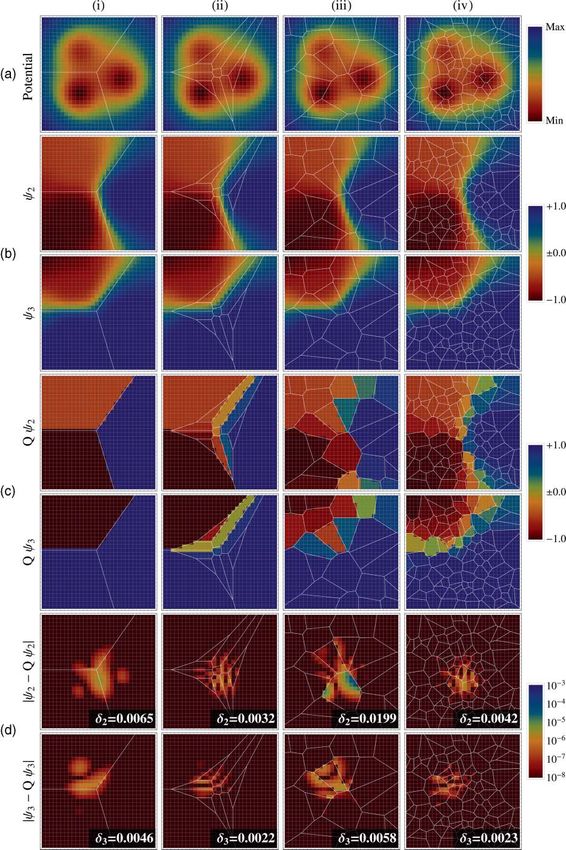
which shows that the dynamics of the transfer operator can tion errors |ψ2 − Qψ2 |(x) and |ψ3 − Qψ3 |(x) are large near
be exactly decomposed into a superposition of slow and fast the transition regions, where the eigenfunctions ψ2 (x) and
processes. ψ3 (x) change rapidly, leading to a large discretization error.
An important consequence of the δ-dependence of the Using a random partition (Fig. 6, third column) makes the sit-
error is that the best partition is not necessarily metastable. uation worse, but increasing the number of states reduces the
Previous work38–40, 52 has focused on the construction of discretization error (Fig. 6, fourth column), thereby increas-
partitions with high metastability [defined as the trace of the ing the quality of the Markov model. When states are chosen
transition matrix T(τ )], e.g., the two-state partition shown in such as to well approximate the eigenfunctions, a very small
[see second row in Fig. 5]. This approach was based on error can be obtained with few sets (Fig. 6, second column)
the idea that the discretized dynamics must be approxi- These results suggest that an adaptive discretization al-
mately Markovian if the system remained in each partition gorithm may be constructed which minimizes the E(k) er-
sufficiently long to approximately lose memory.39 While ror. Such an algorithm could iteratively modify the defi-
it can be shown that if a system has m metastable sets nitions of discretization sets as suggested previously,39 but
with λm λm+1 , then the most metastable partition into instead of maximizing metastability it would minimize the
n = m sets also minimizes the discretization error,36 the E(k) error which can be evaluated by comparing eigenvector
expression for the discretization error given here has two approximations on a coarse discretization compared to a ref-
further profound ramifications. First, even in the case where erence evaluated on a finer discretization.36
there exists a strong separation of timescales so the system One of the most intriguing insights from both Eq. (15)
has clearly m metastable sets, the discretization error can be and the results of the discretization error is that, if for a given
reduced even further by splitting the metastable partition into system only the slowest dynamical processes are of interest,
a total of n > m sets which are not metastable. And second, it is sufficient to discretize the state space such that the first
even in the absence of a strong separation of timescales, the few eigenvectors are well represented (in terms of small
discretization error can be made arbitrarily small by making approximation errors δi ). For example, if one is interested
the partition finer, especially in transition regions, where the in processes on timescales t ∗ or slower, then the number m
eigenfunctions change most rapidly [see second row in 5(b)]. of eigenfunctions that need to be resolved is equal to the
Figure 6 illustrates the Markov model discretization er- number of implied timescales with ti ≥ t ∗ . Due to the perfect
ror on a two-dimensional three-well example where two slow decoupling of processes for reversible dynamics in the eigen-
processes are of interest. The left panels show a metastable functions [see Eqs. (16) and (17)], no gap after these first m
partition with three sets. As seen in Fig. 6(d), the discretiza- timescales of interest is needed. Note that the quality of the
Author complimentary copy. Redistribution subject to AIP license or copyright, see http://jcp.aip.org/jcp/copyright.jspYou can also read