Exploring and modelling the influence of spectral light composition on soybean (Glycine max (L.) Merr.)
←
→
Page content transcription
If your browser does not render page correctly, please read the page content below
Exploring and modelling the influence of
spectral light composition on soybean
(Glycine max (L.) Merr.)

Dissertation to obtain the doctoral degree of Agricultural Sciences
(Dr. sc. Agr.)

Faculty of Agricultural Sciences

University of Hohenheim

Institute of Crop Science (340)

AG Cropping Systems and Modelling

submitted by

Tina Heldgaard Hitz

from Vejle in Denmark

2019

This thesis was accepted as a doctoral dissertation in fulfillment of the requirements for the
degree “Doctor of Agricultural Sciences” (Dr. sc. agr.) by the Faculty of Agricultural Sciences
at the University of Hohenheim.

Date of oral examination: 24 July 2020

Examination Committee
Supervisor and Reviewer: Prof. Dr. agr. Simone Graeff-Hönninger
Examiner: Prof. Dr. sc. agr. Hartmut Stützel
Examiner: Prof. Dr. Tobias Würschum
Head of the examination committee: Prof. Dr. Thilo Streck

                                              2
Table of contents

List of figures .........................................................................................................................4
List of abbreviations and acronyms.........................................................................................5
1. Introduction ........................................................................................................................6
   1.1 Light environment and the shade avoidance response ....................................................6
   1.2 Plant photoreceptors ......................................................................................................7
   1.3 LEDs and indoor plant production .................................................................................9
   1.4 Functional-structural plant modelling ............................................................................9
   1.5 Outline and objectives ................................................................................................. 11
2. Publications and results .................................................................................................... 14
3. Chapter I: Three-dimensional simulation of light spectrum and intensity within an LED
growth chamber .................................................................................................................... 15
4. Chapter II: Simulating light spectrum within a soybean canopy in an LED growth chamber
............................................................................................................................................. 25
5. Chapter III: Modelling of Soybean (Glycine max (L.) Merr.) Response to Blue Light Intensity
in Controlled Environments ................................................................................................. 32
6. Chapter IV: Morphological Response of Soybean (Glycine max (L.) Merr.) Cultivars to Light
Intensity and Red to Far-Red Ratio ....................................................................................... 51
7. General discussion ............................................................................................................ 67
   7.1 Soybean response to light spectrum ............................................................................. 67
   7.2 Perspectives of FSP modelling in indoor farming ........................................................ 70
   7.3 Spectral optimization in indoor farming ...................................................................... 72
Summary .............................................................................................................................. 76
Zusammenfassung ................................................................................................................ 78
References ............................................................................................................................ 81
Acknowledgements .............................................................................................................. 89

                                                                       3
List of figures
1.1. Relative absorption spectra of phytochrome (Pfr: dotted line; Pr: dashed line) (modified
from Li et al., 2011) and cryptochrome (solid line) (modified from Banerjee et al., 2007)…... 7
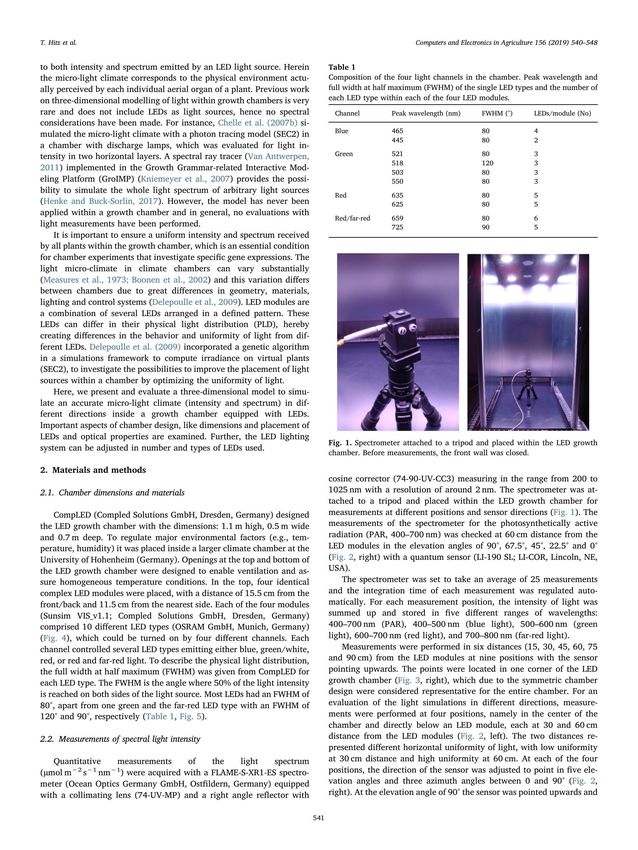
1.2. LED chamber with red and blue LEDs turned on (a), spectrometer for light measurements
in an empty chamber (b) and below a soybean canopy (c), reconstructed static soybean plants
(d) and dynamic soybean leaf (e), picture used for measurements of leaf area (f), experimental
plants grown under different red to far-red ratio (g) and spectra from experiments on blue
photon flux density (h) and red to far-red ratio combined with photosynthetic photon flux
density (i)……………………………………………………………………………………. 11
7.1. Plant height under a broad spectrum (PPFD: 557 µmol m-2 s-1) with (BGRUV) and without
(BGR) additional UVA………………………………………………………………………. 74
7.2. Plant height under a narrowed peak spectrum (PPFD+UVA: 200 µmol m-2 s-1) with
(R120BUV80; R80BUV120) and without (R120B80; R80B120) UVA included in BPFD under
different R to B ratios. ……………………………………………………………….………. 74
7.3. Work flow to develop the FSP model of soybean in a virtual LED chamber and the
application of the model at different stages…………………………………………………... 79
4
List of abbreviations and acronyms
B                               Blue light
BPFD                            Blue photon flux density
CCT                             Cryptochrome C-terminus
CRY1-2                          Cryptochrome 1-2
cv                              Cultivar
FLAVIN-BINDING, KELCH REPEAT,
                                FKF1
F-BOX 1
FR                              Far-red light
FSP                             Functional-structural plant
FWHM                            Full width at half maximum
G                               Green light
                                Growth Grammar-related Interactive Modelling
GroIMP
                                Platform
LED                             Light-emitting diode
LOV KELCH PROTEIN 2             LKP2
MAE                             Mean absolute error
MAPE                            Mean absolute percentage error
MRD                             Mean relative deviation
phot1-2                         Phototropin1-2
Phy A-E                         Phytochrome A-E
PLD                             Physical light distribution
PPFD                            Photosynthetic photon flux density
R                               Red light
R:FR                            Red to far-red light ratio
RMSE                            Root mean square error
SAR                             Shade avoidance response
SLA                             Specific leaf area
SPD                             Spectral power distribution
UVA                             UV-A light
UVB                             UV-B light
XL                              eXtended L-system
ZEITLUPE                        ZTL

                                 5
1. Introduction
Light drives plants assimilation of carbon through photosynthesis, which represents the primary
importance of light in crop production. Additionally, plant physiology and morphology respond
to light in multiple ways influencing crop yield and quality. In traditional agriculture, the light
intensity and spectrum fluctuate depending on crop management e.g. weed pressure (Green-
Tracewicz et al., 2011). In intercropping, the light environment can fluctuate substantial
depending on e.g. crop arrangement, intercropped species and duration of the overlapping crop
growth (Keating and Carberry, 1993). In indoor farming, the grower can directly influence light
intensity and spectrum by choice of the light source used as supplemental or sole lighting.
Hereby, an adequate knowledge of how light influence plant physiology and morphology can
assist in a choice of management to increase crop yield and quality in both traditional- and
indoor farming.

1.1 Light environment and the shade avoidance response
The solar spectrum reaching the surface of the earth is comprised of six ranges important for
plant morphology and physiology (Table 1.1). The range of the light transmitted through the
atmosphere starts at 290 nm, which is within the range of UV-B light (UVB). Shorter
wavelengths of UVB and the UV-C light are absorbed by the atmosphere (Tilbrook et al., 2013).
The UVB light range continues until 315 nm and is followed by the UV-A light (UVA) range
until 400 nm (Tilbrook et al., 2013). Wavelengths until 700 nm constitute the photosynthetic
active part of the spectrum, which is comprised of blue (B), green (G) and red light (R). The
range from 700 to 800 nm is the range of the far-red light (FR). The photosynthetic photon flux
density (PPFD) of B, G and R vary depending on location, time of day and cloud cover (Smith,
1982). The photosynthetic active part of the spectrum represent the fundamentally important
light for plant growth through carbon assimilation, but all wavelength from UVB to FR, are
important for the adaption of plant morphology and physiology to the fluctuations of light. The
solar spectrum is relatively stable and only twilight changes the solar spectrum considerable
with increased ratios of FR and B (Smith, 1982). Whereas, the spectrum actually perceived by
the plants often diverge from the solar spectrum due to the surrounding environment (Smith,
1982).

Table 1.1. Term and wavelengths of the six light ranges from UV-B to far-red light.

      Term of the range     UV-B        UV-A         Blue     Green       Red        Far-red
      Wavelengths (nm) 280-315 315-400 400-500 500-600 600-700 700-800

Many adaptations in plants due to fluctuations in the perceived light are collectively referred to
as the shade avoidance response (SAR). The SAR adapts plant morphology and physiology
according to signals from the surrounding vegetation with the purpose to decrease shade and
increase light interception (Casal, 2012). Shade indicating signals from the surrounding
vegetation are not only related to light, but also to e.g. leaf tip touching and volatiles, which can
work additive or interactive with light signals (Pierik and de Wit, 2014). The perceived
spectrum of the plant is influenced of the surroundings since the reflection, absorption and
transmission of vegetation are dependent of the wavelength.
Green leaves absorb most R and B especially by the pigments chlorophyll and carotenoid,
whereas G is absorbed less and FR is mainly reflected or transmitted (Kasperbauer, 1987). The

                                                 6
Introduction

reflection of FR from a surrounding short vegetation will be recognized by the plant as
decreased R:FR ratio (R:FR) and is hereby an early warning of the threat of shade (Ballare et
al., 1990; Green-Tracewicz et al., 2011). True shade from surrounding taller vegetation further
decreases R:FR and also reduces PPFD with an associated reduction of blue photon flux density
(BPFD).

Genotypic variation and phenotypic plasticity of SAR provide different ecological advantages
for plants (Franklin, 2008; Schmitt, 1997), but an overall differentiation is made between shade
tolerant and shade avoiding plants (Valladares and Niinemets, 2008). Increased specific leaf
area and chlorophyll a/b ratio are general shade adaptations to increase the efficiency of
photosynthesis (Valladares and Niinemets, 2008), while additional morphological adaptations
helps shade avoiding plants to escape shade and increase light interception. The main purpose
of these adaptations is to position the leaves above the surrounding vegetation, which is
accomplished by hyponasty of the leaves and taller plants with longer hypocotyls, internodes
and petioles (Franklin, 2008). Great investments in elongation of organs to increase light
interception can have negative impact on e.g. reproduction, but SAR is also regulated to avoid
a tragedy of the common (Bongers et al., 2018). Other responses to shade can be reduced
branching, early flowering (Franklin, 2008) and changed allocation of assimilates e.g. arrested
leaf development (Carabelli et al., 2007).
Within a field environment, crops perceive spectral fluctuations depending on weed pressure
and cropping practice. An emerging weed reflects FR and a decreased R:FR is perceived by the
crop, hereby signaling the threat of future shade. Intercropping within a tall crop decreases both
the perceived R:FR and PPFD of the shorter crop, hereby signaling true shade. SAR is
considered to be a negative adaptation in a field crop although it increases the fitness of plants
in a natural plant community (Franklin, 2008; Schmitt, 1997). In mono-cropping, the response
increases the heterogeneity of the crop and results in yield loss, compared to a weed free field
that does not induce SAR (Green-Tracewicz et al., 2011). In intercropping the response to true
shade of the shorter crop can complicate the harvest due to lodging (Liu et al., 2015). Soybean
is an example of a shade avoiding plant that is grown both in mono-cropping and as the shorter
crop in intercropping e.g. together with maize (Yang et al., 2018).

1.2 Plant photoreceptors
Signals from a fluctuating light environment are perceived by plant photoreceptors, which can
alter gene expression and hormone production (Casal, 2012). This regulation controls SAR and
other light dependent processes e.g. germination, de-etiolation, phototropism, stomata and
chloroplast movement, circadian rhythm and photoperiodic flowering (Christie, 2007; Li et al.,
2011; Yu et al., 2010). The latter was studied already in 1920 by Garner et al. (1920) and
together with observations of reversible seed germination under FR (Borthwick et al., 1952), it
later led to the detection of the R and FR receptor, phytochrome. The inactive form (Pr) of
phytochrome is synthesized in darkness in the cytosol. The Pr is activated by R and transformed
into the active form (Pfr), which is translocated to the nucleus (Li et al., 2011). This
transformation is reversible either slowly in darkness or faster by absorption of FR and enables
phytochrome to recognize the momentary R:FR. The balance between Pr and Pfr favors the
active Pfr under high R:FR, which suppresses SAR. The Pr is favored under low R:FR and the
suppression of SAR declines (Fraser et al., 2016).
In Arabidopsis thaliana (L.) Heynh five phytochromes have been identified, designated Phy A-
E, which are responsible for both distinct and overlapping functions. Regarding the
morphological responses during SAR, Phy B alone is responsible for considerable suppression

                                                7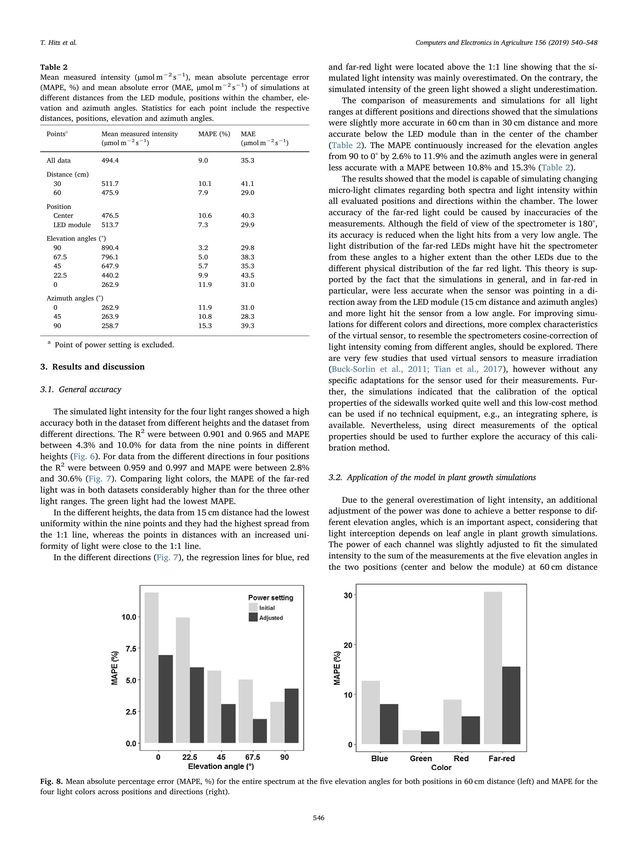
Introduction

of SAR under high R:FR (Nagatani et al., 1991; Somers et al., 1991), but interactions of Phy B
with Phy A, D and E also influence SAR (Franklin and Quail, 2010; Li et al., 2011).
The photoreceptors that perceive B and UVA are phototropins (phot1, phot2), the recent
discovered proteins of the Zeitlupe family (ZTL, FKF1 and LKP2) and cryptochromes (CRY1
and CRY2). Phototropins mainly control phototropism, stomatal opening and chloroplast
movements (Christie, 2007). The ZTL, FKF1, and LKP2 regulate the circadian rhythm and
flowering time (Zoltowski and Imaizumi, 2014). The UVB is perceived by the photoreceptor
UVR8, which mainly controls the protection against UVB by regulating DNA repair, sunscreen
pigments, antioxidants and hypocotyl length (Tilbrook et al., 2013).
The CRYs are the most important of the B and UV perceiving photoreceptors, in the context of
SAR. They were discovered later than the phytochromes and the mechanisms behind their
activation and regulation of gene expression are not as well understood. The CRY1 protein is
stable at high light intensity, whereas CRY2 is unstable, and rapidly degrades under high and
continuous B (Lin et al., 1998; Yu et al., 2010). The CRYs are flavoproteins functioning as a
dimer of monomers with two major domains the N-terminal Photolyase Homologous Region
(PHR) domain and the cryptochrome C-terminus (CCT) domain. The B is sensed by the primary
CRY chromophore, flavin adenine dinucleotide (FAD) binding to the PHR domain, which is
believed to trigger a conformational change in the CCT domain (Christie et al., 2015). These
nuclear conformational modifications and interactions with signaling proteins regulate gene
expression, which induce morphological adaptations (Yu et al., 2010).

Several examples reveal co-actions between photoreceptors to fine-tune the response to the
perceived light environment, but these interactions are not well understood. For instance, ZTL,
FKF1, and LKP2 and CRYs can interact to control related responses e.g. the circadian rhythm
and flowering time (Yu et al., 2010) and although controlling distinct responses, phototropin
and cryptochrome can interact both synergetic and antagonistic (Kang et al., 2008). Direct
interactions have been found between phyA/B and CRY1 and phyB and CRY2 and indirectly
they can co-act through interactions with common transcription factors (Wang et al., 2018).
The different absorption spectra of the photoreceptors enable the plant to perceive and react to
spectral fluctuations from the UVB to FR. Especially important for SAR is the absorption of
phytochrome and cryptochrome. The absorption peaks of phytochrome are at 660 nm for Pr
and 730 nm for Pfr, but it also weakly absorbs B (Purple lines; Fig. 1.1) (Li et al., 2011). Dark
adapted cryptochrome has two broad absorption peaks at 350-380 within UVA and at 420-490
nm within B (Fig. 1.1) (Banerjee et al., 2007).

Fig. 1.1. Relative absorption spectra of phytochrome (Pfr: dotted line; Pr: dashed line)
(modified from Li et al., 2011) and cryptochrome (solid line) (modified from Banerjee et al.,
2007).

                                               8
Introduction

1.3 LEDs and indoor plant production
Artificial lighting for crop production has been used for several decades as additional lighting
in greenhouses and in recent decades as sole light source for large-scale indoor farming
(Kalantari et al., 2018). Traditional light sources for crop production are fluorescent, high-
pressure sodium, metal halide and incandescent lamps (Bula et al., 1991), but with a decreased
price and increased efficiency of LED lighting, it gained increasing interest as a light source
(Morrow, 2008). The first LEDs were produced in the 1960s and were low intensity LEDs
emitting only R (Yeh and Chung, 2009). During the following decades, LEDs emitting yellow,
G and orange light were developed and the intensity increased, but it was not until 1993 that B
LEDs were introduced (Yeh and Chung, 2009). Since then LED technology has further
improved leading to an efficient and flexible light source with several advantages compared to
traditional lighting. The LEDs have a small size, low energy consumption, long life time and
low heat emittance and the spectra can be designed according to the intended application (Massa
et al., 2008). The spectra of traditional light sources are general not optimized for plant growth
as it is possible with LEDs (Bula et al., 1991) and the increased spectral flexibility allows for
easy adjustments e.g. at different developmental stages or for regulating the circadian rhythm.
The first application of LEDs for horticultural lighting over 20 years ago combined R LEDs
with B from other light sources to achieve a normal plant growth (Bula et al., 1991). With
today’s possibility to design a LED spectrum within the entire range relevant for plant
physiology and morphology the question arose how to optimize this spectrum. The goal is no
longer only to achieve a normal growth, but to optimize the spectrum according to the crop
species and purpose of the production (Massa et al., 2008). The main purpose of the LED light
source is to supply the plant with light for photosynthesis to produce biomass. The
photosynthetic pigments are mainly the R absorbing chlorophyll and the B absorbing
carotenoid. R is considered the most effective light source due to more effective transfer
between chlorophylls than from carotenoid to chlorophyll and due to a better balance between
photosystem I and II (Hogewoning et al., 2012). Recent work of Schlau-Cohen and coworkers
showed that carotenoid is more important for photosynthesis than believed so far (Collini, 2019)
and even G could be an effective light source for photosynthesis (Lanoue et al., 2018). The FR
can also influence the photosynthetic rate due to enhancing effects of some wavelengths on
other wavelengths (Emerson et al., 1957; Zhen and van Iersel, 2017).
Apart from increasing carbon assimilation, LED lighting can be optimized regarding several
other aspects e.g. the control of flowering time through phytochrome in the production of
ornamentals or higher crop quality using B LEDs to increase the content of secondary
compounds (Taulavuori et al., 2013). In a speed breeding system, the main purpose is to collect
one seed of the plant as fast as possible (Watson et al., 2018) and great emphasis can be put on
optimizing the spectra to save space. This can be achieved by producing short plants allowing
for more layers of plants as long as the spectra do not delay the time of seed set. In this context
SAR is of particular interest due to its impact on plant height.

1.4 Functional-structural plant modelling
The three dimensional representations of plants started in the 1960s, with the most important
work performed by Lindenmayer and his successors (Vos et al., 2010), who developed the L-
language (Lindenmayer, 1968a, 1968b). During the following decades other platforms were
developed for the purpose of functional-structural plant (FSP) modelling e.g. L-studio
(Prusinkiewicz, 2007) and GREENLAB (Yan et al., 2004). In the present thesis, the open-
source Growth Grammar-related Interactive Modelling Platform (GroIMP) (Kniemeyer et al.,
2007) was chosen. This java based platform can execute programs written in the eXtended L-
system (XL) language implementing relational growth grammars (Hemmerling et al., 2008).

                                                9
Introduction
GroIMP has been used to construct FSP models of several species e.g. oilseed rape (Tian et al.,
2017), barley (Buck-Sorlin et al., 2008), wheat (Evers et al., 2015) and Arabidopsis thaliana
(L.) Heynh (Bongers et al., 2018). For facilitating the development of FSP models for other
crops, Henke et al. (2016) developed a generic plant model in GroIMP.
The specific advantage of GroIMP in the context of the present project studying the effect of
specific wavelength is the possibility of spectral ray tracer simulations (GPUFlux model) with
a resolution down to one nm (Van Antwerpen, 2011). The GPUFlux model is based on a Monte
Carlo ray tracer and simulates the light rays emitted from the light sources placed within the
virtual scene. The optical properties (phong shader (Phong, 1975)) of the object within the scene
determine the proportion of the ray that is reflected, absorbed or transmitted by collision with
light ray. Several light sources can be chosen in GroIMP and for virtual LEDs the integrated
lightNode module can be used. This module can be parameterized to simulate both light
distribution and spectrum according to the technical specifications of the real LEDs (Henke and
Buck-Sorlin, 2017).
Results of most spectral experiments are analyzed based on the applied light treatment, whereas
the actual perceived light by the plant is not considered. The micro-light climate perceived by
the plant organs can differ from the applied treatment due to e.g. surrounding environment,
plant density or adaptations in plant morphology induced by the treatment itself. The FSP
modelling represents a method to consider the perceived light by simulating micro-light climate
within a virtual three dimensional representations of the experiment.
For instance, Kahlen and Stützel (2011) applied an FSP model of cucumber to collect data of
the perceived R:FR of the internode during the simulations of a selected experiment. An R:FR
response curve was derived from the simulated date and the curve was integrated in the FSP
model, which simulated internode length response to the perceived R:FR. The simulation of the
calibrated FSP model was found better than a model only sensitive to PPFD and ignoring the
morphology of the plant (Kahlen and Stützel, 2011).
Several other FSP models have been constructed, which simulated the morphological response
to R:FR with the purpose of optimizing crop production or increasing knowledge of the
underlying mechanisms of plant responses. For instance, Gautier et al. (2000) applied a FSP
model of clover to describe the impact of self-shading. Two recent studies aimed towards
increasing the understanding of SAR with an FSP model of Arabidopsis thaliana (L.) Heynh
(Bongers et al., 2018) and explored the role of biomass allocation between leaves and petioles
to capture light in a dense stand (Yoshinaka et al., 2018).
The final FSP model can simulate the response to a wide variety of environmental combinations
exceeding an experimentally feasible extent. Models responding to the perceived light
environment can be extended e.g. by implementing available data and knowledge on yield,
physiological processes and underlying mechanisms. For instance, Kahlen and Chen (2015)
combined light and temperature response in their FSP model of cucumber and Buck-Sorlin et
al. (2008) combined the response of light with signal transduction of gibberellic acid. These
earlier studies focused on the spectral change of R:FR under shade, whereas no earlier studies
were developed with the purpose of simulating the morphological response to BPFD.
10Introduction
1.5 Outline and objectives
This dissertation was performed as a part of the project MoLED-Plant, with the objective to
develop a speed breeding system for soybean under LED lighting. The project was funded by
the German Federal Ministry for Economic Affairs and Energy according to a decision of the
German Federal Parliament within the Central Innovation Program for SMEs (ZF4279901CR6)
and was a cooperation between the State Plant Breeding Institute, Institute of Crop Science at
the University of Hohenheim and the LED-lighting company COMPLED Solutions GmbH
(Dresden, Germany). Soybean was chosen for the project, because an increased production of
this crop within Europe is desired to decrease the dependence of the high amounts of soybean
currently imported (European commission, 2018). The development of soybean cultivars with
a higher cold tolerance is an important factor to increase the European production by expanding
the area, where soybean can be grown (Jähne et al., 2019). Speed breeding is a method to
accelerate this breeding process by growing several generations per season in growth chambers.
For instance, six generations of several cereals and peas can be grown per year instead of 2-3
under normal greenhouse conditions (Watson et al., 2018).
To collect data for determining the best spectrum for a speed breeding system for soybean, LED
growth chambers delivered from the project partner COMPLED Solutions GmbH were used.
The chambers were designed to have a high degree of spectral flexibility as the intensity of light
peaks could be regulated independently. This enabled studies of a wide variety of spectral light
compositions. The requirements for the final spectrum were to promote short and stable plants
across all cultivars without a delay of flowering.
The major aims of this thesis were: (i) to study the effect of different spectral light compositions
on soybean morphology and (ii) to develop an FSP model with an integrated response to the
spectrum. The experimental and simulated results should increase the scientific knowledge of
the effects of wavelengths on soybean morphology in general and assist in optimizing the speed
breeding system for soybean.
The main objectives pursued within the thesis were:
• Construct a three dimensional model of an LED chamber to simulate micro-light
climate.
• Develop an FSP model of soybean and derive a BPFD response curve from
simulations.
• Apply the FSP model with the integrated response curve for spectral optimization.
• Explore the influence of BPFD under constant PPFD.
• Disentangle the influence of R:FR and PPFD on SAR.
11Introduction
Within LED climate chambers at the University of Hohenheim, various measurements and
experiments were conducted for pursuing the above-mentioned objectives (Fig. 1.2). Detailed
light measurements were performed with a spectrometer (Ocean Optics Germany GmbH,
Ostfildern, Germany) in numerous locations and sensor orientations to evaluate the light
simulations of the LED chamber model. For the development of the FSP model of soybean,
frequent measurements of plant morphology were performed during BPFD experiments. The
data comprised dimensions and biomass of each individual organ on all phytomers and was
used to derive growth response functions.
Light treatments to explore the influence of BPFD and disentangle the effect of R:FR and PPFD
were set by adjusting the light of the chambers until spectrometer measurements showed the
desired spectral intensity. In the BPFD experiments, six levels of BPFD were applied. To
disentangle R:FR and PPFD two experiments were performed consisting of nine treatments in
total. The technical approaches and experimental designs are described in details in Chapter I-
IV of this thesis.
a b c
d e
f
g
h i
Fig 1.2. LED chamber with red and blue LEDs turned on (a), spectrometer for light
measurements in an empty chamber (b) and below a soybean canopy (c), reconstructed static
soybean plants (d) and dynamic soybean leaf (e), picture used for measurements of leaf area
(f), experimental plants grown under different red to far-red ratio (g) and spectra from
experiments on blue photon flux density (h) and red to far-red ratio combined with
photosynthetic photon flux density (i).
12Introduction
The results of the experiments and the associated modelling are presented in four papers within
Chapter I-IV. Three of the papers have been published by peer reviewed journals and an
additional paper has been published as a peer reviewed contribution to the 6th International
Symposium on Plant Growth Modeling, Simulation, Visualization and Applications (PMA) in
Hefei, China.
Chapter I presents the development and the properties of the three dimensional LED chamber
model. Simulations were evaluated by comparisons of simulated and measured light spectra for
several positions and sensor orientations within the chamber to assure a high accuracy of the
micro-light climatic simulations. The results were discussed in the context of FSP modelling
and chamber design.
In Chapter II, a static soybean model was integrated into the chamber model by reconstructing
soybean plants grown within the LED chamber. Spectral light simulations within the canopy
were evaluated for several positions on two dates. The model was applied to evaluate
experimental designs by simulating the light heterogeneity under an increase in plant density.
Chapter III presents the response of soybean to BPFD under constant PPFD together with the
dynamic FSP model of soybean. The model was calibrated according to the morphological
measurements performed during the experiments, and a response curve of internode elongation
to the perceived BPFD was derived from simulations. The response curve was integrated into
the model and it was applied for spectral optimization to achieve a short plant within an
alternative chamber design.
The results of the experiments performed to disentangle the influence of R:FR and PPFD are
presented in Chapter IV. The influence on morphology and biomass of different organs in
three soybean cultivars are discussed in the context of SAR and the aspects for breeding and
crop management.
132. Publications and results
Four scientific papers are presented in Chapter I-IV in this cumulative thesis. The papers are all
published in peer reviewed international journals or conference proceedings.
For citation of the papers, please use the references as given below.
Chapter I
Hitz, T., Henke, M., Graeff-Hönninger, S., Munz, S., 2019. Three-dimensional simulation of
light spectrum and intensity within an LED growth chamber. Comput. Electron. Agric. 156,
540–548. https://doi.org/10.1016/J.COMPAG.2018.11.043
Chapter II
Hitz, T., Henke, M., Graeff-Honninger, S., Munz, S., 2018. Simulating light spectrum within a
soybean canopy in an LED growth chamber, in: 2018 6th International Symposium on Plant
Growth Modeling, Simulation, Visualization and Applications (PMA). IEEE, pp. 120–125.
https://doi.org/10.1109/PMA.2018.8611598
Chapter III
Hitz, T., Graeff-Hönninger, S., Munz, S., 2020. Modelling of Soybean (Glycine max (L.) Merr.)
Response to Blue Light Intensity in Controlled Environments. Plants 9, 1757.
https://doi.org/10.3390/plants9121757
Chapter IV
Hitz, T., Hartung, J., Graeff-Hönninger, S., Munz, S., 2019. Morphological Response of
Soybean (Glycine max (L.) Merr.) Cultivars to Light Intensity and Red to Far-Red Ratio.
Agronomy 9, 428. https://doi.org/10.3390/agronomy9080428
143. Chapter I: Three-dimensional simulation of light
spectrum and intensity within an LED growth chamber
Hitz, T., Henke, M., Graeff-Hönninger, S., Munz, S., 2019. Three-dimensional simulation of
light spectrum and intensity within an LED growth chamber. Comput. Electron. Agric. 156,
540–548. https://doi.org/10.1016/J.COMPAG.2018.11.043
An important prerequisite for FSP modelling of plants under LED light
was a virtual scene assuring good simulations of the light microclimate
perceived by virtual plant organs. No previous publication was found
on simulating LED light for this purpose. Chapter I filled this gap in
literature by presenting the development of a virtual LED chamber. The
chamber model was combined with the point light source and the Monte
Carlo ray tracer integrated in GroIMP. A virtual sensor was
constructed to compare measurements and simulations at exact
locations within the chamber. Technical information on the real LEDs
was used to define the parameters of the point light source to achieve a
detailed simulation of both the light distribution and the light spectra
from different LED types. Easy adjustment of the dimensions of the
chamber and LED placement was integrated in the model for adaptions
to other scenarios.
Measurements for an evaluation of the model were performed to assure
a high accuracy of three desired properties of the model: (i) simulation
of different LED types and different wavelengths, evaluated with
individual measurements of B, G, R and FR, and (ii) simulation of the
light perceived by leaves with varying orientations, evaluated with
measurements performed in different elevation and azimuth angles, and
(iii) simulation of light heterogeneity to assess new chamber designs,
evaluated with horizontal and vertical measurements representing the
entire space of the chamber.
153. Chapter I: Three-dimensional simulation of light spectrum and intensity within an LED
growth chamber
163. Chapter I: Three-dimensional simulation of light spectrum and intensity within an LED
growth chamber
173. Chapter I: Three-dimensional simulation of light spectrum and intensity within an LED
growth chamber
183. Chapter I: Three-dimensional simulation of light spectrum and intensity within an LED
growth chamber
193. Chapter I: Three-dimensional simulation of light spectrum and intensity within an LED
growth chamber
203. Chapter I: Three-dimensional simulation of light spectrum and intensity within an LED
growth chamber
213. Chapter I: Three-dimensional simulation of light spectrum and intensity within an LED
growth chamber
223. Chapter I: Three-dimensional simulation of light spectrum and intensity within an LED
growth chamber
233. Chapter I: Three-dimensional simulation of light spectrum and intensity within an LED
growth chamber
244. Chapter II: Simulating light spectrum within a soybean
canopy in an LED growth chamber
Hitz, T., Henke, M., Graeff-Honninger, S., Munz, S., 2018. Simulating light spectrum within a
soybean canopy in an LED growth chamber, in: 2018 6th International Symposium on Plant
Growth Modeling, Simulation, Visualization and Applications (PMA). IEEE, pp. 120–125.
https://doi.org/10.1109/PMA.2018.8611598
In Chapter I, the LED chamber model was constructed and fulfilled the
desired properties. High accuracy of simulations with multiple sensor
orientations was important for the future use of the chamber model for
FSP modelling with various leaf orientations. In Chapter II, a static
plant model was integrated in the chamber model and measurements
and simulations below the soybean canopy were compared.
The measurements consisted of light measurements at nine points in the
chamber and detailed measurements of plant architecture for a virtual
reconstruction of the scene. The light measurements were compared
with simulations using the virtual sensor from Chapter I. The
comparison further substantiated that the model assured good light
simulations for FSP modelling and represents an intermediate step
between the empty chamber and the integration of a dynamic FSP
model of soybean. The model was applied to evaluate alternative
experimental scenarios by simulating an increased plant density in the
chamber and the influence on light interception and heterogeneity was
discussed.
254. Chapter II: Simulating light spectrum within a soybean canopy in an LED growth chamber
264. Chapter II: Simulating light spectrum within a soybean canopy in an LED growth chamber
274. Chapter II: Simulating light spectrum within a soybean canopy in an LED growth chamber
284. Chapter II: Simulating light spectrum within a soybean canopy in an LED growth chamber
294. Chapter II: Simulating light spectrum within a soybean canopy in an LED growth chamber
304. Chapter II: Simulating light spectrum within a soybean canopy in an LED growth chamber
315. Chapter III: Modelling of Soybean (Glycine max (L.)
Merr.) Response to Blue Light Intensity in Controlled
Environments
Hitz, T., Graeff-Hönninger, S., Munz, S., 2020. Modelling of Soybean (Glycine max (L.) Merr.)
Response to Blue Light Intensity in Controlled Environments. Plants 9, 1757.
https://doi.org/10.3390/plants9121757.
Previous chapters evaluated the chamber model to assure correct
simulation of micro-light climate. The model was applied in scenarios
representing alternative chamber design in Chapter I and alternative
experimental setups with a static plant model in Chapter II.
In Chapter III, the dynamic FSP model of soybean was introduced in
the chamber model. Earlier FSP models responding to the perceived
spectrum integrated the response to R:FR, whereas Chapter III
integrated the influence of BPFD. The BPFD was chosen to fill this gap
and due to promising results of preliminary experiments in context of
the speed breeding system. To calibrate the model, experiments with six
levels of BPFD were performed to collect data on the morphological
responses. Chapter III also presents the results of soybean response to
BPFD regarding elongation, biomass and photosynthesis.
First, the calibrated model was used to simulate the actual perceived
BPFD by the internodes during the experiments to fit a response curve
of internode elongation to the perceived BPFD. Second, the response
curve was integrated in the model to simulate internode elongation in
response to the perceived BPFD. Finally, simulations were made to
evaluate the optimum BPFD in an alternative chamber design for a
reduction of energy consumption.
325. Chapter III: Modelling of Soybean (Glycine max (L.) Merr.) Response to Blue Light
Intensity in Controlled Environments
335. Chapter III: Modelling of Soybean (Glycine max (L.) Merr.) Response to Blue Light
Intensity in Controlled Environments
345. Chapter III: Modelling of Soybean (Glycine max (L.) Merr.) Response to Blue Light
Intensity in Controlled Environments
355. Chapter III: Modelling of Soybean (Glycine max (L.) Merr.) Response to Blue Light
Intensity in Controlled Environments
365. Chapter III: Modelling of Soybean (Glycine max (L.) Merr.) Response to Blue Light
Intensity in Controlled Environments
375. Chapter III: Modelling of Soybean (Glycine max (L.) Merr.) Response to Blue Light
Intensity in Controlled Environments
385. Chapter III: Modelling of Soybean (Glycine max (L.) Merr.) Response to Blue Light
Intensity in Controlled Environments
395. Chapter III: Modelling of Soybean (Glycine max (L.) Merr.) Response to Blue Light
Intensity in Controlled Environments
405. Chapter III: Modelling of Soybean (Glycine max (L.) Merr.) Response to Blue Light
Intensity in Controlled Environments
415. Chapter III: Modelling of Soybean (Glycine max (L.) Merr.) Response to Blue Light
Intensity in Controlled Environments
425. Chapter III: Modelling of Soybean (Glycine max (L.) Merr.) Response to Blue Light
Intensity in Controlled Environments
435. Chapter III: Modelling of Soybean (Glycine max (L.) Merr.) Response to Blue Light
Intensity in Controlled Environments
445. Chapter III: Modelling of Soybean (Glycine max (L.) Merr.) Response to Blue Light
Intensity in Controlled Environments
455. Chapter III: Modelling of Soybean (Glycine max (L.) Merr.) Response to Blue Light
Intensity in Controlled Environments
465. Chapter III: Modelling of Soybean (Glycine max (L.) Merr.) Response to Blue Light
Intensity in Controlled Environments
475. Chapter III: Modelling of Soybean (Glycine max (L.) Merr.) Response to Blue Light
Intensity in Controlled Environments
485. Chapter III: Modelling of Soybean (Glycine max (L.) Merr.) Response to Blue Light
Intensity in Controlled Environments
495. Chapter III: Modelling of Soybean (Glycine max (L.) Merr.) Response to Blue Light
Intensity in Controlled Environments
506. Chapter IV: Morphological Response of Soybean
(Glycine max (L.) Merr.) Cultivars to Light Intensity and
Red to Far-Red Ratio
Hitz, T., Hartung, J., Graeff-Hönninger, S., Munz, S., 2019. Morphological Response of
Soybean (Glycine max (L.) Merr.) Cultivars to Light Intensity and Red to Far-Red Ratio.
Agronomy 9, 428. https://doi.org/10.3390/agronomy9080428
Chapter III focused on the influence of BPFD level on soybean under
constant PPFD. This spectral change does not appear in nature, where
decreased BPFD is associated with a decrease in PPFD. Chapter IV
instead aimed towards an increased understanding of the fundamental
morphological response of soybean to the light environment under
natural shade, e.g. in cropping systems. The objective was to
disentangle the effects of the two shade factors low PPFD and R:FR on
the induction of SAR. This is difficult in a natural environment and
instead the advantages of LED lighting were utilized by applying
treatments with variation of only one factor. The treatments combined
different levels of PPFD and R:FR in two experiments to explore both
a high PPFD and an R:FR corresponding to shade in intercropping.
Knowledge of the interaction between light environment and cultivars
is important for breeding cultivars for specific cropping practices e.g.
mono- and intercropping. Studies of these interactions are limited and
therefore three different cultivars were tested and analyzed for
interactions between cultivar and light.
516. Chapter IV: Morphological Response of Soybean (Glycine max (L.) Merr.) Cultivars to
Light Intensity and Red to Far-Red Ratio
526. Chapter IV: Morphological Response of Soybean (Glycine max (L.) Merr.) Cultivars to
Light Intensity and Red to Far-Red Ratio
536. Chapter IV: Morphological Response of Soybean (Glycine max (L.) Merr.) Cultivars to
Light Intensity and Red to Far-Red Ratio
546. Chapter IV: Morphological Response of Soybean (Glycine max (L.) Merr.) Cultivars to
Light Intensity and Red to Far-Red Ratio
556. Chapter IV: Morphological Response of Soybean (Glycine max (L.) Merr.) Cultivars to
Light Intensity and Red to Far-Red Ratio
566. Chapter IV: Morphological Response of Soybean (Glycine max (L.) Merr.) Cultivars to
Light Intensity and Red to Far-Red Ratio
576. Chapter IV: Morphological Response of Soybean (Glycine max (L.) Merr.) Cultivars to
Light Intensity and Red to Far-Red Ratio
586. Chapter IV: Morphological Response of Soybean (Glycine max (L.) Merr.) Cultivars to
Light Intensity and Red to Far-Red Ratio
596. Chapter IV: Morphological Response of Soybean (Glycine max (L.) Merr.) Cultivars to
Light Intensity and Red to Far-Red Ratio
606. Chapter IV: Morphological Response of Soybean (Glycine max (L.) Merr.) Cultivars to
Light Intensity and Red to Far-Red Ratio
616. Chapter IV: Morphological Response of Soybean (Glycine max (L.) Merr.) Cultivars to
Light Intensity and Red to Far-Red Ratio
626. Chapter IV: Morphological Response of Soybean (Glycine max (L.) Merr.) Cultivars to
Light Intensity and Red to Far-Red Ratio
636. Chapter IV: Morphological Response of Soybean (Glycine max (L.) Merr.) Cultivars to
Light Intensity and Red to Far-Red Ratio
646. Chapter IV: Morphological Response of Soybean (Glycine max (L.) Merr.) Cultivars to
Light Intensity and Red to Far-Red Ratio
656. Chapter IV: Morphological Response of Soybean (Glycine max (L.) Merr.) Cultivars to
Light Intensity and Red to Far-Red Ratio
667. General discussion
The primary objectives of this thesis were to explore the effect of spectral light composition on
soybean morphology and to develop an FSP model of soybean with an integrated response to
spectrum within a virtual LED chamber. In Chapter I, the chamber model was developed and
light simulations were evaluated in multiple locations relevant for FSP modelling and
optimization of chamber design. In Chapter II, the static FSP model of soybean was integrated
with the reconstruction of an experimental setup. This chapter applied the chamber model
combined with the static FSP model for evaluation and optimization of experimental setups. In
Chapter III, the dynamic FSP model of soybean was integrated and a response curve of
internode elongation to BPFD was derived from simulation with the calibrated model. After the
response curve was integrated in the model, it was applied for spectral light optimization in an
alternative chamber design. Additionally, this chapter covered the morphological influence of
BPFD levels under stable PPFD. Chapter IV covered the influence of R:FR and PPFD to
disentangle their influence on SAR.
The results of the individual publications were already discussed within each chapter and will
not be discussed here individually. Instead, the general discussion will discuss the response of
soybean to the spectrum from UV to FR, by combining the results from Chapter III and IV and
additional results from preliminary UV experiments. The second part of the discussion will
discuss the perspectives of FSP modelling for optimization of crop production in indoor
farming. Finally, the optimization of spectra in indoor farming will be discussed in the context
of applying knowledge of spectral effects on plant morphology, biomass and quality and the
advantages of FSP modelling.
7.1 Soybean response to light spectrum
Low BPFD, R:FR and PPFD are signals of shade arising due to the absorption and reflection
of light in the surrounding vegetation. In a natural environment, it is difficult to distinguish the
effect of these factors individually. Decreased R:FR appears alone associated with the threat of
shade, whereas low PPFD, low R:FR and low BPFD appears simultaneous under true shade.
This thesis utilized the advantages of a flexible spectrum in LED chambers to explore the
influence of fluctuations in one shade factor independent from the others. Chapter III explored
the influence of BPFD under a constant PPFD and Chapter IV aimed towards the
disentanglement of low R:FR and PPFD. Table 7.1 summarizes the influence of the three shade
factors low BPFD, low R:FR and low PPFD on morphology and biomass.
Low R:FR and low BPFD are the two factors strictly related to spectral distribution. The
influence of these two factors was the same for the majority of plant measurements. This is
supported by previous studies stating that phytochrome and cryptochrome interact to fine tune
the response to e.g. the tread of shade or true shade (de Wit et al., 2016; Fraser et al., 2016;
Keller et al., 2011; Pedmale et al., 2016). Only one of the two spectral shade factors had an
influence on internode diameter, leaf biomass and LAR. This indicated that cryptochrome is
the main regulator of leaf biomass through BPFD perception, while phytochrome is the main
regulator of internode diameter through R:FR perception. The results of previous studies are
conflicting and showed both increased and decreased leaf biomass of soybean under low R:FR
(Green-Tracewicz et al., 2011; Pauch et al., 1991). Regarding low BPFD, an earlier study found
only a small increase of leaf biomass of soybean, but this could be due to the lower ratio of B
under the maximum BPFD (Dougher and Bugbee, 2001). The response of leaf biomass to R:FR
677. General discussion
and BPFD should be clarified in further studies, which could also explore the tendency of an
antagonistic influence from by BPFD and R:FR on SLA (Table 7.1).
Only internode length, internode length:diameter and LMR clearly responded in a common way
to all three factors of shade, whereas the other plant measurements were inconsistent in the
response. Petiole length showed only a minor discrepancy with no response to low PPFD under
low R:FR, otherwise petiole length also increased under all three shade factors. The influence
of PPFD on biomass, LAR, SLA and internode diameter worked antagonistically to the
influence of BPFD and/or low R:FR (Table 7.1).
Table 7.1. The increasing (+), decreasing (-) or no (0) influence of the three shade factors blue
photon flux density (BPFD), red:far-red ratio (R:FR), and photosynthetic photon flux density
(PPFD) on plant morphology and biomass.
Measurement Low BPFD Low R:FR Low PPFD
Internode length + + +
Petiole length + + 0/+
Leaf length 0 0/+ 0
Internode diameter 0 0/+ -
Internode length:diameter + + +
Total biomass + + -
Leaf biomass + 0 -
Stem biomass + + -
SLA 0/- 0/+ +
LAR 0 0/- +
LMR - - -
Low BPFD is perceived by cryptochrome, which does also perceive UVA. At the beginning of
the project, it was hypothesized that UV-A could amplify the reduction in height that was
achieved under high BPFD. This hypothesis was tested in preliminary experiments, but was not
further pursued in context of the speed breeding system. Still, the preliminary results are
interesting in the context of increasing the understanding of soybean response to spectra,
especially as earlier literature on the influence of UVA compared to the influence of B is limited
(Verdaguer et al., 2017).
The UVA experiments were performed in the chambers from COMPLED Solutions GmbH as
described in Chapter I-III. In both experiments the cv. Amphor, ESSenator, Josefine and Merlin
grew under a twelve-hour photoperiod. The project partner from the State Plant Breeding
Institute performed an experiment with two treatments. Both treatments consisted of a broad
spectrum including B, G and R with a PPFD of 557 µmol m-2 s-1 and one treatment additionally
consisted of 25 µmol m-2 s-1 of UVA. The presented results are from one replicate, as the
experiment was not repeated. The other UVA experiment consisted of four treatments and was
performed with two replicates. In this experiment, UVA was not added to the spectrum, but
instead included in the BPFD level of the treatments. This approach resulted in varying PPFD
of the treatments from 170-200 µmol m-2 s-1, but it was chosen to explore if UVA reduced
height more effective than B. Additionally, the experiment tested the response under two R-
ratios (0.6 and 0.4).
The results of the first experiment showed that the plants were shorter under the additional UVA
(BGRUV), but did not proof an additional effect of UVA compared to an increased BPFD (fig.
687. General discussion
7.1). The results of the experiment with UVA included in BPFD showed no reduction of height
under UVA (R120BUV80 and R80BUV120) (fig. 7.2). On the contrary, a slight tendency of
increased height under UVA was present, but this could be due to other factors e.g. the lower
PPFD of the UVA treatments.
Fig. 7.1. Plant height under a broad spectrum (PPFD: 557 µmol m-2 s-1) with (BGRUV) and
without (BGR) additional UVA.
Fig. 7.2. Plant height under a narrowed peak spectrum (PPFD+UVA: 200 µmol m-2 s-1) with
(R120BUV80; R80BUV120) and without (R120B80; R80B120) UVA included in BPFD under
different R to B ratios.
It was concluded from the experiments, that UVA was not advantageous compared to B to
achieve a short soybean plant. This was mainly based on the results of no additional reduction
of height in the second experiment, including UVA in BPFD. Further studies are needed to
697. General discussion
determine, if UVA is less effective than B as indicated in the second experiment (Fig. 7.2).
Studies on UVA are relatively few and especially studies of the distinct effect of UVA
compared to B, are lacking (Verdaguer2017).
Plant height can also be reduced with UVB (Neugart and Schreiner, 2018) perceived by the
photoreceptor UVR-8 instead of cryptochrome. The different perception would, at least to some
extent, result in UV-B working through different mechanisms than B. Whether the magnitude
of the response to UVB differs from the response to increased B is unknown (Robson et al.,
2019).
Future studies should explore the influences and mechanisms of the single factors of shade,
including treatments representing all three factors low BPFD, R:FR and PPFD within the same
study. These studies could help in understanding the fundamental responses of plants to
fluctuations in the perceived light environment associated with SAR. Especially in the context
of indoor farming, studies of specific wavelengths are interesting. For instance, the importance
of a spectrum corresponding to the absorption spectra of photoreceptors or photosynthetic
pigments and synergetic effects between wavelengths. Also, the distinct influence of UVA and
B and the influence of UVB are interesting aspects of further studies of spectral influences on
plants. These studies should include physiological measurements of e.g. photosynthesis and
hormone and sugar production for a deeper understanding of interactions and underlying
mechanisms.
7.2 Perspectives of FSP modelling in indoor farming
The many complex interactions of light on plant morphology and physiology need substantial
studies for a better understanding. LED chambers represent a possibility to study the influence
of very specific wavelengths by designing narrow-peaked spectra. An obstacle in LED chamber
studies is, that light within a climate chamber can be very heterogeneous (Delepoulle et al.,
2009), but also that the experimental setup in published literature varies substantially regarding
e.g. light sources, chamber dimensions and plant density. This heterogeneity constrains the
comparison of studies and the transfer of knowledge to crop production in e.g. indoor farming.
The simulation of the perceived light with FSP modelling could be a valuable method to
overcome these constraints. Chapter IV is an example of how FSP modelling could be applied
to both increase the knowledge gained from the experiment and facilitate the transfer of
knowledge. The study was performed in a chamber constructed for scientific purposes and
determined relative differences and effects of the factors PPFD and R:FR. It is difficult from
this study alone to determine absolute values necessary to trigger a response in a production
facility or in the field. By combining the experiment with an FSP model it would be possible to
estimate absolute values for individual organs of the plant and these results could easily be
transferred to FSP models of soybean in a production environment.
Another valuable outcome of FSP models in the context of exploring plant responses is an
increased insight in underlying plant mechanisms (e.g. Bongers et al., 2018; Yoshinaka et al.,
2018). Gautier et al. (2000) described the impact of self-shading on the response to R:FR on
different phytomer levels of clover. The increased self-shading at later phytomers was used to
explain the longer internodes of these. Whereas decreased R:FR is a proportional change in
spectra, BPFD is an absolute change. Based on simulations with the FSP model of soybean,
this thesis found that the perceived BPFD in a similar way was influenced from increased self-
shading at the third internode compared to the second.
Furthermore, FSP modelling is applied for the optimization of crop production systems. The
developed FSP model within an LED chamber was already applied in the context of optimizing
70You can also read


