Hydrometeorological analysis and forecasting of a 3 d flash-flood-triggering desert rainstorm
←
→
Page content transcription
If your browser does not render page correctly, please read the page content below
Nat. Hazards Earth Syst. Sci., 21, 917–939, 2021
https://doi.org/10.5194/nhess-21-917-2021
© Author(s) 2021. This work is distributed under
the Creative Commons Attribution 4.0 License.

Hydrometeorological analysis and forecasting of a 3 d
flash-flood-triggering desert rainstorm
Yair Rinat1 , Francesco Marra1,2 , Moshe Armon1 , Asher Metzger1 , Yoav Levi3 , Pavel Khain3 , Elyakom Vadislavsky3 ,
Marcelo Rosensaft4 , and Efrat Morin1
1 Institute
          of Earth Sciences, The Hebrew University of Jerusalem, Jerusalem, Israel
2 Institute
          of Atmospheric Sciences and Climate, National Research Council of Italy, ISAC-CNR, Bologna, Italy
3 Israel Meteorological Service, Beit Dagan, Israel
4 Geological Survey of Israel, Jerusalem, Israel

Correspondence: Yair Rinat (yair.rinat@mail.huji.ac.il)

Received: 11 June 2020 – Discussion started: 2 July 2020
Revised: 18 November 2020 – Accepted: 2 January 2021 – Published: 10 March 2021

Abstract. Flash floods are among the most devastating and         might lead to fatal decision making. To cope with such er-
lethal natural hazards. In 2018, three flash-flood episodes re-   rors, a novel cost-effective methodology is applied by spa-
sulted in 46 casualties in the deserts of Israel and Jordan       tially shifting the forecasted precipitation fields. In this way,
alone. This paper presents the hydrometeorological analysis       flash-flood occurrences were captured in most of the sub-
and forecasting of a substantial storm (25–27 April 2018)         basins, resulting in few false alarms.
that hit an arid desert basin (Zin, ∼ 1400 km2 , southern Is-
rael) claiming 12 human lives. This paper aims to (a) spa-
tially assess the severity of the storm, (b) quantify the
timescale of the hydrological response, and (c) evaluate the      1   Introduction
available operational precipitation forecasting. Return peri-
ods of the storm’s maximal rain intensities were derived lo-      Flash floods are rapidly evolving events characterized by a
cally at 1 km2 resolution using weather radar data and a novel    sudden rise in stream water level and discharge (Sene, 2013).
statistical methodology. A high-resolution grid-based hydro-      These events often result in casualties and damage (Barredo,
logical model was used to study the intra-basin flash-flood       2007; Borga et al., 2019; Doocy et al., 2013; Grodek et al.,
magnitudes which were consistent with direct information          2012; Petrucci et al., 2019; Vinet et al., 2019) and are
from witnesses. The model was further used to examine the         ranked among the most devastating natural hazards world-
hydrological response to different forecast scenarios. A small    wide (Barredo, 2007; Borga et al., 2014; Doocy et al., 2013;
portion of the basin (1 %–20 %) experienced extreme precip-       Gaume et al., 2009; Gruntfest and Handmer, 2001; Marchi
itation intensities (75- to 100-year return period), resulting    et al., 2010; Sene, 2013).
in a local hydrological response of a high magnitude (10-            Flash-flood conditions are frequently found in arid and
to 50-year return period). Hillslope runoff, initiated minutes    semiarid regions (Nicholson, 2011; Pilgrim et al., 1988;
after the intense rainfall occurred, reached the streams and      Schick, 1988; Simmers, 2003; Tooth, 2000) as these ar-
resulted in peak discharge within tens of minutes. Available      eas are generally characterized by localized high rainfall
deterministic operational precipitation forecasts poorly pre-     intensities (Sharon, 1972), low precipitation interception,
dicted the hydrological response in the studied basins (tens      and low infiltration rates due to sparse vegetation coverage
to hundreds of square kilometers) mostly due to location in-      (Danin, 1983) and exposed bedrock surfaces that are partially
accuracy. There was no gain from assimilating radar esti-         covered by shallow, clay-rich, undeveloped soils (Singer,
mates in the numerical weather prediction model. Therefore,       2007). Although arid and semiarid regions cover more than
we suggest using deterministic forecasts with caution as it       a third of the world’s land area, knowledge of flash-flood-
                                                                  generating rainfall properties, hydrological response, and

Published by Copernicus Publications on behalf of the European Geosciences Union.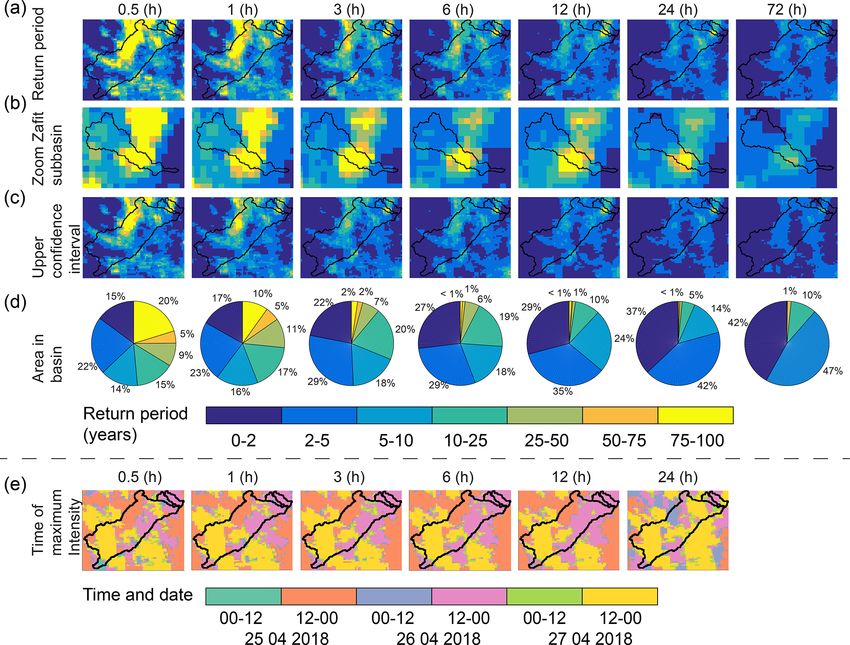
918         Y. Rinat et al.: Hydrometeorological analysis and forecasting of a 3 d flash-flood-triggering desert rainstorm

flood-forecasting skills in these areas is limited due to poor      time for 14 arid basins (202–1232 km2 ) in Israel is on the
measurements, sparse documentation, and a relatively small          order of tens of minutes to several hours.
number of studies (Armon et al., 2018; Nicholson, 2011;                To increase flash-flood predictability and extend the
Simmers, 2003; Yang et al., 2017; Zoccatelli et al., 2019).         lead time, accurate rainfall forecasting is required (Alfieri
   Rainstorm patterns in arid regions are characterized by lo-      et al., 2012; Sene, 2013). Commonly used methods in-
calized structures of high rainfall intensities, termed convec-     clude weather prediction models and nowcasting techniques.
tive rain cells (e.g., Karklinsky and Morin, 2006; Morin and        Global weather prediction models are routinely used by
Yakir, 2014; Nicholson, 2011; Sharon, 1972). During rain-           meteorological agencies worldwide, but their spatiotempo-
storms, one or more convective rain cells can deliver rela-         ral scales are too coarse for flash-flood applications (Sene,
tively large rainfall amounts over small areas in a short time,     2013). In recent years, convection-permitting models with a
directly contributing to runoff initiation and flash-flood oc-      spatial resolution of ≤ 3 km have enabled explicit represen-
currence (Archer et al., 2007; Borga et al., 2007; Chappell,        tation of the convective process, providing better represen-
1986; Delrieu et al., 2005; Doswell et al., 1996; Gaume et al.,     tation of rainfall and better forecast skills on the flash-flood
2016; Marchi et al., 2010; Yakir and Morin, 2011). Yakir and        scale (Armon et al., 2020; Clark et al., 2016; Khain et al.,
Morin (2011) found that flash floods in arid regions can oc-        2019; Prein et al., 2015). However, the finer scale increases
cur as a result of a single rain cell and that the flood’s magni-   the sensitivity of these models to initial conditions, leading
tude is sensitive to its starting location, direction, and veloc-   to spatial uncertainties in their output (Bartsotas et al., 2016;
ity. Belachsen et al. (2017) found that, in arid regions, storms    Ben Bouallègue and Theis, 2014; Collier, 2007; Sivakumar,
that generate flash floods are characterized by rain cells with     2017). To cope with these limitations, radar rainfall estimates
larger area, lower advection velocity, and longer lifetime than     are routinely assimilated into the models (Clark et al., 2016;
storms that do not produce flash floods. Furthermore, rain-         Stephan et al., 2008). Nevertheless, spatial and temporal un-
gauge networks are unable to adequately sample the spotty           certainties in individual forecasts are still observed, and mul-
precipitation patterns (Faurès et al., 1995; Kampf et al., 2018;    tiple model runs should therefore be considered in a prob-
Michaud and Sorooshian, 1994; Wheater et al., 2008), lim-           abilistic ensemble framework (Ben Bouallègue and Theis,
iting our knowledge of rainfall climatology and frequency           2014; Dey and Yan, 2016).
(Marra et al., 2019a; Marra and Morin, 2015).                          In general, flash floods remain a poorly understood and
   As a result of the complex rainfall patterns, runoff in          documented process (Borga et al., 2019; Foody et al., 2004;
arid and semiarid regions is often unexpected, localized,           Gaume et al., 2009; Nicholson, 2011; Wheater et al., 2008)
and characterized by high temporal variability (Morin et al.,       despite their devastating potential (Borga et al., 2019; Gaume
2009b; Nicholson, 2011). Hillslope runoff does not always           et al., 2009; Inbar, 2019; Tarolli et al., 2012; Sen, 2008)
reach the stream network (Shmilovitz et al., 2020; Yair             and increasing impact (Doocy et al., 2013; Wittenberg et al.,
et al., 1980; Yair and Kossovsky, 2002; Yair and Raz-Yassif,        2007), especially in arid areas (Zoccatelli et al., 2019, 2020).
2004), and transmission losses can further enhance the intra-       The present work aims to increase our understanding and
basin complexities and runoff localization (Greenbaum et al.,       knowledge of desert flash floods and to test practical forecast-
2002a; Morin et al., 2009a; Walters, 1990). Even in the most        ing abilities by presenting a comprehensive study of the rain-
extreme events, only part of the basin contributes runoff           storm of 25–27 April 2018 that hit the arid Zin basin in south-
(Nicholson, 2011; Pilgrim et al., 1988; Yang et al., 2017).         ern Israel (1400 km2 ; Fig. 1), causing one of the most fatal
   The devastating effect of flash floods is attributed not only    desert flash floods ever recorded in the region. The storm’s
to the magnitude of the event but also to their fast develop-       highest impact occurred during the day of 26 April, trigger-
ment and unexpected occurrence. When individuals or com-            ing a flash flood in the small (46 km2 ) Zafit subbasin (Fig. 1b,
munities are not aware of the approaching danger, they are          c). Rainstorm analysis was applied to all 3 d; however, its re-
unable to escape or protect themselves (e.g., Borga et al.,         sults and direct information from eyewitnesses led us to fo-
2019; Creutin et al., 2013). Thus, effective early warning of       cus the hydrological and forecasting analyses mainly on the
flash floods greatly depends on the time between the center of      second day of the storm, 26 April.
mass of the excess rainfall and the peak discharge (Dingman,           Specifically, we addressed the following questions.
2015; USGS, 2012), termed lag time, and the time available          (a) What was the severity of the storm and flood and how did
between the issuing of the forecast and the peak discharge          it vary spatially? (b) What was the time scale of the flash-
(Sene, 2013), termed lead time. The former is dictated by           flood response? (c) What was the operational predictability
nature, while the latter also depends on the accuracy and ef-       of the rainfall and the resulting flash floods and can it be im-
fectiveness of the forecasting chain. Creutin et al. (2013) and     proved? To answer these questions, we combined datasets
Marchi et al. (2010) calculated lag times for Europe under          and tools, including radar rainfall data, operational rainfall
various climate regimes and found that it increases with basin      forecasts, rainfall and flood-frequency analyses and their spa-
area and follows a general power-law behavior, in which             tial variations, a grid-based hydrological model, and unique
basins in areas smaller than 100 km2 often had lag times of         direct field observations during the event.
less than 1 h. Zoccatelli et al. (2019) found that the mean lag

Nat. Hazards Earth Syst. Sci., 21, 917–939, 2021                                     https://doi.org/10.5194/nhess-21-917-2021
Y. Rinat et al.: Hydrometeorological analysis and forecasting of a 3 d flash-flood-triggering desert rainstorm 919
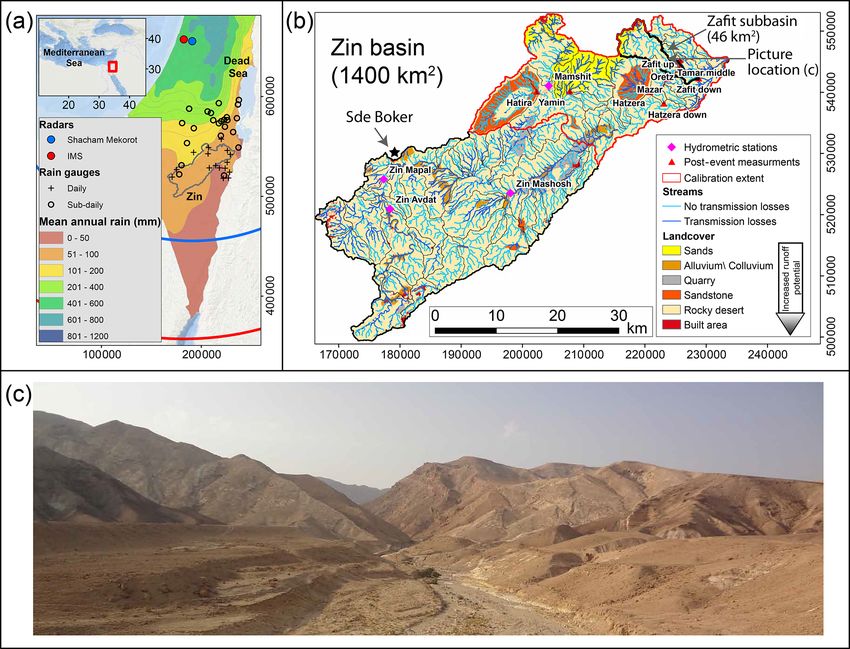
Figure 1. (a) Mean annual rain depth map of Israel (1960–1990, Israel Meteorological Service), daily and sub-daily rain gauges, and the
Zin basin location. Extents and locations of the Shacham–Mekorot and the Israel Meteorological Service C-band radars are in blue and red,
respectively. Inset in (a) is a general location map. Map coordinates (in m) are of the Israeli Transverse Mercator grid, while for the inset, the
geographic coordinate system is used. The World Ocean Basemap by Esri is used as the background. (b) The Zin basin and its 57 subbasins
(thin brown lines). The Zafit subbasin is outlined in a bold black line. Hydrometric stations are shown as pink diamonds, and locations
of post-event estimations are marked by red triangles. (c) Photograph of Zafit basin taken toward the northwest; the location is marked in
panel (b).
The paper is arranged as follows. The research area and western part of the basin is covered by thin layers of lithosols
data are presented in Sect. 2. Section 3 describes the rain- that become scarce to the east, exposing the bedrock (Dan
storm and presents a spatial rainfall return period analysis. et al., 1975; Singer, 2007). Vegetation is extremely sparse,
Sections 4 and 5 focus on the hydrological response and op- mainly concentrated in stream channels, and its abundance
erational forecast analysis of the flash flood on 26 April 2018, decreases from west to east (Danin, 1983). We classified six
respectively, Sect. 6 includes a short discussion, and Sect. 7 hydrological domains in the basin according to the lithology,
presents our conclusions. soil, and land use (Fig. 1b): rocky desert (80 %), sand (6 %),
sandstone (5 %), alluvium/colluvium (4 %), quarry (3 %),
and built area (2 %). Alluvial and sandy channel sections
2 Study area and data were identified as areas in which transmission losses occur
(Greenbaum et al., 2002a, 2006; Schick, 1988; Schwartz,
The Zin basin (∼ 1400 km2 ) drains the mountains of the 2001; Tooth, 2000; Wheater et al., 2008).
Negev desert, southern Israel, to the Dead Sea (Fig. 1). The
basin orientation is from southwest to northeast, and eleva- 2.1 Meteorological and hydrological setting
tion drops from 1000 m above sea level to 380 m below sea
level. Slopes are low to moderate (0–10◦ ) in 75 % of the basin Mean annual rainfall ranges from 90 mm in the elevated
but can be as high as 60–80° locally (e.g., Fig. 1c). The main western part of the basin to 60 mm in the lower eastern part.
exposed lithology consists of limestone (54 %), chalk and The rainy season spans October to May, with most of the
chert (27 %), lithified sandstones (7 %), non-lithified sand rain (> 60 %) falling from December to February. Rainy days
(5 %), alluvium (4 %), and marl (3 %) (Sneh et al., 1998). The (≥ 1 mm) are rare, and the annual average is 16 d on the west-
https://doi.org/10.5194/nhess-21-917-2021 Nat. Hazards Earth Syst. Sci., 21, 917–939, 2021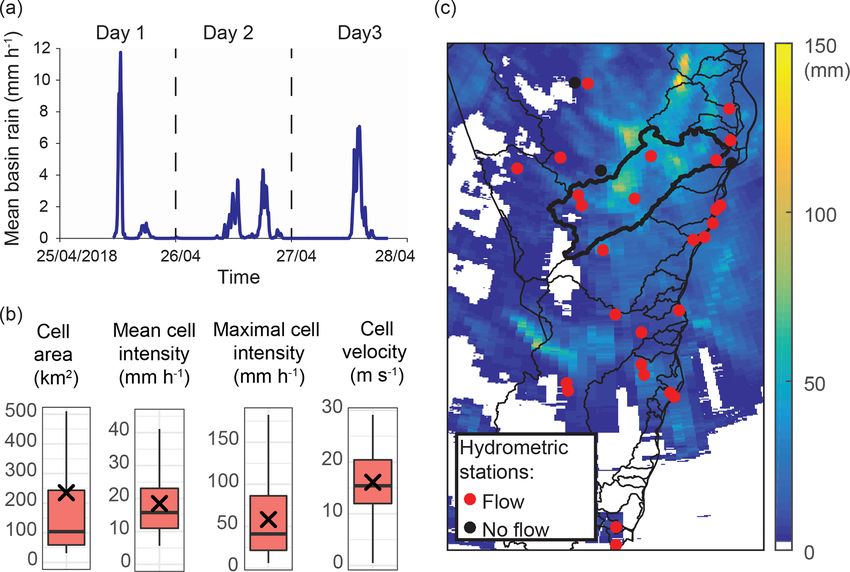
920        Y. Rinat et al.: Hydrometeorological analysis and forecasting of a 3 d flash-flood-triggering desert rainstorm

ern side and 8 d on the eastern side of the basin (IMS, 2020;    event surveys and analyses were conducted to estimate the
averaged over 1980–2009). The mean annual potential evap-        flood’s peak discharge in nine ungauged locations (Fig. 1b;
oration is ∼ 2600 mm; in the winter, it ranges from 2.6 to       Table 1). High water marks were identified, channel cross
4.6 mm d−1 in the western and eastern parts of the basin,        sections were measured, and Manning roughness coefficients
respectively. In the autumn and spring, the mean potential       were estimated (Benson and Dalrymple, 1967; Gaume and
evaporation spans 6.0 to 9.3 mm d−1 with an increasing gra-      Borga, 2008; Limerinos, 1970). Lastly, peak discharges were
dient from west to east (Goldreich, 2003).                       estimated using the HEC-RAS software (Brunner, 2016).
   Most flash floods (58 %) occur during the winter months,
from December to February, and 42 % occur in the transi-
tion seasons (based on 107 flash-flood events recorded at the    3     Rainstorm analysis
Zin Mapal station from 1954 to 2016; Fig. 1). Kahana et al.
                                                                 3.1    General storm description
(2002) reported that most flash floods in the region can be
attributed to well-defined synoptic systems. About a third of    The studied rainstorm occurred over 3 consecutive days from
the events are associated with Mediterranean cyclones, occur     25 to 27 April 2018 and covered most of the southern Is-
mainly during the winter, and include a wide range of mag-       raeli desert. It resulted from an upper-troposphere low ar-
nitudes, and the rest occur during the transition seasons and    riving at the eastern Mediterranean from the west. Moisture
are associated with flash floods of medium to extreme magni-     was available due to the slow passage of the cyclone over
tudes. The maximal specific peak discharge measured at the       the Mediterranean Sea. This cyclone triggered highly de-
Zin Mapal hydrometric station was 2.27 m3 s−1 km−2 (Octo-        veloped convective clouds that roughly followed the upper-
ber 1991, 234 km2 ; Fig. 1b). The maximal specific peak dis-     level low-pressure center (Dayan et al., 2020). Rainfall dy-
charge found in post-event surveys was 42 m3 s−1 km−2 (Oc-       namics followed a similar pattern during all 3 d, initiating in
tober 2004, 0.5 km2 , with 12 m3 s−1 km−2 in the Zafit sub-      the late morning (∼ 10:00 all times are in UTC+3) and last-
basin, 46 km2 ; Fig. 1b).                                        ing intermittently until the evening (20:00–23:00) (Fig. 2a).
                                                                 Rainfall over the Zin basin was of a convective nature char-
2.2   Hydrometeorological data                                   acterized by 474 rain cells with a mean rain-cell area of
                                                                 237 km2 , mean areal rain intensity of 18 mm h−1 , mean max-
The Zin basin is monitored by the Israel Meteorological Ser-     imal rain intensity of 57 mm h−1 , and mean rain-cell veloc-
vice (IMS) C-band Doppler radar which provides scans at a        ity of 16 m s−1 (Fig. 2b; calculated over the Zin basin using
temporal resolution of ∼ 5 min and was used for the stud-        a threshold of 5 mm h−1 to determine rain-cell boundaries,
ied rainstorm. The area was also covered by the Shacham–         following Belachsen et al., 2017). The mean rain-cell area
Mekorot C-band radar, which has a 24-year-long record            was similar to that estimated by Belachsen et al. (2017) for
(operational up to 2015; see details in Marra and Morin,         29 flash-flood events in two basins draining into the Dead
2015) and was used for spatial rainfall-frequency analy-         Sea (Fig. 1a), while mean and maximum rain intensity and
sis (Sect. 3.2). Both radars are located north of the basin      cell velocity were, on average, higher in the current analyzed
(Fig. 1a). Two rain gauges with a temporal resolution of         storm (Fig. 2b). This multiday convective rainstorm resulted
10 min and eight rain gauges that provide only daily data        in an extensive hydrological response, and flash floods were
monitor the basin (Fig. 1a). Radar reflectivity data for the     recorded at 27 of the 30 (90 %) active hydrometric stations
rainstorm were corrected for beam blockage and attenuation       in the area of Fig. 2c.
due to heavy rainfall. Rain intensity was calculated using a
fixed Z–R relation well suited for convective precipitation in   3.2    Estimation of rainstorm return period
the area (Z = 316 · R 1.5 ) and converted to a 500 × 500 m2
Cartesian grid (see Appendix in Marra and Morin, 2018).          Estimating the probability of exceedance of the rainfall in-
Accumulated rain depths measured at 39 rain gauges in the        tensities observed during the storm is important to improve
basin’s vicinity (Fig. 1a) were used to correct the residual     flash-flood warning systems, the design and operation of wa-
bias for the analyzed storm using an adaptive multiquadratic     ter resource projects, and risk and damage estimations for in-
surface-fitting algorithm (Amponsah et al., 2016; Martens        surance policies (Brutsaert, 2005; Chow et al., 1988; Larsen
et al., 2013). An upper cap of 150 mm h−1 was applied on         et al., 2001). Traditionally, this information is derived from
the adjusted estimates to reduce errors caused by the pres-      rain gauges by exploiting their relatively long and homoge-
ence of hail (Marra and Morin, 2015). Class A evaporation        neous records (Dey et al., 2016); however, especially in arid
pan measurements from Sde Boker (Fig. 1b) were used to           areas, rain gauges are generally sparsely distributed, result-
evaluate daily potential evaporation rates.                      ing in an insufficient representation of the storm’s spatiotem-
   The Zin basin includes four active hydrometric stations;      poral heterogeneity (Marra and Morin, 2018) on the one hand
however, only the Mamshit hydrometric station is situated in     and of the climatic gradients of the region on the other (Kidd
the area influenced by the storm’s core (Fig. 1b; Table 1). To   et al., 2017; Marra and Morin, 2015).
overcome the poor spatial representation of flood data, post-

Nat. Hazards Earth Syst. Sci., 21, 917–939, 2021                                 https://doi.org/10.5194/nhess-21-917-2021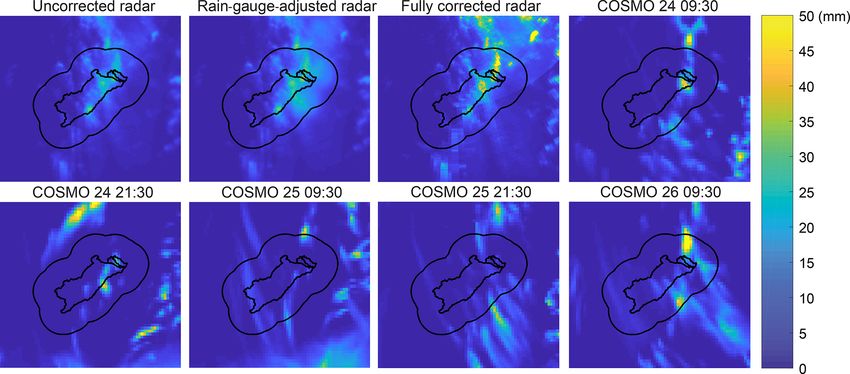
Y. Rinat et al.: Hydrometeorological analysis and forecasting of a 3 d flash-flood-triggering desert rainstorm                                      921

Table 1. Measured and modeled peak discharges for the Zin case study. Uncertainly limits refer to error estimations in the measured peak
discharge.

      Subbasin name    Area    Post-event analysis   Storm day    Measured peak    Lower uncertainty   Upper uncertainty    Modeled peak    Used for
                      (km2 )   (P)/hydrometric                         discharge               limit               limit        discharge   calibration
                               station (H)                        (m3 s−1 km−2 )     (m3 s−1 km−2 )      (m3 s−1 km−2 )    (m3 s−1 km−2 )   (C)
 1    Mamshit            59    H                     25/04/2018              1.5                 1.3                 1.6              0.4   C
 2    Zin Mashosh       674    H                     25/04/2018              0.0                 0.0                 0.0              0.2
 3    Zin Avdat         125    H                     25/04/2018              0.0                 0.0                 0.0              0.0
 4    Hatira crater      58    P                     25/04/2018              0.9                 0.8                 0.9              1.0   C
 5    Zafit 1            36    P                     26/04/2018              1.3                 1.1                 1.5              1.1   C
 6    Zafit 2            41    P                     26/04/2018              1.9                 1.7                 2.1              1.6   C
 7    Zafit 3            46    P                     26/04/2018              1.7                 1.5                 1.8              1.4   C
 8    Tamar 1             4    P                     26/04/2018              2.8                 1.2                 4.7              2.9   C
 9    Oretz               5    P                     26/04/2018              8.2                 7.8                 9.2              7.0   C
 10   Mazar               3    P                     26/04/2018              6.4                 5.7                 6.8              5.0   C
 11   Mamshit            59    H                     26/04/2018              1.3                 1.1                 1.4              0.5   C
 12   Zin Mashosh       674    H                     26/04/2018              0.1                 0.1                 0.1              0.0
 13   Zin Avdat         125    H                     26/04/2018              0.0                 0.0                 0.0              0.0
 14   Mamshit            59    H                     27/04/2018              1.7                 1.5                 1.9              0.3   C
 15   Zin Mashosh       674    H                     27/04/2018              0.8                 0.7                 0.8              1.2
 16   Zin Mapal         234    H                     27/04/2018              0.0                 0.0                 0.0              0.0
 17   Zin Avdat         125    H                     27/04/2018              0.0                 0.0                 0.0              0.0
 18   Yamin              31    P                     27/04/2018              4.3                 3.9                 4.7              4.1   C
 19   Hatzera            56    P                     27/04/2018              1.6                 1.4                 1.8              0.7   C

Figure 2. Properties of the 25–27 April 2018 rainstorm. Panel (a) shows the 5 min rain intensity spatially averaged over the Zin basin.
(b) Rain-cell area, mean and maximal rain-cell intensity, and rain-cell velocity calculated over the Zin basin. Crosses represent the mean,
horizontal lines are the median, colored areas represent the narrowest 50 % of the data, and the whisker limits represent the minimal and
maximal values except when 150 % of the interquartile range is exceeded. (c) Total storm rain depth from the radar analysis and location of
hydrometric stations. Stations that exhibited at least one flash flood during the rainstorm are marked in red. The Zin basin is marked by a
bold outline.

   Applying traditional approaches to the studied storm us-                   tense rainfall did not occur in this particular location during
ing one of the sub-daily rain gauges around the Zin basin                     the storm. At the same time, a direct comparison of weather
(Sde Boker; Fig. 1a; Marra and Morin, 2015) results in re-                    radar estimates to frequency analyses based on this station
turn periods of less than a year for many durations (0.5, 1, 3,               would be hampered by the strong climatic and topographic
24, and 72 h; not shown). However, this is misleading as in-                  gradients characterizing the region (IMS, 2020; Marra et al.,

https://doi.org/10.5194/nhess-21-917-2021                                                Nat. Hazards Earth Syst. Sci., 21, 917–939, 2021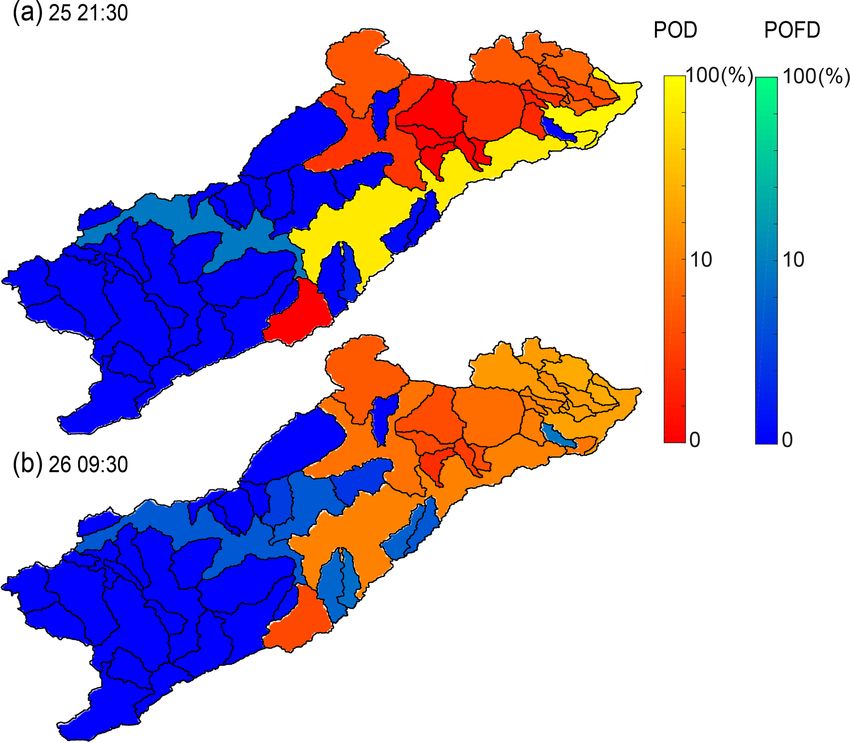
922        Y. Rinat et al.: Hydrometeorological analysis and forecasting of a 3 d flash-flood-triggering desert rainstorm

2017): largely different frequency curves are to be expected      temporal scale of convective cells, this problem should be
within the Zin catchment due to gradients in both the inten-      negligible for longer durations (> 3 h).
sity and frequency of occurrence of precipitation events (e.g.,      This application revealed the high spatiotemporal hetero-
see Marra et al., 2019a). Therefore, different data sources       geneity of the rain intensities during the storm, clearly show-
should be explored.                                               ing that using a single value for the entire region would
   Remotely sensed datasets, such as weather radar archives,      lead to an incomplete, if not erroneous, interpretation. Even
may provide the required distributed information, and their       when observing the short durations (0.5–1 h), only 10 %–
use for precipitation-frequency analyses is becoming more         20 % of the Zin basin experienced long return period inten-
and more quantitatively reliable due to the increasing length     sities, while ∼ 40 % of the basin was characterized by return
of the data records and improvements in the statistical tech-     periods of 0–5 years (Fig. 3d). Rain-intensity timing maps
niques (Marra et al., 2019a). To obtain reasonable estimates      (Fig. 3e) revealed that the high rain intensities in the north-
of storm frequency for sub-daily durations and through-           ern part of the Zin basin and in the Zafit subbasin occurred on
out the catchment, we took advantage of the 24-year-long          different days: 25 and 26 April (12:00–24:00), respectively.
Shacham–Mekorot weather radar archive (Marra and Morin,
2015) and of the novel metastatistical extreme value (MEV)
framework (Marani and Ignaccolo, 2015). This latter method        4     Hydrological analysis
optimizes the use of short data records (Zorzetto et al.,
                                                                  4.1     The GB-HYDRA hydrological model application
2016) and is less sensitive to the measurement errors typ-
ical of weather radars than classical methods based on ex-        GB-HYDRA is a high-resolution distributed hydrological
treme value theory (Marra et al., 2018). Independent pre-         model designed to study flash-flood dynamics in medium
cipitation events were separated using the methodology de-        to small Mediterranean basins (Rinat et al., 2018). For the
tailed in Marra et al. (2018), and a single-event-type simpli-    present study, additional components were included in the
fied MEV approach (Marra et al., 2019b) was used for the          model to allow for the description of the arid environ-
analyses due to its robustness for the small number of rain       ment (Fig. 4; Appendix A). The modified model was used
events per year recorded in the area (Miniussi and Marani,        at high spatiotemporal resolution (50 × 50 m2 ; < 60 s) to
2020).                                                            study the hydrological responses of 57 subbasins (Table 2).
   Maximum precipitation intensities observed during the          Thus, propagation of various hydrological properties can be
storm for durations of 0.5, 1, 3, 6, 12, 24, and 72 h were de-    monitored, including the identification of specific runoff-
rived for each radar pixel of the IMS radar, and spatial return   generating areas that directly contribute to stream discharge
period maps obtained by comparing these intensities to the        (referred to hereafter as runoff-contributing area, RCA; see
above-described frequency curves based on the long radar          Rinat et al., 2018, for further details). Calibration results
archive are presented in Fig. 3a and b. Such return periods       (see Appendix A for further details) pointed to adequate
are to be interpreted as local, meaning that they represent       model performance and its use for this specific study (R 2 =
the probability of exceeding the observed intensities in each     0.94; RMSD = 0.65 m3 s−1 km−2 ; bias = 0.35 m3 s−1 km−2 ;
pixel independently, and the gained output therefore offers       Fig. 5; Table 1).
a comprehensive spatial picture. Uncertainty related to the
available data record was quantified via bootstrapping with       4.1.1    Using direct observations for spatial model
replacements (250 repetitions) among the years in the record               validation and flash-flood initiation
(Overeem et al., 2008). We prudently estimate the return pe-
riod of the observed amounts by relying on the 95th quantile      A unique field observation from the second storm day
of the bootstrap, meaning that the return period we commu-        (26 April) provided a full description of runoff initiation in
nicate was exceeded with 95 % probability. The spatial dis-       this arid environment, allowing us to obtain a spatial valida-
tribution of each return period in the Zin basin (Fig. 3d) and    tion of the model. Two scientists from the Hebrew University
the timing of maximal intensity (Fig. 3e) were evaluated.         of Jerusalem who were, coincidentally, in the Zafit subbasin
   The spatial return period maps indicated two main ar-          during the storm (“observation point” in Fig. 6b) fully docu-
eas characterized by extreme (75–100 years and 95 % un-           mented and timed the processes of rainfall, hillslope runoff,
certainty range of 25–100 years) short-duration (0.5–1 h) in-     and stream-discharge initiation. Their location and timing
tensities; one in the north-central part of the Zin basin and     concurred with the radar-observed extreme rainfall intensi-
the other in the central part of the Zafit subbasin (Fig. 3a,     ties (see Sect. 3.2 for further details). Model simulations were
b). Conversely, only the central part of the Zafit subbasin       validated against the observations, providing support for their
(Fig. 1b) experienced rainfall with long return periods for       validity. Agreement was found between field observations,
all durations (75–100 years for durations of 3–24 h and 10–       weather radar estimates, and model results for the timing of
25 years for durations of 72 h). One should consider that rain    rainfall, RCA, and stream-runoff generation (Fig. 6; Table 3;
intensities over short durations might be biased due to the       Video supplement).
interpretation of hail as intense rainfall, whereas, due to the

Nat. Hazards Earth Syst. Sci., 21, 917–939, 2021                                   https://doi.org/10.5194/nhess-21-917-2021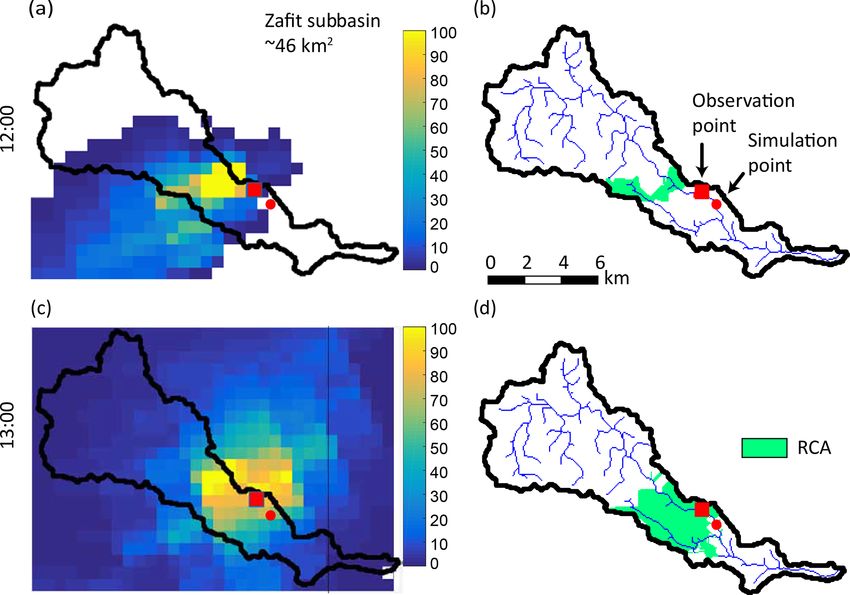
Y. Rinat et al.: Hydrometeorological analysis and forecasting of a 3 d flash-flood-triggering desert rainstorm                                   923

Table 2. Zin subbasin properties, peak discharge for return periods using generalized extreme value (GEV) fit, and the estimated flash-flood
return period category based on the modeled peak discharge of 26 April. ITM signifies Israeli Transverse Mercator.

                                         Outlet coordinates                            Storm peak discharge thresholds      Flash-flood return
            General properties           (ITM coordinates)          Main channel      (m3 s−1 km−2 ) for return period of   period category
       Subbasin name          Area            X               Y   Length   Gradient   2 years   10 years        50 years    26 Apr 2018
                             (km2 )                                 (km)   (m m−1 )
       Zafit 1                     36   225545.9   543964.9          17       0.03        0.1        1.0             2.9    Large
       Zafit 2                     41   225933.7   543026.4          18       0.03        0.1        0.9             2.7    Large
       Zafit 3                     46   228781.9   542284.8          22       0.03        0.1        0.8             2.5    Large
       Tamar 1                      4    225583    545040.5           4       0.09        0.5        3.6            10.7    Moderate
       Tamar 2                     13   231184.3   543856.5          11       0.06        0.3        1.8             5.5    Moderate
       Peres 1                     11   225003.6   549724.9           7       0.02        0.3        2.0             6.1    Moderate
       Peres 2                     27   227855.8   545777.4          13       0.04        0.2        1.2             3.5    Moderate
       Peres 3                     33   231120.8   543930.6          17       0.04        0.1        1.0             3.1    Moderate
       Oretz                        5   225441.5   543722.9           5       0.07        0.5        3.3            10.0    Large
       Mazar                        3   223643.7   542279.6           4       0.08        0.6        4.4            13.1    Large
       Tznim                        5   226532.9   537850.4           5       0.04        0.5        3.2             9.5    Low
       Hatzera crater              48   220789.4   540072.3           8       0.06        0.1        0.8             2.4    Moderate
       Mitzlaot                     4   217588.5   534839.3           5       0.08        0.5        3.5            10.6    Moderate
       Akrabim                      6    216853    534077.3           6       0.08        0.4        3.0             8.9    Large
       Gov                          9   212688.4   532775.5           8       0.06        0.3        2.3             6.8    Large
       Koshesh                     11   211487.2   531616.6           9       0.02        0.3        2.0             6.1    Low
       Hatira                     270   210785.4   531523.4          33       0.02        0.0        0.3             0.8    Large
       Taban                       12   210090.2   530494.8           9       0.02        0.3        1.9             5.7    Low
       Saraf                       11   202041.5   524774.5           8       0.03        0.3        2.1             6.2    Low
       Hagor                       18   201792.8   524726.9          12       0.03        0.2        1.5             4.4    Low
       Teref                       35   197294.9   520075.5          14       0.03        0.1        1.0             2.9    Moderate
       Deres                        6   196977.4   519842.6           5       0.06        0.4        3.0             8.9    Low
       Hava 3                      80   197104.4   520922.1          36       0.02        0.1        0.6             1.8    Low
       Hava 2                      43   189722.5   515032.5          24       0.01        0.1        0.9             2.6    Low
       Hava 1                      15    186140    508042.2          11       0.01        0.2        1.6             4.9    No flow
       Znim                        47    197152    522668.4          15       0.03        0.1        0.8             2.4    Low
       Zarhan                      35   194733.7     525092          14       0.02        0.1        1.0             2.9    Low
       Ofran                        9    193432    528404.6           6       0.06        0.3        2.3             7.0    Low
       Mador                       16   193532.5   528224.6           9       0.03        0.2        1.6             4.9    Low
       Talul                       15   191839.2   526446.6           7       0.05        0.2        1.6             4.9    Low
       Zakuf                        5   191299.4   526330.3           6       0.05        0.5        3.4            10.2    Low
       Zik                         23   189420.9   525880.4          10       0.04        0.2        1.3             3.8    Low
       Daroch                       6   186240.6     527759           7       0.05        0.4        2.9             8.7    No flow
       Akev                        55    181785    527642.6          27       0.02        0.1        0.7             2.2    No flow
       Divshon                     15   179996.4   527870.1          10       0.03        0.2        1.7             5.0    No flow
       Havarim                      9   178583.5   528330.5           6       0.02        0.3        2.2             6.7    Low
       Rahatz                       5   177091.3   523202.8           6       0.02        0.5        3.3            10.0    No flow
       Retamim                      5   176562.1   523176.4           4       0.02        0.5        3.2             9.7    Low
       Avdat                       89   176784.4   522139.2          15       0.02        0.1        0.6             1.7    No flow
       Nafha                        8   181435.8   516905.8           5       0.02        0.3        2.4             7.1    No flow
       Aricha                      15    177885    510921.9           5       0.02        0.2        1.7             5.0    No flow
       Zin 1                       44   177478.6   509734.5          15       0.01        0.1        0.8             2.5    No flow
       Zin Arava road            1238   228391.2   539351.6         119       0.01        0.0        0.1             0.3    Moderate
       Zin west Arava road       1227   225739.4   537627.1         115       0.01        0.0        0.1             0.3    Moderate
       Mamshit                     59   204285.9   541038.4          20       0.02        0.1        0.7             2.1    Moderate
       Zin Mashosh                674   198036.8   523528.1          73       0.01        0.0        0.2             0.5    Low
       Zin Mapal                  234   177335.7   525781.3          44       0.01        0.0        0.3             0.9    Low
       Zin Avdat                  125   178385.3   520923.2          37       0.01        0.1        0.4             1.3    No flow
       Avdat 1                     42   172308.8   517579.1           8       0.02        0.1        0.9             2.6    No flow
       Matred                      22   172134.9   517700.2          10       0.01        0.2        1.3             3.9    No flow
       Hatira crater               58   202335.8     540129          16       0.02        0.1        0.7             2.1    Low
       Kamus                       12   205836.8   538046.9           8       0.03        0.3        1.9             5.8    Low
       Yamin                       31   207729.8   540177.1          10       0.02        0.2        1.1             3.2    Moderate
       Ma’ale                       9   207728.5   539978.4           7       0.02        0.3        2.3             6.8    Large
       Golhan                      22   207185.3   536321.1          11       0.03        0.2        1.3             3.9    Low
       Zin outlet                1364   233607.6   545326.3         129       0.01        0.0        0.1             0.3    Moderate
       Hatzera                     56   223083.4   538185.4          12       0.05        0.1        0.7             2.2    Moderate

https://doi.org/10.5194/nhess-21-917-2021                                               Nat. Hazards Earth Syst. Sci., 21, 917–939, 2021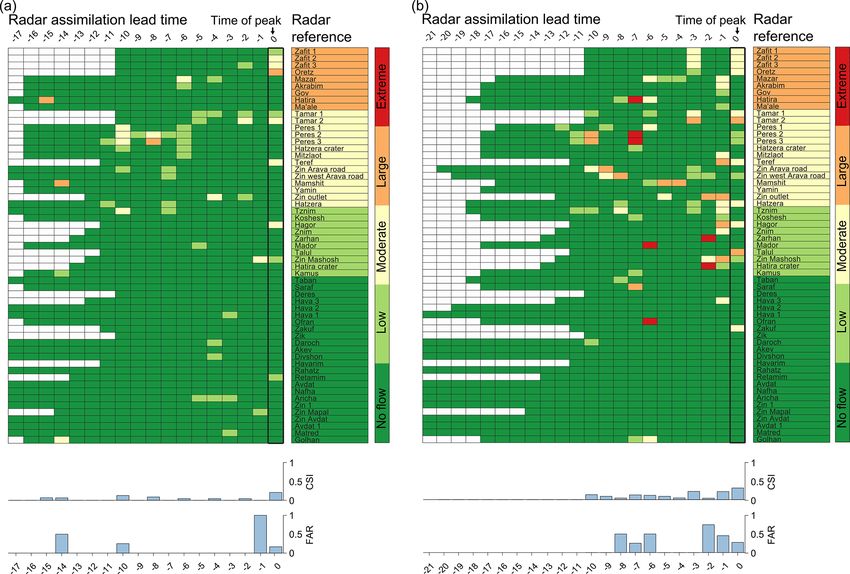
924          Y. Rinat et al.: Hydrometeorological analysis and forecasting of a 3 d flash-flood-triggering desert rainstorm

Figure 3. (a) Spatial return period maps for the studied storm. (b) Same as panel (a), zoomed in to the Zafit subbasin. (c) Upper confidence
interval (95 %) for the spatial return period maps. (d) Distribution of return periods in the Zin basin. (e) Timing of the maximal rainfall
intensities which was used to produce panels (a)–(d). All properties are presented for durations of 0.5–72 h. Zin basin and Zafit subbasin are
outlined in black.

Table 3. Field observations and model simulation results for the 26 April flash flood in Zafit subbasin.

                       Observation                                                      GB-HYDRA model
   Process                              Time (UTC+3)      Process                                                          Time (UTC+3)
   Rain initiation                      12:00             Rain cell reaches observers                                      12:00
   Hillslope runoff, no stream runoff   12:05             RCA and stream runoff were not identified                        12:05
   Rain stops                           12:10             –                                                                –
   Rain restarts                        12:50             Convective rain cell approaches from the north                   –
   Hillslope runoff                     12:57             RCA identification                                               13:00
   Stream flow                          13:00             Stream flow at simulation point (Fig. 3), peak at 13:20 UTC+3    13:00

4.2   Lag time                                                            (Fig. 7). Finally, the calculated lag times for the Zafit flash
                                                                          flood on 26 April was 22 and 28 min for the simulation point
                                                                          and subbasin outlet, respectively (Fig. 6). This short time em-
Basin lag time represents a simple, yet effective, way to es-             phasizes the difficulty in taking action after the rainfall starts
timate the basin hydrological response time. Excess rainfall              and the importance of an early warning.
was defined here as the difference between rain amounts and
initial abstractions (following Marchi et al., 2010), and rain-           4.3   Return periods of flash floods and their
fall separated by a hiatus greater than 1 h was not taken into                  classification
account. A positive correlation between calculated lag time
and basin area for each of the 3 d and for all subbasins with             Most subbasins in the Zin catchment are not monitored,
peak discharge > 5 m3 s−1 suggested that most of the cal-                 and therefore determining their flood return periods is not
culated lag-time values were on the order of tens of minutes              a trivial task (Haan, 2002). To overcome this, regional re-

Nat. Hazards Earth Syst. Sci., 21, 917–939, 2021                                            https://doi.org/10.5194/nhess-21-917-2021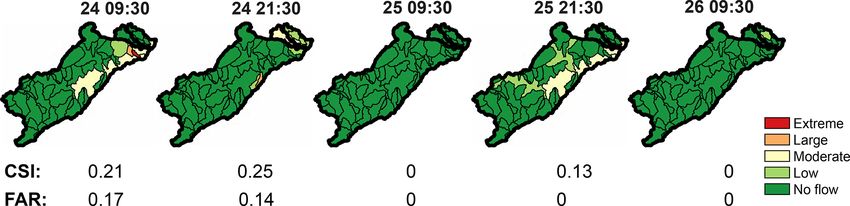
Y. Rinat et al.: Hydrometeorological analysis and forecasting of a 3 d flash-flood-triggering desert rainstorm 925
specific peak discharges for 18 hydrometric stations in the
region (21–59 years, draining 60–3350 km2 , depending on
the basin; data from four of these are shown in Fig. 8a; all
stations are in arid environments). Third, the specific peak-
discharge thresholds of the different categories (i.e., 2, 10,
and 50 years) were computed for each station using the GEV
curves (points in Fig. 8b). Fourth, a fit was applied to the
calculated thresholds of each category (not shown). Fifth, fi-
nal categories were determined by using percentiles of the
eastern Mediterranean envelope curve (Tarolli et al., 2012)
that match the fitted curves and the return periods detailed in
stage 1 (schematic colored areas in Fig. 8b).
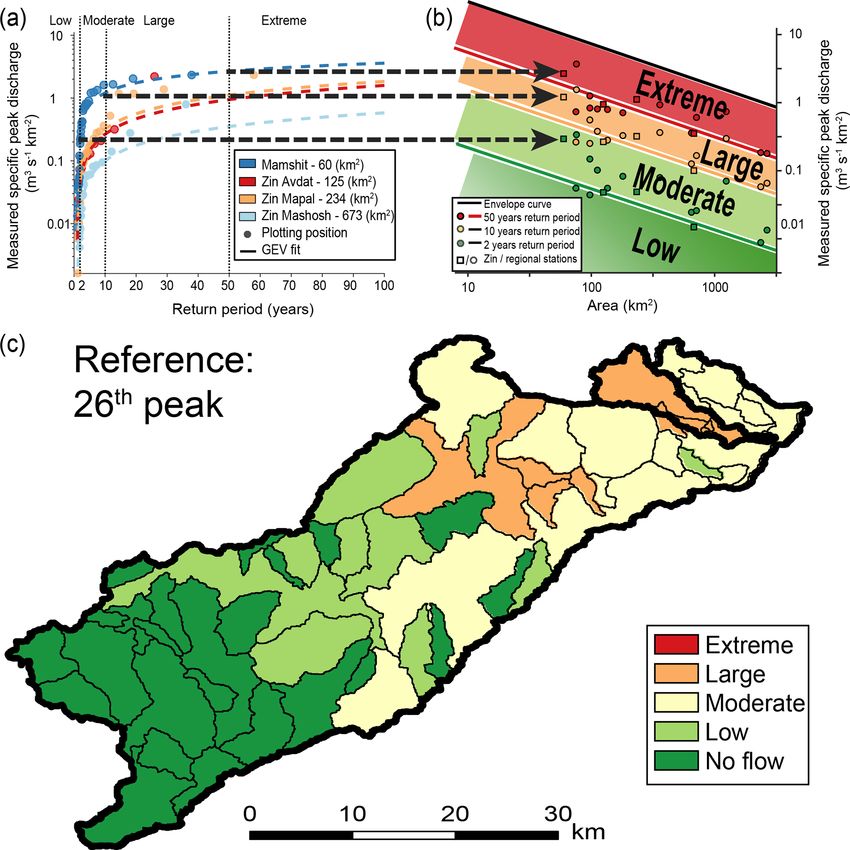
Using this analysis, the return period category of the
26 April (06:00–24:00) modeled peak discharge was defined
for each subbasin (Fig. 8c; Table 2). While moderate and
large flash floods occurred in the eastern part of the Zin basin,
no flash floods occurred in its western part
5 Evaluation of flash-flood forecast
5.1 The COSMO numerical weather prediction model
Figure 4. The modified GB-HYDRA model scheme, processes, and
inputs. Further details are given in Appendix A and in Rinat et al. COSMO (COnsortium for Small-scale MOdeling) is a non-
(2018). hydrostatic regional numerical weather prediction (NWP)
model used by the IMS for operational forecasting (Baldauf
et al., 2011; Doms et al., 2011). The model spatial resolution
is ∼ 2.5 km, which enables explicitly resolving the convec-
tive processes. Initial and boundary conditions are obtained
from the integrated forecasting system (IFS) model run
by the European Centre for Medium-Range Weather Fore-
casts (ECMWF). Real-time, 10 min, rain-gauge-corrected,
1 × 1 km2 resolution IMS radar rainfall data are assimilated
into the COSMO model to improve its prediction (Stephan
et al., 2008).
To assess and study the rainfall forecast’s ability to pre-
dict such local events, different COSMO forecast runs were
used as input for the GB-HYDRA model, and the forecasted
26 April flash-flood category for each subbasin was calcu-
lated. The IMS weather radar measurements, available in real
Figure 5. Measured vs. modeled specific peak discharge and er- time, were fed into the GB-HYDRA hydrological model,
ror metrics for 12 peak discharges during the 3 d period of the and initial conditions were calculated. The resulting calcu-
storm. Horizontal error bars represent measured peak discharge un- lated flood categories were compared qualitatively and quan-
certainty. Subbasins considered in the calibration process are from titatively to the flash-flood reference categories (Fig. 8c).
the eastern side of the catchment (Fig. 1). For each run, the quantitative evaluation critical success in-
dex (CSI), false alarm ratio (FAR), probability of detection
(POD), and probability of false detection (POFD) were cal-
lations between specific peak discharges and basin areas culated (Sene, 2013; Wilks, 2006). Flash-flood categories of
were calculated to define categories of return periods. First, moderate or above were used as the threshold.
five categories of flash-flood return periods were determined:
extreme (> 50 years), large (10–50 years), moderate (2– 5.2 Forecasted peak discharge
10 years), low (< 2 years), or no flow. Second, flood re-
turn period curves were built using generalized extreme value Two sets of COSMO rainfall forecast runs produced using
(GEV) analysis (applying the probability weighted moments different methodologies of real-time radar measurement as-
method; Hosking et al., 1985) and annual series of measured similation are presented in the following.
https://doi.org/10.5194/nhess-21-917-2021 Nat. Hazards Earth Syst. Sci., 21, 917–939, 2021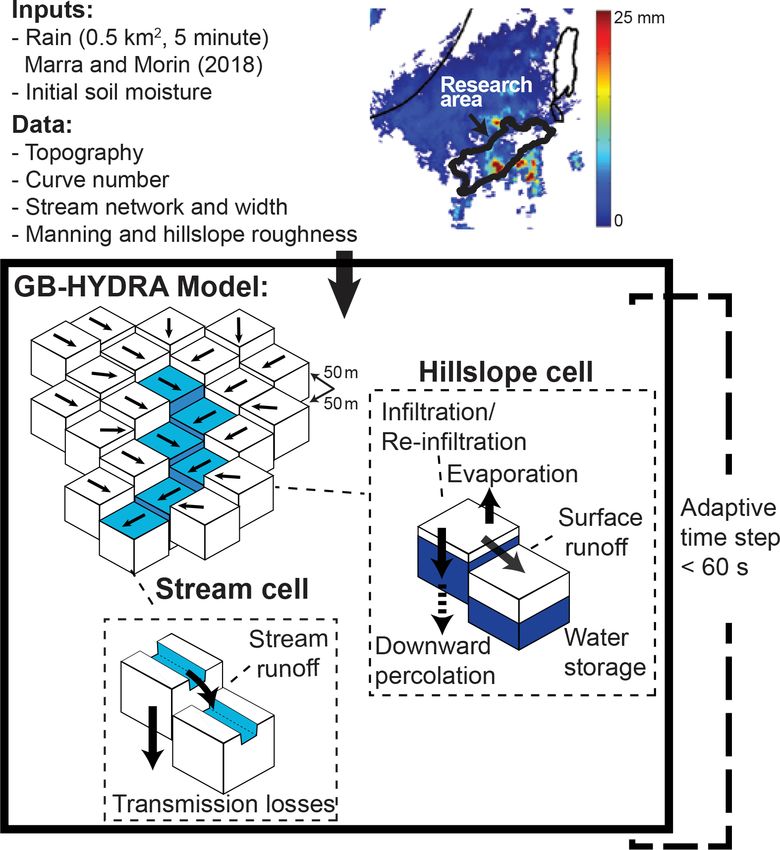
926         Y. Rinat et al.: Hydrometeorological analysis and forecasting of a 3 d flash-flood-triggering desert rainstorm

Figure 6. (a, c) 10 min rainfall maps and (b, d) RCA extent for the Zafit subbasin at 12:00 and 13:00 (on 26 April). Red rectangles represent
the observation points and red circles the simulation points for the spatial validation (Table 3), lag-time calculations, and Video.

                                                                         evaluated, all scenarios were found to differ from the refer-
                                                                         ence categories (Fig. 8c). CSI values were poor for all model
                                                                         runs (< 0.25); moreover, in the first two scenarios when the
                                                                         index was relatively high, the FAR index was high as well. It
                                                                         appears that either the forecast does not result in flash-flood
                                                                         occurrence (25 April, 09:30; 26 April, 09:30; Fig. 10) or flash
                                                                         floods are predicted in the wrong locations (24 April, 09:30;
                                                                         24 April, 21:30; 25 April, 21:30; Fig. 10). In addition, the
                                                                         forecast skill did not improve with decreasing lead times.

                                                                         5.2.2   Ensemble of radar-assimilation scenarios
Figure 7. Modeled lag time vs. basin area for all flash floods with
peak discharge > 5 m3 s−1 .
                                                                         The benefit of continuous radar assimilation into the
                                                                         COSMO weather prediction model was tested for the two
5.2.1   Operational COSMO runs                                           runs of 25 April at 21:30 and 26 April at 09:30. Thus, in-
                                                                         stead of applying radar assimilation for only the first 5 h, the
Operational COSMO forecast runs were initiated every 12 h                COSMO model was rerun at hourly intervals, exploiting new
and assimilated with rain-gauge-corrected radar data for the             radar data.
first 5 h, followed by a free run without any constraints. Rain-            All runs were used as input for the GB-HYDRA model and
fall data from five operational COSMO forecast runs were                 the flood category in each subbasin was calculated. No con-
used (24 April, 09:30; 24 April, 21:30; 25 April, 09:30;                 sistent improvement was found in either case with reduced
25 April, 21:30; 26 April, 09:30; timings indicate the ap-               lead time (Fig. 11). Forecasted flash-flood categories seemed
proximate time of forecast availability; Fig. 9). Forecasted             to be random in both space and time. In fact, even the flood
and measured accumulated rainfall fields for 26 April (06:00             categories computed from COSMO rainfall for the hour in
to 24:00; Fig. 9) showed similar general patterns even though            which the flash flood occurred at each subbasin did not re-
location and timing might differ.                                        semble the reference categories (Fig. 8c and right columns
   Forecasted flash-flood categories calculated for all sub-             in Fig. 11). The forecast evaluation metrics showed poor re-
basins based on applying the different rain forecasts to the             sults in all cases with CSI values lower than 0.3 and high
GB-HYDRA model are shown in Fig. 10. When qualitatively                  FAR values. For example, the flash floods in the Zafit sub-

Nat. Hazards Earth Syst. Sci., 21, 917–939, 2021                                           https://doi.org/10.5194/nhess-21-917-2021
Y. Rinat et al.: Hydrometeorological analysis and forecasting of a 3 d flash-flood-triggering desert rainstorm 927 Figure 8. Determining flash-flood categories for each subbasin. (a) Thresholds for each return period category were defined by applying GEV analysis on annual series of measured specific peak-discharge values from 18 hydrological stations (only 4 are shown) and projected on an area-specific peak-discharge domain (b). (b) The projected points from all stations and the local envelope curve (Tarolli et al., 2012) were used to define return period categories for each area. (c) the 26 April flash-flood return period categories were calculated for all subbasins (Zafit subbasin is marked by bold outline). Figure 9. Total rain depth for 26 April, 06:00 to 24:00, using different degrees of corrections for the radar data (three upper-left panels) and various COSMO runs (COSMO titles refers to the timing of forecast availability). The outlines of the Zin and Zafit basins are depicted, as well as a 20 km buffer zone around the Zin basin. https://doi.org/10.5194/nhess-21-917-2021 Nat. Hazards Earth Syst. Sci., 21, 917–939, 2021
928         Y. Rinat et al.: Hydrometeorological analysis and forecasting of a 3 d flash-flood-triggering desert rainstorm

Figure 10. Flash-flood return period categories, CSI, and FAR calculated using different COSMO forecast runs from the days preceding the
26 April flash flood. Headers state the time of forecast availability.

basins (Oretz, Mazar, and Zafit 1–3; Table 2, Fig. 11) were           tremely difficult. In this study, we combined weather radar
not predicted by most of the simulations.                             archives and novel statistical techniques, as suggested in
                                                                      Marra et al. (2019a). This enabled us to derive frequency
5.3    COSMO spatial accuracy                                         curves for an ungauged area and produce a spatially dis-
                                                                      tributed map of the event’s severity which permitted us to
For the studied rainstorm, measured and forecasted rainfall           better understand its local impacts. In this way, a relatively
shared a similar spotty pattern caused by convective rain cells       short record of remotely sensed precipitation estimates could
of similar shape and size (Fig. 9). However, as already sug-          be fruitfully used to examine the local severity of a partic-
gested, the forecasted rainfall might be erroneously placed           ularly hazardous storm. Thanks to the availability of high-
in space and time (Ben Bouallègue and Theis, 2014; Col-               resolution estimates from geostationary satellites, it is possi-
lier, 2007). To account for this source of uncertainty, a sim-        ble to extend these applications to arid regions of the globe
ple and cost-effective forecast-shifting approach was applied:        for which no gauge or radar coverage is available, depending
shifting the last two available COSMO runs closest to the             on the storms spatial scale.
26 April flash-flood occurrence (i.e., 25 April, 21:30, and
26 April, 09:30) within a reasonable spatial error range of
                                                                      6.2   Stream flow generation in arid regions
20 km (Armon et al., 2020; Khain et al., 2019; Fig. 9) in
1 km intervals. For each shifted forecast, the 1681 resul-
tant rainfall fields were used as input for the GB-HYDRA              Runoff generation over hillslopes in arid regions is mainly
model. Then, for each subbasin, the POD and POFD in-                  controlled by infiltration excess (Simmers, 2003) which of-
dexes were calculated using the modeled peak discharge and            ten occurs in response to intense rainfall (Nicholson, 2011).
flood categories of 26 April. Shifting the COSMO run of               However, not all runoff turns into RCA and stream flow (e.g.,
25 April, 21:30, resulted in multiple flash-flood simulations         Yair and Lavee, 1981) as rainfall duration is also a crucial
of moderate or higher category in the eastern part of the             factor (Vetter et al., 2014; Yair and Raz-Yassif, 2004). As a
Zin basin (Fig. 12a) and thus in a high range of POD (0 %–            result, RCAs in arid regions are highly dependent on rainfall
80 %) and low POFD (0 %–21 %) values. The deterministic               properties (Shmilovitz et al., 2020; Vetter et al., 2014) and do
COSMO run of 26 April, 09:30, did not succeed in fore-                not necessarily develop along streams (Bracken and Croke,
casting flash floods in any of the Zin subbasins (Fig. 10).           2007). Both field observations and model results indicate
However, when shifted in space, it also resulted (Fig. 12b) in        that in the studied rainstorm, hillslope runoff is generated
multiple flash-flood simulations of moderate or higher cate-          within minutes in response to intense rainfall. Two intense
gory in the eastern Zin basin (POD: 2 %–21 % and POFD:                (> 10 mm h−1 in 5 min) rain showers separated by a 50 min
0.2 %–8 %) and presented a pattern similar to the reference           dry period occurred at the observation point. The first lasted
categories (Fig. 8c).                                                 ∼ 10 min and initiated local hillslope runoff but not RCA or
                                                                      stream runoff generation. The second lasted ∼ 35 min and re-
                                                                      sulted in RCA generation and stream-runoff initiation within
6     Discussion                                                      10 min (Fig. 6; Table 3; Video).
                                                                         Yakir and Morin (2011) and Morin and Yakir (2014) ex-
6.1    Analysis of precipitation severity in arid regions             amined the sensitivity of simulated flash-flood peak dis-
                                                                      charge to rain-cell characteristics. They found that under
Estimating the severity of flash-flood-producing storms is            most scenarios, the maximal flood potential of a single rain
crucial to better manage the risks related to these natural           cell is not fulfilled even when rainfall intensity is kept con-
hazards. The typical lack of data characterizing arid regions         stant. Therefore, in most rainstorms, the flash-flood return
(Morin et al., 2020), together with the small scales of flash-        period is expected to be smaller than that of local rain in-
flood-producing events (Borga et al., 2014), make the quan-           tensities. In this work, the Zafit subbasin experienced ex-
tification of precipitation frequency curves at these areas ex-       treme rain intensities characterized by long return periods

Nat. Hazards Earth Syst. Sci., 21, 917–939, 2021                                        https://doi.org/10.5194/nhess-21-917-2021
Y. Rinat et al.: Hydrometeorological analysis and forecasting of a 3 d flash-flood-triggering desert rainstorm 929
Figure 11. Flash-flood return period categories calculated for each subbasin using the 25 April, 19:30 (a), and 26 April, 09:30 (b), COSMO
runs with different radar assimilation lead times. Numbers represent the time in hours prior to the 26 April peak discharge at each subbasin,
i.e., the lead time (where 0 is the hour of the peak, columns are not synchronal). Radar reference, CSI, and FAR metrics are presented.
(75–100 years) on 26 April (Fig. 3b,e). However, the resul- et al., 2006; Wagener et al., 2007). In arid regions, the pos-
tant flash flood was of large (10–50 years) but not of extreme sibility to improve these models using data assimilation and
magnitude. In fact, extreme rainfall covered only part of the proper calibration is limited as monitoring instruments such
subbasin (Fig. 3b) and resulted in a maximum RCA value of as rain radars or rain and stream flow gauges are sparse (Kidd
18 % of the total subbasin area (Fig. 6). This emphasizes the et al., 2017; Morin et al., 2020; Pilgrim et al., 1988). Radar
importance of RCA, together with rain intensity, for identi- assimilation into the COSMO convection-permitting model
fying flash-flood magnitude (Rinat et al., 2018). did not improve the forecasted hydrological response in the
tested case study. This might be due to the rain cells’ typi-
6.3 Flash-flood forecasting in arid regions cally short lifetimes. According to Belachsen et al. (2017),
the average lifetime of a convective flash-flood-producing
Flash floods are a major challenge in arid regions due to rain cell around the Zin basin is ∼ 40 min (median ∼ 17 min).
their fast development (e.g., Marchi et al., 2010; Zoccatelli Thus, the hourly radar assimilations applied in this study are
et al., 2019, 2020, Sect. 4.2) and potentially devastating im- not likely to correct for convective rain cells that appear and
pact (Gaume et al., 2009; Sene, 2013). Although arid regions decay within tens of minutes. Another reason may be that the
are not densely populated, they are crossed by roads and at- assimilation algorithm does not effectively correct for cell lo-
tract tourists and hikers. On top of that, the ability to dis- cation (Stephan et al., 2008).
tribute forecasts and warnings is often limited due to low Deterministic convection-permitting models fail to pro-
cellular reception. The current low predictability of flash- vide reliable forecast predictions at small spatial resolution
flood forecasts is dominated by the skill of the convection- (Roberts, 2008). Therefore, probabilistic approaches are ap-
permitting rainfall forecast models (Clark et al., 2016; Khain plied to produce forecast ensembles (Ben Bouallègue and
et al., 2019) and hydrological models (Collier, 2007; Morin Theis, 2014; Clark et al., 2016). Forecast ensembles have
https://doi.org/10.5194/nhess-21-917-2021 Nat. Hazards Earth Syst. Sci., 21, 917–939, 2021930 Y. Rinat et al.: Hydrometeorological analysis and forecasting of a 3 d flash-flood-triggering desert rainstorm
drological predication (Alfieri et al., 2015; Berenguer et al.,
2005; Sempere-Torres et al., 2005). Additional methods as-
similate the nowcasting products into convection-permitting
models, thus gaining a longer rainfall forecast range (Sokol
and Zacharov, 2012). Although, the accuracy of nowcasting
is affected by several factors, for example, the short life time
of convective rain cells or the effect of orographic enhance-
ment, it was found to significantly improve the flash-flood
forecasts in several case studies and to provide extended
warnings of 10–80 min (Berenguer et al., 2005). This rela-
tively short contribution is not to be overlooked, especially
when summed with the basin lag time, which was found in
this work to be on the order of tens of minutes.
7 Conclusions
Knowledge of desert rainstorms and flash floods is limited
Figure 12. POD and POFD calculated for each subbasin between despite their devastating potential. To enrich this knowledge,
the reference run and the peak discharge on 26 April for the 1681 we presented a comprehensive study of rainfall severity, hy-
rainfall fields resulting from the spatial shifting of the forecast drological impact, and forecasting potential for a fatal 3 d
COSMO runs of (a) 25 April, 21:30 and (b) 26 April, 09:30. POD desert rainstorm. Special focus was placed on the storm’s
was calculated for each subbasin with reference categories of mod- highest impact, which occurred on 26 April, in the Zafit sub-
erate or above, and POFD was calculated for each subbasin with basin. The main conclusions of this study are as follows.
reference categories of low or no flow (Fig. 8).
– Rainfall intensity return periods calculated at radar pixel
resolution were presented. Using a novel method, we
proven to yield better results than deterministic ones (Al- identified rain intensities of exceptionally long return
fieri et al., 2015; Liechti and Zappa, 2019) and are in opera- periods (75–100 years, for most durations) on 26 April
tional use in the meteorological offices of several countries in the Zafit subbasin, whereas for most of the Zin basin
(e.g., DWD, 2020; MeteoSwiss, 2020; Met Office, 2020). (> 37 %–89 %), the calculated return periods are 0–
The ensemble members are created by applying small per- 5 years.
turbations to initial conditions or by varying the description
– Rainfall and hydrological response in desert areas is lo-
of the physical process of the weather model (Hagelin et al.,
cal in nature. Despite the extreme (75–100 years) rain-
2017). However, these methods require multiple model runs
fall intensities in the Zafit subbasin, only a small part
and intense computational resources (Clark et al., 2016), and
of it (20 %) contributed runoff to stream discharge, re-
therefore less costly methods have been developed. These
sulting in a large flash-flood estimation (return period of
include smoothing, upscaling, or “neighborhood” methods
10–50 years). In addition, around 35 % of the total Zin
(Ben Bouallègue and Theis, 2014; Schwartz and Sobash,
basin did not experience any flash floods on 26 April.
2017; Sobash et al., 2011; Theis et al., 2005). Vincendon
et al. (2011) developed a simplified method to produce rain- – Flash floods in desert areas develop quickly. Hillslope
fall ensembles from single-value meteorological forecasts runoff is initiated within minutes and stream discharge
and showed that by using it as an input for a hydrological within tens of minutes. Calculated lag times for the Zin
model, the gained flood-forecasting ensemble performs bet- subbasins are on the order of tens of minutes as well.
ter than the deterministic result. In this work, we present a
– The use of current deterministic operational forecast
simple and low-computational-cost ensemble method using
models is insufficient for flash-flood forecasting in
forecast-shifting that has the potential to improve flash-flood
small to moderate desert basins. None of the five deter-
forecasting; however, to assess its overall benefit, it should
ministic COSMO forecast runs that were available prior
be furthered examined for a large variety of conditions.
to 26 April managed to capture the flash-flood occur-
Finally, as a complementary tool for flash-flood predic-
rence or magnitude. Radar assimilation did not improve
tion, the testing of nowcasting techniques is recommended.
the forecast results. However, simple spatial shifting of
Nowcasting methods apply various algorithms to propagate
the deterministic forecasted rainfall led to the improved
real-time rain radar observations while maintaining the high
probability of detecting the flash floods.
spatiotemporal resolution of the original data (Sene, 2013).
The extrapolated rain fields are used as input for a hydro- This single case study demonstrated the high potential for
logical model thus allowing for short term (up to 6 h) hy- improving lifesaving flash-flood forecasts. Comprehensive
Nat. Hazards Earth Syst. Sci., 21, 917–939, 2021 https://doi.org/10.5194/nhess-21-917-2021Y. Rinat et al.: Hydrometeorological analysis and forecasting of a 3 d flash-flood-triggering desert rainstorm 931 work on other events and other locations, together with ad- vanced nowcasting and ensemble prediction methods, may have worldwide benefits. https://doi.org/10.5194/nhess-21-917-2021 Nat. Hazards Earth Syst. Sci., 21, 917–939, 2021
932        Y. Rinat et al.: Hydrometeorological analysis and forecasting of a 3 d flash-flood-triggering desert rainstorm

Appendix A: GB-HYDRA application                                   tration rate was described by the Soil Conservation Service
                                                                   (SCS) conceptual method. Initial abstractions of 20 % of the
GB-HYDRA is an event-based, distributed hydrological               maximal soil storage were applied to each pixel (Chow et al.,
model developed to study medium to small Mediterranean             1988; S.C.S, 1972).
basins. The formulation presented in Rinat et al. (2018)              In contrast to humid regions (Engman, 1986; Mishra and
was slightly altered to fit the studied arid basins and now        Singh, 2003), there are a limited number of studies utilizing
includes a description of the following hydrological pro-          the SCS method in arid and semiarid environments (Lange
cesses: evaporation, infiltration and re-infiltration, hillslope   et al., 1999; Nouh, 1990; Shammout et al., 2018; Wheater
and stream runoff, downward percolation, and transmission          et al., 2008; Sen, 2008). Thus, arid and semiarid curve num-
losses (Fig. 4). In addition, the model calculates the runoff-     ber (CN) values are still not firmly established. CN param-
contributing area (RCA) at any given time, defined here as         eters of three land-cover types in the studied basin that are
hillslope sections from which water flows and reaches the          poorly represented in the scientific literature (sands, sand-
stream network, during a specific duration (defined in this        stones, and rocky desert; Table A1; Fig. 1b) were found by
work as 30 min following Morin et al., 2001).                      calibration. To save on computation time, calibration was
   The ArcMap geographic information system (GIS) pro-             performed only in the eastern part of the Zin basin. This part
gram was used to prepare the spatial data, including topogra-      of the basin includes the area of the storm’s core and most
phy, stream network, soil, and land use. A smoothing proce-        of the available peak-discharge measurements. Initial CN
dure was applied to correct and eliminate artificial jumps in      values were determined from the literature (Moawad, 2013;
the stream profiles and reduce numerical instabilities (Peck-      Moawad et al., 2016; Wheater et al., 2008; Sen, 2008). Root
ham, 2009).                                                        mean square difference (RMSD) of observed and computed
   High-resolution aerial photography and 1 : 50 000 scale         specific peak discharges and their bias were used as objective
geological maps (Avni et al., 2016; Avni and Weiler, 2013;         functions, and final parameters were selected from the Pareto
Hirsch, 1995; Roded, 1982, 1996; Yechieli et al., 1994;            solution group (i.e., the group of parameter sets for which
Zilberman and Avni, 2004) were used to identify alluvial           none provides better results than the other in terms of both
stream sections and areas of different runoff potential. Chan-     RMSD and bias). Calibration results pointed to adequate
nel widths were measured in the field and estimated using the      model performance and its use for this specific study (R 2 =
air photos at different locations along the Zin’s main channel     0.94; RMSD = 0.65 m3 s−1 km−2 ; Bias = 0.35 m3 s−1 km−2 ;
and tributaries. These widths were extrapolated by fitting a       Fig. 5; Table 1). Rinat et al. (2018) found that the sensitiv-
power-law function (Montgomery and Gran, 2001) between             ity of the GB-HYDRA-modeled peak discharge and RCA
the measured width (dependent variable) and the drainage           to stream Manning roughness, hillslope Manning roughness,
area (independent variable).                                       and CN values is low. In this work, sensitivity analysis was
   The initial soil water storage was set to zero as no sig-       not applied due to considerably long run times. Further pro-
nificant amount of rainfall had precipitated in the study area     cedures of sensitivity analysis, calibration, and validation are
since the end of February 2018 (total rain depth < 3.2 mm in       needed if the model or its parameters are to be used in more
2 months). The daily potential evaporation rate measured at        general studies.
the Sde Boker station (Fig. 1b) was ∼ 4 mm d−1 during the
storm. The Manning coefficient along the stream channels
was estimated at 0.03, 0.04, and 0.05 for no, coarse, and very
coarse alluvial stream bedding, respectively (Shamir et al.,
2013). Hillslope Manning roughness coefficients varied from
0.01 to 0.02 (Table A1) following Downer and Ogden (2002),
Engman (1986), Sadeh et al. (2018), and Shmilovitz et al.
(2020). Stream sections characterized by alluvial bed were
identified as areas prone to transmission losses (Fig. 1b) and
assigned a constant infiltration rate of 10 mm h−1 following
Greenbaum et al. (2002b), Lange (2005), Lange et al. (1999),
and Morin et al. (2009a).
   Downward percolation of water from hillslope grid cells
to underground storage was set to zero except for grid cells
identified as sands (Fig. 1b). These sections are character-
ized by the thick (up to 40 m) unconsolidated sandstones of
the Hatzeva group (Calvo and Bartov, 2001) and cover about
88 km2 (∼ 6 %) of the Zin basin. A constant drainage rate of
40 mm h−1 was used in these sections (Table A1) following
Lange et al. (1999) and Lange and Leibundgut (2003). Infil-

Nat. Hazards Earth Syst. Sci., 21, 917–939, 2021                                    https://doi.org/10.5194/nhess-21-917-2021
You can also read


