Novel neuroanatomical integration and scaling define avian brain shape evolution and development
←
→
Page content transcription
If your browser does not render page correctly, please read the page content below
RESEARCH ARTICLE

                                     Novel neuroanatomical integration and
                                     scaling define avian brain shape evolution
                                     and development
                                     Akinobu Watanabe1,2,3*, Amy M Balanoff2,4, Paul M Gignac2,5,
                                     M Eugenia L Gold2,6, Mark A Norell2
                                     1
                                       Department of Anatomy, New York Institute of Technology College of Osteopathic
                                     Medicine, Old Westbury, United States; 2Division of Paleontology, American
                                     Museum of Natural History, New York, United States; 3Department of Life Sciences
                                     Vertebrates Division, Natural History Museum, London, United Kingdom;
                                     4
                                       Department of Psychological and Brain Sciences, Johns Hopkins University,
                                     Baltimore, United States; 5Department of Anatomy and Cell Biology, Oklahoma
                                     State University Center for Health Sciences, Tulsa, United States; 6Biology
                                     Department, Suffolk University, Boston, United States

                                     Abstract How do large and unique brains evolve? Historically, comparative neuroanatomical
                                     studies have attributed the evolutionary genesis of highly encephalized brains to deviations along,
                                     as well as from, conserved scaling relationships among brain regions. However, the relative
                                     contributions of these concerted (integrated) and mosaic (modular) processes as drivers of brain
                                     evolution remain unclear, especially in non-mammalian groups. While proportional brain sizes have
                                     been the predominant metric used to characterize brain morphology to date, we perform a high-
                                     density geometric morphometric analysis on the encephalized brains of crown birds (Neornithes or
                                     Aves) compared to their stem taxa—the non-avialan coelurosaurian dinosaurs and Archaeopteryx.
                                     When analyzed together with developmental neuroanatomical data of model archosaurs (Gallus,
                                     Alligator), crown birds exhibit a distinct allometric relationship that dictates their brain evolution
*For correspondence:                 and development. Furthermore, analyses by neuroanatomical regions reveal that the acquisition of
awatanab@nyit.edu                    this derived shape-to-size scaling relationship occurred in a mosaic pattern, where the avian-grade
Competing interests: The             optic lobe and cerebellum evolved first among non-avialan dinosaurs, followed by major changes to
authors declare that no              the evolutionary and developmental dynamics of cerebrum shape after the origin of Avialae.
competing interests exist.           Notably, the brain of crown birds is a more integrated structure than non-avialan archosaurs,
                                     implying that diversification of brain morphologies within Neornithes proceeded in a more
Funding: See page 14
                                     coordinated manner, perhaps due to spatial constraints and abbreviated growth period.
Received: 25 March 2021              Collectively, these patterns demonstrate a plurality in evolutionary processes that generate
Accepted: 15 June 2021               encephalized brains in archosaurs and across vertebrates.
Published: 06 July 2021

Reviewing editor: Min Zhu,
Chinese Academy of Sciences,
China
                                     Introduction
                                     The human brain, with its inflated cerebrum, is often considered the zenith of brain evolution. Semi-
   Copyright Watanabe et al.
                                     nal works, both classic and modern, have suggested that our specialized brain morphology arose
This article is distributed under
                                     through (i) changes in gross-level scaling relationship (allometry) of brains (Striedter, 2005; Ril-
the terms of the Creative
Commons Attribution License,         ling, 2006; Passingham and Smaers, 2014), and (ii) mosaic, or modular, evolution where individual
which permits unrestricted use       brain regions have the capacity to evolve quasi-independently from one another due to decoupling
and redistribution provided that     of previously shared genetic, developmental, functional, and spatial constraints (Barton and Harvey,
the original author and source are   2000; Rowe et al., 2011; Smaers and Soligo, 2013; Gómez-Robles et al., 2014; Ni et al., 2019).
credited.                            Clarifying the degree to which these patterns extend across vertebrates requires examining other

Watanabe et al. eLife 2021;10:e68809. DOI: https://doi.org/10.7554/eLife.68809                                                      1 of 21
Research article                                                                                             Evolutionary Biology

                                   episodes of encephalization. Crown birds offer an excellent comparative system to mammals, even
                                   primates, because they share neuroanatomical features that evolved independently, including a rela-
                                   tively large brain size (Jerison, 1973; Nieuwenhuys et al., 1998; Northcutt, 2002; Butler and
                                   Hodos, 2005; Iwaniuk et al., 2005; Gill, 2006), globular brains with expanded cerebra, specialized
                                   cytoarchitecture and neuron types (Reiner et al., 2004; Dugas-Ford et al., 2012; Shanahan et al.,
                                   2013; Pfenning et al., 2014; Karten, 2015; Stacho et al., 2020), and the capacity to perform higher
                                   cognitive behaviors (Lefebvre et al., 2002; Weir et al., 2002; Emery, 2006; Auersperg et al.,
                                   2012; Kabadayi et al., 2016; Bayern et al., 2018; Boeckle et al., 2020). In addition, they feature
                                   remarkable variation in brain morphology that is conducive to macroevolutionary studies
                                   (Iwaniuk and Hurd, 2005; Figure 1).
                                       Chronicling the evolutionary origins of the archetypal ‘avian’ brain requires information on ances-
                                   tral brain morphologies of extinct coelurosaurian dinosaurs. Because brain tissue does not readily
                                   fossilize, paleontologists have relied on endocasts, or the internal mold of the braincase, to docu-
                                   ment and analyze neuroanatomical evolution through geologic time (Jerison, 1963; Jerison, 1969;
                                   Edinger, 1975; Hopson, 1979; Balanoff and Bever, 2017). As in extant mammals, the brain occu-
                                   pies nearly the entire cranial cavity in crown birds, and thus, these endocasts are used as accurate
                                   proxies for brain size and shape in these groups (Jerison, 1973; Haight and Nelson, 1987;
                                   De Miguel and Henneberg, 1998; Iwaniuk and Nelson, 2002; Watanabe et al., 2019; Early et al.,
                                   2020). Volumetric analyses of endocasts from avialan and non-avialan dinosaurs show that crown
                                   birds exhibit a derived allometric trend in brain-to-body size although some closely related non-avia-
                                   lan dinosaurs (e.g., oviraptorosaurs, troodontids) overlap in allometric trends with neornithine
                                   groups (Balanoff et al., 2013; Ksepka et al., 2020). Volumetric data of endocasts also indicate that
                                   each brain region evolved under different modes across avian and non-avian coelurosaurs, implying
                                   mosaic brain evolution (Balanoff et al., 2016b). However, whether the encephalized brains of crown
                                   birds possess a unique allometric trajectory and a more modular structure than non-avialan archo-
                                   saurs, as anticipated by classic notion of phenotypic modularity (Wagner and Altenberg, 1996;
                                   Goswami et al., 2014), remains to be explicitly tested. In addition, despite its prevalence and
                                   importance as a morphological metric, size data are limited in characterizing brain morphology. For
                                   example, similarly sized brains could have disparate shapes, especially given the diversity in brain
                                   morphologies within Neornithes and similar volumetric proportions between crown birds and some
                                   non-avialan dinosaurs.
                                       To holistically analyze neuroanatomical shape, we use a high-density geometric morphometric
                                   (GM) approach on endocranial reconstructions from micro-computed tomography (mCT) imaging.
                                   Three-dimensional (3D) landmarks were placed virtually on endocasts from 37 extant and recently
                                   extinct (Dodo, Greak Auk) neornithine species and six non-avialan coelurosaurs to characterize the
                                   overall morphology of the brain and its functional subdivisions visible on the endocast—cerebrum,
                                   optic lobe, cerebellum, and medulla (Figure 1; Supplementary file 1a, b for specimen and landmark
                                   sampling). In this study, endocranial regions are referred to by the name of the soft-tissue features
                                   that are reflected on the surface. This unified mathematical framework allows the relative size, con-
                                   figuration, and surface morphology of neuroanatomical traits to be analyzed together, including allo-
                                   metric and correlative trends in shape within and between brain regions (Klingenberg, 2008). We
                                   analyze this rich phenotypic dataset to test if crown birds exhibit (i) a derived allometric relationship
                                   between endocranial shape and size, and (ii) a more structurally modular brain compared to the
                                   ancestral pattern observed in non-avialan coelurosaurian dinosaurs. Moreover, we anticipate that dif-
                                   ferences in evolutionary patterns of allometry and phenotypic integration will be reflected in extant
                                   archosaurs developmentally (Bookstein et al., 2003), where clades with more integrated brain evo-
                                   lution show more integrated brain development. As such, we combine postnatal developmental
                                   data of the American alligator (Alligator mississippiensis) and the domestic chicken (Gallus gallus)
                                   with interspecific sampling of Coelurosauria to assess whether (iii) the developmental allometry and
                                   integration pattern mirror evolutionary patterns of endocranial shapes in non-avialan dinosaurs and
                                   crown birds, respectively.

                                   Results
                                   Shape data were subjected to principal components analysis (PCA) to create morphospaces that
                                   visualize patterns of neuroanatomical variation (Figure 2; Figure 2—figure supplement 1 for fully

Watanabe et al. eLife 2021;10:e68809. DOI: https://doi.org/10.7554/eLife.68809                                                       2 of 21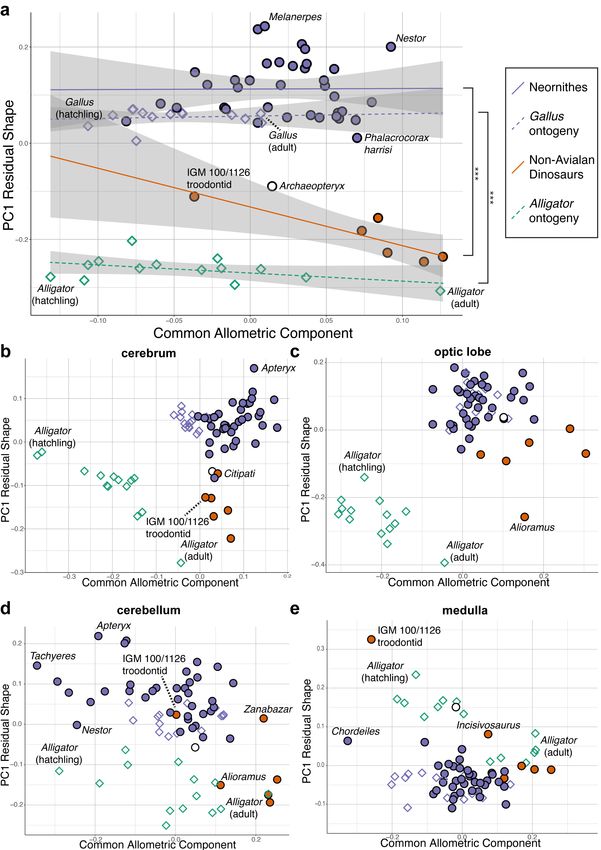
Research article                                                                                                      Evolutionary Biology

Figure 1. Time-calibrated phylogeny of avialan and non-avialan coelurosaurs sampled in this study, with Alligator mississippiensis as outgroup. Center
image shows discrete (red), curve (yellow), and surface (blue) landmarks used to characterize endocranial shape including the cerebrum (green), optic
lobe (yellow), cerebellum (blue), and medulla (red). Lateral views of select endocranial models, indicated by bolded taxonomic names on the
phylogeny, highlight the neuroanatomical variation observed across taxa. See Supplementary file 1a for list of specimens sampled for the interspecific
dataset and Supplementary file 1b for the landmark scheme used in this study.

                                    labeled morphospaces). Morphospace of overall endocranial shape shows that Neornithes exhibits
                                    distinct brain morphologies from non-avialan archosaurs (multivariate analysis of variance:
                                    R2 = 0.323; p
Research article Evolutionary Biology Figure 2. Morphospaces constructed from first two principal components (PC) of neuroanatomical shapes. These plots illustrate the distribution of shape variation in the (a) overall endocranial shape, where the arrows denote postnatal developmental trajectories of Alligator (green) and Gallus (purple); (b) cerebrum; (c) optic lobe; (d) cerebellum; and (e) medulla. Regional shape data are locally aligned. See text for details. The following figure supplement is available for Figure 2—figure supplement 1. PC morphospaces with full specimen labels. Figure 2 continued on next page Watanabe et al. eLife 2021;10:e68809. DOI: https://doi.org/10.7554/eLife.68809 4 of 21
Research article                                                                                                 Evolutionary Biology

Figure 2 continued
The online version of this article includes the following figure supplement(s) for figure 2:
Figure supplement 1. Morphospaces constructed from first two principal components of neuroanatomical shape.

                                      2014; Ksepka et al., 2020). Although size data from endocasts show partial overlap of crown birds
                                      and non-avialan coelurosaurs (Balanoff et al., 2013; Ksepka et al., 2020), high-density shape data
                                      discriminate these groups more clearly along PC1 axis, where lower PC1 scores in the morphospace
                                      (Figure 2a) are associated with expanded cerebrum, ventrally located optic lobe, more compact
                                      hindbrain, and greater dorsoventral flexion. Lower PC2 scores correlate with wider cerebrum, dorso-
                                      ventrally longer optic lobe, anteroposteriorly shorter cerebellum, and more dorsoventrally flexed
                                      medulla. Besides the distinction between non-avialan dinosaurs and crown birds, the distribution of
                                      endocranial shape variation within Neornithes has a broad, but modest phylogenetic structure with
                                      substantial overlap and convergence among subclades (Blomberg’s K = 0.035; p=0.039; see
                                      Supplementary file 1c for phylogenetic signal in shape data). The developmental trajectory of Alli-
                                      gator occupies the area of morphospace farthest from crown birds, whereas the endocranial shapes
                                      of developing Gallus lie adjacent to the cluster of crown birds. When morphospaces are constructed
                                      for locally aligned shape data of individual brain regions, cerebrum and optic lobe shapes largely
                                      separate Alligator, non-avialan coelurosaurs, and crown birds (Figure 2b,c), whereas cerebellum and
                                      medulla shapes partially overlap between these major clades (Figure 2d,e).
                                          Upon establishing that non-avialan coelurosaurs and crown birds diverge in overall endocranial
                                      shape, we examined whether this difference is associated with deviations in their scaling relation-
                                      ships. After correcting for phylogenetic structure in the data, endocranial size, as measured by log-
                                      transformed centroid size, accounts for 24.2% and 4.8% of total endocranial shape variation within
                                      non-avialan coelurosaurs and crown birds, respectively (albeit p>0.05; see Supplementary file 1c for
                                      allometric signal in shape data). Collectively, these values indicate that size captures a relatively small
                                      proportion of neuroanatomical variation, especially in crown birds as previously reported (Marugán-
                                      Lobón et al., 2016). To visualize how each endocast diverges from the overall allometric trend
                                      across all sampled endocasts, we created bivariate plots of PC1 of residuals from the common allo-
                                      metric trend (RSC1) against scores along this allometric trendline (common allometric
                                      component [CAC]) where increase in its value corresponds to increase in size (Mitteroecker et al.,
                                      2004; Figure 3; Figure 3—figure supplement 1 for fully labeled plots). The plot for overall endocra-
                                      nial shape illustrates that endocranial shape variation of non-avialan dinosaurs and crown birds lies
                                      along divergent allometric trajectories (Figure 3a; non-avialan coelurosaur-Neornithes difference in
                                      allometric trajectories: R2 = 0.273; p
Research article Evolutionary Biology Figure 3. Bivariate plots of PC1 of residuals from the common allometric component (CAC) against scores along CAC (Mitteroecker et al., 2004). These plots illustrate neuroanatomical deviations from the overall shape-to-size allometric trend in the (a) endocasts (band indicates 95% confidence band), where the null hypothesis that the allometric trajectories between Neornithes and non-avialan dinosaurs and between Alligator and Gallus are the same is rejected statistically (*** denotes p
Research article                                                                                                       Evolutionary Biology

Figure 3 continued
shapes and regional log-transformed centroid sizes were used. See text for details. The following figure supplement is available for Figure 3—figure
supplement 1. Principal components (PC) plots of PC1 of residuals from CAC against CAC with full specimen labels.
The online version of this article includes the following figure supplement(s) for figure 3:
Figure supplement 1. Bivariate plots of PC1 of residuals from the common allometric component (CAC) against scores along CAC.

                                    100/1126) follow the allometric trajectory of crown birds, whereas the other non-avialan coelurosaurs
                                    align with the developmental trajectory of Alligator (Figure 3d). Developmental trajectories of
                                    medulla shape are distinct between Alligator and Gallus but converge as individuals of these taxa
                                    grow (Figure 3e). The troodontid IGM 100/1126 and Incisivosaurus exhibit medulla shapes that are
                                    more consistent with allometric trends in Alligator development, whereas the correspondence of
                                    other non-avialan coelurosaurs to the allometric trajectories of medulla shape in Alligator or crown
                                    birds are ambiguous due to the convergent allometric trajectory at these medulla sizes (Figure 3e).
                                        Lastly, we employed two methods for evaluating the pattern of integration—covariance ratio (CR)
                                    (Adams, 2016) and maximum likelihood (ML) (Goswami and Finarelli, 2016) approaches—to calcu-
                                    late and test the strength of correlation between shapes of neuroanatomical regions. Results from
                                    these analyses would elucidate whether the derived neornithine allometric trajectory accompanied a
                                    shift in the pattern of morphological integration in the brain. We find that non-avialan coelurosaurs
                                    and crown birds reveal different patterns of integration (Figure 4; Supplementary file 1d–f for
                                    within- and between-region correlation values). Both CR and ML analyses indicate that non-avialan
                                    coelurosaurs show strong associations between the cerebrum and optic lobe and between the
                                    medulla and cerebellum, while only the CR analysis indicates stronger correlation between the cere-
                                    brum and medulla. The results for neornithines show contrasting patterns between analyses, where
                                    CR analysis suggests strong integration between the optic lobe and medulla and ML analysis
                                    presents a strong correlation between the cerebrum and cerebellum. Despite this discrepancy, com-
                                    parison of correlation values clearly indicates that integration between brain regions is stronger in
                                    crown birds than in non-avialan dinosaurs (Supplementary file 1d–f). In particular, crown birds pos-
                                    sess a cerebellum that is much more strongly integrated with the cerebrum and optic lobe shapes,
                                    which are pairs of structures with much weaker correlations in non-avialan dinosaurs.
                                        Developing Alligator and Gallus also show contrasting patterns of integration. Alligator shows
                                    the strongest integration between the optic lobe and medulla, with slightly weaker correlation
                                    between the cerebrum and optic lobe. In contrast, Gallus shows strong integration between the cer-
                                    ebellum and medulla and more moderate correlations between the cerebrum and optic lobe and
                                    between the cerebrum and cerebellum. As observed in non-avialan dinosaurs, cerebellum shape in
                                    Alligator is weakly correlated with cerebrum and optic lobe shapes, whereas these associations are
                                    much stronger in developing Gallus akin to the evolutionary pattern seen in crown birds. When
                                    tested for differences in the effect size of integration, we find that the endocranial shape of crown
                                    birds exhibits significantly greater integrated structure than non-avialan dinosaurs (p
Research article Evolutionary Biology
Figure 4. Pattern of correlation across locally aligned neuroanatomical shapes. (a) Network diagrams based on between-region covariance ratios (CR)
(Supplementary file 1d, f; Adams, 2016). (b) Network diagrams based on correlation coefficient, rho, from maximum likelihood analysis
(Supplementary file 1d, f; Goswami and Finarelli, 2016), where the size of the circles represent the degree of within-region correlation. In both sets
of diagrams, the thickness of the line segments between regions indicates relative strength of the correlation. Note that the line thickness is based on
values within each analysis (i.e., not comparable between diagrams), where the cut-off point is the mean correlation value. Abbreviations: Cl,
cerebellum; Cr, cerebrum; Ol, optic lobe; Me, medulla. See text for details. The following figure supplement is available for Figure 4—figure
supplement 1. Network diagrams of integration within and between globally aligned neuroanatomical regions.
The online version of this article includes the following figure supplement(s) for figure 4:
Figure supplement 1. Pattern of correlation across globally aligned neuroanatomical shapes.
pronounced in the cerebrum and optic lobe (Figure 3b,c) than in the hindbrain (Figure 3d,e).
Archaeopteryx shows closer resemblance to non-avialan coelurosaurs than extant birds in cerebrum,
optic lobe, and medulla shapes, demonstrating that the organization of the archetypal ‘avian’ brain
had not emerged by the origin of Avialae, if Archaeopteryx is considered one of the earliest diverg-
ing avialans (Figure 3b–d). However, allometric trends across regions signify that Archaeopteryx
possessed an avian-grade shape-to-size relationship for the optic lobe, and nearly so for the cere-
brum and cerebellum. In fact, some non-avialan coelurosaurs approach or align with the allometric
trends of crown birds, including non-avialan maniraptoran dinosaurs for the optic lobe and troodon-
tids in cerebellum shape. The oviraptorosaur Citipati converges on the cerebral shape of Archaeop-
teryx and the extant cormorant Phalacrocorax given its size (Figure 3b). These taxon- and region-
specific results are consistent with volumetric studies reporting a mosaic assembly of the avian brain
form (Balanoff et al., 2016b; Ksepka et al., 2020). Based on our endocranial shape data, we pro-
pose that optic lobes approaching avian-grade scaling relationships emerged at least among Pen-
naraptora; and similarly, avian-grade allometric trend in cerebellum shape first appeared among
Paraves prior to the origin of Avialae (possibly convergently). These neuroanatomical innovations
were then followed by the acquisition of specialized shape-to-size scaling relationships in the cere-
brum along the lineage spanning Archaeopteryx to crown birds, potentially coincident with the
Watanabe et al. eLife 2021;10:e68809. DOI: https://doi.org/10.7554/eLife.68809 8 of 21Research article Evolutionary Biology
increased prominence of the Wulst, a dorsal telencephalic eminence that receives somatosensory
and visual signals and thought to be involved in information processing and motor control implicated
in powered flight (Gold et al., 2016). Notably, this inferred change to cerebrum shape and develop-
ment is decoupled from cerebrum size evolution which did not change substantially from non-avialan
paravians to crown birds (Balanoff et al., 2013; Ksepka et al., 2020).
A difficulty in pinpointing the evolutionary origin of derived allometric and integration patterns is
the dearth of complete endocranial material from early avialan taxa (Walsh and Milner, 2011;
Knoll and Kawabe, 2020) and robust developmental series of non-avialan coelurosaurian dinosaurs.
This gap in neuroanatomical sampling limits our current ability to precisely determine the timing and
tempo of when these neuroanatomical properties evolved. While shape data could not be collected,
known braincase and endocast from the purported ornithuran Cerebavis from the Cretaceous period
features an amalgam of neornithine neuroanatomical features, with globular and laterally expanded
cerebra, ventrally positioned optic lobes, anteroposteriorly short and ventrally positioned cerebel-
lum, and strongly flexed profile (although without a well-developed Wulst) (Kurochkin et al., 2007;
Walsh and Milner, 2011; Walsh et al., 2016; Beyrand et al., 2019). Based on these observations,
the final phases of the acquisition of an avian-grade brain, including the inflated appearance of cere-
bra, likely occurred along the lineage spanning the divergence of earliest avialans (e.g., Archaeop-
teryx) to the origin of Ornithurae. Future discoveries of exceptionally preserved braincases of
Mesozoic stem birds and their inclusion into our endocranial shape data will greatly facilitate our
understanding of this key period in amniote brain evolution. Recent discoveries and reconstructions
of complete, articulated, and three-dimensionally preserved Mesozoic avialans (Field et al., 2018;
Field et al., 2020), as well as a developmental series of non-avialan dinosaurs (Evans et al., 2009;
Lautenschlager and Hübner, 2013; Bullar et al., 2019), provide a promising outlook on compara-
tive studies of brain evolution along the theropod-bird transition. Regardless of a punctuated or
gradual evolution of avian-grade cerebrum among avialans, our study demonstrates that the brain of
the avian crown exhibits a distinct allometric trajectory and a more integrated structure as compared
to the ancestral, non-avialan theropod condition.
Developmental trends in coelurosaurian brain evolution
Comparative neuroanatomists have long recognized the intimate connection between brain devel-
opment and evolution. For instance, prolonged periods of neurogenesis (Allman et al., 1993;
Jones and MacLarnon, 2004; Leigh, 2004; Barton and Capellini, 2011; Sayol et al., 2016b;
Yu et al., 2018; Gunz et al., 2020) and regions with delayed onset of neurogenesis (Finlay and Dar-
lington, 1995; Finlay et al., 2001; Charvet and Striedter, 2011) have been shown to be associated
with greater encephalization across vertebrates. In this study, we analyzed interspecific and develop-
mental data synchronously, allowing inference of evolutionary shifts in developmental sequence and
rate of phenotypic changes, termed heterochrony (Gould, 1977; Alberch et al., 1979;
McKinney and McNamara, 1991; Klingenberg, 1998). Paedomorphosis (retention of ancestrally
juvenile brain morphology in adult stages of descendants) through early cessation of development,
or progenesis, has been proposed to account for the dorsoventrally flexed brain profile observed in
crown birds that began among non-avialan paravian dinosaurs (Beyrand et al., 2019). This mecha-
nistic explanation agrees with the accelerated yet abridged growth period in birds. The same heter-
ochronic process has been invoked for the evolution of the avian skull (Bhullar et al., 2012)—a
structure topologically, functionally, and developmentally linked to the brain (Young et al., 2010;
Gondré-Lewis et al., 2015; Hu et al., 2015).
Based on our landmark and developmental sampling, we find no evidence of a uniform hetero-
chronic process underlying the evolution of overall endocranial shape from a crocodylian outgroup
to crown birds. Both the morphospace and allometric trajectories of endocranial shape visually show
that the developmental trajectories of Alligator and Gallus do not align with the principal evolution-
ary trajectory from ancestral shapes of non-avialan dinosaurs and crown birds (Figures 2a and
3a). Comparison of these trajectories in full shape space (i.e., without the reduction in dimensionality
of the data) further demonstrates that vectors of developmental shape change are different from the
vector of ancestral endocranial shapes of coelurosaurs to crown birds (pResearch article Evolutionary Biology
encompass substantial changes in brain morphology. Embryonic specimens were not sampled in this
study because endocasts cannot be reliably created for embryos with incomplete ossification, and
merging endocast and brain shape data in archosaurs leads to an artifact where endocasts appear
paedomorphic relative to corresponding brains (Watanabe et al., 2019). While their study was lim-
ited to analyzing 2D dorsal contour of endocasts, Beyrand et al., 2019 have reported that during
prenatal stages, crocodylians undergo a neuroanatomical transition from dorsoventrally flexed brain,
akin to avian brains, to an anteroposteriorly linear brain profile. Therefore, at least some aspects of
avian brain form are likely the result of paedomorphosis, a pattern which is not observed with post-
natal developmental sampling.
Besides differences in developmental sampling, lack of uniform heterochronic signal in our data
could be due to differences in (i) the morphological variation captured by high-density 3D compared
to 2D data; (ii) the developmental trajectories of brain shape across archosaurs; and (iii) the impact
of heterochronic processes across brain regions, where a mixture of forward and backward shifts in
developmental processes occurred within localized regions, as has been shown in the cranium
(Bhullar et al., 2012; Plateau and Foth, 2020). As mentioned above, a recent study investigating
hetechrony as a mechanism in archosaurian brain evolution was restricted to analyzing the dorsal
contour of the brain and endocasts in lateral view (Beyrand et al., 2019). This morphometric charac-
terization precludes neuroanatomical variation within brain regions and along the mediolateral axis
which account for 22.0% of our 3D dataset that may contribute a unique signal to endocranial shape
variation. Another potential explanation for the absence of clear heterochronic signal is the intrigu-
ing possibility that non-avialan dinosaurs possessed a distinct modality in brain development from
crocodylians and crown birds. Histological evidence suggests that IGM 100/1126 was an immature
individual (Erickson et al., 2007) and its proximity to crown birds in endocast shape may signify that
non-avialan dinosaurs had a unique postnatal development that begins with avian-like brain form
(extrapolated section of the regression line for non-avialan dinosaurs in Figure 3a).
Lastly, regional analysis of neuroanatomical shape suggests that differing heterochronic signals
within each brain region contribute to the lack of uniform heterochronic signal in our endocast data.
Relative to the developmental trend in Alligator (decreasing PC1 residual shape scores in Figure 3),
the cerebrum, optic lobe, and cerebellum trend toward increasingly paedomorphic shape (greater
PC1 residual shape scores) starting from non-avialan dinosaurs and into modern birds (Figure 3b–d).
In contrast, crown birds, including hatchling Gallus, exhibit derived, relatively more ‘mature’ medulla
shapes beyond those of adult Alligator. Taken together, the piecemeal evolutionary assembly of the
‘avian’ brain may have comprised increasing paedomorphic effect on the cerebrum and optic lobe
among non-avialan coelurosaurs and on the cerebellum among paravian dinosaurs, followed by per-
amorphosis of the medulla at least within crown birds. These mosaic patterns across taxa and ana-
tomical regions only begin to exemplify the complexity of evolutionary and developmental
interactions, illustrating how the identification of clear heterochronic signals is often more challeng-
ing and nuanced than implied by a single mechanism. As Shea, 2002 proclaims regarding human
morphology, ‘there is no central component of heterochronic transformation that predominantly
accounts for the bulk of morphogenetic and evolutionary transitions’ (p. 95). We observe this pattern
for coelurosaurian brain evolution as well.
Crown birds possess a more integrated, not modular, brain structure
Brain evolution has proceeded through a mixture of integrated (concerted) (Finlay and Darlington,
1995; Finlay et al., 2001) and modular (mosaic) (Barton and Harvey, 2000; Hager et al., 2012;
Hoops et al., 2017; Sukhum et al., 2018) patterns. Consistent with volumetric studies on avialan
and non-avialan coelurosaurian neuroanatomical studies (Iwaniuk et al., 2004; Balanoff et al.,
2016b; Sayol et al., 2016a; Moore and DeVoogd, 2017), our study points to both integrated and
modular trends shaping their brain evolution via common allometric and regional trends. In humans
and chimpanzees, the highly encephalized brain is thought to have coincided with the acquisition of
a more modular structure than other mammals (Gómez-Robles et al., 2014). This scenario agrees
with the traditional notion that a more modular structure, allowing for quasi-independent changes
among regions, promotes the evolution of novel and diverse forms (Wagner, 1996; Wagner and
Altenberg, 1996; Klingenberg, 2005). Interestingly, we find that the brains of crown birds are more
integrated than those of non-avialan archosaurs, and this difference is broadly reflected, albeit
weakly, in the postnatal development of Gallus and Alligator. This outcome is particularly surprising
Watanabe et al. eLife 2021;10:e68809. DOI: https://doi.org/10.7554/eLife.68809 10 of 21Research article Evolutionary Biology
given that the allometric signal, a strong integrating factor, is greater in non-avialan coelurosaurs
than extant birds (Supplementary file 1c). The avian brain, therefore, counters the notion that struc-
tures become increasingly modular through macroevolutionary time to maintain or increase evolv-
ability (Wagner and Altenberg, 1996). Although seemingly counter-intuitive, recent empirical and
simulation studies demonstrate that integrated structures have the capacity to evolve more extreme
phenotypes when selection acts along major axes of variation (Villmoare, 2013; Goswami et al.,
2015; Felice et al., 2018; Machado et al., 2018; Rolian, 2019). As such, the neuroanatomical diver-
sity observed across Neornithes could still arise from strongly integrated brain structure. This result
aligns with a recent large-scale analysis on volumetric data showing that crown birds possess greater
brain-to-body size integration relative to non-avialan dinosaurs (Ksepka et al., 2020). Therefore, a
more integrated structure seems to underlie brain shape and size evolution within Neornithes rela-
tive to their coelurosaurian ancestors.
Whether the evolution of a highly encephalized brain with inflated cerebra emerged from an
ancestrally more modular or the derived, more integrated configuration remains to be examined
with additional endocasts from basally divergent members of Avialae. Volumetric evidence indicat-
ing pulses of cerebral expansion occurring among non-avialan maniraptoran dinosaurs
(Balanoff et al., 2013; Ksepka et al., 2020) suggests that an ancestrally more modular brain
allowed for increasingly encephalized brains and globular cerebra to evolve prior to, and even after,
the origin of Avialae. If true, the more integrated brain of crown birds may be a consequence of the
subsequent ‘spatial packing’ of brain tissue inside the endocranial cavity, a hypothesis proposed for
the flexed profile of some mammalian brains (Lieberman et al., 2008). A more integrated brain
could also be attributed to the abbreviated growth period in crown birds which could be reducing
the cumulative imprinting of new covariation patterns onto the integration pattern established ear-
lier in development (Hallgrı́msson et al., 2009; Goswami et al., 2014).
Besides the overall strength of integration, the degree of correlation between regions helps for-
mulate mechanistic explanations based on the premise that strongly integrated regions are thought
to emerge through shared spatial, functional, developmental, and genetic factors (Wagner and
Altenberg, 1996; Klingenberg, 2008; Gómez-Robles et al., 2014). For example, previous studies
have shown that the strength of axonal connections in the brain is associated with the extent of corti-
cal surface folds in mammals (Hofman, 2014). Although the link between surface morphology and
neuronal connections in avian systems is yet unclear (although see Early et al., 2020), strongly corre-
lated shape changes could also represent functional coordination between regions. Vision is the
dominant sensory modality in modern birds (Shimizu et al., 2010; Walsh and Milner, 2011; Mar-
tin, 2014), and their visual pathways include major projections from the optic lobe to the cerebrum,
including the Wulst (Wylie et al., 2009; Shimizu et al., 2010). These critical neuronal connections
may induce coordinated morphological development and evolution between the cerebrum and
optic lobe shapes. Interestingly, non-avialan coelurosaurs exhibit the strongest integration between
the cerebrum and optic lobe and within the hindbrain (cerebellum and medulla). The presence of
strong integration between the cerebrum and optic lobe in non-avialan coelurosaurs, but not in a
developing Alligator, is consistent with the inference from allometric trajectories that derived non-
avialan coelurosaurs already possessed aspects of the avian-grade cerebrum and optic lobes. Collec-
tively, these results suggest that key aspects of the ‘avian’ visual system emerged in non-avialan
dinosaurs, preceding the origin of birds and powered flight. Visual acuity, perhaps for predation or
signaling through colorful feathers, was likely an important facet of their lifestyle, an evolutionary
scenario shared with primate brain evolution (Barton, 1998; Kirk, 2006).
Materials and methods
Specimens
CT data and endocranial reconstructions were sampled from previously published studies
(Balanoff et al., 2013; Gold and Watanabe, 2018; Watanabe et al., 2019). The interspecific data-
set includes six non-avialan coelurosaurs, 37 neornithines, and Archaeopteryx. Among non-avialan
dinosaurs, we sampled coelurosaurs due to their phylogenetic affinity to birds, and crucially, major
neuroanatomical regions are visible on their endocasts unlike those of more basally diverging thero-
pods (Paulina-Carabajal et al., 2019). The braincases of Alioramus and Incisivosaurus are
Watanabe et al. eLife 2021;10:e68809. DOI: https://doi.org/10.7554/eLife.68809 11 of 21Research article Evolutionary Biology
taphonomically deformed which would lead to inaccurate characterization of endocranial shape.
Because the endocast of Alioramus showed approximately uniform shear, the endocranial model
and coordinate data were retrodeformed based on the symmetrization algorithm (Ghosh et al.,
2010) implemented in the Morpho R package based on discrete landmarks that are bilaterally sym-
metric (Schlager et al., 2018). In contrast, the endocast of Incisivosaurus shows mediolateral com-
pression (Balanoff et al., 2009) which impedes reliable retrodeformation with existing tools.
However, Incisivosaurus occupies regions of morphospaces that are compatible with other non-avia-
lan coelurosaurs, with the exception of cerebrum shape (Figure 3b). Statistical analyses without Inci-
sivosaurus generate results that are consistent with those presented here, including crown birds
possessing significantly more integrated brain architecture (partial least squares [PLS] effect size dif-
ference = 3.911; p8 weeks of age (n = 14). We selected Gallus as exemplar taxon for crown
birds due to the availability of developmental series and their importance as a model system. The
alligator and chicken specimens were submerged in 10% neutral-buffered formalin immediately fol-
lowing euthanasia (Stony Brook IACUC Protocol #236370–1, Oklahoma State University Center for
Health Sciences IACUC Protocol #2015–1 for alligator specimens; chicken specimens were eutha-
nized by Charles River Laboratories). These specimens were fixed in formalin for over 8 weeks before
imaging to mitigate soft-tissue distortions (Weisbecker, 2012). Please refer to Watanabe et al.,
2019 for additional details on sampling and imaging of Alligator and Gallus specimens.
Imaging and endocranial reconstructions
The heads of specimens were CT-scanned at multiple institutions using variable scan parameter val-
ues to optimize the contrast and resolution of the X-ray images, while also considering available
scan time. For larger specimens requiring multiple scans, separate image stacks were fused using
the ‘3D Stitching’ function in ImageJ (FIJI) v1.49u (Schindelin et al., 2012). In VGStudio MAX v2.2
(Volume Graphics, Heidelberg, Germany), full image stacks of each specimen were imported, and
virtual segmentation was conducted following the protocol outlined by Balanoff et al., 2016a.
Reconstructed endocasts were then exported as 3D polygon mesh files. Based on the same land-
mark scheme analyzed in this study, endocasts are known to accurately represent the variation in
brain size and shape in archosaurs and follow the same ontogenetic trends as brain shape in Alliga-
tor and Gallus (Watanabe et al., 2019). As such, we considered the directionality and the variance-
covariance structure of brain shape to be closely reflected by endocranial shape data given the
large-scale comparative sampling of our study.
Morphometric data
We employed a high-density 3D landmark-based GM approach to characterize the shape and size of
endocasts and their major functional regions (Figure 1; Supplementary file 1b). The landmark
scheme combines discrete landmarks with semi-landmarks on curves and surfaces using Landmark
Editor v3.6 (Wiley et al., 2005). Its ‘patch’ tool allows the placement of discrete, consistently
defined landmarks at junction points of major brain regions (i.e., left and right cerebral hemispheres,
optic tecta, cerebellum, medulla) and specified density of semi-landmarks within these partitions
(see Supplementary file 1b). Despite its critical role in the neurosensory repertoire, we did not char-
acterize the shape of the olfactory tract and bulbs due to the incomplete preservation of this region
in fossil taxa. To extract shape data, we subjected the coordinate data to a generalized Procrustes
alignment (Gower, 1975; Rohlf and Slice, 1990) minimizing total bending energy, while allowing
semi-landmarks to slide on the mesh surface (Gunz et al., 2005; Gunz and Mitteroecker, 2013).
This was achieved using the slider3d and gpagen functions in the R packages Morpho v2.7
(Schlager, 2017) and geomorph v3.2.1 (Adams and Otárola-Castillo, 2013), respectively. To
remove redundant shape information but also avoid artifacts from aligning one side of bilaterally
Watanabe et al. eLife 2021;10:e68809. DOI: https://doi.org/10.7554/eLife.68809 12 of 21Research article Evolutionary Biology
symmetric structures (Cardini, 2016; Cardini, 2017), right landmarks were removed after aligning
bilateral coordinate data (Bardua et al., 2019). Ultimately, the left and midline landmarks were ana-
lyzed, including the left cerebrum (54 landmarks), left optic lobe (29 landmarks), left side of cerebel-
lum (18 landmarks), and left side of medulla (18 landmarks).
We generated two versions of the regional shape datasets—one based on global alignment of
entire endocranial data and second based on local alignment of regional shape data. The former
captures variation in both regional shape and relative position within the endocast, whereas the lat-
ter dataset exclusively characterizes the intrinsic shape of each region. We primarily report results
based on locally aligned regional shape data to mitigate the effect of relative positions of each
region on the coordinate data which would inflate the magnitude of integration between regions, as
well as shape differences (e.g., optic lobe located posterior to the cerebrum in Alligator and poster-
oventral to the cerebrum in crown birds). Results based on globally aligned regional shape data,
along with locally aligned data, are presented in the supplementary information (Supplementary file
1c–f; Figure 4—figure supplement 1). Besides shape, log-transformed centroid size of endocasts
was calculated from the coordinate data, which are known to be a reliable proxy for brain and body
size across birds and alligators (Marugán-Lobón et al., 2016; Watanabe et al., 2019). We assessed
the relative magnitude of digitization error by repeatedly collecting landmark data from a 1-day-old
chicken (10 replications), which accounted for 2.41% of the total shape variation of the dataset and
was thus considered to be negligible.
Time-calibrated phylogeny
First, we created a maximum clade credibility tree of extant birds from 3000 posterior trees based
on Hackett tree backbone available on birdtree.org (Jetz et al., 2012) using TreeAnnotator v1.8.1
(Drummond et al., 2012). Apteryx sp., Diomede sp., and Eudyptes sp. in our sampling were treated
as A. australis, D. exulans, and E. chrysocome for the purpose of constructing a tree including all
sampled taxa in this study. Then, we incorporated Alligator, Archaeopteryx, and non-avialan dino-
saurs to the tree based on the mean age of first occurrence age listed in the Paleobiology Database
(paleobiodb.org). Ages of internal nodes were determined by the maximum age between sister
groups to which the species belong (e.g., age of Paraves determined by maximum age of Deinony-
chosauria and Avialae). When the maximum age of sampled specimen was identical to that of its
clade, the age of the internal node was set to equally bisect the parent and descendent branch
(Bell and Lloyd, 2015). The Dodo (Raphus cucullatus) was placed based on estimated divergence
from Caloenas lineage at 15.1 Ma (Pereira et al., 2007). Similarly, the Great Auk (Pinguinus impen-
nis) was placed based on the mean stratigraphic age of earliest occurrence of its sister group Alca
(Smith, 2015). This combined paleontological and neontological tree was then modified to reflect
the updated topology and branch lengths proposed by a recent genomic study (Prum et al., 2015).
For sampled species not included in the genomic tree, a closest relative was chosen based on the
global tree of birds (Jetz et al., 2012).
Analysis
All statistical analyses were performed in R version 4.0.3 (R Development Core Team, 2020). To
visualize patterns of neuroanatomical variation, morphospaces for endocasts and their regions (cere-
brum, optic lobe, cerebellum, medulla) were constructed using scores from PCA on shape data. The
degree of phylogenetic signal, allometry, and evolutionary allometry was assessed with the physig-
nal, procD.lm, and procD.pgls functions, respectively, in the geomorph package with 1000 pseudo-
replications. These multivariate statistical tests have been demonstrated to be robust against type I
error and loss of power associated with specimen and landmark sampling (Adams, 2014a;
Adams, 2014b; Collyer et al., 2015). For visualizing allometric trends, we plotted the PC1 of resid-
uals from the overall shape-to-size relationship against scores along this allometric relationship
(Mitteroecker et al., 2004). The CAC function in the Morpho package was used to extract CAC
scores and residuals from this trend. Statistical differences between endocranial shapes and allome-
tric trajectories between clades were tested with the procD.lm function. We used the angleTest func-
tion in the Morpho R package to test for differences between vectors of evolutionary and
developmental shape change in full shape space. The evolutionary shape vector was created from
ancestral shape reconstruction for Coelurosauria and Neornithes using the anc.recon function in the
Watanabe et al. eLife 2021;10:e68809. DOI: https://doi.org/10.7554/eLife.68809 13 of 21Research article Evolutionary Biology
Rphylopars package (Goolsby, 2016). Developmental shape vectors were formulated using smallest
and largest endocasts sampled for Alligator and Gallus. Finally, we used two different statistics to
measure the degree of integration among the brain regions—rho based on ML (Goswami and Finar-
elli, 2016) and covariance ratio using the modularity.test function (Adams, 2016). Although known
to be susceptible to specimen and landmark sampling (Adams and Collyer, 2016), results based on
correlation coefficients from partial least squares (RPLS) using integration.test are also presented in
the supplementary information (Supplementary file 1d, e). Tests of neuroanatomical integration on
crown birds excluded Gallus to maintain separation from its developmental analysis. To test for one-
tailed differences in the degree of integration between clades, we used the compare.pls function in
the geomorph package which is robust to differences in specimen and landmark sampling
(Adams and Collyer, 2016). For statistical tests of interspecific data, we corrected the shape data
for phylogenetic structure based on phylogenetic generalized least-squares method with the excep-
tion of allometric trajectory comparison between non-avialan dinosaurs and crown birds.
Data availability
Aligned bilateral landmark data with original size information intact are available on Dryad (doi:10.
5061/dryad.qv9s4mwdk). The R code to perform the analyses presented in the study is accessible on
Github (https://github.com/akiopteryx/analyses; copy archived at swh:1:rev:c1df76ef1c770-
d464a9e8def31a763c8a47e58ba; Watanabe, 2021).
Acknowledgements
We are indebted to Ruth Elsey (Rockefeller Wildlife Refuge), Gregory Erickson (Florida State Univer-
sity), David Kay (currently Oklahoma State University, Center for Health Sciences), Broderick
Vaughan (Vaughan Gators), and Doug Warner (Charles River Laboratories) for providing Alligator
and Gallus specimens; Morgan Hill Chase (American Museum of Natural History) and Henry Towbin
(currently Columbia University), as well as Johnny Ng and Cheuk Ying Tang (Mount Sinai Hospital),
for assistance with CT imaging; Isabelle Brenes and Carolynn Merrill for assistance with processing
and segmenting CT data; William Harcourt-Smith, Emma Sherratt, and Jesus Marugán-Lobón for
helpful discussions related to this study; and Min Zhu, Alice Clement, and Federico Degrange for
constructive and thoughtful review of the manuscript.
Additional information
Funding
Funder Grant reference number Author
National Science Foundation Graduate Research Akinobu Watanabe
Fellowship
National Science Foundation DEB-1406849 Akinobu Watanabe
National Science Foundation DEB-1311790 M Eugenia L Gold
National Science Foundation DEB-1801224 Amy M Balanoff
Mark A Norell
National Science Foundation DEB-1457180 Paul M Gignac
National Science Foundation DEB-1754659 Paul M Gignac
Society of Vertebrate Paleon- Mary R. Dawson Predoctoral Akinobu Watanabe
tology Fellowship Grant
Jurassic Foundation Akinobu Watanabe
Macaulay Family Endowment Mark A Norell
Newt and Callista Gingrich Mark A Norell
Endowment
American Museum of Natural Division of Paleontology Akinobu Watanabe
History Amy M Balanoff
Paul M Gignac
Watanabe et al. eLife 2021;10:e68809. DOI: https://doi.org/10.7554/eLife.68809 14 of 21Research article Evolutionary Biology
M Eugenia L Gold
Mark A Norell
The funders had no role in study design, data collection and interpretation, or the
decision to submit the work for publication.
Author contributions
Akinobu Watanabe, Conceptualization, Resources, Data curation, Formal analysis, Funding acquisi-
tion, Validation, Investigation, Visualization, Methodology, Writing - original draft, Project adminis-
tration, Writing - review and editing; Amy M Balanoff, Paul M Gignac, M Eugenia L Gold, Resources,
Funding acquisition, Writing - review and editing; Mark A Norell, Resources, Data curation, Supervi-
sion, Funding acquisition, Writing - review and editing
Author ORCIDs
Akinobu Watanabe https://orcid.org/0000-0001-5057-4772
Amy M Balanoff https://orcid.org/0000-0003-4030-3818
Paul M Gignac http://orcid.org/0000-0001-9181-3258
M Eugenia L Gold https://orcid.org/0000-0003-4317-3625
Ethics
Animal experimentation: The handling of alligator specimens used in this study was approved by
institutional animal care and use committee (IACUC) where the protocols were conducted (Stony
Brook University IACUC protocol #236370-1, Oklahoma State University Center for Health Sciences
IACUC protocol #2015-1). The chicken specimens were euthanized by Charles River Laboraties. The
chicken and alligator specimens were euthanized using cervical dislocation and administration of
pentobarbital sodium, respectively, and every effort was made to minimize suffering.
Decision letter and Author response
Decision letter https://doi.org/10.7554/eLife.68809.sa1
Author response https://doi.org/10.7554/eLife.68809.sa2
Additional files
Supplementary files
. Supplementary file 1. Supplementary tables related to this study. (a) List of taxa sampled for this
study, with the exclusion of Alligator and Gallus. Institutional abbreviations: AMNH, American
Museum of Natural History, New York, NY, USA; BMNH, British Museum of Natural History, London,
UK; FMNH, Field Museum of Natural History, Chicago, IL, USA; KU, University of Kansas, Lawrence,
KS, USA; NMNH, National Museum of Natural History, Washington DC, USA; TCWC, Texas Cooper-
ative Wildlife Collection, College Station, TX, USA; TMM, Texas Memorial Museum, Austin, TX, USA;
WDC, Wyoming Dinosaur Center, Thermopolis, WY, USA. (b) List of discrete landmarks and density
of semi-landmarks for each neuroanatomical region. (c) Phylogenetic signal (Blomberg’s K), allome-
try, and evolutionary allometry in endocranial shape. Results generated using physignal, procD.lm,
procD.pgls functions in geomorph R package v3.2.1 (Adams and Otárola-Castillo, 2013). Results
from analysis on globally and locally aligned regions are presented as first and second values within
a cell, respectively. Allometry evaluated with log-transformed centroid size of the entire endocast
and local region, respectively. *, **, and *** indicate pResearch article Evolutionary Biology
coefficient (r; diagonal, lower off-diagonal) using the R packages geomorph v3.2.1 (Adams and
Otárola-Castillo, 2013) and EMMLi v2 v0.0.3 (Goswami and Finarelli, 2016), respectively. Interspe-
cific analyses are phylogenetically corrected using phylogenetic generalized least-squares method.
(f) Integration between neuroanatomical regions using covariance ratios (CR) (Adams, 2016). Degree
of integration between globally aligned regional shapes are listed in the upper off-diagonal ele-
ments and that of locally aligned regional shapes in the lower off-diagonal elements. Interspecific
analyses are phylogenetically corrected using phylogenetic generalized least-squares method. (g)
Comparison of integration among neuroanatomical regions using the compare.pls function in the
geomorph R package (Adams and Otárola-Castillo, 2013; Adams and Collyer, 2016). ‘+’ and ‘–’
denote greater and lesser integration in Neornithes and Gallus compared to non-avialan coeluro-
saurs and Alligator, respectively. Integration among species calculated upon phylogenetic correc-
tion. *, **, and *** indicate pResearch article Evolutionary Biology
and their dinosaurian relatives. Journal of Anatomy 229:173–190. DOI: https://doi.org/10.1111/joa.12378,
PMID: 26403623
Balanoff AM, Smaers JB, Turner AH. 2016b. Brain modularity across the theropod-bird transition: testing the
influence of flight on neuroanatomical variation. Journal of Anatomy 229:204–214. DOI: https://doi.org/10.
1111/joa.12403, PMID: 26538376
Balanoff AM, Bever GS. 2017. The role of endocasts in the study of brain evolution. In: Kaas J (Ed). Evolution of
Nervous Systems. vol 1 2nd. Oxford: Elsevier. p. 223–241. DOI: https://doi.org/10.1016/B978-0-12-820584-6.
00003-9
Bardua C, Felice RN, Watanabe A, Fabre AC, Goswami A. 2019. A practical guide to sliding and surface
semilandmarks in morphometric analyses. Integrative Organismal Biology 1:obz016. DOI: https://doi.org/10.
1093/iob/obz016, PMID: 33791531
Barton RA. 1998. Visual specialization and brain evolution in primates. PNAS 265:1933–1937. DOI: https://doi.
org/10.1098/rspb.1998.0523
Barton RA, Capellini I. 2011. Maternal investment, life histories, and the costs of brain growth in mammals. PNAS
108:6169–6174. DOI: https://doi.org/10.1073/pnas.1019140108, PMID: 21444808
Barton RA, Harvey PH. 2000. Mosaic evolution of brain structure in mammals. Nature 405:1055–1058.
DOI: https://doi.org/10.1038/35016580, PMID: 10890446
Bayern A, Danel S, Auersperg AMI, Mioduszewska B, Kacelnik A. 2018. Compound tool construction by new
caledonian crows. Scientific Reports 8:15676. DOI: https://doi.org/10.1038/s41598-018-33458-z, PMID: 303560
96
Bell MA, Lloyd GT. 2015. Strap: an R package for plotting phylogenies against stratigraphy and assessing their
stratigraphic congruence. Palaeontology 58:379–389. DOI: https://doi.org/10.1111/pala.12142
Beyrand V, Voeten D, Bureš S, Fernandez V, Janáček J, Jirák D, Rauhut O, Tafforeau P. 2019. Multiphase
progenetic development shaped the brain of flying archosaurs. Scientific Reports 9:1–15. DOI: https://doi.org/
10.1038/s41598-019-46959-2, PMID: 31346192
Bhullar B-AS, Marugán-Lobón J, Racimo F, Bever GS, Rowe TB, Norell MA, Abzhanov A. 2012. Birds have
paedomorphic dinosaur skulls. Nature 487:223–226. DOI: https://doi.org/10.1038/nature11146
Boeckle M, Schiestl M, Frohnwieser A, Gruber R, Miller R, Suddendorf T, Gray RD, Taylor AH, Clayton NS. 2020.
New caledonian crows plan for specific future tool use. PNAS 287:20201490. DOI: https://doi.org/10.1098/
rspb.2020.1490
Bookstein FL, Gunz P, Mitteroecker P, Prossinger H, Schaefer K, Seidler H. 2003. Cranial integration in Homo:
singular warps analysis of the midsagittal plane in ontogeny and evolution. Journal of Human Evolution 44:167–
187. DOI: https://doi.org/10.1016/S0047-2484(02)00201-4, PMID: 12662941
Bullar CM, Zhao Q, Benton MJ, Ryan MJ. 2019. Ontogenetic braincase development in Psittacosaurus
lujiatunensis (Dinosauria: Ceratopsia) using micro-computed tomography. PeerJ 7:e7217–e7251. DOI: https://
doi.org/10.7717/peerj.7217
Butler AB, Hodos W. 2005. Comparative Vertebrate Neuroanatomy: Evolution and Adaptation. Hoboken, NJ:
Wiley-Interscience.
Cardini A. 2016. Lost in the other half: improving accuracy in geometric morphometric analyses of one side of
bilaterally symmetric structures. Systematic Biology 65:1096–1106. DOI: https://doi.org/10.1093/sysbio/
syw043, PMID: 27288476
Cardini A. 2017. Left, right or both? estimating and improving accuracy of one-side-only geometric
morphometric analyses of cranial variation. Journal of Zoological Systematics and Evolutionary Research 55:1–
10. DOI: https://doi.org/10.1111/jzs.12144
Charvet CJ, Striedter GF. 2011. Developmental modes and developmental mechanisms can channel brain
evolution. Frontiers in Neuroanatomy 5:1–5. DOI: https://doi.org/10.3389/fnana.2011.00004, PMID: 21369349
Collyer ML, Sekora DJ, Adams DC. 2015. A method for analysis of phenotypic change for phenotypes described
by high-dimensional data. Heredity 115:357–365. DOI: https://doi.org/10.1038/hdy.2014.75, PMID: 25204302
De Miguel C, Henneberg M. 1998. Encephalization of the koala, Phascolarctos cinereus. Australian Mammalogy
20:315–320. DOI: https://doi.org/10.1071/AM98315
Drummond AJ, Suchard MA, Xie D, Rambaut A. 2012. Bayesian phylogenetics with BEAUti and the BEAST 1.7.
Molecular Biology and Evolution 29:1969–1973. DOI: https://doi.org/10.1093/molbev/mss075, PMID: 2236774
8
Dugas-Ford J, Rowell JJ, Ragsdale CW. 2012. Cell-type homologies and the origins of the neocortex. PNAS 109:
16974–16979. DOI: https://doi.org/10.1073/pnas.1204773109, PMID: 23027930
Early CM, Iwaniuk AN, Ridgely RC, Witmer LM. 2020. Endocast structures are reliable proxies for the sizes of
corresponding regions of the brain in extant birds. Journal of Anatomy 237:1162–1176. DOI: https://doi.org/
10.1111/joa.13285, PMID: 32892372
Edinger T. 1975. Paleoneurology, 1804–1966: An Annotated Bibliography. In: Schmeisser M. J, Kmiec Z (Eds).
Advances in Anatomy, Embryology and Cell Biology. Springer. p. 12–258. DOI: https://doi.org/10.1007/978-3-
642-66029-0
Emery NJ. 2006. Cognitive ornithology: the evolution of avian intelligence. Philosophical Transactions of the
Royal Society B: Biological Sciences 361:23–43. DOI: https://doi.org/10.1098/rstb.2005.1736
Erickson GM, Curry Rogers K, Varricchio DJ, Norell MA, Xu X. 2007. Growth patterns in brooding dinosaurs
reveals the timing of sexual maturity in non-avian dinosaurs and genesis of the avian condition. Biology Letters
3:558–561. DOI: https://doi.org/10.1098/rsbl.2007.0254
Watanabe et al. eLife 2021;10:e68809. DOI: https://doi.org/10.7554/eLife.68809 17 of 21You can also read