Electric Mobility 3.8 - SLOCAT Transport and Climate Change ...

Page created by Gloria Holland
 
CONTINUE READING
Electric Mobility 3.8 - SLOCAT Transport and Climate Change ...
Tr a n s p o r t a n d C l i m a t e C h a n g e G l o b a l S t a t u s R e p o r t - 2 n d e d i t i o n

3.8
Electric
Mobility

Key findings
                                                                                                                cars) were deployed through company fleets. Around
   Demand trends
                                                                                                                31,000 electric trucks were operating worldwide by
  The global stock of electric passenger cars (battery and                                                      year’s end, but they represented less than 1% of total
  plug-in electric hybrids) grew 40% in 2020 to more than                                                       truck sales.
  10 million vehicles (up from more than 7.2 million in 2019);
                                                                                                                Public and private charging infrastructure for electric
  this represented 1% of the 2020 total vehicle stock.
                                                                                                                vehicles has scaled up rapidly in some countries,
  More than 600,000 electric buses were in operation                                                            although charging point distribution and the ratio of
  in 2020. As of 2019, 18% of the world’s buses were                                                            electric vehicles to charging points vary widely.
  powered through electric sources, including battery
  electric (6.3%), hybrid-electric (7.9%) and direct
  overhead wires and similar (3%).                                                                                Emission trends
  The global stock of electric two- and three-wheelers                                                          Electric vehicles contribute at least 22% fewer carbon
  (excluding electric-assisted bikes) totalled 290 million                                                      dioxide (CO2) emissions than internal combustion
  in 2020. Around one-quarter of all motorised two-                                                             engines, even when the electricity used for charging
  wheelers worldwide were electric that year.                                                                   is generated from fossil fuel sources. While electric
                                                                                                                vehicles are more energy efficient than conventional
  Electric-assisted bicycles (e-bikes) are by far the most
                                                                                                                vehicles overall, they offer even greater potential
  popular electrified road transport mode in Europe
                                                                                                                for emission reductions if they are based on clean
  and North America; e-bike sales in Europe surpassed
                                                                                                                renewable energy.
  4.8 million units in 2020, three times the number of
  electric passenger cars sold in the European Union                                                            Life-cycle emissions and the impact of electric
  (EU) that year.                                                                                               vehicle batteries must be considered when
                                                                                                                comparing the environmental footprints of
  Between 2010 and 2020, the average price of electric
                                                                                                                electric versus conventional vehicles. Major
  vehicle batteries dropped 88%, from around USD
                                                                                                                concerns include the extraction of raw materials
  1,200 per kilowatt-hour (kWh) to USD 137 per kWh,
                                                                                                                and the recycling of batteries. Policies to extend
  increasing the potential for more widespread uptake of
                                                                                                                the useful life of electric vehicle batteries can
  electric vehicles.
                                                                                                                help governments and manufacturers offset the
  By the end of 2020, more than 170,000 electric                                                                production costs, impacts and emissions.
  vehicles (three-wheelers, light trucks and company
Electric Mobility 3.8 - SLOCAT Transport and Climate Change ...
R e s p o n s e s t o A d d r e s s C l i m a t e C h a n g e i n t h e Tr a n s p o r t S e c t o r
                                                                                                                                Electric Mobility

                                                                             among sustainable, low carbon transport modes (both passenger
                                                                             and freight). Governments, industry, civil society and citizens
        Policy measures                                                      need to create an enabling environment for sustainable mobility.
       Countries have adopted ambitious time-bound                           In developing countries, electrifying all transport modes, starting
       targets to increase the share of electric vehicles in                 with motorcycles, public transport, and rail, can avoid fossil fuel
       their overall fleets. By the end of 2020, 19 countries                dependency and the high costs associated with air pollution and
       or sub-national jurisdictions had set targets to                      private car ownership.
       phase out diesel and petrol passenger vehicles.
       In 2020, the first-of-its-kind Zero Emission Vehicle                  The COVID-19 pandemic accelerated the uptake of electric vehicles
       Transition Council was established, comprising                        through increased purchase subsidies, which were included in
       ministers and representatives from the world’s                        economic stimulus packages (see Box).1 Sales of electric passenger
       largest and most progressive car markets.                             cars grew strongly in major markets in 2020, and in North America
       In response to phase-out targets by countries,                        and Europe many commuters shifted to electric-assisted bicycles,
       major automobile companies are halting the                            leading to three-digit growth in e-bike sales.2
       development of internal combustion engines
       and accelerating their electric vehicle ambitions
       towards the 2030/2035 time frame.                                     Demand trends 
       Leapfrogging to electric mobility in Africa, Asia and
       Latin America can bring significant benefits to local                 The global stock of electric passenger cars (battery and plug-
       environments and economies.                                           in electric hybrids) grew 40% in 2020 to more than 10 million
       Utilities are taking on a greater role in the mobility                vehicles (up from more than 7.2 million in 2019); this represented
       ecosystem, thereby merging the value chains for                       1% of the 2020 total vehicle stock (see Figure 1).3 China, Europe
       electricity generation and electric vehicle charging.                 and the United States of America (USA) remained the leaders in
                                                                             electric passenger car sales, followed by the Republic of Korea,
        Impacts of the COVID-19 pandemic                                     Australia and Canada.4
       Despite temporary shutdowns of auto factories
                                                                                The highest sales of passenger electric vehicles in 2020
       and disruptions in global supply chains due to the
                                                                                 were recorded in China, led by Shanghai followed by Beijing,
       pandemic, more than 3 million electric cars were
                                                                                 Shenzhen, Hangzhou, Tianjin and Guangzhou.5
       sold worldwide in 2020, surpassing projections of
                                                                                 In Norway, electric cars (battery and plug-in hybrids) accounted
       2.4 million.
                                                                                 for more than 60% of new vehicle sales in 2019 and 69% of sales
       Electric vehicle sales jumped to 4.6% of global
                                                                                 in the first six months of 2020.6 Since January 2018, monthly
       vehicles sold in 2020.
                                                                                 sales of electric passenger cars have outnumbered any other
       A number of governments have increased electric
                                                                                 drivetrain in Norway on average (see Figure 2).7
       vehicle investments as part of their COVID-19
       recovery packages.                                                    More than 600,000 electric buses were in operation in 2020.8 As
                                                                             of 2019, 18% of the world’s buses were powered through electric
                                                                             sources, including battery electric (6.3%), hybrid-electric (7.9%)
                                                                             and direct overhead wires and similar (see Figure 3).9 Over 75,000
Overview                                                                    new electric buses were introduced each year in 2019 and 2020
                                                                             (down 20% from 2018, when 93,000 units were sold).10 China
Between 2019 and 2020, the global landscape of electric mobility             was home to more than 90% of the world’s electric buses in 2020,
shifted from “commitment-centric” to “implementation-minded.”                followed by North America and Europe, whereas the buses are
Many public and private players have set specific targets for                largely underrepresented in Africa.11
electrifying their fleets and banning diesel and petrol vehicles in
                                                                             Electric buses can greatly improve the service quality of bus
countries or cities by a certain year. Interest has also risen in electric
                                                                             transport, bringing cleaner technology and resulting in less noise
two- and three-wheelers. Logistics businesses have increased
                                                                             and more comfort, while improving air quality and having positive
investments in electric fleets, and electric freight vehicles (such
                                                                             overall health benefits for citizens.12 The advantages of electric
as trucks and electric cargo bikes) are being deployed in Europe,
                                                                             buses have the potential to attract more people and to strengthen
North America and Asia.
                                                                             the use of sustainable transport modes.
Large-scale progress in electric mobility has been concentrated
                                                                                 In the EU, around 12% of newly registered buses in 2019 – or
in China and Europe. However, these experiences have pointed
                                                                                 more than 1,600 units – were electric; this is more than the
to the need to identify partnerships, policies and new business
                                                                                 region’s total electric bus fleet from 2012 to 2018 and a three-
models for implementing projects (such as creating broad charging
                                                                                 fold increase compared to 2018.13
infrastructure networks) and operating them viably and equitably.
Key to sustainable electric mobility is maximising the intermodality

                                                                                                                                                    2
R e s p o n s e s t o A d d r e s s C l i m a t e C h a n g e i n t h e Tr a n s p o r t S e c t o r

                                                                                                                                                                   Tr a n s p o r t a n d C l i m a t e C h a n g e G l o b a l S t a t u s R e p o r t - 2 nd e d i t i o n

                                                                                                           Figure 1.                                             Electric passenger car stock (battery and plug-in electric hybrids), by region, 2010-2020

                                                                                                                                                                                                                                                                                     Other
                                                                                                                                                                                                                                                                                           4%
                                                                                                                                                                                                         11                                            USA
                                                                                                                                                                                                                                                       18%
                                                                                                                                                                                                         10
                                                                                                                                                                                                                                                                                                                                                                                                                                                                               Oceania
                                                                                                                                                                                                          9                                                                                                                                        China
                                                                                                                                                                                                                                                                                                                                                     46%
                                                                                                                                                                                                          8                                                              Electric passenger                                                 China                                                                                                                              North America
                                                                                                                                                                   Global electric passenger car stock

                                                                                                                                                                                                                                                                           car stock share                                                  47%
                                                                                                                                                                                                          7
                                                                                                                                                                                                                                                                             by region
                                                                                                                                                                            (million vehicles)

                                                                                                                                                                                                          6                                                                                                                                                                                                                                                               Europe
                                                                                                                                                                                                                                                  Europe
                                                                                                                                                                                                          5                                            32%
                                                                                                                                                                                                                                                                                                                                                                                                                                                                          Latin America
                                                                                                                                                                                                          4

                                                                                                                                                                                                          3

                                                                                                                                                                                                                                                                                                                                                                                                                                                                          Asia
                                                                                                                                                                                                          2

                                                                                                                                                                                                          1
                                                                                                                                                                                                                                                                                                                                                                                                                                                                          Africa
                                                                                                                                                                                                          0
                                                                                                                                                                                                                      2010                   2011               2012              2013              2014               2015                2016               2017               2018                  2019              2020

                                                                                                           Source: See endnote 3 for this section.

                                                                                                           Figure 2. New car registrations in Norway by vehicle type, 2015-2020

                                                                                                                                                          100%
                                                                                                             Share of monthly car registrations by type

                                                                                                                                                          90%

                                                                                                                                                          80%

                                                                                                                                                          70%

                                                                                                                                                          60%

                                                                                                                                                          50%

                                                                                                                                                          40%

                                                                                                                                                          30%

                                                                                                                                                          20%

                                                                                                                                                          10%

                                                                                                                                                           0%
                                                                                                                                                                                                                  Jul 15
                                                                                                                                                                                  Mar 15

                                                                                                                                                                                                                                                                         Jul 16

                                                                                                                                                                                                                                                                                                                                                                                     Jul 18

                                                                                                                                                                                                                                                                                                                                                                                                                                           Jul 19
                                                                                                                                                                                                                                                       Mar 16

                                                                                                                                                                                                                                                                                                                                                                                                                         Mar 19

                                                                                                                                                                                                                                                                                                                                                                                                                                                                                                  Jul 20
                                                                                                                                                                                                         May 15

                                                                                                                                                                                                                                                                                                                               Jul 17

                                                                                                                                                                                                                                                                                                                                                                   Mar 18
                                                                                                                                                                                                                                    Nov 15

                                                                                                                                                                                                                                                                May 16

                                                                                                                                                                                                                                                                                                             Mar 17

                                                                                                                                                                                                                                                                                                                                                                            May 18

                                                                                                                                                                                                                                                                                                                                                                                                                                  May 19

                                                                                                                                                                                                                                                                                                                                                                                                                                                                                Mar 20
                                                                                                                                                                                                                                                                                           Nov 16

                                                                                                                                                                                                                                                                                                                                                                                                       Nov 18

                                                                                                                                                                                                                                                                                                                                                                                                                                                             Nov 19
                                                                                                                                                                 Jan 15

                                                                                                                                                                                                                                                                                                                      May 17

                                                                                                                                                                                                                                                                                                                                                                                                                                                                                         May 20
                                                                                                                                                                                                                                              Jan 16

                                                                                                                                                                                                                                                                                                                                                 Nov 17
                                                                                                                                                                                                                                                                                                                                                          Jan 18

                                                                                                                                                                                                                                                                                                                                                                                                                Jan 19

                                                                                                                                                                                                                                                                                                                                                                                                                                                                                                                    Nov 20
                                                                                                                                                                                                                                                                                                    Jan 17

                                                                                                                                                                                                                                                                                                                                                                                                                                                                      Jan 20
                                                                                                                                                                                                                           Sep 15

                                                                                                                                                                                                                                                                                  Sep 16

                                                                                                                                                                                                                                                                                                                                                                                              Sep 18

                                                                                                                                                                                                                                                                                                                                                                                                                                                    Sep 19
                                                                                                                                                                                                                                                                                                                                        Sep 17

                                                                                                                                                                                                                                                                                                                                                                                                                                                                                                           Sep 20

                                                                                                                                                                                                           Other                     Gasoline                            Gasoline HEV                                 Gasoline PHEV                                Diesel                     Diesel HEV                           Diesel PHEV                                 Electric

                                                                                                           Source: See endnote 7 for this section.

                                                                                                       3
R e s p o n s e s t o A d d r e s s C l i m a t e C h a n g e i n t h e Tr a n s p o r t S e c t o r
                                                                                                                                   Electric Mobility

Figure 3. Shares of bus propulsion systems globally,                            wheelers as well as expedited permitting to vehicle owners
          by type, 2019                                                         who switch to electric three-wheelers powered by advanced
                                                                                batteries (lithium-ion over lithium-acid).24

                                                                                In its second Nationally Determined Contribution towards
                Bus propulsion systems as of 2019
                                                                                reducing emissions under the Paris Agreement, Nepal set

                                                       Diesel and               a target for electric vehicle sales (passenger cars and two-
                                                       additives                wheelers) to represent 90% of all passenger vehicle sales
                                                         17.4%                  (including two-wheelers) by 2030.25
 Diesel
 50.0%                                                                          With support from the Department of Energy, 900 e-trikes started
                                                                                operation in Metro Manila in the Philippines as part of a larger
                                                                                national programme to support the introduction of 3,000 e-trikes.26

                                                                   CNG      Electric-assisted bicycles (e-bikes) are by far the most popular
                                                                  10.5%
                                                                            electrified road transport mode in Europe and North America;
                                                                            e-bike sales in Europe surpassed 4.8 million units in 2020, three
                                                                            times the number of electric passenger cars sold in the EU that
                                                                 Hybrid     year.27 If the trend continues, e-bike sales in Europe could reach 10
                                                                  7.8%      million units by 2024.28 E-bikes can substitute car trips and serve
                                                                            as an important link to public transport. In the context of transport
                                                                            emissions, it is important to analyse where the shift to e-bikes comes
                                                         Electric battery
                                                                            from (see Section 3.3 on Walking and Cycling).
                                                             6.3%
                                                 Biodiesel
                      LPG                                                       E-bikes have entered the market in Latin America and the
                                     Electricity   4.1%
                      0.7%                                                      Caribbean mainly through bike-sharing services, as illustrated by
                                       3.0%
                                                                                examples from Colombia and Ecuador between 2015 and 2018.29
                                                                                In the USA, e-bike sales grew 145% between 2019 and 2020
                                                                                as models became more affordable.30 Bike-sharing services
Source: See endnote 9 for this section.                                         offering e-bikes are more popular and more widely used than
                                                                                services with regular shared bicycles.31

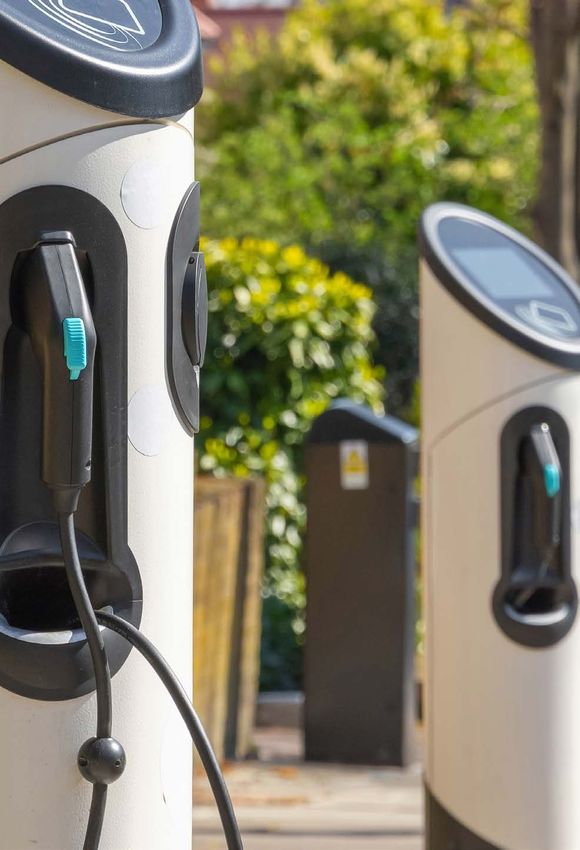
                                                                            Between 2010 and 2020, the average price of electric vehicle
                                                                            batteries dropped 88%, from around USD 1,200 per kWh to USD
     As of March 2021, cities in Latin America had a total electric         137 per kWh, increasing the potential for more widespread uptake
     bus fleet of close to 3,000 buses.14 Santiago, Chile and Bogotá,       of electric vehicles (see Figure 4).32 Batteries represent 30-40% of
     Colombia each had 400 electric buses, while Brazil and Mexico          the capital cost of an electric vehicle and play a key role in increasing
     added around 250 electric buses each in 2019 and 2020.15               the potential for more widespread uptake of affordable models.33
    The electrification of school buses has great potential in              Battery prices are projected to fall below USD 100 per kWh by 2024
     North America. The USA has a fleet of 480,000 school buses             as cumulative demand grows.34 At this price point, electric vehicles
     (representing 80% of all buses in the country) and the target is to    could reach price parity with internal combustion engine vehicles,
     electrify them by 2030.16 Canada has committed to electrifying         depending on the region and vehicle segment.35
     5,000 buses between 2021 and 2025.          17
                                                                            Systems for swapping out electric vehicle batteries are seen as a
     in December 2019, Uganda introduced its first electric buses,
                                                                            solution to reduce costs and increase operational efficiency, due to
     two units that were locally produced.18
                                                                            faster recharging times. Battery swapping systems are increasingly
The global stock of electric two- and three-wheelers (excluding             relevant in markets with large shares of electric two-wheelers, such
electric-assisted bicycles) totalled 290 million in 2020.19 Around          as India and Chinese Taipei.36
one-quarter of all motorised two-wheelers worldwide were electric
                                                                            By the end of 2020, more than 170,000 electric vehicles (three-
that year.20 The majority of two-wheelers are in China, which is also
                                                                            wheelers, light trucks and company cars) were deployed
one of the largest manufacturers of electric two-wheelers.21 A rise in
                                                                            through company fleets.37 Around 31,000 electric trucks were
shared electric two-wheelers, particularly in South Asia, is attributed
                                                                            operating worldwide by year’s end, but they represented less
to their low operating costs and to long daily driving distances that
                                                                            than 1% of total truck sales.38 Freight and logistics companies,
are routine for last-mile connectivity and logistics businesses.22
                                                                            among other corporate fleets, are adopting electric vehicles for
     India has seen market-driven growth in electric three-wheelers,        last-mile deliveries to increase performance and reduce operating
     which are used for last-mile connectivity.23 As of 2020, eight         costs. Urban deliveries have grown rapidly in past years and then
     state governments in the country were offering rebates for three-      skyrocketed during the COVID-19 pandemic. For long-distance

                                                                                                                                                        4
R e s p o n s e s t o A d d r e s s C l i m a t e C h a n g e i n t h e Tr a n s p o r t S e c t o r

                                                                                                                            Tr a n s p o r t a n d C l i m a t e C h a n g e G l o b a l S t a t u s R e p o r t - 2 nd e d i t i o n

                                                                                                           Figure 4. Average price of an electric vehicle battery pack, 2010-2020

                                                                                                                                                                                             Price reduced
                                                                                                                                                                  1200
                                                                                                                                                                                                   by:
                                                                                                                               Battery pack price (USD per kWh)

                                                                                                                                                                                                  89%

                                                                                                                                                                  800

                                                                                                                                                                  400

                                                                                                                                                                        0
                                                                                                                                                                            2010   2011   2012   2013       2014         2015           2016   2017   2018    2019     2020

                                                                                                           Source: See endnote 32 for this section.

                                                                                                           road freight, the electrification of trucks requires both high-capacity                                        process. It requires adequate financing, land-use planning and real
                                                                                                           batteries and high-power charging infrastructure (to minimise the                                              estate acquisition, local permitting, grid connection (and related
                                                                                                           charging time).39                                                                                              pricing), equipment installation, and the implementation of safety
                                                                                                                                                                                                                          and wayfinding measures for consumers, among other steps.47 The
                                                                                                                Amazon is slated to begin using 10,000 electric delivery                                                  ratio of electric vehicles to charging points is 3:1 in China, 25:1 in
                                                                                                                vehicles (three- and four-wheeler) in India from 2021 onwards.40                                          California, USA and 30:1 in Norway.48
                                                                                                               The company invested in Rivian, an electric truck start-up that
                                                                                                                will deliver 100,000 electric trucks to Amazon by 2030.41                                                        In China, more than 1.2 million charging points had been
                                                                                                                In 2018, IKEA began goods delivery using solar-powered auto-                                                     installed by the end of 2019.49 The country has allocated USD
                                                                                                                rickshaws in India.                                42
                                                                                                                                                                        The company completed a transition to                    638 million for construction related to charging infrastructure,
                                                                                                                electric vehicle fleets in Shanghai in 2019 and will next target                                                 and many regions have amended their building codes to help
                                                                                                                New York, Los Angeles, Paris and Amsterdam.43 IKEA aims                                                          create electric vehicle-ready buildings.50
                                                                                                                for all customer deliveries from stores worldwide to occur via                                                  Among the 144,000 charging points in the EU by 2019, more
                                                                                                                electric vehicle by 2025.44                                                                                      than 26% were in the Netherlands (37,037), 19% in Germany
                                                                                                               The UK’s Royal Mail trialled e-trikes in cities for a six-month                                                  (27,459), 17% in France (24,850) and 13% in the UK (19,076).51
                                                                                                                period in 2019.45                                                                                                Policy tools for growing the charging infrastructure network
                                                                                                                In 2020, UPS ordered more than 10,000 electric freight vehicles,                                                 in Europe include tax benefits and subsidies for individuals,
                                                                                                                which are being rolled out in the company’s European and                                                         housing co-operatives and businesses to install charging
                                                                                                                North American fleets to 2024.46                                                                                 equipment.52
                                                                                                                                                                                                                                 In 2019, the first public electric vehicle charging stations
                                                                                                           Public and private charging infrastructure for electric vehicles
                                                                                                                                                                                                                                 in Qatar were installed, with 216 solar panels enabling the
                                                                                                           has scaled up rapidly in some countries, although charging point
                                                                                                                                                                                                                                 charging of 24 cars.53
                                                                                                           distribution and the ratio of electric vehicles to charging points
                                                                                                                                                                                                                                 In the USA, the government-funded charging network
                                                                                                           vary widely. Creating a network of electric vehicle charging points
                                                                                                                                                                                                                                 programme ChargePoint collaborates with industry players to
                                                                                                           (public or private) in a city is a capital-intensive and collaborative
                                                                                                                                                                                                                                 help expand the EV charging network in US cities.54

                                                                                                       5
R e s p o n s e s t o A d d r e s s C l i m a t e C h a n g e i n t h e Tr a n s p o r t S e c t o r
                                                                                                                                  Electric Mobility

Emission trends                                                           Policy measures 

Electric vehicles contribute at least 22% fewer CO2 emissions than         Countries have adopted ambitious time-bound targets to increase
internal combustion engines, even when the electricity used for            the share of electric vehicles in their overall fleets. By the end of
charging is generated from fossil fuel sources.      55
                                                          While electric   2020, 19 countries or sub-national jurisdictions had set targets
vehicles are more energy efficient than conventional vehicles              to phase out diesel and petrol passenger vehicles (see Figure 5).67
overall, they offer even greater potential for emission reductions if      However, there is a strong need to consider how electric mobility
they are based on clean renewable energy. In general, the energy           projects around the world are (or are not) integrating wider socio-
loss associated with electric vehicles is lower than for vehicles with     economic and environmental equity considerations into these
internal combustion engines.56 Even in a carbon-intensive scenario         formal targets.
(e.g., a battery produced in China and charged through a coal-heavy
                                                                               In 2019, several countries announced that they would phase
power grid, such as in Poland), electric vehicles emit 22% fewer life-
                                                                               out sales of diesel and petrol cars, including Sweden by 2030,
cycle CO2 emissions than diesel cars and 28% fewer emissions than
                                                                               Canada and France by 2040 and Cabo Verde by 2050.68 In
petrol cars.57
                                                                               2020, the UK moved forward its phase-out target to 2035, while
    The electric bus fleet in Latin America saves an estimated                 Spain announced a phase-out target for 2040.69
    129,070 tonnes of CO2 per year, while accounting for only 1.3%             Many sub-national entities have made commitments to ban
    of public buses in the region.58                                           fossil fuel vehicles. For example, Amsterdam, the Netherlands;
    The trial introduction of 60 electric buses in Singapore                   Brussels, Belgium; and San Francisco, California, US aim to
    reduced CO2 emissions by an estimated 7,840 tonnes annually,               allow only zero-emission vehicles within their city centres by
    equivalent to the amount produced by 1,700 passenger cars.59               2030.70
    In Vietnam, the electrification of motorcycles has the second              British Columbia, Canada, under its CleanBC initiative, has
    highest potential for reducing CO2 emissions from transport                funded a province-wide training programme with the British
    (after new fuel economy standards).60                                      Columbia Institute of Technology to prepare an electric vehicle
                                                                               maintenance workforce.71 The province also aims for 100% of
Life-cycle emissions and the impact of electric vehicle batteries
                                                                               light-duty vehicle sales to be electric from 2040.72
must be considered when comparing the environmental
footprints of electric versus conventional vehicles.61 Major               (See the end of this section for an overview of electric mobility targets
concerns include the extraction of raw materials and the recycling         set by countries.)
of batteries. Policies to extend the useful life of EV batteries can
                                                                           In 2020, the first-of-its-kind Zero Emission Vehicle Transition
help governments and manufacturers offset the production costs,
                                                                           Council       was    established,     comprising      ministers     and
impacts and emissions.62 Electric vehicles are made from many
                                                                           representatives from the world’s largest and most progressive car
different materials, including rare earth metals that are located in
                                                                           markets.73 Hosted by the UK presidency of the 2021 United Nations
a small number of countries and are extracted via processes that
                                                                           Climate Conference (COP26), the council includes representatives
lack environmental protection measures and reflect poor working
                                                                           from California, Canada, Denmark, the EU, France, India, Italy, Japan,
conditions.63 Automakers have formed partnerships with battery
                                                                           Mexico, the Netherlands, Norway, the Republic of Korea, Spain,
cell makers as well as state-owned mines to secure raw materials,
                                                                           Sweden and the UK.74 It aims to co-ordinate efforts to overcome
including cobalt, lithium and graphite.
                                                                           strategic, political and technical barriers to zero-emission vehicles,
    Some regions have enacted policies supporting the reuse of             while accelerating their production.75
    electric vehicle batteries (for example, as stationary energy
                                                                           In response to phase-out targets by countries, major automobile
    storage systems on telecommunication towers in China) as
                                                                           companies are halting the development of internal combustion
    well as battery recycling (to recover scarce minerals, as through
                                                                           engines and accelerating their electric vehicle ambitions towards
    directives in Europe and Japan), in addition to safe disposal.64
                                                                           the 2030/2035 time frame. Automakers have started to revise their
    In 2020, a large-scale EU-funded research initiative released a
                                                                           electric vehicle production and to shift research and investments
    roadmap for forward-looking battery research and approaches to
                                                                           from combustion engines to electric drivetrains. However, current
    identify safe, sustainable and affordable battery technologies.65
                                                                           plans still leave a gap between the electric vehicle demand required
    Mining companies are investing in battery cell products, in a
                                                                           to support national targets for electric mobility by 2030 and the
    form of “vertical integration” (from extraction to manufacturing).
                                                                           potential supply (see Section 2.3 on Responses to Address Climate
    One Australian company is following ”cyclical integration”,
                                                                           Change in the Transport Sector).
    from extraction to manufacturing to recycling of cells.66

                                                                                                                                                       6
R e s p o n s e s t o A d d r e s s C l i m a t e C h a n g e i n t h e Tr a n s p o r t S e c t o r

                                                                                                                            Tr a n s p o r t a n d C l i m a t e C h a n g e G l o b a l S t a t u s R e p o r t - 2 nd e d i t i o n

                                                                                                           Figure 5. Countries, regions and cities with commitments to phase out fossil fuel vehicles, by target year

                                                                                                                                       Countries                                                                                              Japan

                                                                                                                                                                                                                                                                   Countries phasing out sales of fossil fuel vehicles
                                                                                                                                                                                                                                                              18
                                                                                                                                                                                                                                          Costa Rica
                                                                                                                                                                                                                                         Cabo Verde
                                                                                                                                                                         Taiwan (Province of China)                                                           15
                                                                                                                                                                                          Sri Lanka
                                                                                                                                                                                              Spain
                                                                                                                                                                                           Portugal                                                           12
                                                                                                                                                                                            France
                                                                                                                                                                                            Canada
                                                                                                                                                                         United Kingdom                                                                       9
                                                                                                                                                                       Scotland
                                                                                                                                             Sweden
                                                                                                                                             Slovenia                                                                                                         6
                                                                                                                                          Netherlands
                                                                                                                                                 Israel
                                                                                                                                               Ireland                                                                                                        3
                                                                                                                                              Iceland
                                                                                                                                            Denmark
                                                                                                                              Norway                                                                                                                          0

                                                                                                                                                2025                2030                 2032                 2035                2040     2045        2050

                                                                                                                                                                                   Year of Sales Ban/Complete Ban
                                                                                                                                                                                                                                                                                       Cities and regions phasing out sales of fossil fuel

                                                                                                                                       Regions and cities
                                                                                                                                                                                                                                                              12

                                                                                                                                                                                       New York City
                                                                                                                                                                                                                                                              10
                                                                                                                                                                                    British Columbia
                                                                                                                                                                                      Seoul
                                                                                                                                                                                                                                                              8
                                                                                                                                                                                 New York
                                                                                                                                                                                                                                                                                                      vehicles

                                                                                                                                                                                 California
                                                                                                                                                                                                                                                              6
                                                                                                                                                                                   Brussels
                                                                                                                                                                           Balearic Islands
                                                                                                                                                                                                                                                              4
                                                                                                                                      San Francisco
                                                                                                                                         Jeju Island
                                                                                                                                                                                                                                                              2
                                                                                                                                      Hainan Island
                                                                                                                                        Amsterdam
                                                                                                                                                                                                                                                              0

                                                                                                                                                2025                2030                 2032                 2035                2040     2045        2050

                                                                                                                                                                                     Year of Sales Ban/Complete Ban

                                                                                                           Source: See endnote 67 for this section.

                                                                                                       7
R e s p o n s e s t o A d d r e s s C l i m a t e C h a n g e i n t h e Tr a n s p o r t S e c t o r
                                                                                                                                 Electric Mobility

    BMW announced a target to double its electric car sales starting         Rwanda announced a plan in 2019 to replace all fossil
    from 2021. 76
                                                                             fuel-powered motorcycles with electric two-wheelers in the
    GM set a goal in 2021 to sell only zero-emission vehicles                coming years.83
    after 2035.77                                                            In 2019, a local vehicle manufacturer in Vietnam committed to
    At the end of 2020, Hyundai announced that it was suspending             selling 250,000 electric motorcycles a year.84
    the development of diesel engines.78                                     The Urban Electric Mobility Initiative has produced electric
    Since 2019, Volkswagen has offered its modular electric                  vehicle-readiness assessments for cities across Africa, Asia and
    drive technology platform to other auto manufacturers,                   Latin America, including Accra, Belo Horizonte, Cape Town,
    enabling global efforts to scale up the production of electric           Kathmandu, Quito and Thimpu.85
    passenger cars.   79
                                                                         Utilities are taking on a greater role in the mobility ecosystem,
    In 2019, Volvo was the first European car company to divert
                                                                         thereby merging the value chains for electricity generation and
    from internal combustion engines, and in 2021 the company
                                                                         electric vehicle charging.86 Utilities are increasingly partnering with
    expressed its plan to produce only electric vehicles by 2030.80
                                                                         municipalities to plan battery charging and swapping networks,
Leapfrogging to electric mobility in Africa, Asia and Latin              and with automakers to design vehicles that can be integrated with
America can bring significant benefits to local environments and         electricity grids for bi-directional flow of electricity and the feed-in of
economies. Discussions and implementation strategies around              renewable energy. Electric vehicles can be seen as decentralised
electric vehicles do not fully incorporate the needs and perspectives    units in the energy system to store surplus electricity during periods
of developing countries. Progress on e-mobility in low-and middle-       of peak supply and release it during periods of peak demand.87
income countries is being advanced through initiatives such as the
                                                                             The energy service company Enel X installed 80 charge points
Urban Electric Mobility Initiative (see below), but there is more room
                                                                             in Chile in 2019 and has worked closely with Santiago and
to guide and support the mobility and energy transitions.
                                                                             Bogotá on their transitions to electric buses.88
    More than 3 million people in East Africa earn money as                  In India, three state-owned oil companies, accounting for 90%
    motorcycle taxi drivers.81 Start-ups, such as Ecobodaa in Kenya,         of the fuel retail market, have invested in electric vehicle battery
    began rolling out electric motorcycles in 2020 through a “rent-          charging and swapping infrastructure, in partnership with ride-
    to-own” model that helps taxi drivers improve their health and           hailing and metro rail companies whose parking lots will house
    save money on fuel and maintenance.82                                    battery swapping stations for three-wheelers.89
                                                                             Stockholm, Sweden, in its Charging Master Plan, aims to build
                                                                             4,000 public charge points by 2022 and has worked with the
                                                                             grid operator Ellevio, the municipal planning department and
                                                                             local businesses to map priority areas for investment.90
                                                                             Utilities benefit from putting to use surplus power, and some
                                                                             have opened vehicle manufacturing subsidiaries; for example,
                                                                             Thailand’s second largest electric utility, Energy Absolute, created
                                                                             its Mine Mobility subsidiary to manufacture electric vehicles.91
                                                                             In some cases, utilities invest in electric vehicle chargers
                                                                             and stations, while in other cases private companies act as
                                                                             intermediaries (as with ChargePoint, EVgo and Electrify America
                                                                             in the USA).92 Other companies, such as EVBox, provide both smart
                                                                             charging and related software.
                                                                             Vancouver, Canada has set a target to power its municipal
                                                                             transport fleet with 100% renewable energy by 2050.93

                                                                         To accommodate the uptake of electric vehicles, the capacity of
                                                                         the grid must be increased. Ways to smooth electricity demand
                                                                         curves and increase alignment between the transport and energy
                                                                         sectors include smart charging, providing additional power through
                                                                         renewable energy, incentives for off-peak charging and vehicle-to-
                                                                         grid systems.

                                                                             In 2020, Shanghai, China completed its first pilot project using
                                                                             electric vehicles as a flexible energy source in the power grid.94
                                                                             As electric vehicle sales in Stockholm, Sweden increased, the
                                                                             city’s power grid was unable to meet electricity demand during
                                                                             peak times in 2020 with other appliances also in heavy use.95

                                                                                                                                                       8
R e s p o n s e s t o A d d r e s s C l i m a t e C h a n g e i n t h e Tr a n s p o r t S e c t o r

                                                                                                                           Tr a n s p o r t a n d C l i m a t e C h a n g e G l o b a l S t a t u s R e p o r t - 2 nd e d i t i o n

                                                                                                           Initiatives supporting e-mobility

                                                                                                              Action towards Climate-friendly Transport (ACT) is the largest                                                    The International Zero-Emission Vehicle Alliance (ZEV
                                                                                                              global coalition aiming to catalyse transport as an enabler                                                       Alliance) is a collaboration of governments acting together
                                                                                                              of sustainable development in line with the 2030 Agenda                                                           to accelerate the adoption of zero-emission vehicles (electric,
                                                                                                               for Sustainable Development and the Paris Agreement. The                                                         plug-in hybrid and fuel cell). The governments have committed
                                                                                                              coalition connects innovative approaches with integrated, long-                                                   to making all passenger vehicle sales in their jurisdictions ZEVs
                                                                                                               term planning, speeding up deployment of electric vehicles,                                                      by no later than 2050 and to collaborating on policies and
                                                                                                              creating a mass market for zero-emission freight vehicles and                                                     actions to achieve ZEV targets.99
                                                                                                               fostering global dialogue with and among the private sector.96                                                   The Taxi4SmartCities coalition connects worldwide taxi
                                                                                                              The EV30@30 campaign, launched at the Eighth Clean Energy                                                         companies that are committed to transitioning their vehicle
                                                                                                               Ministerial in 2017, set the collective aspirational goal of a 30%                                               fleets to low-emission vehicles by 2020 and 2030. More
                                                                                                               market share for electric vehicles among all passenger cars,                                                     generally, the coalition defends a progressive and modern
                                                                                                               light commercial vehicles, buses and trucks by 2030.97                                                           version of the taxi as a key actor in the Smart City.100
                                                                                                               EV100, part of the Marrakech Partnership for Global Climate                                                      The Urban Electric Mobility Initiative (UEMI) aims to boost
                                                                                                              Action, is a transport initiative that aims to accelerate the transition                                          the share of electric vehicles in individual mobility (two- and
                                                                                                               to electric mobility by leveraging the role of corporate demand                                                  three-wheelers and light-duty vehicles) and to integrate electric
                                                                                                               in driving electric vehicles uptake and the roll-out of charging                                                 mobility into a wider concept of sustainable urban transport that
                                                                                                               infrastructure. The initiative was launched in 2017 with 10 member                                               achieves a 30% reduction in urban greenhouse gas emissions
                                                                                                              companies from various sectors in Europe and China.                             98
                                                                                                                                                                                                                                by 2030. 101

                                                                                                           Key indicators

                                                                                                                                                                                                                                       2018*             2020*             % change
                                                                                                               Policy Landscape Indicators
                                                                                                               Electric vehicle targets                                                                                                61 (2017)         63                +3%

                                                                                                               Internal combustion engine vehicle phase-out targets                                                                    7 (2017)          19                +171%

                                                                                                               Electric vehicle incentives (subsidies, enabling legislation)                                                           67 (2017)         73                +9%

                                                                                                               Market development Indicators

                                                                                                               Electric vehicle market share (% of sold vehicles by year)                                                              2.5%              4.6%              +84%

                                                                                                               Electric vehicle stock (plug-in hybrids and battery passenger cars)                                                     5,106,341        10,228,265         +100%

                                                                                                               Public charging points (public and fast chargers)                                                                       (550,602          1,307,894         +98%

                                                                                                               Public fast-charging points (charging power more than 22 kW)                                                            145,461           263,802           +165%

                                                                                                               Public slow-charging points (charging power below 22 kW)                                                                405,140           922,215           +128%

                                                                                                           (*) Data are for the indicated year unless noted otherwise.

                                                                                                           Source: See endnote 102 for this section.

                                                                                                       9
R e s p o n s e s t o A d d r e s s C l i m a t e C h a n g e i n t h e Tr a n s p o r t S e c t o r
                                                                                                                      Electric Mobility

Box 1. Impacts of the COVID-19 pandemic on electric mobility

Despite temporary shutdowns of auto factories and                       mobility and battery cell production, and innovation in
disruptions in global supply chains due to the pandemic,                the automotive industry.
more than 3 million electric cars were sold worldwide in                Italy approved programmes to deduct taxes for
2020, surpassing projections of 2.4 million. While sales                electric vehicles and charging infrastructure (110% tax
of electric vehicles increased, sales of new diesel and                 deductions) and to subsidise new electric vehicles (EUR
petrol cars fell around 14.5% below 2019 levels. Among                  6,000 (USD 7,300) per unit, up from EUR 4,000 (USD
all transport modes, electric-assisted bikes saw a spike in             4,800) previously).
popularity, as manufacturers saw record sales and e-bike                The Republic of Korea introduced a Green New Deal
sales in the USA increased 145%.                                        totalling USD 61 billion over five years, which includes
                                                                        plans to enhance the country’s fleet to 1.33 million
Electric vehicle sales jumped to 4.6% of global vehicles
                                                                        electric (including hydrogen-powered) vehicles.
sold in 2020. In the EU, the electric vehicle market share
                                                                        Spain advanced a USD 1.12 billion package for public
reached 9.9% in the third quarter of 2020, up sharply from
                                                                        transport and shared mobility, replacing government
3% during the same period in 2019. In Norway, supported
                                                                        fleets with zero-emission vehicles, R&D in sustainable
through subsidies and various incentives, the share of EVs
                                                                        mobility and its associated industry, and subsidising
sold in the first half of 2020 was higher than in 2019; fully
                                                                        the replacement of old vehicles for zero- and low-
electric vehicles accounted for 48% of all automobile sales
                                                                        emission ones.
in the country, and fully electric and plug-in hybrid vehicles
                                                                        The US has proposed USD 174 billion to build a national
represented 69% of sales – both of which were global
                                                                        network of 500,000 electric vehicle chargers by 2030,
records.
                                                                        to support manufacturing of batteries and electric
 A number of governments have increased electric vehicle                vehicles, and to retool factories to compete globally. The
 investments as part of their COVID-19 recovery packages                plan would also replace 50,000 diesel transit vehicles;
 (see also Section 4 on Financing). The long-term effects of            electrify at least 20% of the country’s school bus fleets,
 the pandemic on the electric vehicle market are hard to                and electrify the federal fleet, including postal vehicles.
 predict. The International Energy Agency has projected a
                                                                 Source: See endnote 1 for this section.
 rebound in global energy use and CO2 emissions, making
“building back better” a sensible proposition.

However, policy measures remain indispensable to address
the high initial capital costs of electric vehicles and to
attract consumers and investors. Several countries have
included electric vehicle purchase incentives and vehicle
replacement programmes in national recovery packages,
including the following:

   China promoted two programmes for electric mobility:
   one extending an existing programme that provides
   subsidies and tax breaks for 2 million new electric
   vehicles annually until 2022, and the other to implement
   600,000 EV charging points, with a USD 1.45 billion
   investment.
   The EU agreed to the Next Generation EU recovery fund
   of EUR 750 billion (USD 900 billion), which supports
   transport decarbonisation through investments in
   cleaner, healthier and more affordable active and public
   transport.
   France created several programmes to encourage
   purchases of electric and plug-in hybrid vehicles,
   support research and development (R&D) in the
   automotive industry, provide relief during the pandemic
   and advance charging infrastructure, totalling USD 8.7
   billion.
   Germany approved a EUR 50 billion (USD 60 million)
   investment package to support electric vehicle
   purchases, charging infrastructure, R&D for electric

                                                                                                                                          10
R e s p o n s e s t o A d d r e s s C l i m a t e C h a n g e i n t h e Tr a n s p o r t S e c t o r

                                                                                                                      Tr a n s p o r t a n d C l i m a t e C h a n g e G l o b a l S t a t u s R e p o r t - 2 nd e d i t i o n

                                                                                                            In Practice: Additional Policy Measures

                                                                                                                                                                                                                                  nationwide by 2040.117 In 2019, the city of Santiago
                                                                                                                Policy targets set
                                                                                                                                                                                                                                  deployed 200 e-buses as part of a plan to cut emissions and
                                                                                                                Phase-out targets
                                                                                                                                                                                                                                  reduce air pollution.118
                                                                                                                Amsterdam aims to ban petrol and diesel vehicles
                                                                                                                                                                                                                                  Costa Rica, as part of its economy-wide roadmap to
                                                                                                                completely by 2030, while at a country level the Netherlands
                                                                                                                                                                                                                                  achieve net zero emissions by 2050, committed to public
                                                                                                                plans to ban sales of new petrol and diesel cars from 2030.103
                                                                                                                                                                                                                                  procurement of electric buses and taxis and the provision of
                                                                                                                Pakistan’s National Electric Vehicle Policy aims to have 90%
                                                                                                                                                                                                                                  funds to create an electric train line.119
                                                                                                                of sales of passenger cars and heavy-duty trucks be electric
                                                                                                                                                                                                                                  In 2019, the president of Colombia signed a law targeting
                                                                                                                by 2040, as well as 90% of sales of electric two- and three-
                                                                                                                                                                                                                                  the complete electrification of mass transport by 2040.120
                                                                                                                wheelers and buses.104
                                                                                                                                                                                                                                  Ecuador has committed to converting its entire bus fleet
                                                                                                                The Balearic Islands (Mallorca, Menorca, Ibiza and
                                                                                                                                                                                                                                  to electric by 2025 as part of its ordinance for the gradual
                                                                                                                Formentera) of Spain announced a target for 100%
                                                                                                                                                                                                                                  decarbonisation of transport.121 At the end of 2019, the first
                                                                                                                renewable energy use by 2050 and a phase-out of sales of
                                                                                                                                                                                                                                  20 electric buses and 50 taxis arrived in Guayaquil.122
                                                                                                                internal combustion vehicles by 2035.105
                                                                                                                                                                                                                                  In the EU, the revised Clean Vehicles Directive of 2019 aims
                                                                                                                In 2019, Sweden announced a sales ban on diesel and
                                                                                                                                                                                                                                  to accelerate the procurement of zero-emission vehicles and
                                                                                                                petrol cars by 2030.106
                                                                                                                                                                                                                                  sets a target for the majority of procured public buses to be
                                                                                                                Ukraine envisions that 75% of all motorised trips by 2030 will
                                                                                                                                                                                                                                  electric from 2026.123
                                                                                                                be via electric mobility.107
                                                                                                                                                                                                                                  Amsterdam, the Netherlands aims to convert its municipal
                                                                                                                In early 2020, the UK advanced its target for phasing out
                                                                                                                                                                                                                                  bus fleet to electric by 2025, and Milan, Italy has a similar
                                                                                                                internal combustion vehicles from 2040 to 2035.108
                                                                                                                                                                                                                                  target for 2030.124
                                                                                                                San Francisco, California, USA aims to ban sales of internal
                                                                                                                                                                                                                                  India plans to deploy 5,595 electric buses in 63 cities under
                                                                                                                combustion vehicles by 2030, in an effort to achieve an
                                                                                                                                                                                                                                  its FAME II subsidy scheme launched in 2019.125
                                                                                                                emission-free transport system by 2040.109
                                                                                                                                                                                                                                  In the USA, New York City plans to convert its bus fleet to
                                                                                                                Canada announced deployment targets as well as various
                                                                                                                                                                                                                                  electric by 2040, and San Diego and San Jose also plan to
                                                                                                                financial incentives for zero-emission vehicles such as
                                                                                                                                                                                                                                  convert their fleets by 2040 to comply with a California state-
                                                                                                                electric vehicles.110
                                                                                                                                                                                                                                  wide mandate.126
                                                                                                                Electric fleets (private and shared)
                                                                                                                                                                                                                                  EV charging infrastructure
                                                                                                                Nepal expressed in its second NDC that by 2030 the sales
                                                                                                                                                                                                                                  In Germany, the 2030 climate plan targets 1 million charging
                                                                                                                of electric vehicles should represent 90% of all passenger
                                                                                                                                                                                                                                  points by 2030, for which a masterplan is under way.127
                                                                                                                vehicle (cars and two-wheelers) sales and 60% of all four-
                                                                                                                                                                                                                                  Since 2020, in the EU, new residential units or major renovations
                                                                                                                wheeler public passenger vehicle sales.111
                                                                                                                                                                                                                                  with more than 10 parking spaces are required to be 100%
                                                                                                                In the first electric taxi deployment in Panama, the province
                                                                                                                                                                                                                                  electric vehicle-ready, while 20% of space in new non-residential
                                                                                                                of Colon plans to create a fleet of 1,500 electric taxis; as of
                                                                                                                                                                                                                                  units must be electric vehicle-ready by 2025.128
                                                                                                                2019, 7 of the vehicles were already deployed through a
                                                                                                                                                                                                                                  In India, the FAME II scheme as well as state policies have
                                                                                                                partnership between BYD, Ensa Servicos and Traservi, which
                                                                                                                                                                                                                                  laid out subsidies to support 2,636 new charging stations
                                                                                                                also installed a rapid charging station for the fleet.112
                                                                                                                                                                                                                                  in 62 cities.129 The governments of Delhi and Kerala have
                                                                                                                In 2020, Turkey released a vision target to have 1 million
                                                                                                                                                                                                                                  enacted policies to support battery charging and swapping
                                                                                                                electric cars and 1 million charging points by 2030.113
                                                                                                                                                                                                                                  systems, and state-owned thermal power companies have
                                                                                                                Companies such as Amazon, DHL, FedEx, IKEA and UPS
                                                                                                                                                                                                                                  partnered with metro rail companies to provide charging
                                                                                                                have established targets and pilot programmes to fully
                                                                                                                                                                                                                                  points and fuel retail in parking lots.130
                                                                                                                convert their fleets to electric.114
                                                                                                                                                                                                                                  In 2020, the UK government announced the allocation of
                                                                                                                By the end of 2020, at least 74 jurisdictions worldwide had
                                                                                                                                                                                                                                  GBP 500 million (USD 700 million) over the next five years for
                                                                                                                some form of financial support in place for electric vehicles.115
                                                                                                                                                                                                                                  electric vehicle charging infrastructure on national roads.131
                                                                                                                Electric buses                                                                                                    Canada announced nearly CAD 100 million (USD 76.5
                                                                                                                                                                                                                                  million) in funding in 2019 to deploy new electric vehicle
                                                                                                                São Paulo, Brazil introduced its first 15 electric buses at the
                                                                                                                                                                                                                                  charging (and hydrogen fuelling) stations.132
                                                                                                                end of 2019 and aims to increase the fleet to 400 buses in
                                                                                                                                                                                                                                  In 2019, the Netherlands committed to installing 2,000
                                                                                                                the coming years, to support the city’s vision of halving CO2
                                                                                                                                                                                                                                  charging points to support electrification of its national
                                                                                                                emissions by 2027 and becoming carbon-free by 2037.116
                                                                                                                                                                                                                                  government fleet.133
                                                                                                                Chile aims to have a fully electric public transport system

                                                                                                       11
R e s p o n s e s t o A d d r e s s C l i m a t e C h a n g e i n t h e Tr a n s p o r t S e c t o r
                                                                                                                   Electric Mobility

                                                                    Electric buses
Policy measures implemented
Electric fleets (private and shared)                                As of 2020, Brazil had 247 electric buses (including electric
                                                                    trolley buses and 12-15 metro buses), and Mexico had 238
China enacted stricter standards for automakers to gain
                                                                    (electric trolley buses).140
credits for zero-emission vehicles for 2021-2023 so that they
                                                                    In 2019, the government of Chile helped launch an electric
would build vehicles that use even less fuel.134
                                                                    bus corridor with 411 buses through a partnership in which
Local governments in Shanghai, China are providing subsidies
                                                                    electric utility Enel X procures the buses and leases them to
to car-sharing companies to purchase electric vehicles and to
                                                                    local operator MetBus, and provides charging services.141
build and buy charging infrastructure; so far, 39 cities in China
                                                                    The corridor is further supported through policy measures
have followed this policy implementation model, resulting in
                                                                    related to air quality improvements, fuel efficiency labelling
the addition of 50,000 electric vehicles in total.135
                                                                    and green taxation.142
Shenzhen, China adopted a regulation in 2019 that requires
                                                                    Shenzhen, China diligently planned a charging network
all newly registered ride-hailing vehicles in the city to be
                                                                    to support its growing electric bus fleet, allocating real
battery electric.136
                                                                    estate, finances, charging technology and required
In 2019, India implemented the Faster Adoption and
                                                                    electricity connections.143
Manufacturing of Electric Vehicles in India Phase II (FAME
                                                                    In Colombia in 2019, the city of Cali procured 26 electric
Phase II) scheme, which includes a USD 1.4 billion budget
                                                                    buses with support from the energy company Celsia, and
over three years to reduce the purchase price of hybrids and
                                                                    Medellín installed 64 electric buses following a successful
electric vehicles through rebates.137
                                                                    single-bus pilot.144 Bogotá was set to procure 483 electric
In Norway, local governments have instituted the majority of
                                                                    buses to begin operations in September 2020, but this was
electric vehicle incentives and policy support tools, such as
                                                                    postponed due to the COVID-19 pandemic.145
planning zero-emission zones where the vehicles have priority
access, providing incentives for purchasing vehicles and            Electric two- and three-wheelers
setting up charging infrastructure, developing building codes
                                                                    In India, state and central government policies have prioritised
amenable to electric vehicle charging points and offering 50%
                                                                    electric two wheelers, with the FAME subsidy scheme
reductions in parking charges. Norway also has exempted
                                                                    applicable to 86 different models of electric two-wheelers.146
electric vehicles from weight, CO2 and nitrogen oxide emissions
                                                                    Portugal introduced an electric bicycle subsidy scheme in
taxes and value-added tax to the end of 2021.138
                                                                    2019 supporting the purchase of 1,000 e-bikes.147
In December 2019, the California Air Resources Board in the
US amended its Clean Vehicle Rebate Project to increase             Other
rebates for low- to moderate-income communities while
                                                                    Thailand began operating its first electric battery-powered
reducing rebates for electric vehicles above USD 60,000 and
                                                                    commuter boats in Bangkok’s canals in 2018; by 2020, the
plug-in hybrids below 35-mile range.139
                                                                    pilot proved so successful that the city planned to further
                                                                    expand the service.148

                                                                                                                                       12
Methodological Note

                                         Tr a n s p o r t a n d C l i m a t e C h a n g e G l o b a l S t a t u s R e p o r t - 2 nd e d i t i o n

                           Annex: Methodological Note

                           Data usage

                           Time period for data:                                                               Secondary data:
                           The report strives to utilise the most recent                                       SLOCAT relies on secondary data and
                           publicly available data and information                                             information collected and provided
                           just prior to the time of publication (as of                                        by SLOCAT partners and other entities
                           31 May 2021). The figures in the report                                             and does not make use of any internal
                           were developed between September and                                                modelling tools.
                           December 2020 using the most recent
                           data available.

                            Data on sustainable mobility: A call to action                                                             EDGAR provides estimates for fossil CO2 emissions from all
                            The report benefits directly from data collected by a wide range                                           anthropogenic activities with the exception of land use, land-use
                             of stakeholders working in different areas of transport.                                                  change, forestry and the large-scale burning of biomass. The
                                                                                                                                       main activities covered are CO2 emissions emitted by the power
                            Data are important for providing a comprehensive picture of the
                                                                                                                                       sector (i.e., power and heat genertion plants), by other industrial
                             status of sustainable, low carbon transport and are essential for
                                                                                                                                       combustion (i.e., combustion for industrial manufacturing and fuel
                             both policy and investment decision making. In these times of
                                                                                                                                       production) and by buildings and other activities such as industrial
                             change, it is critical to upgrade data and policy collection and
                                                                                                                                       process emissions, agricultural soils and waste. Transport activities
                             interpretation capacities to better understand progress and the
                                                                                                                                       covered within EDGAR include road transport, non-road transport,
                             hurdles that must be addressed.
                                                                                                                                       domestic aviation, and inland waterways on a country level, as well
                            The data limitations mentioned below are not new. Obtaining                                                as international aviation and shipping.1
                             regular, reliable and public data across regions and transport
                                                                                                                                       For the world, regions and countries, the CO2 emission data
                             modes remains an outstanding issue. When an increasing
                                                                                                                                       (provided by EDGAR) span through 2019. In a few places in the
                             number of stakeholders are collecting data and policy information,
                                                                                                                                       report, CO2 data for 2020 are shown to illustrate the impact of the
                             more and better open-access data and capacity building efforts
                                                                                                                                       COVID-19 pandemic; however, these data are based on a different
                             for data interpretation are supported by many multi-stakeholder
                                                                                                                                       methodology than the EDGAR dataset and should not be compared
                             partnerships in the sustainable, low carbon movement.
                                                                                                                                       directly with the data from previous years.
                            If you share our passion for open-access data and knowledge
                                                                                                                                      The latest CO2 emission data for individual transport modes are for
                            towards greater impact on policy and investment decision
                                                                                                                                       2018 and have been compiled only at the global level. For passenger
                             making worldwide and/or would like to contribute data or
                                                                                                                                       and freight transport, the data on global CO2 emissions are for 2017,
                             knowledge to our collective efforts on this report, please reach
                                                                                                                                       as this is the latest year with robust data. Data on passenger activity
                             out to the research team in the SLOCAT Secretariat at tcc-
                                                                                                                                       (passenger-kilometres) and freight activity (tonne-kilometres) –
                             gsr@slocatpartnership.org.
                                                                                                                                       provided mainly in the country fact sheets – are based on the latest
                                                                                                                                       available year, as indicated in the report analysis.

                           Specific data used in this report                                                                           Information on greenhouse gas emissions – provided in CO2 equivalent
                           Data on emissions                                                                                           (CO2eq) – include not only CO2 but also methane, nitrous oxide, and
                                                                                                                                       industrial gases such as hydrofluorocarbons, perfluorocarbons, sulphur
                           The data in this edition of the report point to the direct carbon
                                                                                                                                       hexafluoride and nitrogen trifluoride.2 These data are less up-to-date. As
                           emissions from transport activity; they do not cover the indirect
                                                                                                                                       of 31 May 2021, data on greenhouse gas emissions were not readily
                           emissions and land-use impacts associated with certain modes of
                                                                                                                                       available for the period 2019-2020. In some cases, additional data
                           transport. The report primarily utilises CO2 emission data compiled in
                                                                                                                                       sources were used to provide detailed information about other climate
                           the Emissions Database for Global Atmospheric Research (EDGAR)
                                                                                                                                       pollutants besides CO2.
                           from the Joint Research Centre of the European Commission, as this
                           represents the most recent, comprehensive dataset on transport                                              All data on CO2 and other greenhouse gas emissions, as well as
                           CO2 emissions. However, this global dataset does not convey in full                                         CO2eq, are provided in metric tonnes.
                           detail the unique situations of individual countries.

                      13
Methodological Note
                                                                                                                                                Annex

Data on car ownership                                                       Criteria for selection
Information on car ownership rates is based on a global dataset             The report covers policies, targets, emission reductions (achieved or
from the International Organization of Motor Vehicle Manufacturers          envisioned) and market measures. To merit inclusion in the analysis,
(OICA), with the latest release (as of 31 May 2021) dating from             the policies, projects and trends must have been announced or
2015.3 Although newer information is available for some individual          completed between 2018 and 2020. Significant developments from
countries, using these data would hinder accurate global                    January through May 2021 were included when deemed relevant, with
comparisons. Data on passenger and commercial vehicle sales                 the understanding that the next edition of the Transport and Climate
were available only up to 2019.                                             Change Global Status Report will cover a period starting in 2021.

Policy landscape data                                                       Pre- and post-COVID-19 pandemic trends
The policy-related information presented in this report is not intended     The year 2020 was pivotal for the world, and the COVID-19
to be comprehensive. The data for the policy landscape indicators           pandemic has had substantial impacts on many of the transport
provided in Section 3 were gathered through desk research unless            trends monitored in this report. This edition attempts to differentiate
otherwise indicated. Barriers to accessing such information include         between long-term trends and impacts due to the pandemic. To the
language and limited availability of information through online             extent possible, the analysis notes “pre-pandemic” (up to the end
media (e.g., websites, press releases and news articles).                   of 2019 or latest by February 2020) and “during pandemic” trends
                                                                            (starting in March 2020 until the end of 2020), as in some cases the
Data in country fact sheets
                                                                            pandemic led to reversals in long-term trends, at least for a specific
Information in the fact sheets is based on desk research and
                                                                            period of time. In each section, a box describes the impacts that the
on contributions from the national focal points. The data were
                                                                            pandemic has had on specific regions and sub-sectors.
collected to the best of the authors’ knowledge and based on data
availability, and thus may not be complete or show the most recent
status. When no information was available for a given indicator, the        Assembling the report
term “Not available” is used.                                               Global Strategy Team
                                                                            This edition of the report was guided by a global strategy team
Data gaps
                                                                            consisting of 20 experts in the field who provided inputs over the
Major data gaps exist in areas where there is no globally accepted
                                                                            span of six meetings between September 2019 and October 2020.
data collection methodology. For example, the mapping of cycling
                                                                            Additionally, small group consultations were organised in February
and walking infrastructure is not currently done in all regions.
                                                                            2021, following the peer review process.
Also, the modal share can be surveyed through different methods,
leading to inconsistencies in available data. In addition, data on          Authors and contributors
paratransit (informal transport), a predominant form of transport           The report was collaboratively drafted by 22 authors and contributors
in many parts of the world, are largely lacking. This results in an         from 16 organisations, led by the SLOCAT Secretariat. This includes
incomplete picture of the impact of transport on climate change and         additions and high-level inputs from the copy editor and from the
sustainable development.                                                    special advisor who also co-authored the Executive Summary.
                                                                            Authors researched and compiled relevant facts and figures for
                                                                            the five sections of the report, including the Focus Features, with
Methodological approach
                                                                            supporting review and inputs from several other organisations.
Countries and regions
The report follows the M49 Standard of the United Nations Statistics        Peer review: A peer review process was carried out from 18
Division.4 In total, 196 countries have official United Nations             December 2020 to 20 January 2021 with 1,700 comments received
membership and are also party to the United Nations Framework               from 74 reviewers. Each comment was individually reviewed by the
Convention on Climate Change. The available data have been put in           SLOCAT Secretariat and considered in finalising the report.
a common structure for the United Nations member countries, regions
                                                                            National focal points: The report benefited from the contributions
and income groups to enable a consistent assessment. Income groups
                                                                            of voluntary national focal points, or experts from various regions
are based on the World Bank’s classification of 2019.5
                                                                            and countries who have been essential to overcome language
Economic calculations                                                       and information barriers. A public call for participation to provide
The per capita and gross domestic product (GDP) calculations are            information on policies and data resulted in several hundred initial
based on the United Nations World Population Prospects 2019 and             registrations. Out of these registrations, 78 national focal points
on World Bank GDP data using constant 2010 USD.6                            provided inputs through a first survey from 24 January to 3 February
                                                                            2020; and through a second survey (focused on the country fact
Spatial and temporal scales
                                                                            sheets) from 6 to 30 August 2020. All national focal points that
The geographic scale (global, national, city-level, etc.) as well as time
                                                                            contributed to the surveys are listed in the Acknowledgements.
scale (annual, monthly, daily) used in this report depends largely on
the available dataset, as noted in the relevant figures and text. The
detailed data forming the basis of the calculations and analysis are
provided in the SLOCAT Transport Knowledge Base.7

                                                                                                                                                        14
Endnotes

                                   Tr a n s p o r t a n d C l i m a t e C h a n g e G l o b a l S t a t u s R e p o r t - 2 nd e d i t i o n

                Endnotes
                                                                                                                                 23     Ibid.
                3.8 Electric Mobility
                                                                                                                                 24     C. Kanuri, R. Roa and P. Mulukutla (2020), A Review of State Government Policies
                                                                                                                                        for Electric Mobility, World Resources Institute India, Bengaluru, https://wri-india.
                1    Box from the following sources: 3 million from International Energy Agency (IEA)                                   org/sites/default/files/Full-report_EV_State_Policy.pdf.
                     (2021), Global EV Outlook 2021, Paris, https://www.iea.org/reports/global-ev-out-                           25     Government of Nepal (2020), Second Nationally Determined Contribution (NDC),
                     look-2021; diesel and petrol sales from International Organization of Motor Vehicle                                Kathmandu, https://www4.unfccc.int/sites/ndcstaging/PublishedDocuments/
                     Manufacturers (OICA), “Sales statistics” https://www.oica.net/category/sales-sta-                                  Nepal%20Second/Second%20Nationally%20Determined%20Contribution%20
                     tistics (accessed 2 June 2021); e-bikes from A. J. Hawkins (2020), “How to keep                                    (NDC)%20-%202020.pdf.
                     the bike boom from fizzling out”, The Verge, 18 December, https://www.theverge.
                                                                                                                                 26     G. P. Felongco (2018), “900 ‘e-trikes’ deployed in Manila”, Gulf News, 2 June,
                     com/22178543/bike-bicycle-boom-covid-pandemic-2020-sales-cities-infrast-
                                                                                                                                        https://gulfnews.com/world/asia/philippines/900-e-trikes-deployed-in-ma-
                     ructure; EU market share from Acea (2020), “Fuel types of new cars: petrol 47.5%,
                                                                                                                                        nila-1.2230670; M. Balbin (2019), “100 e-trike units seen to boost Malolos City’s
                     hybrids 12.4%, electric 9.9% market share third quarter 2020”, 5 November, https://
                                                                                                                                        tourism”, Philippine News Agency, 3 June, https://www.pna.gov.ph/arti-
                     www.acea.be/press-releases/article/fuel-types-of-new-cars-petrol-47.5-hybrids-
                                                                                                                                        cles/1071350.
                     12.4-electric-9.9-market-share-t; Norway from Z. Shahan (2020), “69% of autos
                     sold In Norway in 2020 have a plug”, CleanTechnica, 9 July, https://cleantechnica.                          27     Cycling Industries Europe (2020), “New European Cycling Industry forecast shows
                     com/2020/07/09/69-of-autos-sold-in-norway-in-2020-have-a-plug; China, France                                       huge growth in bike and e-bike sales”, 2 December, https://cyclingindustries.com/
                     and Spain from S. Evans and J. Gabbatiss (2020), “Coronavirus: Tracking how the                                    news/details/new-european-cycling-industry-forecast-shows-huge-growth-in-bike-
                     world’s ‘green recovery’ plans aim to cut emissions”, CarbonBrief, 16 June, https://                               and-e-bike-sales; IEA (2021), “Global EV Data Explorer”, 29 April, https://www.iea.
                     www.carbonbrief.org/coronavirus-tracking-how-the-worlds-green-recovery-                                            org/articles/global-ev-data-explorer.
                     plans-aim-to-cut-emissions; Europe from European Commission (EC), “Recovery                                 28     Cycling Industries Europe, op. cit. note 27.
                     plan for Europe”, https://ec.europa.eu/info/strategy/recovery-plan-europe_en
                                                                                                                                 29     Urban Electric Mobility Initiative (UEMI), “UEMI partner cities in Latin America”,
                     (accessed 17 May 2021), and from Organisation for Economic Co-operation and
                                                                                                                                        http://www.uemi.net/latin-america.html (accessed 2 June 2021).
                     Development (OECD) (2020), Making the Green Recovery Work for Jobs, Income
                     and Growth, Paris, https://read.oecd-ilibrary.org/view/?ref=136_136201-ctwt-                                30     E. Glusac (2021), “Farther, faster and no sweat: Bike-sharing and the e-bike boom”,
                     8p7qs5&title=Making-the-Green-Recovery-Work-for-Jobs-Income-and-Growth;                                            New York Times, 2 March, https://web.archive.org/web/20210304004603/https://
                     German Federal Ministry of Finance (2020), “Public finances”, 4 June, https://                                     www.nytimes.com/2021/03/02/travel/ebikes-bike-sharing-us.html.
                     www.bundesfinanzministerium.de/Content/EN/Standardartikel/Topics/Public-Fi-                                 31     Ibid.
                     nances/Articles/2020-06-04-fiscal-package.html; V. Clements (2020), “How to get
                     an EV subsidy in Italy”, Wallbox, https://blog.wallbox.com/en/italy-ev-incentives                           32     V. Henze (2020), “Battery pack prices cited below $100/kWh for the first time in
                     (accessed 25 May 2021); Republic of Korea from OECD, op. cit. this note; The                                       2020, while market average sits at $137/kWh”, BloombergNEF, 16 December,
                     White House (2021), Fact Sheet: The American Jobs Plan, Washington, D.C.,                                          https://about.bnef.com/blog/battery-pack-prices-cited-below-100-kwh-for-the-
                     https://www.whitehouse.gov/briefing-room/statements-releases/2021/03/31/fact-                                      first-time-in-2020-while-market-average-sits-at-137-kwh; Z. Shahan (2020), “The
                     sheet-the-american-jobs-plan.                                                                                      electric car cost tipping point”, CleanTechnica, 21 March, https://cleantechnica.
                                                                                                                                        com/2020/03/21/the-electric-car-price-tipping-point. Figure 4 from Henze, op. cit.
                2    L. Sheldon (2021), “Electric bike sales in the U.S. grew 145% from 2019 to 2020”,                                  this note.
                     Cycling Industry News, 17 March, https://cyclingindustry.news/e-bike-sales-3-7m-
                     17m-2030-industry-experts.                                                                                  33     Henze, op. cit. note 32.

                3    Figure 1 from IEA (2020), Global EV Outlook 2020, Paris, https://www.iea.org/                               34     Ibid.
                     reports/global-ev-outlook-2020.                                                                             35     Ibid.
                4    IEA, op. cit. note 1.                                                                                       36     S. O’Kane (20201), “Gogoro is bringing its electric scooter and battery tech to
                5    Bloomberg News (2021), “In China’s biggest cities, one in five cars sold is now                                    India”, The Verge, 21 April, https://www.theverge.com/2021/4/21/22394575/
                     electric”, 9 May, https://www.bloomberg.com/news/articles/2021-05-10/in-china-                                     gogoro-india-hero-motorcorp-electric-scooters-battery-swap-stations.
                     s-biggest-cities-one-in-five-cars-sold-is-now-electric.                                                     37     R. Palmer et al. (2021), Progress and Insights Report, EV100, https://www.thecli-
                6    European Alternative Fuels Conservatory (2020), “AF Market Share New Registra-                                     mategroup.org/ev100-annual-report-2021.
                     tion M1”, EC, https://www.eafo.eu/vehicles-and-fleet/m1#; Shahan, op. cit. note 1.                          38     IEA, op. cit. note 1.
                7    Figure 2 from Statens Vegvesen, “Shortcuts”, https://www.vegvesen.no/en/home                                39     Ibid.
                     (accessed 2 June 2021).                                                                                     40     Green Car Congress (2020), “Amazon to deploy 10,000 electric delivery
                8    IEA (2020), Global EV Outlook 2020, Paris, https://www.iea.org/reports/glob-                                       rickshaws in India by 2025”, 26 January, https://www.greencarcongress.
                     al-ev-outlook-2020.                                                                                                com/2020/01/20200126-amazon.html.
                9    Figure 3 from UITP (2019), Global Bus Survey, https://cms.uitp.org/wp/wp-content/                           41     S. Edelstein (2020), “Amazon shows Rivian electric delivery vans it will use
                     uploads/2020/07/Statistics-Brief_Global-bus-survey-003.pdf.                                                        starting 2021”, Green Car Reports, 9 October, https://www.greencarreports.com/
                10   IEA (2020), Electric Vehicles, Paris, https://www.iea.org/reports/electric-vehicles;                               news/1129894_amazon-shows-rivian-electric-delivery-vans-it-will-use-starting-
                     IEA, op. cit. note 1.                                                                                              in-2021.

                11   IEA, op. cit. note 1.                                                                                       42     India Block (2018), “IKEA makes deliveries with electric rickshaws from first Indian
                                                                                                                                        store”, Dezeen, 10 August, https://www.dezeen.com/2018/08/10/ikea-india-store-
                12   International Association of Public Transport (UITP) (2019), The Impact of                                         electric-rickshaws-design.
                     Electric Buses on Urban Life, Brussels, https://cms.uitp.org/wp/wp-content/up-
                     loads/2020/06/UITP-policybrief-June2019-V6-WEB-OK.pdf.                                                      43     E. Anzilotti (2019), “In Shanghai, every Ikea delivery is now made with an electric
                                                                                                                                        vehicle”, 28 January, https://www.fastcompany.com/90297201/in-shanghai-ev-
                13   Sustainable Bus (2020), “Record year 2019. The big leap forward of e-bus market                                    ery-ikea-delivery-is-now-made-with-an-electric-vehicle.
                     in Western Europe”, 10 February, https://www.sustainable-bus.com/news/record-
                     year-2019-the-big-leap-forward-of-e-bus-market-in-western-europe.                                           44     M. Whybrow (2020), “Ikea assembles a sustainable transport future”, Smarter
                                                                                                                                        Communities, 12 February, https://smartercommunities.media/ikeas-push-to-sus-
                14   Semana (2021), “Bogotá, la cuidad con mayor número de buses eléctricos en                                          tainable-transport.
                     Latinoamérica”, 1 November, https://www.semana.com/nacion/articulo/bogo-
                     ta-la-ciudad-con-mayor-numero-de-buses-electricos-en-latinoamerica/202119.                                  45     C. Watkiss (2019), “Royal Mail trials e-trikes to deliver letters and parcels in a more
                                                                                                                                        environmentally-friendly way”, Climate Action, 22 March, http://www.climateac-
                15   E-Bus Radar (2021), “Latin America”, https://www.ebusradar.org/en/home-en                                          tion.org/news/royal-mail-trials-e-trikes-to-deliver-letters-and-parcels-in-a-more-en-
                     (accessed 2 June 2021).                                                                                            viron.
                16   E. Rosen (2020), “Making yellow school buses a little more green”, New York                                 46     V. Tomlinson (2020), “UPS invests in Arrival and orders 10,000 generation 2
                     Times, 22 January, https://www.nytimes.com/2020/01/22/business/energy-envi-                                        electric vehicles”, Arrival, 24 April, https://arrival.com/news/ups-invests-in-arrival-
                     ronment/electric-school-buses.html.                                                                                and-orders-10000-generation-2-electric-vehicles.
                17   Infrastructure Canada (2021), “Government of Canada investing to electrify                                  47     Stakeholders include hardware manufacturers, software designers, and service
                     transit systems across the country”, Cision, 21 March, https://www.newswire.                                       providers and operators, as well as new participants such as electric utilities, gov-
                     ca/news-releases/government-of-canada-investing-to-electrify-transit-sys-                                          ernment-owned or private network operators, oil and gas companies, electrical
                     tems-across-the-country-895599052.html.                                                                            equipment manufacturers, digital payment companies, web app developers,
                18   Sustainable Bus (2020), “Kiira Motors and the electric bus ‘made in Uganda’”, 28                                   municipal government bodies, parking authorities and business owners who have
                     May, https://www.sustainable-bus.com/news/kiira-motors-corporations-kayoo-                                         premises to set up charging points.
                     la-electric-bus-made-in-uganda.                                                                             48     International Council on Clean Transportation (ICCT) (2020), Charging Infrastruc-
                19   IEA, op. cit. note 1.                                                                                              ture in Cities: Metrics for Evaluating Future Need, Washington, D.C., https://theicct.
                                                                                                                                        org/sites/default/files/publications/EV-charging-metrics-aug2020.pdf.
                20   IEA, op. cit. note 10.
                                                                                                                                 49     Xinhua (2020), “China to optimize policy support for NEV charging infrastructure”,
                21   IEA, op. cit. note 3; K. Moskvitch (2019), “The problem with China’s electric scooter
                                                                                                                                        9 April, http://www.xinhuanet.com/english/2020-04/09/c_138961704.htm.
                     revolution? It’s too quiet”, Wired, 29 March, https://www.wired.co.uk/article/
                     why-electric-motor-scooters-are-leading-electric-vehicle-revolution-in-asia.                                50     Ibid.
                22   Moskvitch, op. cit. note 21.                                                                                51     Acea (2019), “Interactive map – correlation between electric car sales and avail-
                                                                                                                                        ability of charging points (update)”, 12 July, https://www.acea.be/statistics/article/

           15
You can also read