Surface and subsurface Labrador Shelf water mass conditions during the last 6000 years - CP
←
→
Page content transcription
If your browser does not render page correctly, please read the page content below
Clim. Past, 16, 1127–1143, 2020
https://doi.org/10.5194/cp-16-1127-2020
© Author(s) 2020. This work is distributed under
the Creative Commons Attribution 4.0 License.

Surface and subsurface Labrador Shelf water mass conditions
during the last 6000 years
Annalena A. Lochte1,2 , Ralph Schneider1 , Markus Kienast3 , Janne Repschläger4 , Thomas Blanz1 ,
Dieter Garbe-Schönberg1 , and Nils Andersen5
1 Institute
          of Geoscience, Kiel University, Ludewig-Meyn Str. 10, 24118 Kiel, Germany
2 HOSST   Graduate School, GEOMAR Helmholtz-Centre for Ocean Research Kiel, Wischofstraße 1–3, 24148 Kiel, Germany
3 Department of Oceanography, Dalhousie University, 1355 Oxford Street, Halifax, Canada
4 Department of Climate Geochemistry, Max Planck Institute for Chemistry, Hahn Meitner Weg 1, 55128 Mainz, Germany
5 Leibniz Laboratory for Radiometric Dating and Stable Isotope Research, Kiel University,

Max-Eyth-Str. 11–13, 24118 Kiel, Germany

Correspondence: Annalena A. Lochte (annalena.lochte@ifg.uni-kiel.de)

Received: 8 August 2019 – Discussion started: 29 August 2019
Revised: 19 February 2020 – Accepted: 24 March 2020 – Published: 3 July 2020

Abstract. The Labrador Sea is important for the modern          by warmer conditions between 5.6 and 2.1 ka, possibly asso-
global thermohaline circulation system through the forma-       ciated with the late Holocene thermal maximum. While sur-
tion of intermediate Labrador Sea Water (LSW) that has been     face waters on the Labrador Shelf cooled gradually after 3 ka
hypothesized to stabilize the modern mode of North Atlantic     in response to the neoglaciation, Labrador Shelf subsurface
deep-water circulation. The rate of LSW formation is con-       or bottom waters show a shift to warmer temperatures after
trolled by the amount of winter heat loss to the atmosphere,    2.1 ka. Although such an inverse stratification by cooling of
the expanse of freshwater in the convection region and the      surface and warming of subsurface waters on the Labrador
inflow of saline waters from the Atlantic. The Labrador Sea,    Shelf would suggest a diminished convection during the last
today, receives freshwater through the East and West Green-     2 millennia compared to the mid-Holocene, it remains dif-
land currents (EGC, WGC) and the Labrador Current (LC).         ficult to assess whether hydrographic conditions in the LC
Several studies have suggested the WGC to be the main sup-      have had a significant impact on Labrador Sea deep-water
plier of freshwater to the Labrador Sea, but the role of the    formation.
southward flowing LC in Labrador Sea convection is still
debated. At the same time, many paleoceanographic recon-
structions from the Labrador Shelf focussed on late deglacial   1   Introduction
to early Holocene meltwater run-off from the Laurentide Ice
Sheet (LIS), whereas little information exists about LC vari-   Since the early Holocene, the Labrador Sea has been an im-
ability since the final melting of the LIS about 7000 years     portant region of the global thermohaline circulation system
ago. In order to enable better assessment of the role of the    through the formation of intermediate Labrador Sea Water
LC in deep-water formation and its importance for Holocene      (LSW) in the central basin (Clarke and Gascard, 1983; My-
climate variability in Atlantic Canada, this study presents     ers, 2005; Rhein et al., 2011; Yashayaev, 2007), which forms
high-resolution middle to late Holocene records of sea sur-     the upper part of North Atlantic Deep Water (NADW) and
face and bottom water temperatures, freshening, and sea ice     thereby contributes to the strength of the Atlantic Merid-
cover on the Labrador Shelf during the last 6000 years. Our     ional Overturning Circulation (AMOC). Modern-type winter
records reveal that the LC underwent three major oceano-        convection in the Labrador Sea (e.g. Hillaire-Marcel et al.,
graphic phases from the mid- to late Holocene. From 6.2 to      2001; Hoogakker et al., 2015) was likely established through
5.6 ka, the LC experienced a cold episode that was followed     a combination of diminished meltwater run-off following the
                                                                final deglaciation of the Laurentide Ice Sheet (LIS) at about

Published by Copernicus Publications on behalf of the European Geosciences Union.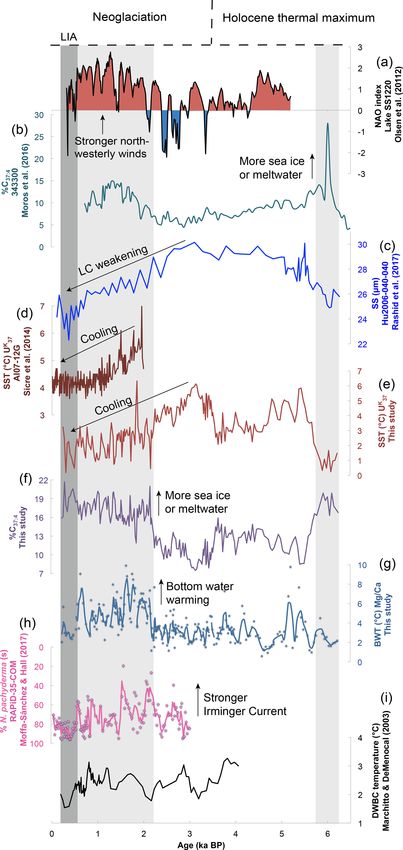
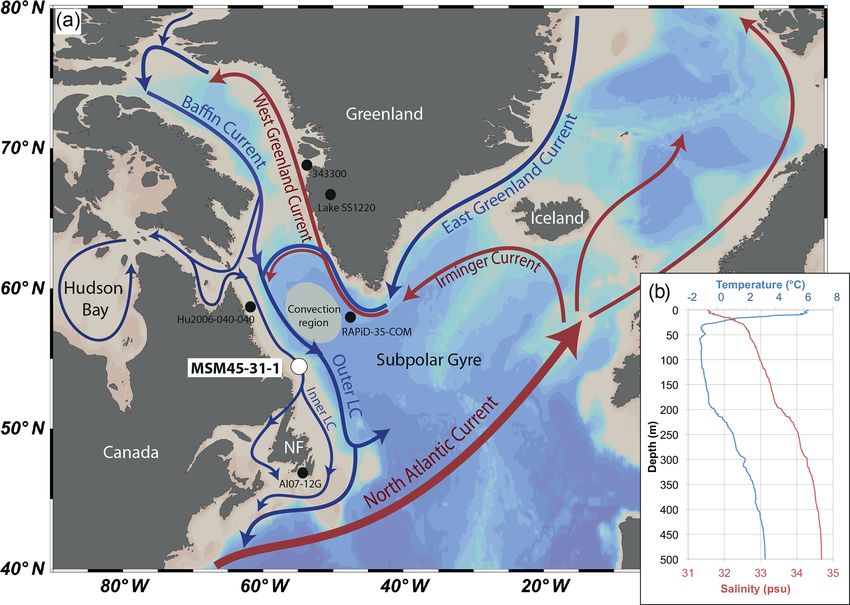
1128                                      A. A. Lochte et al.: Surface and subsurface Labrador Shelf water mass conditions

7 ka (e.g. Jennings et al., 2015; Ullman et al., 2016) and the     2   Oceanographic setting
early Holocene strengthening of the West Greenland Current
(WGC) bringing a larger proportion of warm, more saline At-        The Labrador Sea is the coldest and freshest basin of the
lantic waters into the Labrador Sea (e.g. Lloyd et al., 2005;      North Atlantic (Yashayaev, 2007) and is one of the ma-
Lochte et al., 2019a; Seidenkrantz et al., 2013; Sheldon et        jor areas of open-ocean convection (Marshall and Schott,
al., 2016). In turn, high surface water buoyancy may have          1999). It plays a crucial role in influencing the strength and
been a limiting factor in LSW formation during the early           variability of the AMOC through the formation of LSW,
Holocene (e.g. Hillaire-Marcel et al., 2001; Hoogakker et al.,     which builds the upper part of NADW (Böning et al., 2006;
2015). Today, the rate of Labrador Sea convection is con-          Schmidt and Send, 2007; Schmitz and McCartney, 1993;
trolled by two main processes: heat loss to the atmosphere         Yashayaev, 2007; Yashayaev and Loder, 2009, 2016). Inter-
and the relative supply of buoyant freshwater to the con-          mediate LSW forms through convection following an intense
vection region. While changes in the heat loss are predom-         cooling of central Labrador Sea surface waters during partic-
inantly related to atmospheric forcing, Labrador Sea salinity      ularly cold winters in North America (Clarke and Gascard,
is controlled mainly by two freshwater supply routes (Wang         1983). The annual variability of LSW formation was found
et al., 2018): the eastern route via the East Greenland Current    to correlate with the North Atlantic Oscillation (NAO), the
(EGC), which mixes with the Irminger Current (IC) south            dominant mode of atmospheric variability in the North At-
of Greenland to form the WGC, and the western route via            lantic region (Hurrell, 1995). The mode of the NAO wields
the Labrador Current (LC), the extension of the Baffin Cur-        a major influence on temperature and precipitation patterns
rent (BC; Fig. 1a). While early studies suggested the LC as        across the North Atlantic region and is defined by the dif-
the main source of central Labrador Sea freshwater (Lazier,        ference in atmospheric pressure at sea level between the Ice-
1973, 1988; Khatiwala et al., 1999), more recent work advo-        landic low and the Azores high-pressure systems (Hurrell,
cated the WGC as the main supplier of freshwater (Cuny et          1995). Positive NAO phases (NAO+ ) are generally associ-
al., 2002; Straneo, 2006; Schmidt and Send, 2007).                 ated with strong north-westerly winds over the Labrador Sea.
   In order to assess the relative roles of the WGC and LC         These strong winds bring Arctic air southward, promoting
in regulating the freshwater budget and convection of the          enhanced winter cooling in the Labrador Sea region and thus
Labrador Sea, paleoceanographic reconstructions of these           stimulating deep convection (Dickson et al., 1996) and fos-
two main currents are critical. While several studies have         tering the southward advection of sea ice (Dickson et al.,
provided middle to late Holocene reconstructions of the            2000; Deser et al., 2000; Drinkwater, 1996).
northward flowing WGC along the western coast of Green-               The Labrador Sea receives freshwater through its border-
land (Krawczyk et al., 2010; Lloyd et al., 2007; Moros et          ing currents: the WGC and the LC (Wang et al., 2018). As
al., 2016; Møller et al., 2006; Seidenkrantz et al., 2007; Sha     an extension of the BC, the LC flows south-eastwards along
et al., 2017) or the IC (Moffa-Sánchez et al., 2014; Moffa-        the continental margin of Labrador and Newfoundland and
Sánchez and Hall, 2017), there is less evidence for water          exports buoyant freshwater from the Arctic Ocean to the sub-
mass conditions in the southward flowing LC, as paleoceano-        tropical North Atlantic (Fig. 1a). The LC is divided into two
graphic reconstructions from the Labrador Shelf have mainly        branches: a shallow inner branch that flows over the Labrador
focussed on late deglacial to early Holocene meltwater run-        Shelf and an outer branch that is centred along the upper con-
off from the LIS (e.g. Jennings et al., 2015; Hoffman et al.,      tinental slope (Lazier and Wright, 1993). The inner LC is the
2012; Lewis et al., 2012; Hillaire-Marcel et al., 2007) and        immediate continuation of the BC (Cuny et al., 2002), aug-
its impact on LC strength (Rashid et al., 2017). Conversely,       mented by Arctic water outflow from Hudson Bay (Straneo
most reconstructions of sea surface temperature and sea ice        and Saucier, 2008), while the outer LC receives a significant
cover focus on the region around Newfoundland (Keigwin et          proportion of Atlantic waters by the westward retroflection of
al., 2005; Solignac et al., 2011; Sicre et al., 2014; Sheldon et   the WGC, which itself is formed from the cold EGC, and the
al., 2015, 2016) and Orphan Knoll (Hoogakker et al., 2011,         warm, saline IC (Cuny et al., 2002). Mixing of the inner and
2015), whereas very little information is available about mid-     outer LC branches occurs in the saddles between the promi-
dle to late Holocene water mass conditions in the central LC,      nent banks on the Labrador Shelf (Vilks, 1980; see Figs. 1b,
as high-resolution late Holocene sediment records from the         2). Just south of Cartwright Saddle, in the vicinity of Flem-
Labrador Shelf and slope are sparse.                               ish Cap and Newfoundland, the LC flows into the subpolar
   Here, we provide detailed reconstructions of LC tem-            North Atlantic (Fig. 1a).
perature and salinity changes since the middle Holocene,
in order to discuss the current’s potential role in central
Labrador Sea convection. Paleoceanographic reconstructions
are based on a high-resolution sediment record from the
southern Labrador Shelf, providing information about sea
surface and bottom water temperatures, freshening and sea
ice cover of Labrador Shelf waters during the last 6000 years.

Clim. Past, 16, 1127–1143, 2020                                                      https://doi.org/10.5194/cp-16-1127-2020
A. A. Lochte et al.: Surface and subsurface Labrador Shelf water mass conditions                                                      1129

Figure 1. (a) Map of the North Atlantic showing modern surface circulation with cold (blue) and warm (red) currents (adopted from Lazier
and Wright, 1993; Rhein et al., 2011). A shaded area indicates the convection region of LSW. Core MSM45-31-1 is marked by a white dot;
other cores referred to are marked by black dots. NF: Newfoundland. (b) Depth profiles of temperature (blue) and salinity (red) of the water
column near the core site at 54◦ 28.53 N, 56◦ 04.33 W obtained from CTD deployment during cruise MSM45 in August 2015.

3     Material and methods                                              from 1 cm thick sediment slices at 1 m intervals down-core.
                                                                        The 14 C dates were calibrated using Calib 7.1 (Stuiver and
3.1    Material                                                         Reimer, 1993; Stuiver et al., 2017) and the Marine13 dataset
                                                                        (Reimer et al., 2013) with a reservoir correction (1R) of
Gravity core MSM45-31-1 (1150 cm core length) was recov-
                                                                        144 ± 38 years, based on the present Labrador Shelf marine
ered from the Labrador Shelf at 54◦ 24.74 N, 56◦ 00.53 W, at
                                                                        radiocarbon correction (McNeely et al., 2006). Dates are re-
566 m water depth (Fig. 1a), during the R/V Maria S. Merian
                                                                        ported in calibrated years BP (before present) and are pre-
cruise MSM45 in August 2015 (Schneider et al., 2016). The
                                                                        sented in Table 1.
core site is located next to the Cartwright Saddle, off Hamil-
ton Inlet, in a depression associated with an over 600 m deep
basin that is part of the Labrador Marginal Trough along                3.3    Alkenone biomarkers
the inner Labrador Shelf. The sediment column consists of
homogenous olive grey, silty, clayey mud and was subsam-                In total, 218 bulk sediment samples were analysed at 5 cm in-
pled at 5 cm intervals on board the research vessel. A CTD              tervals at the Biomarker Laboratory, Institute of Geosciences,
(conductivity–temperature–depth) deployment at nearby sta-              Kiel University. Long-chained alkenones (C37 ) were ex-
tion 30 at 54◦ 28.53 N, 56◦ 04.33 W provides depth profiles of          tracted from 2 to 3 g homogenized bulk sediment, using an
temperature and salinity (Fig. 1b) of southern Labrador Shelf           accelerated solvent extractor (Dionex ASE-200) with a mix-
waters at the time of collection. A downward increase in tem-           ture of 9 : 1 (v/v) of dichloromethane : methanol (DCM :
perature and salinity below 200 m depth shows that the inner            MeOH) at 100 ◦ C and 100 bar N2 (g) pressure for 20 min.
LC overlies warmer and more saline waters of the outer LC               Extracts were cooled at −20 ◦ C and brought to near dry-
(Figs. 1b, 2).                                                          ness by Syncore polyvap at 40 ◦ C and 490 mbar. For the
                                                                        identification and quantification of C37:2 , C37:3 and C37:4 ,
                                                                        we used a multi-dimensional, double-column gas chromatog-
3.2    AMS radiocarbon dating
                                                                        raphy (MD-GC) set-up with two Agilent 6890 gas chro-
The stratigraphy of MSM45-31-1 is based on 12 accelera-                 matographs (Etourneau et al., 2010). The addition of an in-
tor mass spectrometry (AMS) 14 C measurements on mixed                  ternal standard prior to extraction (cholestane [C27 H48 ] and
calcareous benthic foraminifera at the Leibniz Laboratory               hexatriacontane [C36 H74 ]) allowed the quantification of the
of Kiel University (CAU), Germany. Each sample con-                     organic compounds that are reported in nanograms per gram
tained over 1000 specimens (about 5 mg), which were picked              dry bulk sediment. The proportion of each unsaturated ketone

https://doi.org/10.5194/cp-16-1127-2020                                                              Clim. Past, 16, 1127–1143, 2020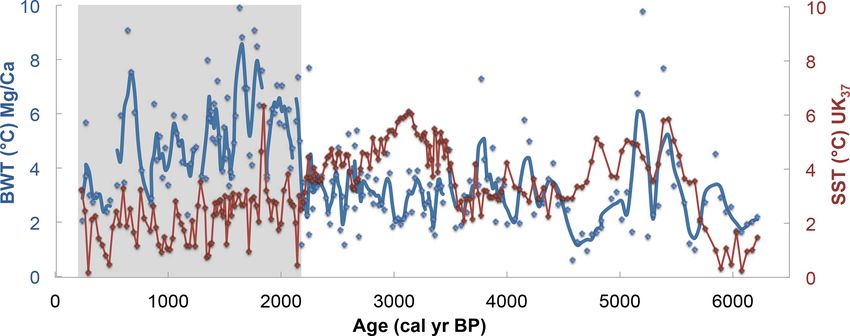
1130                                                   A. A. Lochte et al.: Surface and subsurface Labrador Shelf water mass conditions

Table 1. Twelve AMS radiocarbon dates, calibrated in Calib7.1 (Stuiver and Reimer, 1993; Stuiver et al., 2017) using the Marine13 dataset
(Reimer et al., 2013) with a reservoir correction of 1R = 144 ± 38 years (McNeely et al., 2006).

          AMS                Depth       Reported         error ±                 1σ            2σ   Median age     Material dated
          laboratory          (cm)        14 C age          (yr)          age range     age range    probability
          number                           (yr BP)                       (cal yr BP)   (cal yr BP)    (cal yr BP)
          KIA 51561                3            715          20           145–168a        67–297             201    Mixed benthic foraminifera
                                                                          172–264b
          KIA 51562            103             1417          29            767–883       709–917            818     Mixed benthic foraminifera
          KIA 51563            203             1909          21          1271–1350     1231–1404           1313     Mixed benthic foraminifera
          KIA 51564            303             2179          28          1543–1666     1484–1735           1604     Mixed benthic foraminifera
          KIA 51565            403             2554          26          1982–2110     1904–2174           2045     Mixed benthic foraminifera
          KIA 51566            503             2819          22          2310–2424     2266–2536           2373     Mixed benthic foraminifera
          KIA 51567            603             3103          22          2698–2772     2659–2843           2738     Mixed benthic foraminifera
          KIA 51568            703             3509          23          3168–3301     3096–3351           3228     Mixed benthic foraminifera
          KIA 51569            803             3763          26          3451–3571     3390–3635           3516     Mixed benthic foraminifera
          KIA 51570            903             4156          25          3951–4093     3876–4161           4024     Mixed benthic foraminifera
          KIA 51571           1003             4795          25          4820–4925     4791–5012           4877     Mixed benthic foraminifera
          KIA 51572           1103             5572          31          5743–5868     5672–5908           5801     Mixed benthic foraminifera

        Relative probability: a 0.192; b 0.808, according to Calib7.1.

was obtained by the integration of peak areas of the different                         tween %C37:4 and salinity (Schwab and Sachs, 2011; Sikes
compounds in the respective chromatograms. Alkenone con-                               and Sicre, 2002; Filippova et al., 2016; Theroux et al., 2010;
centrations (sum of C37:2 , C37:3 and C37:4 ) are used as an                           Toney et al., 2010). Bendle et al. (2005) found that higher
indication of alkenone productivity.                                                   proportions of C37:4 are produced in low-productivity polar
                                                                                       waters, probably because C37:4 proportions vary in different
3.3.1   Sea surface temperature estimates                                              alkenone-producing haptophyte species (Conte et al., 1995;
                                                                                       Marlowe et al., 1984). A culture experiment by Chivall et
Sea surface temperature (SST) estimates are based on the UK   37                       al. (2014) showed that certain, non-coccolith-bearing, prym-
                                            0
index (Brassell et al., 1986) and the UK  37 index (Prahl and                          nesiophytes like Chrysotila lamellosa produce between 30 %
Wakeham, 1987). The UK    37 index was calculated according to                         and 44 % C37:4 in a positive relationship to salinity. Nonethe-
Brassell et al. (1986): UK37 = (C37:2 −C37:4 )/(C37:2 + C37:3 +                        less, according to Bendle et al. (2005), the highest C37:4 con-
                    0
C37:4 ). The UK   37 index was calculated using the calibra-
                                                                                       centrations in surface sediments from the polar Atlantic de-
tion of Prahl and Wakeham (1987): UK
                                          0                                            lineate the mean position of the sea ice margin off Green-
                                        37 = (C37:2 )/(C37:2 +
C37:3 ). Both result in standard deviations of 0.01. Rosell-                           land. In addition, preliminary core top studies imply that high
Melé (1998) and Bendle and Rosell-Melé (2004) point out                                (> 15 %) abundances of C37:4 are restricted to surface sed-
that UK                                       ◦                                        iments within the limits of seasonal sea ice extent in Baffin
        37 -based SST estimates down to 6 C are more con-
                                                               0                       Bay and the Labrador Sea (Thomas Blanz, unpublished data).
gruent with modern observations than those based on UK       37 .                      Although the exact environmental factors that affect the pro-
However, UK   37 -based SST estimates could be biased with re-                         duction of C37:4 remain ambiguous, we interpret higher pro-
spect to absolute values when C37:4 exceeds 5 % (Rosell-
                                                                                       portions of C37:4 (> 15 %) as an indicator of sea ice margin
Melé, 1998), which is the case here, and should therefore
                                                                                       conditions.
be interpreted with caution.

3.3.2   %C37:4 – a proxy for meltwater or sea ice cover?                               3.4 Mg/Ca measurements

Several studies have suggested an increase in the production                           For Mg/Ca measurements, the benthic foraminifera species
of tetra-unsaturated C37 (C37:4 ) in polar and subpolar surface                        Nonionellina labradorica was used. Due to its infaunal
waters at lower salinities (Bendle et al., 2005; Blanz et al.,                         lifestyle, the bottom water carbonate ion concentration has
2005; Rosell-Melé, 1998; Rosell-Melé et al., 2002; Sicre et                            been shown to have a limited influence and this species has,
al., 2002). Thus, the proportion of C37:4 relative to the sum                          in the Arctic, been deemed a suitable recorder of Mg/Ca
of alkenones [%C37:4 =C37:4 /(C37:2 + C37:3 + C37:4 )] in sed-                         in shelf regions (Barrientos et al., 2018). Per sample, 20–
imentological records from the North Atlantic is often used                            70 specimens of N. labradorica were handpicked from the
to qualitatively indicate changes in salinity. However, several                        > 315 µm size fraction, weighed and crushed between two
studies have observed no or even an inverse relationship be-                           glass plates. Two-thirds of the crushed sample were trans-

Clim. Past, 16, 1127–1143, 2020                                                                            https://doi.org/10.5194/cp-16-1127-2020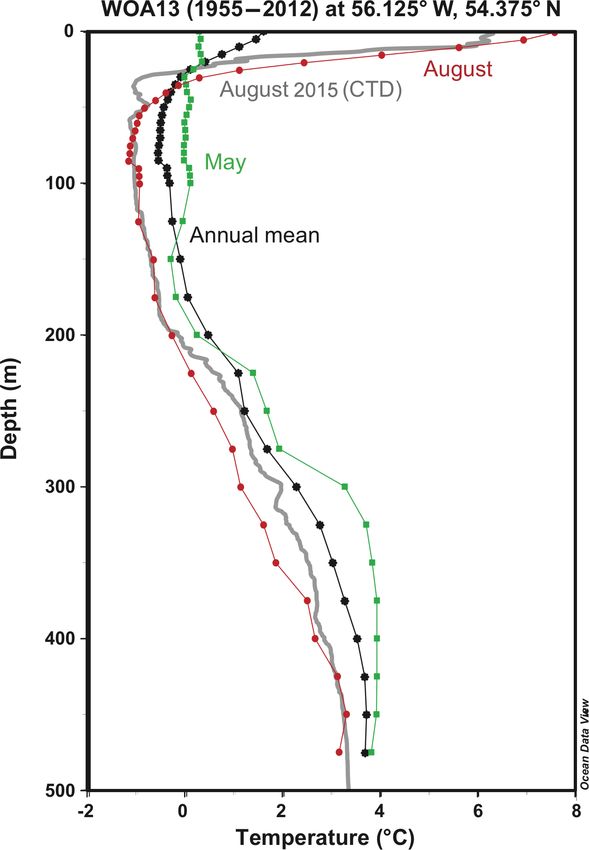
A. A. Lochte et al.: Surface and subsurface Labrador Shelf water mass conditions                                                      1131

                                                                          60th sample. Trace elements (Fe, Al and Mn) were moni-
                                                                          tored to exclude possibly contaminated or coated samples
                                                                          from the dataset. Mg/Ca values exceeding 2.4 mmol mol−1
                                                                          were considered unreliable and are marked as flyers in the
                                                                          dataset (Fig. 4d). Based on seven duplicate down-core sam-
                                                                          ple measurements, we obtained an analytic precision of
                                                                          0.2 mmol mol−1 Mg/Ca, which translates into 2 ◦ C in re-
                                                                          spective temperature estimates. Bottom water temperature
                                                                          (BWT) reconstructions are based on the calibration of Skir-
                                                                          bekk et al. (2016) for the subpolar North Atlantic region. As
                                                                          the calibration is based on a temperature range of 1–4 ◦ C,
                                                                          estimates exceeding 4 ◦ C may be less accurate, which is the
                                                                          case for about 35 % of the samples reported here. As a result,
                                                                          we refrain from interpreting individual data points exceed-
                                                                          ing 4 ◦ C. However, given the consistency of average Mg/Ca
                                                                          values for different sections of the core, we are confident in
                                                                          our interpretation of changing average BWT for specific time
                                                                          intervals (see Sect. 5.2.3 below).

                                                                          3.5    Stable isotope measurements

                                                                          For stable isotope measurements, the remaining one-third of
                                                                          the crushed samples of N. labradorica were cleaned with
                                                                          ethanol absolute, decanted and dried at 40 ◦ C. Stable iso-
                                                                          tope analyses were carried out at the Leibniz Laboratory for
Figure 2. Comparison of different temperature profiles of the water       Radiometric Dating and Stable Isotope Research in Kiel. A
column near the studied core site. The grey line shows the water          Finnigan MAT 253 mass spectrometer coupled with a Kiel
profile at 54◦ 28.53 N, 56◦ 04.33 W obtained during cruise MSM45          IV carbonate preparation device was used. Results were cal-
in August 2015. Coloured lines mark the profiles at the nearest lo-       ibrated to the Vienna Pee Dee Belemnite (V-PDB) scales,
cation (27 km from the core site) at 54◦ 37.50 N, 56◦ 12.5 W, ob-
                                                                          which is applied to all calcitic δ 18 O (δ 18 Oc ) analyses. Based
tained from the World Ocean Atlas 2013 (WOA13; 1955–2012; Lo-
carnini et al., 2013), showing annual mean (black), August (red) and
                                                                          on 11 down-core duplicate measurements, the standard de-
May (green) temperatures. August data obtained during MSM45               viation is 0.11 ‰. To estimate the δ 18 O signature of sea-
and from WOA13 show similar temperature profiles with a warm-             water (δ 18 Ow , ‰ Vienna Standard Mean Ocean Water (V-
ing of up to 6–8 ◦ C at the sea surface. The upper 50 m of the water      SMOW)), the value of δ 18 Oc was first corrected for vital ef-
column reflect atmospheric temperatures and therefore differ in the       fects of N. labradorica by subtracting 0.15 ‰ (Rasmussen
August, May and annual mean profiles from WOA13. All profiles             and Thomsen, 2009) and then applied in the Shackleton et
show temperatures of −1 to 1 ◦ C between ca. 40 and 200 m, reflect-       al. (1974) equation together with the Mg/Ca-derived tem-
ing the cold, inner LC and higher temperatures below 200 m depth,         perature estimates. A sea level correction of 0.0083 ‰ m−1
rising up to 4 ◦ C at the shelf bottom, which reflects the influence of   (1 ‰ for 120 m of sea level), derived from the relative sea
the warmer, outer LC strongly influenced by the WGC.                      level curve by Austermann et al. (2013), was applied, to cor-
                                                                          rect for the effect of global ice volume on the ocean’s δ 18 O
                                                                          signature (δ 18 Ow-ivc ). Based on duplicates, the standard de-
ferred into pre-leached Eppendorf vials and cleaned follow-               viation of δ 18 Ow-ivc is 0.35 ‰.
ing the full protocol of Martin and Lea (2002), including a
reductive and oxidative cleaning step and a final leaching
                                                                          4     Results
step with 0.001 N HNO3 . After dissolving and diluting the
samples in 0.1 N HNO3 , they were measured with an induc-                 4.1    Chronology
tively coupled plasma–optical emission spectroscopy (ICP-
OES) instrument with radial plasma observation at the In-                 The chronology of core MSM45-31-1 is based on a linear in-
stitute of Geoscience, Kiel University. The analytical error              terpolation of the calibrated median probability ages that are
for Mg/Ca analyses was 0.1 % relative standard deviation.                 presented in Table 1. Based on the lowermost and uppermost
The JCP-1 coral reference material (Hathorne et al., 2013)                age constraints, the core covers at least the period from 5801
was measured each sixth sample for accuracy and drift cor-                (+67/ − 58) to 201 (+63/ − 29) years BP. The age–depth
rection. Additional accuracy control was provided by mea-                 model is presented in Fig. 3. The sedimentation rate varies
surements of standard BAM RS3 (Greaves et al., 2008) each                 between 0.11 and 0.35 cm yr−1 and is lowest in the deeper

https://doi.org/10.5194/cp-16-1127-2020                                                               Clim. Past, 16, 1127–1143, 2020
1132 A. A. Lochte et al.: Surface and subsurface Labrador Shelf water mass conditions
Figure 3. Age–depth model of core MSM45-31-1. Black triangles mark the calibrated ages of the AMS radiocarbon dates. The black dotted
line marks the sedimentation rate (cm yr−1 ).
part of the core, from 1150 to 900 cm depth (Fig. 3), probably atively low at 1.6 mmol mol−1 and about 3 ◦ C, respectively.
due to compressional effects resulting from gravity coring. The δ 18 Oc is at about 3.5 ‰ and the δ 18 Ow-ivc is at about
The chronological resolution is between 3 and 9 yr cm−1 , so 0 ‰.
the core provides a sub-decadal record of the late Holocene.
4.2.2 From 5.6 to 2.1 ka (1080–435 cm)
4.2 Temporal variability in southern Labrador Shelf
waters Between 5.6 and 2.1 ka, alkenone concentrations vary be-
tween 25 and 80 ng g−1 . Two peaks up to 60 and 55 ng g−1
0
Alkenone concentrations range from 20 to 80 ng g−1 and, de- at 5.4 and 3.8–3.0 ka are evident (Fig. 4a). UK
37 indices are in
spite major fluctuations, gently increase on average towards K
medium ranges, while U37 indices are in maximum ranges in
0
the top of the core (Fig. 4a). The UK
37 index ranges from 0.30 this interval, leading to SST estimates of 8–10 and 2–6 ◦ C,
to 0.43 and respective SST estimates range from 8 to 12 ◦ C respectively. UK 37 -based SST estimates show two peaks of
(Fig. 4b). The UK37 index and SST estimates range from 0.05 5.8 and 6 ◦ C at 5.4 and 3.8–3.0 ka. The proportion of C37:4
to 0.25 and from 0 to 6 ◦ C, respectively (Fig. 4c). The pro- shows the lowest values in this interval with an average of
portion of C37:4 ranges from 8 % to 22 % and shows the low- 12 % and two minima of 9 % and 8 % at 5.4 and 3.1 ka. De-
est values between 5.6 and 2.1 ka (Fig. 4d). Mg/Ca ratios spite the warming of surface waters, BWT reconstructions
range from 1.3 to 3 mmol mol−1 (excluding values exceeding remain at average values of 3.1 ◦ C, which corresponds to
2.4 mmol mol−1 ; see Sect. 3.4 above) (Fig. 4e). BWT esti- modern conditions at the core site (Figs. 1b, 2). However,
mates range from 0.6 to 9.9 ◦ C and indicate a shift to warmer the BWT record shows two warm peaks of 7.7 and 9.8 ◦ C at
temperatures at 2.1 ka (Fig. 4e). The δ 18 Oc (‰-V-PDB) of 5.4 and 5.2 ka, respectively, and a third warm peak to 7 ◦ C at
N. labradorica ranges from 3.2 ‰ to 4.0 ‰ and does not 3.8 ka. The δ 18 Oc record shows a minor long-term increase
show any significant minima or maxima (Fig. 4f). The tem- with average values of 3.6 ‰. The δ 18 Ow-ivc record shows
perature and ice-volume-corrected δ 18 Ow-ivc (‰-V-SMOW) an increasing trend towards positive values of about 0.5 ‰,
record ranges from −0.3 ‰ to 2.9 ‰ and shows a small shift except for a maximum of about 2 ‰ at 5.2 ka, suggesting a
to more positive values after 2.1 ka (Fig. 4g). According to short increase in bottom water salinity.
major changes in surface and bottom water conditions, the
record has been divided into three main environmental inter-
4.2.3 From 2.1 ka to the present (435–0 cm)
vals: from 6.2 to 5.6 ka, from 5.6 to 2.1 ka and from 2.1 ka to
the present (Fig. 4). The interval after 2.1 ka shows an increase in alkenone con-
centration that peaks at 75 ng g−1 at 0.7 ka, with average val-
0
4.2.1 From 6.2 to 5.6 ka (1150–1085 cm) ues of 48 ng g−1 . The UK 37 -based SST record shows higher
fluctuation in this interval with temperatures between 8.5 and
Between 6.2 and 5.6 ka, the alkenone concentration is rel- 11.5 ◦ C, while the UK 37 -based SST record reveals a general
0
atively low with average values of 33 ng g−1 . The UK 37 and decrease with fluctuations between 0 and 6 ◦ C and average
K
U37 indices and relative SST estimates show the lowest val- values of 2.2 ◦ C. The %C37:4 record is characterized by a
ues of the record, suggesting a period of cool surface waters shift to values of 17 % on average, suggesting an increase
on the Labrador Shelf, while the proportion of C37:4 is high in sea ice after 2.1 ka. Especially in this interval, the use of
at about 18 %. Mg/Ca levels and BWT estimates are also rel- either UK K0
37 or U37 , results in opposite SST trends. Nonethe-
Clim. Past, 16, 1127–1143, 2020 https://doi.org/10.5194/cp-16-1127-2020A. A. Lochte et al.: Surface and subsurface Labrador Shelf water mass conditions 1133
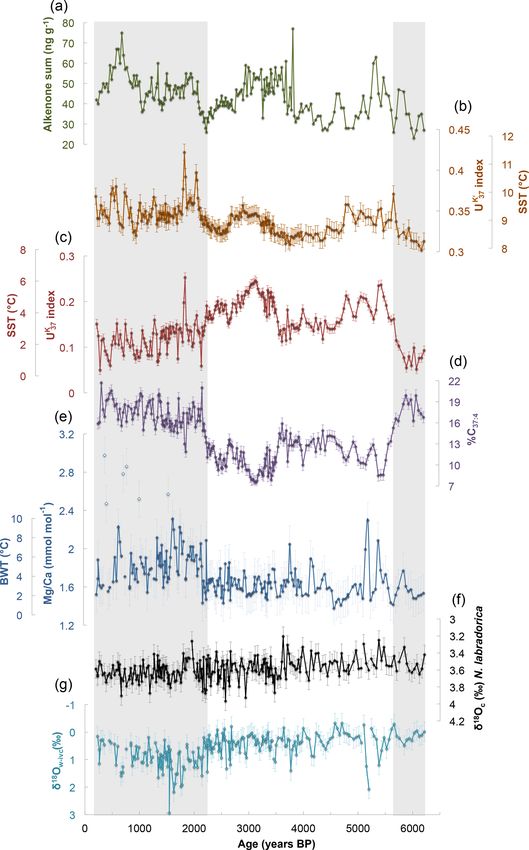
0
Figure 4. Down-core record of MSM45-31-1 showing (a) alkenone sum, (b) UK
37 index displayed with 0.01 uncertainty, and respective
SST estimates, (c) UK 37 index displayed with 0.01 uncertainty and respective SST estimates, (d) %C37:4 displayed with 0.8 % uncertainty,
(e) Mg/Ca (mmol mol−1 ) of N. labradorica displayed with 0.19 mmol mol−1 uncertainty and respective BWT estimates, (f) δ 18 Ocalcite (‰-
V-PDB) of N. labradorica displayed with 0.11 ‰ uncertainty, and (g) δ 18 Ow-ivc (‰-V-SMOW) displayed with 0.35 ‰ uncertainty. Grey
vertical bars highlight periods of pronounced oceanographic change.
https://doi.org/10.5194/cp-16-1127-2020 Clim. Past, 16, 1127–1143, 20201134 A. A. Lochte et al.: Surface and subsurface Labrador Shelf water mass conditions
less, the use of the UK37 index results in SST estimates closer mates as reflecting the inner LC, while Mg/Ca-based BWT
to the range of modern values in the upper water column estimates instead reflect conditions of the outer LC and the
0
(Fig. 2) than those provided by the UK 37 index. The BWT westward retroflection of the WGC.
reconstructions display higher values after 2.1 ka, with aver-
age temperatures of 6 ◦ C. The δ 18 Oc record continues with 5.2 Middle to late Holocene phases of Labrador Shelf
a slight increase to more positive levels, while the δ 18 Ow-ivc oceanography
record shows higher fluctuations and generally more positive
values in this interval as well as a peak to nearly 3 ‰, in cor- Based on the surface and bottom water records presented
respondence with the bottom water warm peaks. here, we differentiate between three main climatic and
oceanographic intervals in Labrador Shelf waters during the
middle to late Holocene. From 6.2 to 5.6 ka, the LC experi-
5 Discussion
enced a cool period with a strong sea ice cover that is also ev-
5.1 The reliability of sea surface and bottom water
ident along the western coast of Greenland (Disko Bugt; e.g.
temperature estimates with regard to modern
Moros et al., 2016). This cold interval was followed by gen-
conditions
erally warmer conditions in Labrador Shelf surface waters
between 5.6 and 2.1 ka associated with the Holocene thermal
0
UK K
37 - and U37 -based SST estimates differ substantially in this maximum in the western Arctic (Kaufman et al., 2004). In
region, due to relatively large proportions of C37:4 . While addition to the gradual cooling trend of the last 3000 years,
0
UK ◦
37 -based SST estimates with an average of 9 C appear our %C37:4 record implies a recurrence of stronger sea ice
K
too warm for this region, U37 -based SST estimates with an cover after 2.1 ka. Simultaneously, a shift to warmer BWT
average of 3 ◦ C are congruent with modern observations of after 2.1 ka likely corresponded to an increased supply of
SSTs at the core site. Although the SST measured in Au- warmer Atlantic waters with the westward retroflection of
gust 2015 was 6 ◦ C (Fig. 1b), the annual mean SST at the the WGC reaching deeper regions on the Labrador Shelf.
core site is below 2 ◦ C (Fig. 2). However, alkenones neither
reflect peak summer (i.e. August) nor annual mean tempera- 5.2.1 Cold Labrador Current (6.2–5.6 ka)
tures but rather record the average temperatures of the plank-
ton blooming season, which on the Labrador Shelf, today, is From 6.2 to 5.6 ka, low sea surface and bottom water tem-
between May and November (Frajka-Williams and Rhines, peratures suggest that both surface and subsurface waters
2010; Harrison et al., 2013). Thus, at our core site, average were dominated by cold, Arctic water masses from Baffin
UK ◦
37 -based SST estimates of our down-core record (3.3 C) as Bay, with a significant sea ice cover indicated by relatively
well as of the most recent core top sample (3.3 ◦ C) agree very high %C37:4 (Fig. 6e, f, g). We associate this period with a
well with the modern average SST between May and Novem- cold inner LC caused by strong advection of Arctic waters
ber of 3.5 ◦ C (WOA13; 1955–2012; Locarnini et al., 2013). and sea ice from Baffin Bay. Colder conditions with a longer
Therefore, we assume that the UK 37 index provides the most annual sea ice cover have also been detected in a northern
accurate SST estimates for our record, although we are aware Labrador fjord between 7 and 5.8 ka (Richerol et al., 2016).
that alkenone-based temperature estimates become less ro- A similar scenario is also seen south of our core in Trinity
bust with increasing values of %C37:4 and need to be inter- Bay, Newfoundland, between 7.2 and 5.5 ka (Sheldon et al.,
preted with caution (Rosell-Melé, 1998). 2015), with a period of cold surface waters and seasonal sea
In our record, the down-core mean BWT of 3.8 ◦ C is ice cover, most likely sourced from the Arctic via the LC.
slightly above the mean value of 3.3 ◦ C in UK 37 -based SST Moreover, Solignac et al. (2011) estimated cold SSTs around
estimates, indicating a water column temperature inversion Newfoundland during the mid-Holocene and ascribed these
(Fig. 5). Although our BWT estimates may be biased due conditions to a stronger than present LC, which may have
to the small temperature range of the calibration used, they been caused by accelerated atmospheric (westerly wind) cir-
are consistent with modern annual mean temperatures above culation patterns (Jessen et al., 2011) combined with strong
3.5 ◦ C at about 500 m depth (Fig. 2). While a water column melting in the Arctic. In contrast to this scenario, however,
temperature inversion appears counterintuitive, it is likely a decline in sortable silt (SS) mean size on the northern
caused by inflowing warmer and more saline subsurface wa- Labrador Shelf has been interpreted as reflecting a relatively
ters of the outer branch of the LC that receives a large pro- weak LC during this period (Site Hu2006040-40, Rashid et
portion of the westward retroflection of the WGC, which, al., 2017, Fig. 6c).
in turn, is a mixture of the cold EGC and the warm, saline On the north-eastern rim of the Labrador Sea, in Disko
IC (Fig. 1a). The outer LC, fed by the WGC, reaches the Bugt (Greenland), high amounts of %C37:4 were also evident
deeper regions on the Labrador Shelf, while the upper 200 m around 6 ka (Moros et al., 2016; Fig. 6b), which are in agree-
of the water column are dominated by the cold and shallow ment with our findings. The authors interpreted these high
inner LC, which carries a higher proportion of Arctic waters proportions of C37:4 as indicating strong meltwater run-off.
from Baffin Bay. Thus, we interpret the UK 37 -based SST esti- At the same time, between 6.2 and 5.5 ka, they identified
Clim. Past, 16, 1127–1143, 2020 https://doi.org/10.5194/cp-16-1127-2020A. A. Lochte et al.: Surface and subsurface Labrador Shelf water mass conditions 1135
Figure 5. Surface (red) and bottom (blue) water temperature reconstructions are based on the alkenone UK 37 index and Mg/Ca ratios of
benthic foraminifera N. labradorica, respectively. In contrast to the surface record, the BWT record is displayed with a three-point running
mean due to the 2 ◦ C uncertainty of individual data points. Both records show a similar temperature range between 6.1 and 2.1 ka. After
2.1 ka, the BWT record displays higher fluctuations and a shift to warmer average temperatures, leading to a temperature reversal in the
water column with generally warmer bottom waters underlying colder surface waters in this interval. The warming of bottom waters is
associated with a stronger inflow of the westward retroflection of the WGC reaching our core site at 566 m depth underneath the cold inner
LC. The grey vertical bar highlights a period of pronounced oceanographic change.
a severe drop in warm water benthic foraminifera species 6e, g). Warmer conditions on the Labrador Shelf may be re-
Islandiella norcrossi, suggesting an abrupt subsurface wa- lated to the shallowing of the Arctic channels at about 6 ka,
ter cooling (Moros et al., 2016). The conditions in Disko which led to a decrease in Arctic water flow to Baffin Bay
Bugt may well have been related to a cold WGC associ- and instead enhanced the export through the Fram and Den-
ated with a cooling in the EGC at about this time (Perner mark straits along the East Greenland coast (Williams et al.,
et al., 2015; Müller et al., 2012; Ran et al., 2006). A dis- 1995). Warmer conditions were also indicated by the benthic
tinct cooling episode between 7 and 5 ka is also seen in foraminiferal assemblage of Trinity Bay, Newfoundland, that
Greenland ice core data (O’Brien et al., 1995), which was showed increases in fresh food supply and primary produc-
likely related to changes in atmospheric circulation leading tivity between 5.7 and 4.85 ka (Sheldon et al., 2015). Fur-
to increased storminess in the north-eastern United States ther south, off Cape Hatteras, Cléroux et al. (2012) described
(Noren et al., 2002). A cold spell is evident in the Camp increased surface water salinities between 5.2 and 3.5 ka,
Century ice core record as well, with a pronounced decrease which they attributed to the decreased export of colder and
in δ 18 O values at 5.8–5.6 ka (Vinther et al., 2009), consis- fresh waters from the north, allowing a northward shift of the
tent with a temporary cooling–freshening in oceanic condi- Gulf Stream. In contrast to this proposed weakening of the
tions affecting north-east Baffin Bay. Additionally, a marked LC, Rashid et al. (2017) identified a short-lived increase in
temperature drop in the northern North Atlantic (e.g. Mo- SS mean size in northern Labrador Shelf core Hu2006-040-
ros et al., 2004; Telesiński et al., 2014) is likely linked to 040 (Fig. 6c), suggesting an intensification of the LC. This
the most pronounced North Atlantic Holocene ice-rafted de- latter observation is in agreement with dinocyst assemblages
bris event (Bond et al., 2001). The coincidence of cool pe- of two Newfoundland records from Bonavista and Placentia
riods in records from the western, south-western and eastern Bay (Solignac et al., 2011) suggesting fresher and colder sea
Labrador Sea, as well as in many other North Atlantic records surface conditions between 5.6 and 4 ka, which the authors
(e.g. Bond et al., 2001; Moros et al., 2004; Telesiński et al., link to enhanced meltwater supply during a warm period in
2014), suggests that it was a widespread phenomenon in the the Arctic until 4.5–4 ka.
western North Atlantic region. In Disko Bugt, western Greenland, the interval from 5.5
to 3.5 ka is marked by a return to relatively warm subsurface
conditions and a gradual decrease in %C37:4 values follow-
5.2.2 Sudden warming followed by gradual cooling of ing the peak at 6 ka (Moros et al., 2016; Fig. 6b), which is
the Labrador Current (5.6–2.1 ka) in agreement with our findings. Diatom and dinocyst assem-
blages both show relatively mild surface water temperatures
The start of this interval at 5.6 ka is marked by a pronounced
despite a gradual trend towards cooler conditions, which is
increase in SSTs to over 6 ◦ C and a decline in %C37:4 to
also evident in our SST record between 5.5 and 3.5 ka. A re-
about 10 % (Fig. 6e, f), implying a substantial warming of
duction in the abundance of N. labradorica indicates lower
Labrador Shelf surface waters and a decrease in sea ice cover.
surface water productivity that is also suggested by dinocyst
Two warm peaks can also be seen in bottom waters at the be-
assemblages (Ouellet-Bernier et al., 2014), which Moros et
ginning of this interval, coeval with SST maxima (Figs. 5,
https://doi.org/10.5194/cp-16-1127-2020 Clim. Past, 16, 1127–1143, 20201136 A. A. Lochte et al.: Surface and subsurface Labrador Shelf water mass conditions
al. (2016) link to the increased strength and/or warmth of
the WGC. The enhanced influence of the WGC may have
resulted from a strong and relatively warm IC that is re-
ported from the East Greenland shelf (Jennings et al., 2002,
2011) and south-west and south of Iceland (e.g. Knudsen et
al., 2008). The strong influence of the WGC in Disko Bugt
may also have been the result of a largely land-based ice
sheet and reduced meltwater run-off from the Greenland Ice
Sheet (GIS) after 6 ka (Briner et al., 2010; Weidick and Ben-
nike, 2007; Weidick et al., 1990) with a minimum ice ex-
tent from ca. 5 to 3 ka (Briner et al., 2014). This period also
corresponds to relatively warm air temperatures recorded in
Greenland ice cores (e.g. Camp Century, Moros et al., 2016),
which were likely a result of the Holocene thermal maximum
between 5 and 3 ka over central to southern Greenland (Kauf-
man et al., 2004). Additionally, several lake records near
Jakobshavn Isbræ display high productivity under relatively
warm terrestrial conditions, and one of the lakes, North Lake
(Axford et al., 2013), indicates relatively high chironomid-
based temperatures. High lake levels linked to warmer con-
ditions are also reported in the Kangerlussuaq region, just
south of Disko Bugt (Aebly and Fritz, 2009).
In our record, a second warm peak at 3 ka is evidenced
by the lowest %C37:4 and the highest SSTs (Fig. 6e, f). The
warm temperatures around 3 ka correlate with a period of
negative NAO conditions (Olsen et al., 2012; Fig. 6a), which
generally result in weaker north-westerly winds and reduced
transport of Arctic waters through the Canadian gateways,
causing a weaker LC, milder winters and shorter sea ice sea-
sons. Warmer sea surface conditions are also seen in Placen-
tia Bay, Newfoundland, indicated by the lowest numbers of
sea ice indicator species Islandinium minutum between 3.2
and 2.2 ka (Solignac et al., 2011). These warmer conditions
around Newfoundland correlate with the lowest %C37:4 in
our record, suggesting that both regions experienced a re-
duction in sea ice cover, possibly caused by generally weak
north-westerly winds. In agreement with our records, warmer
annual mean temperatures were also detected in Greenland
ice core GISP2 between 4 and 2 ka (Alley et al., 1999), poten-
tially also related to the predominantly negative NAO condi-
tions at that time. In contrast to this warm episode with likely
low sea ice export from the Arctic region, northern Labrador
Figure 6. (a) The NAO index (Olsen et al., 2012) with positive Shelf core Hu2006-040-040 has been interpreted as implying
(red) and negative (blue) phases. (b) %C37:4 in core 343300 (Moros a relatively strong current at this time (Rashid et al., 2017;
et al., 2016). (c) Sortable silt mean (µm) in core Hu2006-040-040 Fig. 6c). Although the strength of the LC has generally been
(Rashid et al., 2017). (d) SST record in Newfoundland core AI07- tied to meltwater drainage and enhanced freshwater fluxes
12G (Sicre et al., 2014). (e) SST record based on the UK 37 index during the early Holocene, no such linkage has been found
(this study). (f) Higher levels of %C37:4 are interpreted as reflecting
for the middle to late Holocene (Rashid et al., 2017). Thus,
a longer sea ice season or meltwater. (g) BWT estimates are based
on Mg/Ca ratios in benthic foraminifera N. labradorica and reflect the role of sea ice and freshwater export on the strength of
subsurface conditions. (h) Lower abundances of polar water plank- the LC remains uncertain.
tic foraminifera species N. pachyderma sinistral in central Labrador After about 3 ka and coeval with the neoglaciation (Kauf-
Sea core RAPiD-35-COM indicate warming due to stronger IC in- man et al., 2004; Vinther et al., 2009), LC surface waters
flow (Moffa-Sánchez and Hall, 2017). (i) Mg/Ca temperature esti- cooled gradually. The onset of the neoglaciation between 3.2
mates representing the Deep Western Boundary Current (Marchitto and 2.7 ka was associated with a cooling in the Arctic that re-
and deMenocal, 2003). Grey vertical bars highlight periods of pro- duced meltwater and sea ice export (Scott and Collins, 1996)
nounced oceanographic change.
Clim. Past, 16, 1127–1143, 2020 https://doi.org/10.5194/cp-16-1127-2020A. A. Lochte et al.: Surface and subsurface Labrador Shelf water mass conditions 1137
and/or iceberg production (Andresen et al., 2011). Corre- nario of enhanced sea ice cover reducing LC strength. An-
spondingly, reduced meltwater and cold bottom water condi- other explanation for the LC weakening and cooling during
tions were detected in Disko Bugt (Greenland) between 3.5 the last 3000 years may be the shift to predominantly positive
and 2 ka (Lloyd et al., 2007). A similar cooling trend was im- NAO-like conditions (Olsen et al., 2012; Fig. 6a) caused by
plied by a general decrease in Atlantic water species in Disko stronger north-westerly winds that promoted the southward
Bugt after 3.5 ka (Perner et al., 2011). Lake deposits from advection of sea ice (Drinkwater, 1996) while also causing a
southern Greenland indicate dry and cold conditions from cooling of Labrador Sea surface waters. This would, in turn,
3.7 ka (Andresen et al., 2004) and shortly after 3.0 ka (Ka- lead to a reduced density of offshore waters relative to in-
plan et al., 2002), respectively. On the north Iceland shelf, shore waters, which would decrease the baroclinic pressure
temperatures dropped significantly at ca. 3.2 ka (Eiríksson gradient and weaken LC transport (Dickson et al., 1996).
et al., 2000; Jiang et al., 2002), and in the North Atlantic, Despite the gradual cooling trend of the LC during the
Bond et al. (1997) identified a strong ice-rafted debris event last 3000 years (Fig. 6e), bottom waters show a shift to
at 2.8 ka. Hence, the gradual cooling seen in our surface tem- warmer conditions after 2.1 ka (Fig. 6g). The shift to higher
perature record after 3 ka is in agreement with many North BWTs occurred simultaneously with the increase in %C37:4
Atlantic records that show colder conditions associated with (Fig. 6f), implying a strongly stratified water column that was
the neoglaciation. influenced by two different water masses. This scenario can
be compared to modern conditions of warmer waters under-
5.2.3 Subsurface warm water intrusions on the
lying cold waters at our core site (Figs. 1b, 2). Today, the
Labrador Shelf despite further surface cooling
cold inner LC only dominates Labrador Shelf waters down
(2.1 ka to the present)
to about 200 m depth (Lazier and Wright, 1993), while the
deeper part of the shelf, such as our core site at 566 m depth,
After 2.1 ka, the SST record shows a continuation of the is influenced by the warmer outer LC that is largely sup-
gradual cooling trend that started around 3 ka with the on- plied by the westward retroflection of the WGC. Hence, we
set of the neoglaciation. This continued cooling corresponds ascribe the warmer conditions seen in Labrador Shelf bot-
to the shift from predominantly negative to predominantly tom waters after 2.1 ka to a strengthening or warming of the
positive NAO conditions (Olsen et al., 2012; Fig. 6a), which WGC carrying warmer Atlantic waters to the deeper regions
would have resulted in generally stronger north-westerly on the Labrador Shelf. Episodes of an increased influx of At-
winds and colder winters in the Labrador Sea region. The lantic sourced water from the IC were also seen in the cen-
colder surface waters with stronger sea ice cover evident in tral Labrador Sea, indicated by decreases in the abundances
our record during the last 2100 years suggest that the in- of polar water planktic foraminifera species Neogloboquad-
ner LC received a strong supply of Arctic waters from Baf- rina pachyderma sinistral (%Nps) at about 2.3–2.1 and 1.6 ka
fin Bay in response to the neoglacial cooling and generally (RAPiD-35-COM; Moffa-Sánchez and Hall, 2017; Fig. 6h).
positive NAO conditions. In support of our findings, colder These correspond quite well to the subsurface warming peaks
conditions and an increase in the sea ice duration were also in our record. Despite the generally warmer conditions in our
recorded in Trinity Bay, Newfoundland, after 2.1 ka (Shel- subsurface water record during the last 2100 years, the record
don et al., 2015). Additionally, a gradual surface water cool- displays a trend returning to colder temperatures in this in-
ing of about 2 ◦ C during the last 2000 years was also evident terval. A general cooling trend after 2.2 ka is also evident in
in another core from Newfoundland (AI07-12G; Sicre et al., core RAPiD-35-COM and has been linked to a weakening in
2014; Fig. 6d), which further supports the surface water cool- LSW formation (Moffa-Sánchez and Hall, 2017).
ing trend observed in our record. Coeval with this neoglacial While our surface records imply the formation of a cold
cooling trend, northern Labrador Shelf core Hu2006-040- inner LC with a larger seasonal sea ice cover during the
040 shows a gradual decrease in SS mean size after about last 2100 years, central Labrador Sea records document en-
3 ka (Fig. 6c), implying an LC weakening. The general pos- hanced inflow of the warm and saline IC (Moffa-Sánchez
itive correlation of our SST record with the SS mean size and Hall, 2017) that is reflected by subsurface warming and
record in Hu2006-040-040 implies that colder LC surface higher salinity on the Labrador Shelf (Fig. 4). According to
temperatures correspond to a weaker current. Although LC Gelderloos et al. (2012), cold and fresh surface waters are
strength was tied to early Holocene freshwater discharge, no thought to inhibit convection in the Labrador Sea, while mod-
such linkage is apparent during the middle to late Holocene ern observations of warming and increased salinity in central
(Rashid et al., 2017). The authors, however, suggested that Labrador Sea subsurface waters correlate with episodes of
the LC weakening of the last 3000 years was related to the weak Labrador Sea convection (Yashayaev, 2007). Further-
neoglacial cooling and enhanced sea ice production, which more, extending observational data by proxy records for the
would have locked up larger amounts of freshwater, result- last 1200 years, Thornalley et al. (2018) report a strong re-
ing in a diminished supply of freshwater and a weakening duction in LSW formation and Deep Western Boundary Cur-
of the LC. The negative correlation of our %C37:4 record and rent (DWBC) flow during the last 150 years that seems to
the SS record of core Hu2006-040-040 does support this sce- correspond to a trend to warmer and saltier subsurface waters
https://doi.org/10.5194/cp-16-1127-2020 Clim. Past, 16, 1127–1143, 20201138 A. A. Lochte et al.: Surface and subsurface Labrador Shelf water mass conditions
in the Labrador Sea (Moffa-Sánchez et al., 2014). According SST record shows a gradual cooling trend in association with
to these studies, the reconstructed surface cooling and sub- the neoglaciation, which has also been observed in other
surface warming and salinity increase on the Labrador Shelf surface records from the Labrador Sea region. However, at
starting at 2.1 ka would strongly suggest that LSW formation 2.1 ka our record shows an abrupt shift to enhanced sea ice
in the western Labrador Sea was reduced during the last 2 cover and warmer bottom waters on the Labrador Shelf that
millennia compared to the mid-Holocene. In contrast, Moffa- corresponds to a shift from predominantly negative to pre-
Sánchez and Hall (2017) infer the opposite scenario for the dominantly positive NAO-like conditions. We associate the
last 2000 years with a stronger subpolar gyre (SPG) and in- cooling seen in surface waters with stronger north-westerly
tensified LSW formation during warmer eastern Labrador winds and harsher winters in the region during positive NAO,
Sea conditions (see Fig. 6h). The latter would be congruent while the warming in bottom waters was possibly related to
with the observations during more positive NAO conditions a stronger inflow of the westward retroflection of the WGC
resulting in stronger convection (e.g. Zantopp et al., 2017). in response to a stronger supply of the IC that was seen in the
Despite the ambiguous evidence of the coupling between central Labrador Sea. Our record implies that phases of en-
LC temperature and LSW formation, it appears that a colder hanced sea ice cover on the Labrador Shelf corresponded to
inner LC was coupled with a warmer and saltier IC and WGC reduced LC strength during the last 6000 years, which may
during the last 2100 years (see also discussion in Moffa- be have been related to atmospheric conditions controlling
Sánchez et al., 2019). This link can be explained by a reduced the length of the sea ice season as well as regulating the
LC strength – as more freshwater would have been locked up baroclinic pressure gradient that drives LC velocities. Dur-
in sea ice – resulting in a diminished supply of cold, Arctic ing the last 2100 years, a reduced current and diminished
waters into the North Atlantic Current (NAC), which, in turn, freshwater supply via the LC – as more freshwater would
would have led to a warmer IC. Nonetheless, it is currently have been locked up in sea ice – would have led to a di-
still difficult to assess whether hydrographic conditions in the minished supply of freshwater through the western route to
LC have had a significant impact on deep-water formation in the SPG, which, in turn, could have resulted in saltier and
the central basin or just responded to general atmospheric denser NAC and IC (Fig. 1). At the same time, intense cool-
conditions across the Labrador Sea region, which may have ing of dense SPG surface waters during generally positive
been the most important driver controlling LSW production NAO conditions would have promoted winter convection and
during the late Holocene. strengthened LSW formation in the central basin. Therefore,
Interestingly, Marchitto and deMenocal (2003) reported a it appears that positive NAO conditions may have been re-
significant Little Ice Age (LIA) cooling at intermediate wa- sponsible for both increased Labrador Shelf sea ice cover
ter depths along the path of the DWBC south of Newfound- during the last 2100 years and reduced freshwater supply
land, corresponding to the cooling seen in our subsurface and LC strength, while enhancing winter cooling and con-
water record from the Labrador Shelf (Fig. 6i). This cor- vection in the central Labrador Sea. The potential indirect
respondence might indicate a coupling between outer LC effect of enhanced sea ice cover and limited freshwater sup-
and DWBC temperature changes at a centennial timescale ply via the LC may thus have played an additional role in
with the LSW formation being the link between both wa- enabling deeper convection, forming colder and saltier LSW,
ter masses. However, overall short-term variability in DWBC a positive feedback mechanism during positive NAO condi-
temperatures during the last 4000 years does not exactly tions.
match our record (Fig. 6i). Therefore, to fully assess the in-
teraction between LC variability and LSW formation, more
high-resolution records of changes in LSW production from Data availability. The data reported in this pa-
the western Labrador Sea are required. per are archived in PANGAEA and available at
https://doi.org/10.1594/PANGAEA.904693 (Lochte et al., 2019b).
6 Conclusions
Author contributions. RS, JR and MK guided sediment and wa-
ter column sampling at sea on the RV Maria S. Merian. AAL per-
Overall, middle to late Holocene conditions in Labrador
formed the Mg/Ca and stable isotope sample preparation and estab-
Shelf waters display variability that can partly be related to lished the age model. TB performed the biomarker sample prepara-
atmospheric forcing, such as NAO-like conditions. Between tions and measurements. DGS led the ICP-OES measurements. NA
6.2 and 5.6 ka, our records imply a cold episode with strong performed the stable isotope measurements. AAL led the data com-
sea ice cover on the Labrador Shelf that has also been ev- pilation, interpretation and writing of the paper in discussions with
ident in other cores from the North Atlantic region. This RS, JR and MK. All co-authors contributed to improving the paper.
cold episode was followed by a generally warmer interval
from about 5.6 to 2.1 ka corresponding to a late Holocene
thermal maximum, interrupted by colder surface tempera- Competing interests. The authors declare that they have no con-
tures between about 4.5 and 3.5 ka. After about 3 ka, our flict of interest.
Clim. Past, 16, 1127–1143, 2020 https://doi.org/10.5194/cp-16-1127-2020A. A. Lochte et al.: Surface and subsurface Labrador Shelf water mass conditions 1139
Acknowledgements. We wish to thank the captain and crew of Blanz, T., Emeis, K. C., and Siegel, H.: Controls on alkenone unsat-
the RV Maria S. Merian as well as the scientific team for their great uration ratios along the salinity gradient between the open ocean
help during the MSM45 cruise. We thank Karen Bremer and Sil- and the Baltic Sea, Geochim. Cosmochim. Ac., 69, 3589–3600,
via Koch for technical assistance with the ICP-OES and biomarker https://doi.org/10.1016/j.gca.2005.02.026, 2005.
analyses, respectively. Böning, C. W., Scheinert, M., Dengg, J., Biastoch, A., and Funk,
A., Decadal variability of subpolar gyre transport and its rever-
beration in the North Atlantic overturning, Geophys. Res. Lett.,
Financial support. This study was supported by a PhD fellow- 33, 21, https://doi.org/10.1029/2006GL026906, 2006.
ship to Annalena A. Lochte through the Helmholtz Research Bond, G., Showers, W., Cheseby, M., Lotti, R., Almasi, P.,
School on Ocean System Science and Technology at the GEOMAR deMenocal, P., Priore, P., Cullen, H., Hajdas, I., and Bo-
Helmholtz Centre for Ocean Research Kiel (grant no. VH-KO-601) nani, G.: A pervasive millennial-scale cycle in North At-
and Kiel University. lantic Holocene and glacial climates, Science, 278, 1257–1266,
https://doi.org/10.1126/science.278.5341.1257, 1997.
Bond, G., Kromer, B., Beer, J., Muscheler, R., Evans, M.
Review statement. This paper was edited by Bjørg Rise- N., Showers, W., Hoffmann, S., Lotti-Bond, R., Hajdas, I.,
brobakken and reviewed by three anonymous referees. and Bonani, G.: Persistent solar influence on North At-
lantic climate during the Holocene, Science, 294, 2130–2136,
ttps://doi.org/10.1126/science.1065680, 2001.
Brassell, S. C., Eglinton, G., Marlowe, I. T., Pflaumann,
References U., and Sarnthein, M.: Molecular stratigraphy: a new
tool for climatic assessment, Nature, 320, 129–133,
Aebly, F. A. and Fritz, S. C.: Palaeohydrology of Kanger- https://doi.org/10.1038/320129a0, 1986.
lussuaq (Søndre Strømfjord), west Greenland dur- Briner, J. P., Stewart, H. A. M., Young, N. E., Philipps, W., and
ing the last ∼ 8000 years, Holocene, 19, 91–104, Losee, S.: Using proglacial-threshold lakes to constrain fluc-
https://doi.org/10.1177/0959683608096601, 2009. tuations of the Jakobshavn Isbræ ice margin, western Green-
Alley, R. B., Clark, P. U., Keigwin, L. D., and Webb, R. S.: land, during the Holocene, Quaternary Sci. Rev., 29, 3861–3874,
Making sense of millennial-scale climate change, Geophysical https://doi.org/10.1016/j.quascirev.2010.09.005, 2010.
Monograph-American Geophysical Union, 112, 385–394, 1999. Briner, J. P., Kaufman, D. S., Bennike, O., and Kosnik, M. A.:
Andresen, C. S., Björck, S., Bennike, O., and Bond, G.: Amino acid ratios in reworked marine bivalve shells constrain
Holocene climate changes in southern Greenland: evidence Greenland Ice Sheet history during the Holocene, Geology, 42,
from lake sediments, J. Quaternary Sci., 19, 783–795, 75–78, https://doi.org/10.1130/G34843.1, 2014.
https://doi.org/10.1002/jqs.886, 2004. Chivall, D., M’Boule, D., Sinke-Schoen, D., Sinninghe Damsté,
Andresen, C. S., McCarthy, D. J., Valdemar Dylmer, C., Sei- J. S., Schouten, S., and van der Meer, M. T. J.: The ef-
denkrantz, M. S., Kuijpers, A., and Lloyd, J. M.: Interaction fects of growth phase and salinity on the hydrogen iso-
between subsurface ocean waters and calving of the Jakob- topic composition of alkenones produced by coastal hap-
shavn Isbræ during the late Holocene, Holocene, 21, 211–224, tophyte algae, Geochim. Cosmochim. Ac., 140, 381–390,
https://doi.org/10.1177/0959683610378877, 2011. https://doi.org/10.1016/j.gca.2014.05.043, 2014.
Austermann, J., Mitrovica, J. X., Latychev, K., and Milne, G. A.: Clarke, R. A. and Gascard, J.-C.: The formation of Labrador
Barbados-based estimate of ice volume at Last Glacial Max- Sea water. Part I: Large-scale processes, J. Phys.
imum affected by subducted plate, Nat. Geosci., 6, 553–557, Oceanogr., 13, 1764–1778, https://doi.org/10.1175/1520-
https://doi.org/10.1038/ngeo1859, 2013. 0485(1983)0132.0.CO;2, 1983.
Axford, Y., Losee, S., Briner, J. P., Francis, D. R., Lang- Cléroux, C., Debret, M., Cortijo, E., Duplessy, J. C., Dewilde, F.,
don, P. G., and Walker, I. R.: Holocene temperature his- Reijmer, J., and Massei, N.: High-resolution sea surface recon-
tory at the western Greenland Ice Sheet margin recon- structions off Cape Hatteras over the last 10 ka, Paleoceanogr.
structed from lake sediments, Quaternary Sci. Rev., 59, 87–100, Paleocl., 27, https://doi.org/10.1029/2011PA002184, 2012.
https://doi.org/10.1016/j.quascirev.2012.10.024, 2013. Conte, M. H., Thompson, A., Eglinton, G., and Green, J.
Barrientos, N., Lear, C. H., Jakobsson, M., Stranne, C., C.: Lipid biomarker diversity in the coccolithophorid
O’Regan, M., Cronin, T. M., Gukov, A. Y., and Coxall, Emiliania huxleyi (Prymnesiophyceae) and the related
H. K.: Arctic Ocean benthic foraminifera Mg/Ca ratios and species Gephyrocapsa oceanica, J. Phycol., 31, 272–282,
global Mg/Ca temperature calibrations: New constraints at https://doi.org/10.1111/j.0022-3646.1995.00272.x, 1995.
low temperatures, Geochim. Cosmochim. Ac., 236, 240–259, Cuny, J., Rhines, P. B., Niiler, P. P., and Bacon, S.: Labrador
https://doi.org/10.1016/j.gca.2018.02.036, 2018. Sea boundary currents and the fate of the Irminger Sea Water,
Bendle, J. and Rosell-Melé, A.: Distributions of UK37 and UK370 J. Phys. Oceanogr., 32, 627–647, https://doi.org/10.1175/1520-
in the surface waters and sediments of the Nordic Seas: Impli- 0485(2002)0322.0.CO;2, 2002.
cations for paleoceanography, Geochem. Geophy. Geosy., 5, 11, Deser, C., Walsh, J. E., and Timlin, M. S.: Arctic sea ice
https://doi.org/10.1029/2004GC000741, 2004. variability in the context of recent atmospheric circulation
Bendle, J., Rosell-Mele, A., and Ziveri, P.: Variability of trends, J. Climate, 13, 617–633, https://doi.org/10.1175/1520-
unusual distribution of alkenones in the surface wa- 0442(2000)0132.0.CO;2, 2000.
ters of the Nordic seas, Paleoceanography, 20, PA2001,
https://doi.org/10.1029/2004PA001025, 2005.
https://doi.org/10.5194/cp-16-1127-2020 Clim. Past, 16, 1127–1143, 2020You can also read