Rising Seas and Storms Could Seriously Damage California's Coast within 30 Years: USGS Sound Waves
←
→
Page content transcription
If your browser does not render page correctly, please read the page content below
https://soundwaves.usgs.gov/

Cover Story

Rising Seas and Storms Could Seriously Damage California’s Coast within 30 Years:
Coastal flooding could impact about 150,000 residents and more than $30 billion in property value by the 2040s
By Rex Sanders

   In less than 30 years the combination of        mate change on the California coast,”          cost of the 1989 Loma Prieta earthquake in
10 inches of sea-level rise plus an extreme        said USGS research geologist Patrick           California (https://earthquake.usgs.gov/
storm along California’s coast could flood         Barnard, lead author of the paper. “It’s       earthquakes/events/1989lomaprieta/),
more than 150,000 residents and impact             not just sea-level rise associated with        and comparable to Hurricane Katrina’s
over $30 billion in property value. By             climate change that we need to consider,       $127 billion in destruction (https://www.
2100, when the oceans could be 6.6 feet            but also the combination of that with the      weather.gov/jetstream/katrina).
higher, up to 600,000 people and $150              storms we experience along the coast.”            And the actual damages could be signif-
billion in property could be at risk from             Most climate-change scenarios forecast      icantly larger. The forecasts don’t include
coastal flooding—potentially worse than            10 inches of sea-level rise in California      possible failures of levees, sea walls, and
Hurricane Katrina in destruction.                  within 30 years. At every high tide, that      similar shoreline protection. This study
   USGS scientists and collaborators               could flood areas where 37,000 people live     also doesn’t account for the ripple effects
combined sea-level rise scenarios, climate-        and 13,000 people work, exposing $8 bil-       from damaged ports, roads, sewage-treat-
change forecasts, and economic and social          lion worth of property to damage. Add a        ment plants, and other critical coastal in-
data to show the dollars and lives that            “100-year storm,” with a 1 percent chance      frastructure. “You quickly see how this can
could soon be at risk in California. Their         of happening every year, and the num-          have impacts beyond the coastal commu-
analyses focused on highly developed               bers jump to 155,000 residents, 86,000         nities experiencing direct flooding,” said
seashore counties in Southern California           employees, and $32 billion of real estate.     Juliette Finzi Hart, a USGS oceanogra-
and the San Francisco Bay area, which              Emergency managers often use 100-year          pher and co-author on the journal article.
include 95 percent of the state’s coastal          storms for planning purposes.                     Barnard and his colleagues started
population. The journal Scientific Reports            Coastal flooding from a combination of      building the detailed Coastal Storm
recently published these peer-reviewed             sea-level rise and storms is an economic       Modeling System (CoSMoS, https://www.
findings (see https://doi.org/10.1038/             threat similar to some of the nation’s         usgs.gov/centers/pcmsc/science/coastal-
s41598-019-40742-z).                               costliest disasters to date. The potential     storm-modeling-system-cosmos) several
   “This study is unique in that we’ve             economic impacts in these forecasts are        years ago to forecast the effects of coastal
looked at the complete impacts of cli-             many times higher than the $10 billion
                                                                                                             (California’s Coast continued on page 2)

                                                                                Forecast of potential California coastal flood risks in the 2040s
                                                                                after 10 inches (25 centimeters) of sea-level rise and an extreme
Waves flood across a coastal road near Santa Cruz, California. Photo credit:    “100-year” storm with a 1 percent chance of happening each
Amy Foxgrover, USGS.                                                            year. Image credit: Rex Sanders, USGS.
U.S. Department of the Interior                                                                          Sound Waves   Volume FY 2019, Issue No. 184
U.S. Geological Survey                                                                                                              Feb. - Mar. 2019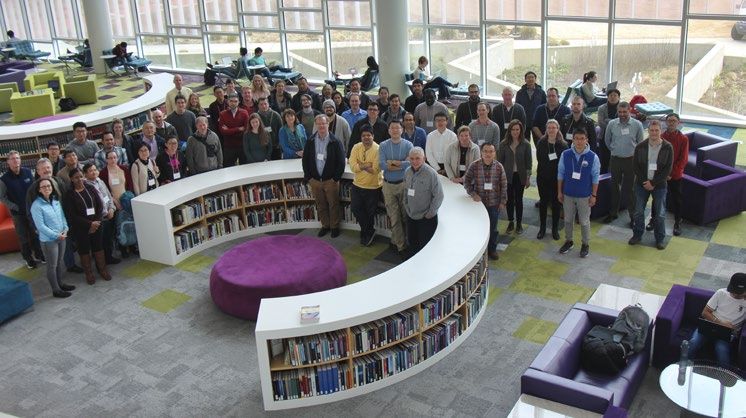
Sound Waves                       Cover Story, continued
                        Editor                       (California’s Coast continued from page 2)
                   Jolene Gittens
               St. Petersburg, Florida
              Telephone: 727-502-8038
             E-mail: jgittens@usgs.gov
                  Fax: 727-502-8182
                 Assistant Editor
                  Laura Torresan
              Santa Cruz, California
             Telephone: 831-460-7468
            E-mail: ltorresan@usgs.gov
                Fax: 831-427-4748
             Print & Web Layout Editor
                    Betsy Boynton
                St. Petersburg, Florida
               Telephone: 727-502-8118
       E-mail: bboynton@contractor.usgs.gov
                  Fax: (727) 502-8182
   SOUND WAVES (WITH ADDITIONAL LINKS) IS
          AVAILABLE ONLINE AT URL
         https://soundwaves.usgs.gov/

   Contents
                                                     Potential impacts to California coastal property values compared to the economic damage from
   Cover Story                                  1
                                                     other disasters. Image credit: Rex Sanders, USGS.
   News Briefs                                  3
   Research                                     7    storms on top of sea-level rise. Soon they            Philip Gibbons, program manager for
   Fieldwork                                    9    partnered with scientists and developers           Energy and Sustainability at the Port of
   Meetings                                    10    at Point Blue Conservation Science                 San Diego (https://www.portofsandiego.
   Staff and Center News                       12    (https://www.pointblue.org/) to release            org/) uses CoSMoS data to understand
   Social Media Highlights                     13    the data in an easier-to-use form through          threats to port assets. “We are also utiliz-
   Publication                                 18    the Our Coast, Our Future (OCOF, http://           ing the flood depth and duration data to
                                                     ourcoastourfuture.org/) web site.                  properly ‘tell the story’ of what future
                                                                                                                   (California’s Coast continued on page 3)
   Submission Guidelines
   Deadline: The deadline for news items and
   publication lists for the 185th issue of Sound
   Waves is Wednesday, April 17, 2019.
   Publications: When new publications or
   products are released, please notify the editor
   with a full reference and a bulleted summary
   or description.
   Images: Please submit all images at publica-
   tion size (column, 2-column, or page width).
   Resolution of 200 to 300 dpi (dots per inch)
   is best. Adobe Illustrator© files or EPS files
   work well with vector files (such as graphs or
   diagrams). TIFF and JPEG files work well with
   raster files (photographs or rasterized vec-
   tor files).
   Any use of trade, firm, or product names is for
   descriptive purposes only and does not imply
   endorsement by the U.S. Government.

   U.S. Geological Survey
   Earth Science Information Sources:
   Need to find natural-science data or
   information? Visit the USGS Frequently Asked
   Questions (FAQ’s) at URL
   https://www.usgs.gov/faq/
   Can’t find the answer to your question on
   the Web? Call 1-888-ASK-USGS
                                                     Pale blue and green areas could be flooded in this screen shot from the Our Coast, Our Future web
   Want to send your question to the USGS?
   Fill out the form here: https://answers.usgs.
                                                     site (http://ourcoastourfuture.org/), showing a flood-forecast map for the southern San Francisco
   gov/cgi-bin/gsanswers?tmplt=4                     Bay Area with 10 inches (25 centimeters) of sea-level rise and a “100-year” storm with a 1 percent
                                                     chance of happening each year. Image credit: Our Coast, Our Future.

Feb. - Mar. 2019 Sound Waves                                                  2                                                                Cover Story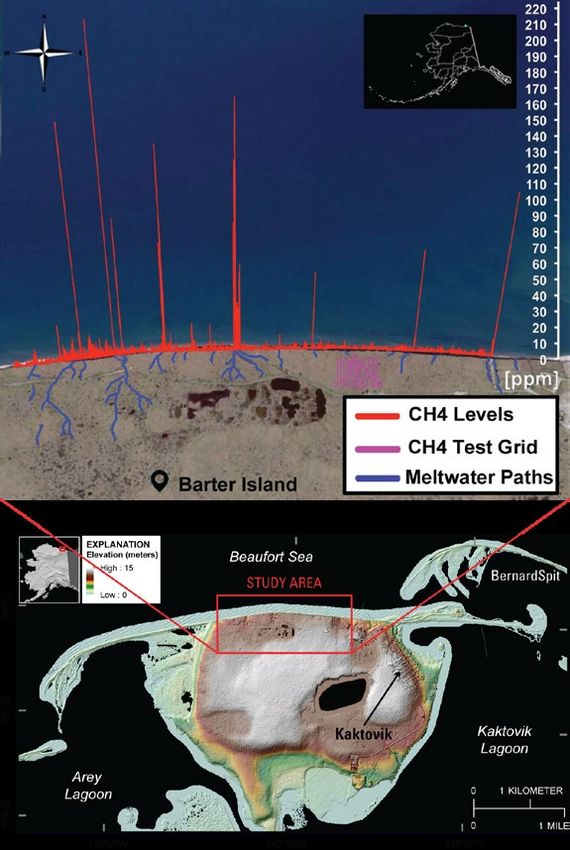
Cover Story, continued
(California’s Coast continued from page 2)
impacts sea-level rise will have within our
jurisdiction,” he said.
The OCOF maps succeeded in bring-
ing this information to many government
officials and coastal residents. But the
team soon realized that the web site did
not show the full impacts of coastal flood-
ing or meet everyone’s needs. “We weren’t
reaching a wide enough audience,” said
Barnard. “Policy people need to know
the dollars and lives affected.” So he
reached out to Nathan Wood, a USGS
research geographer.
“We added the number of residents and
employees in a town that could be impact-
ed by a certain scenario,” said Wood. “We
get into demographics, types of businesses,
and infrastructure.” His group created the
Hazard Exposure Reporting and Analytics
(HERA, https://www.usgs.gov/apps/
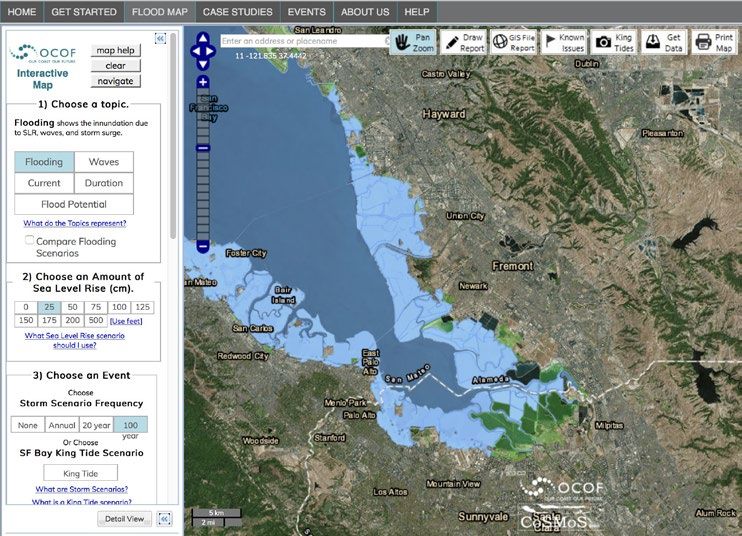
hera/), an interactive online dashboard that Screen shot of the Hazard Exposure Reporting and Analytics (HERA, https://www.usgs.gov/apps/
hera/) web site showing southern San Francisco Bay Area flooding and building replacement value
lets someone pick the community and haz-
impact forecasts with 10 inches (25 centimeters) of sea-level rise plus a storm expected every
ard scenario, then explore potential popula- year. Image credit: USGS.
tion, economic, land-cover, and infrastruc-
ture vulnerabilities. Translating scientific (http://www.santamonicabay.org/) in at https://doi.org/10.1038/s41598-019-
data into accessible, vusable, and relevant Los Angeles. “The maps and visualiza- 40742-z. Researchers from the USGS,
information helped many more California tions have been particularly helpful for the Coastal Carolina University (https://
coastal planners and residents. public to envision impacts to our coastal www.coastal.edu/), Deltares (https://
“CoSMoS, OCOF, and HERA are inte- areas and start conversations about adapta- www.deltares.nl/en/), the University of
gral tools in The Bay Foundation’s adap- tion and mitigation.” Illinois at Chicago (https://www.uic.
tive management planning for our coastal The new paper titled “Dynamic flood edu/), and Point Blue Conservation Sci-
resources,” said Karina Johnston, sci- modeling essential to assess the coastal ence (https://www.pointblue.org/) col-
ence director at The Bay Foundation impacts of climate change,” is available laborated on this study.
News Briefs
Sound Waves News Briefs
Edited by Rex Sanders • Feb. - Mar. 2019
}} M5.5 Earthquake: a Bump in the Night March 15—Just before 1 AM on (roughly 7 miles) south-southeast of
Toward More Typical Seismic Background March 13, 2019, houses in east Hawai`i Volcano Village. Earthquakes at this
began to shake. To those who endured location and depth in Hawai‘i are due
the near-daily shaking from last sum- to movement along a decollement or
mer’s collapse events at Kīlauea’s detachment fault which separates the top
summit, this week’s earthquake was of the original oceanic crust from the
clearly different. Geophysicists from pile of volcanic rock that has built up to
the USGS Hawaiian Volcano Observa- form the Island of Hawai`i. This is the
tory quickly verified that the earthquake same fault that was responsible for last
did not originate from beneath Kīlauea May’s M6.9 earthquake. More: https://
Volcano’s summit region. Rather, the volcanoes.usgs.gov/observatories/hvo/
earthquake was centered 12 kilometers hvo_volcano_watch.html?vwid=1403
(News Briefs continued on page 4)
Cover Story / News Briefs 3 Sound Waves Feb. - Mar. 2019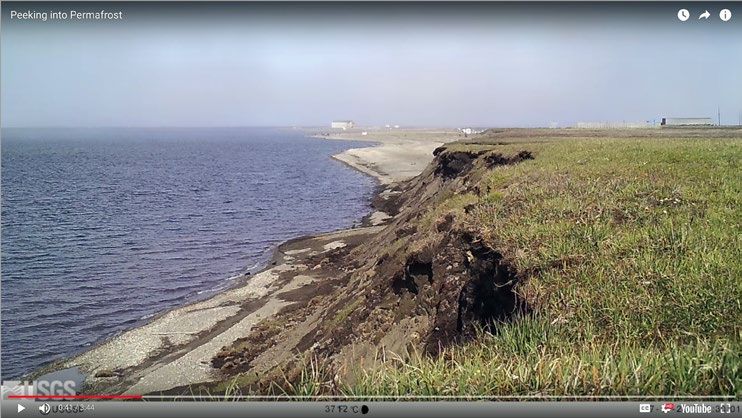
News Briefs, continued
(News Briefs continued from page 3)
                                                  March 7—Eruption rate (how much             threats to better inform landscape-scale
}} New USGS-led Research Helps                 lava comes out of the ground per unit          decisions. The species distribution data
California Coastal Managers Prioritize         time) is probably the best measure of          was created by modeling the predicted
Planning and Mitigation Efforts Due to         volcanic activity, and the first step in       habitat of each of 1,600 terrestrial verte-
Rising Seas and Storms                         that calculation is to measure lava flow       brate species. Land managers and policy
                                               thickness and area. During the first few       makers can use this data to make better-
                                               years of Kīlauea Volcano’s Pu‘u ‘Ō‘ō           informed decisions when identifying pri-
                                               eruption, episodic high lava fountains         ority areas or species for conservation.
                                               produced multiple lava flows. The flow         More: https://www.usgs.gov/news/new-
                                               volume was then calculated as the prod-        species-habitat-distribution-maps-
                                               uct of the flow area multiplied by the         now-support-conservation-planning-
                                               average flow thickness. The eruption           a-national-scale
                                               rate equaled this volume divided by
                                               the duration of the eruption in seconds.       }} Oceanographer Presents USGS Coast-
                                               When corrected for voids in the lava and       al Flood Forecasting Tool
                                               divided by the duration of the eruption,
                                               this yields a minimum eruption rate of
                                               about 50–200 cubic meters (13,000–
                                               53,000 gallons) per second. This erup-
   March 13—New USGS-led coastal               tion rate is significantly larger than
modeling research presents state, federal,     most, if not all, known Kīlauea eruption
and commercial entities with varying           rates. More: https://volcanoes.usgs.gov/
storm and sea level-rise scenarios to as-      observatories/hvo/hvo_volcano_watch.
sist with planning for future infrastructure   html?vwid=1402
and mitigation needs along the California
coast. This is the first study to examine      }} New Species Habitat Distribution
a combination of the effects related to a      Maps Now Support Conservation Plan-               March 1—Oceanographer Juliette
changing climate on the California coast.      ning at a National Scale                       Finzi Hart of the USGS Pacific Coastal
“It’s not just sea level rise that we need                                                    and Marine Science Center was in-
to consider when assessing the impacts                                                        vited by the California Department of
of climate change, but it is also the com-                                                    Transportation (Caltrans) to provide an
bination of sea level rise with storms and                                                    overview of the USGS Coastal Storm
every daily high tide we experience along                                                     Modeling System (CoSMoS) at the
the coast,” said USGS research geologist                                                      2019 California Transportation Plan-
Patrick Barnard, lead author of the paper.                                                    ning Conference in San Diego. CoSMoS
More: https://www.usgs.gov/news/new-                                                          forecasts coastal flooding under a range
us-geological-survey-led-research-helps-                                                      of storm intensities and sea-level rise
california-coastal-managers-prioritize-                                                       scenarios. Finzi Hart’s presentation,
planning-and                                                                                  “Visualizing Our Coast Under a Chang-
                                                                                              ing Climate,” showed how CoSMoS
}} How Is Lava Flow Thickness Measured            March 6—A new dataset of habitat            can be used to support local, regional,
and Why Does It Matter?                        distribution for terrestrial vertebrate spe-   and statewide transportation planning
                                               cies in the conterminous United States         in coastal regions. She focused on the
                                               is now available from the USGS. This           CoSMoS team’s work with partners to
                                               habitat distribution and species range         make USGS data easily accessible and
                                               information is a foundational data set for     understandable. The conference helps
                                               the USGS National Biogeographic Map,           transportation decision-makers exchange
                                               which is being developed to make bio-          ideas and learn about emerging trends
                                               diversity data and analytical tools more       and advancements in transportation
                                               widely available to land managers and          planning from national, state, and local
                                               decision makers. These data and tools          experts. More: https://www.usgs.gov/
                                               will provide robust scientific character-      center-news/oceanographer-presents-
                                               ization of species and habitats and the        usgs-coastal-flood-forecasting-tool
                                               associated conservation protections and
                                                                                                             (News Briefs continued on page 5)

Feb. - Mar. 2019 Sound Waves                                        4                                                             News Briefs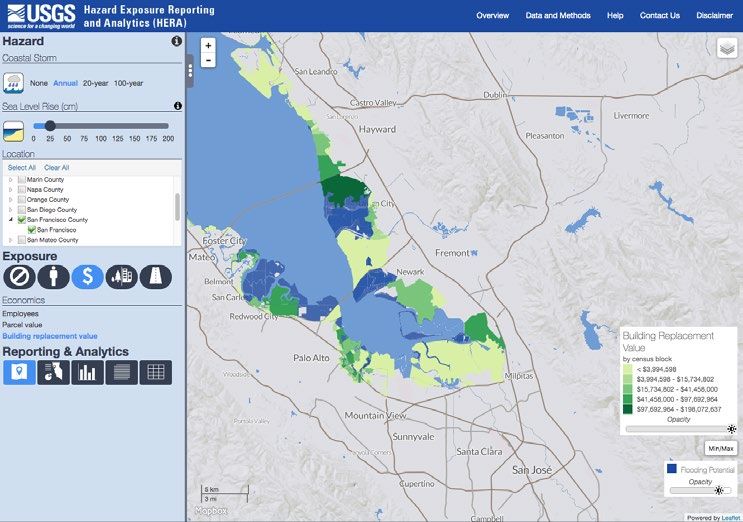
News Briefs, continued
(News Briefs continued from page 4)
                                               floor along the south and west shores of       }} Ecosystem Responses to Dam Removal
}} USGS Geologist Discusses Erosion at         Martha’s Vineyard and the north shore of       Complex, But Predictable
Fort Funston for ABC7 News Segment on          Nantucket, Massachusetts, were produced
Landslide Fatality                             by using high-resolution geophysical data,
                                               sediment samples, and bottom photo-
                                               graphs. These interpretations are intended
                                               to aid statewide efforts to inventory and
                                               manage coastal and marine resources,
                                               link with existing data interpretations, and
                                               provide information for research focused
                                               on coastal evolution and environmental
                                               change. Marine geologic mapping of the
                                               inner continental shelf of Massachusetts
                                               is a statewide cooperative effort of the
                                               USGS and the Massachusetts Office of              February 20—In the U.S., the removal
                                               Coastal Zone Management. More: https://        of dams now outpaces the construction of
                                               www.usgs.gov/center-news/marine-               new ones—with more than 1,400 dams
   March 1—On Monday, February 25,             geologic-maps-inner-continental-shelf-         decommissioned since the 1970s—and
2019, research geologist Jonathan War-         massachusetts-where-science-meets-art          a new study suggests that the ecosystem
rick of the USGS Pacific Coastal and                                                          effects of dam removal can be predicted.
Marine Science Center spoke with ABC7          }} Agencies Meet to Discuss Exploration        Managers and dam-removal practitioners
News about a February 22 landslide that        of Deep-water Areas Off U.S. West Coast        can use the study’s models to gauge the
injured one woman and buried another                                                          potential range of ecological responses to
at San Francisco’s Fort Funston beach.                                                        dam removal and the most likely future
Warrick leads a project that analyzed                                                         conditions. “This research expands our
historical aerial photographs to measure                                                      conceptual understanding and improves
cliff change at Fort Funston from 2002                                                        our ability to predict response to future
to 2010. He described USGS research on                                                        dam removals,” said Jill Baron, co-
rates of cliff erosion and why they are                                                       director of the USGS John Wesley Powell
higher at Fort Funston. The interview                                                         Center for Analysis and Synthesis, which
was used in an evening news segment                                                           sponsored the work. More:
and an online article posted later that day.                                                  https://www.fs.usda.gov/pnw/news-
More: https://www.usgs.gov/center-                February 21—Core players in “Expand-        releases/ecosystem-responses-dam-
news/usgs-geologist-discusses-erosion-         ing Pacific Research and Exploration of        removal-complex-predictable
fort-funston-abc7-news-segment-                Submerged Systems” (EXPRESS) held a
landslide-fatality                             planning workshop at the USGS Pacific          }} Why Do Some Hawai‘i Earthquakes Oc-
                                               Coastal and Marine Science Center in           cur So Far Offshore?
}} Marine Geologic Maps of the Inner           Santa Cruz, California, November 29–30.
Continental Shelf of Massachusetts,            EXPRESS is an interagency effort to study
Where Science Meets Art                        deep-water areas off California, Oregon,
                                               and Washington. NOAA, USGS, and the
                                               Bureau of Ocean Energy Management
                                               initiated the project, and the Monterey Bay
                                               Aquarium Research Institute has joined
                                               the effort. Information they collect will
                                               guide decisions about managing fisheries
                                               and offshore energy and mineral resources,
                                               and inform offshore earthquake, landslide,
                                               tsunami, and nautical hazard assessment.
                                               Participants discussed objectives, refined        February 14—Many of the earthquakes
                                               priorities for future work, and reviewed ac-   in Hawaii that extend offshore and up the
   February 27—A series of interpretive        complishments to date. More: https://www.      island chain are due to plate bending, or
maps that describe the shallow geology,        usgs.gov/center-news/agencies-meet-            flexure. Earthquakes in Hawaii are inti-
distribution, and texture of sea-floor sedi-   discuss-exploration-deep-water-areas-          mately related to the volcanoes. In addition
ments, and physiographic zones of the sea      us-west-coast                                                 (News Briefs continued on page 6)

News Briefs                                                         5                                           Sound Waves Feb. - Mar. 2019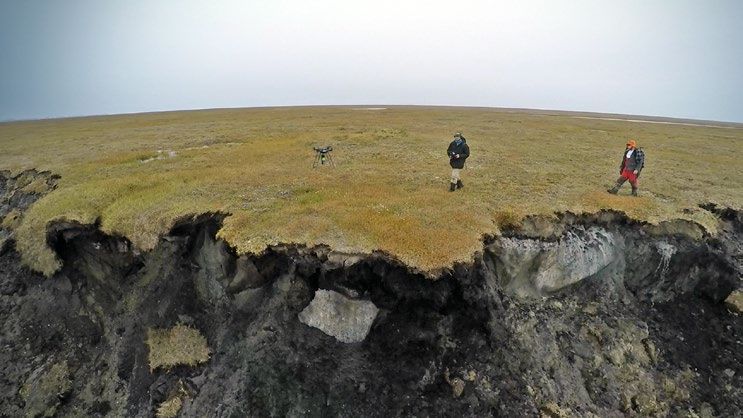
News Briefs, continued
(News Briefs continued from page 5)
}} Magnitude 4.6 Earthquake Southwest of Today, authors Erin Bessette-Kirton and col-
to helping scientists track moving magma, the Island of Hawai‘i leagues write that “the number of landslides
sometimes they happen simply because the that occurred during this event was two orders
earth under the island chain gets bent out of of magnitude greater than those reported from
shape. The massive Island of Hawai‘i pro- previous hurricanes.” The authors, from the
duces the largest force on the lithosphere USGS and the University of Puerto Rico,
due to its relatively young age. It results in evaluate the extent and characteristics of
a raised bulge that extends around O‘ahu Maria-induced landslides throughout Puerto
about 300 km away. This is why earth- Rico. They show that the average rainfall
quakes occasionally happen so far from the from Hurricane Maria in mountainous areas
main area of seismic and volcanic activity was greater than that of any other hurricane
on the Island of Hawai‘i. More: https:// or tropical storm in Puerto Rico since 1960.
volcanoes.usgs.gov/observatories/hvo/ More: http://www.geosociety.org/GSA/
hvo_volcano_watch.html?vwid=1399 News/pr/2019/19-03.aspx
}} Interactive Tool Explores Fish Use of February 7—The USGS Hawaiian Vol- }} New Products Provide an Interactive
Eelgrass in Puget Sound cano Observatory recorded an offshore Guide to Global and Regional Sea Level
magnitude 4.6 earthquake southwest of the Rise Scenarios for the United States
Island of Hawai‘i on Thursday, February
7, at 9:07 a.m., HST. The earthquake was
centered about 52 miles southwest of Ka
Lae (South Point) at a depth of 17 miles.
Light shaking has been reported across
the Islands of Hawai‘i, Maui, and O‘ahu.
The depth, location, and recorded seismic
waves of the earthquake suggest a source
due to bending of the oceanic plate from
the weight of the Hawaiian island chain,
a common source for earthquakes in this
area. The earthquake caused no detect-
able changes to Kīlauea or Mauna Loa
volcanoes on the Island of Hawai‘i. More: February 7—USGS researchers an-
https://volcanoes.usgs.gov/observatories/ nounce the release of two products that
February 14—The degree to which eel- hvo/press_releases.html?prid=138 provide a new way to visualize 2017 sea-
grass on river deltas provides critical habitat level rise scenarios originally generated
for estuarine fishes, especially outmigrating }} Landslides Triggered by Hurricane for the National Climate Assessment. The
juvenile salmon, is an important scientific Maria Sea-Level Change Data Viewer provides
and management issue in the Puget Sound. access to the sea-level rise scenarios at
Now, in collaboration with the USGS tide gauge locations throughout the U.S.
Texas Water Science Center, a data visu- The Sea Level Change Geo-narrative pro-
alization tool (https://webapps.usgs.gov/ vides important context for understanding
pugetsound/eelgrass) has been developed the scenarios. “This effort provides users
to allow users to interactively explore fish with information and a tool to visualize,
abundance and body size including select- interact with, and explore the data,” said
ing any desired combination of location and Erika Lentz, a USGS research geologist.
time period. The tool takes into account en- More: https://www.usgs.gov/center-news/
vironmental effects on the distribution and new-products-provide-interactive-
abundance of these species. The application guide-global-and-regional-sea-level-
also includes temperature, salinity, depth rise-scenarios
and supporting data layers that allow users For all USGS Coastal/Marine Hazards
to consider how diking and river channel- February 7—Hurricane Maria hit the is- and Resources Program news:
ization potentially influenced eelgrass use land of Puerto Rico on 20 September 2017 https://www.usgs.gov/natural-hazards/
by these fish. More: https://www.usgs.gov/ and triggered more than 40,000 landslides coastal-and-marine-geology/news
center-news/western-fisheries-science- in at least three-fourths of Puerto Rico’s 78 For all USGS news:
news-february-2019-issue-72 municipalities. In a new article from GSA https://www.usgs.gov/news.
Feb. - Mar. 2019 Sound Waves 6 News Briefs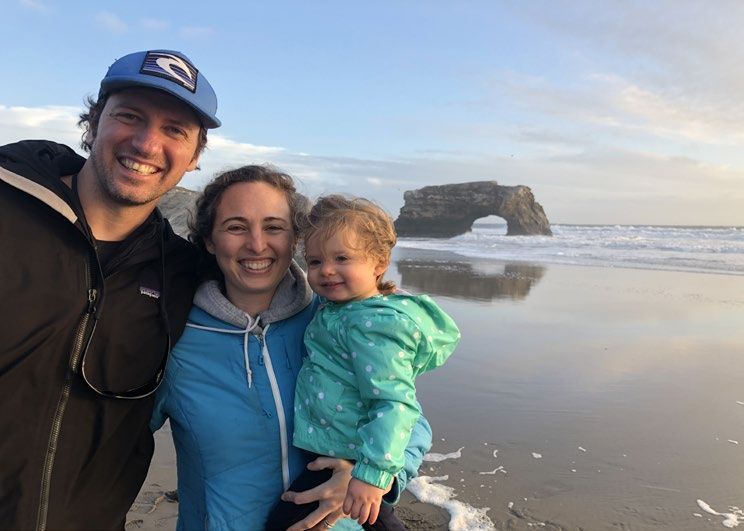
Research
Research, continued

USGS Uses Drone to Measure Methane Escaping from Arctic Permafrost:
Low-Cost Method Fills Gap in Detection Techniques
By: Helen Gibbons

   The USGS has developed a low-cost
technique for making detailed measure-
ments of methane escaping from thawing
permafrost in coastal Arctic bluffs. The
technique uses off-the-shelf components
mounted on an unmanned aerial system
(UAS, a.k.a. drone). In September 2017,
USGS scientists collected data along a mile
and a quarter of coastal bluffs on Barter Is-
land, Alaska, to test the system. The results
revealed spots where methane release was
particularly high—methane “hotspots”—
that appear to be associated with zones of
accelerated erosion, the focus of the USGS
project (https://www.usgs.gov/centers/
pcmsc/science/climate-impacts-arctic-
coasts) that developed the new technique.
                                                Coastal bluffs on Barter Island, Alaska. Screenshot from video “Peeking into Permafrost” (https://
   Project scientists describe the drone set-
                                                www.usgs.gov/media/videos/peeking-permafrost) by USGS contractor Amy West.
up and the Barter Island test in “Towards
determining spatial methane distribution
on Arctic permafrost bluffs with an
unmanned aerial system,” published Feb-
ruary 2019 in Springer Nature Applied
Sciences (https://doi.org/10.1007/s42452-
019-0242-9).
   Methane is a powerful greenhouse gas,
so many groups have been trying to deter-
mine how much escapes from the land and
the sea into the atmosphere. They typically
rely on satellite imagery, data from sensors
on manned aircraft, and samples collected
on the ground.
   “Methane measurements, up until now,
have been reserved to large research in-
stitutions, government agencies, and so
on, because they’re extremely costly—
hundreds of thousands of dollars,” says
                                                Ferdinand Oberle (left) and Cordell Johnson pilot the USGS methane-detection system during ini-
Ferdinand Oberle, USGS Mendenhall
                                                tial test flights on top of Barter Island’s coastal bluffs. Photo by second drone equipped with video
Research Fellow and designer of the             camera but no methane sensor.
new methane-measurement technique.
The USGS system costs much less—ap-             As the drone flies along the coast, it takes         Pacific Coastal and Marine Science
proximately $2,500 for a month of use or        measurements every tenth of a second,                Center (https://www.usgs.gov/centers/
$14,000 for a permanent purchase.               or about every 10 inches at typical flight           pcmsc). He shot the laser through gas-
   “It opens the door,” says Oberle, allow-     speeds. “There is no study out there, so             fillable spectrophotometric cells that
ing “any organization, any person really,       far, that has identified methane at that spa-        were flooded with known quantities of
to do repeated studies at low cost, each        tial scale in a permafrost environment,”             methane. These quantities were then
year, to see how [the pattern of methane        says Oberle.                                         compared to the laser’s readings. The
release] changes in coastal environments.”         Prior to field tests, Oberle examined             experiments proved that the methane
   In addition to its low cost, the new         and calibrated the methane laser in con-             sensor had the necessary accuracy and
system collects unusually detailed data.        trolled lab experiments at the USGS                                (Drone in Arctic continued on page 8)

Research                                                                7                                                Sound Waves Feb. - Mar. 2019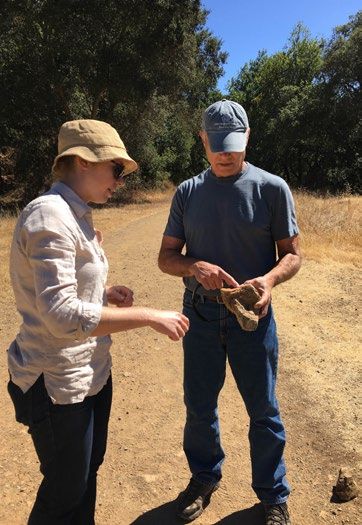
Research, continued
(Drone in Arctic continued from page 7)

Sources of methane escaping from Arctic environments into the
atmosphere. Methane measured in the September 2017 test likely
came from microbial breakdown of organic matter in gullies that
cut into the permafrost (source 1). Other important sources are
deep geologic deposits underlying the permafrost (source 2) and
offshore methane hydrate (https://www.usgs.gov/faqs/what-are-
gas-hydrates), an ice-like combination of methane gas and water
that is stable at low temperatures and moderate pressures (source
3). Image credit: Ferdinand Oberle, USGS.

                                                                      Top: Methane measurements (red) reveal hotspots (peaks) aligned with ma-
                                                                      jor melt-water pathways (blue lines) in coastal permafrost bluffs on Barter
                                                                      Island, Alaska. Pink grid is where researchers conducted test flights above
                                                                      intact permafrost with relatively constant methane levels. Bottom: Map of
                                                                      Barter Island showing location of study area. Image credit: USGS.

Elements of the USGS methane-detection system (clockwise from
upper left): methane sensor, microcomputer running Android open-
source operating system, drone with sensor mounted beneath
body of drone and leg extensions to protect it, sensor mount, and
anti-vibration mount. Image credit: Ferdinand Oberle, USGS.

sensitivity to changing methane levels to         dramatically changing environments in the      (https://doi.org/10.3133/ofr20171107).
warrant the field test on thawing Arctic          world. Some of their previous work, led        The researchers—along with collabora-
permafrost.                                       by Ann Gibbs, Li Erikson, and Bruce            tors at the USGS Alaska Science Center
  Oberle and his co-authors from the              Richmond, shows that erosion is generally      (https://www.usgs.gov/centers/asc/)—aim
USGS Pacific Coastal and Marine Sci-              increasing along Alaska’s north coast (see     to determine the dominant forces behind
ence Center study erosion along the               https://soundwaves.usgs.gov/2015/09/),         this erosion, which threatens villages, wild-
Arctic permafrost coast (https://www.             with the shoreline retreating an average       life habitats, and oil- and gas-production
usgs.gov/centers/pcmsc/science/climate-           of about 4.5 feet per year and, in some
impacts-arctic-coasts), one of the most           stretches, more than 65 feet per year                        (Drone in Arctic continued on page 9)

Feb. - Mar. 2019 Sound Waves                                          8                                                                   Research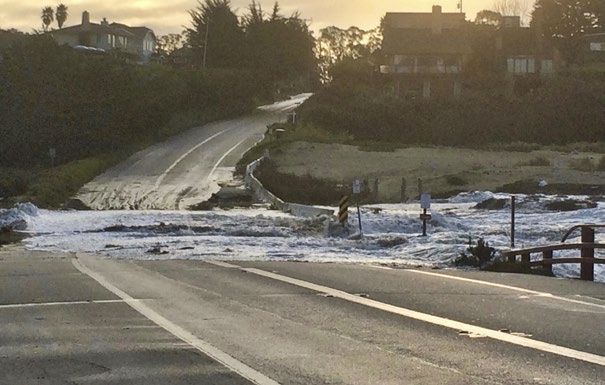
Research, continued
(Drone in Arctic continued from page 8)
Eroding bluffs along Alaska’s Arctic coast. Note light perma- The relative warmth of seawater and the impact of waves combine to erode bluffs by
frost in bluff face, below top few feet of soil and vegetation. “thermal abrasion.” Screenshot from video “Peeking into Permafrost” (https://www.
Photo by Benjamin Jones, USGS Alaska Science Center. usgs.gov/media/videos/peeking-permafrost) by USGS contractor Amy West.
facilities. One of the factors they are exam- permafrost has melted and has collapsed. is optimistic, though he cautions: “It will
ining closely is the permafrost itself. What I’m trying to get with this methane probably take multiple years of data and
“Most of the Arctic coastline is held to- study is, can we identify areas of thermal multiple collection methods to show that
gether by permafrost,” says Oberle. “That’s abrasion through methane release—can we there really is a solid overlap between the
what makes the coasts stable, essentially.” develop an early detection system?” two phenomena.”
Erosion of permafrost coasts is driven The results look promising so far. Data The full citation for the new paper is:
not just by the impact of waves but also by collected in the September 2017 test, Oberle, F.K.J., Gibbs, A.E., Richmond,
the thermal energy—or warmth—of the at the end of the thawing season, show B.M. Erikson, L.H., Waldrop, M.P, and
seawater. Erosion produced by the com- hotspots of escaping methane that were Swarzenski, P.W., 2019, Towards de-
bined action of the sea’s mechanical and closely associated with meltwater run-off termining spatial methane distribution
thermal energy is called “thermal abrasion.” channels (see map). The scientists plan to on Arctic permafrost bluffs with an un-
“Thermal abrasion usually can only be return to Barter Island in 2019, at the onset manned aerial system: SN Applied Sci-
detected after the fact,” says Oberle. “Once of thawing, to further study permafrost ences, vol. 1, no. 3, article 236, https://
things have started to erode, you can see that degradation and thermal abrasion. Oberle doi.org/10.1007/s42452-019-0242-9.
Fieldwork
Recent Fieldwork
By Rex Sanders • Feb. - Mar. 2019
USGS scientists visited several coastal • Santa Barbara County, California:
and offshore locations, looking for pol- Monitored changes in sand distribution
luted sediment in Washington, monitoring on beaches and nearshore, Mar. 17–23.
beach changes in California, studying Details: https://cmgds.marine.usgs.
dune restoration in New Jersey, and much gov/fan_info.php?fan=2019-609-FA
more. Here’s a quick overview of some
recent fieldwork by our researchers. • Tampa Bay, Florida: Measured CO2
and pH in four rivers, Mar. 16–18. De-
• Sacramento-San Joaquin Delta, Cali- tails: https://cmgds.marine.usgs.gov/
fornia: Collected sediment samples to fan_info.php?fan=2019-312-FA
support habitat restoration, Mar. 27. De-
Approximate locations of some recent USGS
tails: https://cmgds.marine.usgs.gov/ • Dauphin Island, Alabama: Used drone coastal and offshore fieldwork. Dark blue areas
fan_info.php?fan=2019-615-FA photos to generate detailed maps using outline the US Exclusive Economic Zone; purple
(Recent Fieldwork continued on page 10) areas show US Great Lakes waters.
Research / Fieldwork 9 Sound Waves Feb. - Mar. 2019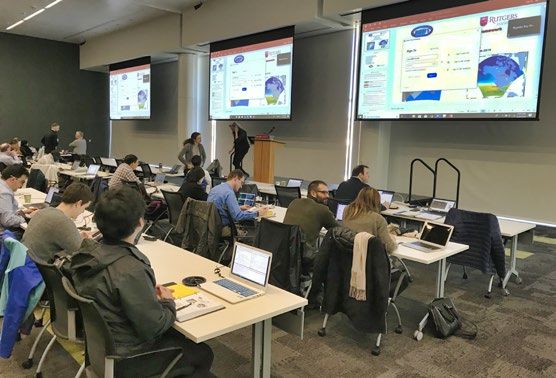
Fieldwork, continued
(Recent Fieldwork continued from page 9)
Structure-from-Motion, Mar. 10–16. minifera plankton changes, Feb. 26–28. • Offshore south-central California:
Details: https://cmgds.marine.usgs. Details: https://cmgds.marine.usgs. Collected underwater video and cores
gov/fan_info.php?fan=2019-311-FA gov/fan_info.php?fan=2019-307-FA to study sediment processes, hazards,
and seafloor habitats, Feb. 4–14. De-
• Bellingham Bay, Washington: Collect- • Manatee River, Florida: Measured car- tails: https://cmgds.marine.usgs.gov/
ed sediment samples to analyze for heavy bonate system chemistry for 24 hours, fan_info.php?fan=2019-603-FA
metals and other pollutants, Mar. 11–15. Feb. 22–23. Details:
Details: https://cmgds.marine.usgs.gov/ https://cmgds.marine.usgs.gov/fan_ • Tulum, Mexico: Studied the geochem-
fan_info.php?fan=2019-607-FA info.php?fan=2019-310-FA istry and biology of ocean-connected
caves, Dec. 5–18, 2018. Details:
• Monterey Bay, California: Collected • Puget Sound, Washington: Measured https://cmgds.marine.usgs.gov/fan_
nearshore bathymetry and beach topog- eelgrass habitat using sonar in Belling- info.php?fan=2018-060-FA
raphy, Mar. 4–11. Details: ham Bay, Feb. 16–21. Details:
https://cmgds.marine.usgs.gov/fan_ https://cmgds.marine.usgs.gov/fan_ • Whiskeytown Reservoir, California:
info.php?fan=2019-610-FA info.php?fan=2019-606-FA Mapped depth and sediment thickness
after runoff from the devastating Carr
• Stone Harbor and Thompsons Beach, • Dauphin Island, Alabama: Collected Fire, Dec. 10–17, 2018. Details:
New Jersey: Monitored post-restoration drone photos to create detailed elevation https://cmgds.marine.usgs.gov/fan_
changes to beach and dune sites, Feb. maps and overhead images, Feb. 11–16 info.php?fan=2018-686-FA
24–Mar. 1, Details: and Dec. 16–20, 2018. Details:
https://cmgds.marine.usgs.gov/fan_ https://cmgds.marine.usgs.gov/fan_ For a complete list of USGS Coastal/
info.php?fan=2019-006-FA info.php?fan=2019-306-FA and Marine Hazards and Resources Program
https://cmgds.marine.usgs.gov/fan_ fieldwork, see: https://cmgds.marine.
• Gulf of Mexico: Collected and rede- info.php?fan=2018-370-FA usgs.gov/data_search.php.
ployed a sediment trap measuring fora-
Meetings
Predicting Coastal Storm Impacts: 4th COAWST Model Training
By Sara Ernst and John Warner
Understanding the processes respon-
sible for coastal change is important for
managing both our natural and economic
coastal resources. Storms are one of the
primary driving forces causing coastal
change from a coupling of wave- and
wind-driven flows. To better understand
storm impacts and their effects on our
coastlines, there is an international need
to better predict storm paths and intensi-
ties. To fill this gap, the USGS has been
leading the development of a Coupled
Ocean-Atmosphere-Waves-Sediment
Transport (COAWST, https://woodshole.
er.usgs.gov/project-pages/cccp/public/
COAWST.htm) Modeling System.
This open-source tool combines many
sophisticated systems that each provide
relative earth-system components neces-
sary to investigate the dynamics of coastal COAWST Modeling System via https://woodshole.er.usgs.gov/project-pages/cccp/
(COAWST continued on page 11) public/COAWST.htm.
Feb. - Mar. 2019 Sound Waves 10 Fieldwork / MeetingsMeetings, continued
(COAWST continued from page 10)
Earth, and Atmospheric Sciences at North
Carolina State University. Warner leads
the development and maintenance of the
COAWST system and He’s Ocean Observ-
ing and Modeling Group was involved
in the development process and includes
expert users.
The training provided both a hands-on
tutorial of the system, as well as funda-
mental information about the modeling
components. Tutorials and demonstrations
were given by developers and expert us-
ers of WRF, SWAN, and ROMS on each
model separately and how they interact.
Users from around the world traded case
studies, techniques, tips, new features, and
additional tools for COAWST. Over 70
scientists from around the world attended
COAWST Modeling System training attendees at Hunt Library, North Carolina State University.
Photo credit: J.B. Zambon.
the training on-site, while others utilized
the presentation materials and recordings
storm impacts. Specifically, the COAWST ocean and waves to dynamically evolve of the training made available online.
Modeling System includes an atmosphere and provide a feedback to the atmosphere These trainings provide a great deal of
component—Weather Research and simulation. This will modify the storm value to COAWST users, and the USGS
Forecast Model (WRF), an ocean compo- development and provide a more realistic will continue to provide these trainings to
nent—Regional Ocean Modeling System suite of physical storm processes. Cur- enhance the user community and the mod-
(ROMS), a wave component—Simulating rently, the COAWST modeling system has eling system itself.
Waves Nearshore (SWAN), and a sediment over 800 registered users. For more information about the
component—the USGS Community Sedi- To advance the user community of this COAWST Modeling System, visit the
ment Models. The USGS has provided modeling system, the USGS has held website (https://woodshole.er.usgs.gov/
and developed varying aspects of all these trainings every two years since 2012. The project-pages/cccp/public/COAWST.
individual systems and provided enhanced most recent training, held February 25–28, htm), access the “Development of a
capabilities to allow these components to 2019, in the James Hunt Library at North Coupled Ocean–Atmosphere–Wave–
feed back to one another. For example, a Carolina State University, was hosted by Sediment Transport (COAWST) Mod-
typical hurricane modeling simulation may Research Oceanographer John Warner eling System” article (https://www.
include great details for the atmosphere of the USGS Woods Hole Coastal and sciencedirect.com/science/article/pii/
component, but with limited connectivity Marine Science Center, and Ruoying He, S1463500310001113?via%3Dihub),
to the ocean. However, with the COAWST a Goodnight Innovation Distinguished or contact John Warner
system, these simulations will allow the Professor in the Department of Marine, (mailto:jcwarner@usgs.gov).
COAWST model training and participants. Photo Credit: John Warner.
Meetings 11 Sound Waves Feb. - Mar. 2019Awards,
Staff andcontinued
Center News
News, continued
Two New Research Oceanographers at the Pacific Coastal and Marine Science
Center in Santa Cruz, California
By Helen Gibbons
The USGS Pacific Coastal and Ma- range of storm intensities and sea-level Research Assistant Professor in the De-
rine Science Center welcomed two new rise scenarios. partment of Civil & Materials Engineer-
permanent employees in January 2019: As part of the CoSMoS team, Sean ing. In September 2018, Sean accepted a
research oceanographers Amy Gartman developed a numerical model for predict- permanent position with the USGS. He
and Sean Vitousek. ing how climate change will alter sandy completed his fall teaching responsibili-
“We are delighted to have Amy and beaches over the course of decades. ties and then came to the Pacific Coastal
Sean on our permanent staff,” said Cen- He led a group of scientists using this and Marine Science Center in January
ter Director Guy Gelfenbaum. “Both of model, CoSMoS-COAST (Coastal Storm 2019. Sean’s research interests include
them have already made significant con- Modeling System—Coastal One-line the development of advanced numeri-
tributions to the team as postdocs in the Assimilated Simulation Tool), to project cal models for coastal processes, such as
USGS Mendenhall Research Program.” shoreline changes in Southern California nearshore hydrodynamics, coastal evolu-
by the end of this century. Their results tion, coastal hazards, and sea-level rise.
Sean Vitousek showed that 31 to 67 percent of Southern
Sean earned a Ph.D. in civil and en- California beaches may become com- Amy Gartman
vironmental engineering in 2013 from pletely eroded (https://www.usgs.gov/ Amy earned a Ph.D. in oceanography
Stanford University, where he focused on news/disappearing-beaches-modeling- at the University of Delaware, where she
numerical modeling of ocean waves. In shoreline-change-southern-california) studied hydrothermal vents—fissures in
2014, Sean became a USGS Mendenhall by the year 2100, if sea level rises 3 to 6 the seafloor that emit hot, mineral-laden
Research Fellow at the Pacific Coastal feet and human intervention is limited. water. She received her degree in 2013
and Marine Science Center. He worked The paper drew considerable attention and then spent a year examining interac-
primarily with Li Erikson and Patrick when it was published in April 2017 in tions between microbes and minerals as
Barnard on the Coastal Storm Modeling the Journal of Geophysical Research (New Oceanographers continued on page 13)
System (CoSMoS, https://www.usgs. (https://agupubs.onlinelibrary.wiley.
gov/centers/pcmsc/science/coastal- com/doi/epdf/10.1002/2016JF004065).
storm-modeling-system-cosmos), By that time, Sean was at the Univer-
which forecasts coastal flooding under a sity of Illinois at Chicago, working as a
Amy Gartman (left) and Jim Hein examine a
rock at Almaden Quicksilver County Park, the
site of the New Almaden quicksilver mine,
which operated from the mid-1800s to the early
1900s. The mine supplied mercury for proc-
Sean Vitousek, his wife Sylvia, and their daughter Merigold at Natural Bridges State Beach, Santa Cruz, essing gold ore during the California Gold Rush.
California. Photo credit: Sean Vitousek, USGS. Photo credit: Kira Mizell, USGS.
Feb. - Mar. 2019 Sound Waves 12 Staff and Center NewsAwards,
Staff andcontinued
Center News, continued
(New Oceanographers continued from page 12)
a postdoctoral fellow at Harvard Uni- before confirmed. Her current research Upon becoming a permanent employee
versity. In 2015, Amy became a USGS focuses on the formation and dissolu- in February 2019, Amy succeeded Jim
Mendenhall Research Fellow tion of seafloor massive sulfide deposits Hein (recently retired) as the leader of
(https://soundwaves.usgs.gov/2017/03/ around hydrothermal vents. The rapid the Global Ocean Minerals Project. She
staff2.html), working with research ge- mixing of cold, oxygenated seawater had already taken his place as a member
ologist Jim Hein on the Global Ocean with hot, metal- and sulfur-rich vent of the U.S. delegation to the Interna-
Minerals Project (https://www.usgs.gov/ fluids precipitates abundant minerals, tional Seabed Authority (ISA, https://
centers/pcmsc/science/global-ocean- forming the charismatic “black smok- soundwaves.usgs.gov/2018/05/). The
mineral-resources). This group seeks to ers.” Companies are likely to mine ISA is charged with implementing the
understand how and where mineral-rich seafloor massive sulfides soon at sites Convention on the Law of the Sea, an
deposits form in the ocean, and what where hydrothermal vents are no longer international treaty governing the use of
effects mining them could have on the active. Crushing during mining will re- the oceans and their resources. As science
deep-sea environment. lease a new class of particles, different advisor, Gartman helps the U.S. delegates
During her time as a Mendenhall from the natural ones in hydrothermal understand the nature and locations of
Fellow, Amy led a group that achieved “black smoke.” Amy is characterizing different types of mineral deposits and
the first observation of gold particles both classes of particles to compare how what environmental protections might
in fluids from hydrothermal vents they fare in seawater. She’s also looking be needed if they are mined. Amy is also
(https://www.usgs.gov/center-news/ at minerals that exist in low concentra- working to grow the community of sci-
first-observation-gold-particles-hot- tions in these systems and may be toxic, entists studying the potential effects of
hydrothermal-fluids)—a phenomenon technologically important, or useful deep-sea mining.
that had been hypothesized but never as tracers. Welcome, Amy and Sean!
Social Media Highlights
Social Media Highlights
By Rex Sanders
https://mobile.twitter.com/USGS/
https://mobile.twitter.com/USGSCoastChange/ https://mobile.twitter.com/USGSCoastChange/ status/1105819549926973440
status/1108421718119309312 status/1106251547887861760
(Social Media Highlights continued on page 14)
Staff and Center News / Social Media Highlights 13 Sound Waves Feb. - Mar. 2019Social Media Highlights, continued
(Social Media Highlights continued from page 13)
https://mobile.twitter.com/USGSWILDLIFE/ https://mobile.twitter.com/USGSCoastChange/ https://mobile.twitter.com/USGSCoastChange/
status/1107714450990264320 status/1106356972423503872 status/1103460669087571968
https://m.facebook.com/ https://mobile.twitter.com/USGSAquaticLife/ https://www.instagram.com/p/BuZIf2DB3va/
USGScoastalandoceanscience/ status/1100821616966156288
posts/2082304141864223
(Social Media Highlights continued on page 14)
Feb. - Mar. 2019 Sound Waves 14 Social Media HighlightsSocial Media Highlights, continued
(Social Media Highlights continued from page 14)
https://mobile.twitter.com/USGS/ https://mobile.twitter.com/USGS/
https://www.instagram.com/p/BuT0wXiARYH/
status/1101577311831220224 status/1100795194717306881
https://twitter.com/USGS/ https://twitter.com/USGSWetlands/
https://www.facebook.com/
USGScoastalandoceanscience/ status/1092460273942769664 status/1093894802171670529
posts/2052833258144645
(Social Media Highlights continued on page 16)
Social Media Highlights 15 Sound Waves Feb. - Mar. 2019Social Media Highlights, continued
(Social Media Highlights continued from page 15)
https://twitter.com/USGSCoastChange/ https://www.instagram.com/p/Btn5EguAh6p/ https://twitter.com/USGSCoastChange/
status/1095426475426103297 status/1093598332562206720
https://twitter.com/USGSCoastChange/
status/1095388046172684289
https://twitter.com/USGSCoastChange/
status/1093588224902017024 Follow us on Facebook:
https://www.facebook.com/ @coastalandoceanscience,
USGScoastalandoceanscience/photos @USGeologicalSurvey; Twitter:
/a.1001761456585169/2029785813782723/ @USGSCoastChange, @USGS; Insta-
gram: @USGS; and YouTube: @USGS
Feb. - Mar. 2019 Sound Waves 16 Social Media HighlightsPhoto Roundup, continued
Sound Waves Photo Roundup
By Rex Sanders • Feb. - Mar. 2019
Dann Blackwood and Jon Borden prepare
to drop a current meter overboard from the
Dann Blackwood, Jon Borden, and Steve Suttles of USGS ready to install moorings in Wellfleet, research boat Muddy Waters offshore of
Massachusetts. USGS scientists measure water velocity, water quality, suspended sediment, and Wellfleet, Massachusetts. Photo credit: USGS,
many other values to improve computer models of wetland changes in coastal National Park Ser- Feb. 15, 2019, public domain. More: https://
vice units, including Cape Cod National Seashore. Photo credit: USGS, Feb. 15, 2019, public domain. www.usgs.gov/centers/whcmsc/science-
More: https://www.usgs.gov/centers/whcmsc/science-topics/coastal-wetlands topics/coastal-wetlands
Shawn Harrison surveys beach topography
using a precision GPS backpack on Twin Lakes
State Beach, California. USGS researchers Dan Hoover takes a break near Moss Landing,
have measured coastal sediment supply and California. Dan drives the all-terrain vehicle
Dann Blackwood and Jon Borden inspect a
transport patterns in northern Monterey Bay seen behind him to rapidly survey long sections
current meter retrieved from the ocean using
for five years. Twice each year they survey the of beach using precision GPS. Photo credit:
the research boat Muddy Waters near Wellfleet,
coast from Santa Cruz to Moss Landing with a Andrew Stevens, USGS, Mar. 9, 2017, public
Massachusetts. Photo credit: USGS, Feb. 15,
variety of devices. The following photos show domain. More: https://www.usgs.gov/centers/
2019, public domain. More: https://www.usgs.
the scope of their operations. Photo credit: pcmsc/science/coastal-change
gov/centers/whcmsc/science-topics/coastal-
Andrew Stevens, USGS, Mar. 7, 2017, public
wetlands
domain. More: https://www.usgs.gov/centers/
pcmsc/science/coastal-change
Shawn Harrison surveys beach topography Andrew Stevens runs a personal watercraft
using a backpack equipped with precision GPS rigged with sonar and precision GPS to survey
at Zmudowski State Beach, California. The fog- Jackson Currie maps ocean depths using a northern Monterey Bay. Photo credit: USGS,
shrouded Moss Landing Power Plant looms in personal watercraft equipped with precision Mar. 14, 2017, public domain. More: https://
the background. Photo credit: Andrew Stevens, GPS and sonar near Capitola, California. Photo www.usgs.gov/centers/pcmsc/science/
USGS, Mar. 9, 2017, public domain. More: credit: Andrew Stevens, USGS, Mar. 9, 2017, coastal-change
https://www.usgs.gov/centers/pcmsc/science/ public domain. More: https://www.usgs.gov/
coastal-change centers/pcmsc/science/coastal-change (Photo Roundup continued on page 18)
Photo Roundup 17 Sound Waves Feb. - Mar. 2019Photo Roundup, continued
(Photo Roundup continued from page 17)
Alex Snyder (left) and SeanPaul La Selle stay
in radio contact with a personal watercraft
operator offshore in order to provide supplies
Gerry Hatcher (left) and Shawn Harrison and safety near Moss Landing, California. Photo
adjust a computer controlling video cameras credit: Shawn Harrison, USGS, Mar. 13, 2017,
Josh Logan operates a drone carrying a preci- on the roof of the Dream Inn, a 10-story hotel public domain. More: https://www.usgs.gov/
sion GPS and special camera to map the shore overlooking Monterey Bay in Santa Cruz, centers/pcmsc/science/coastal-change
at Long Beach, Washington. USGS scientists California. Harrison uses the images to im-
used the same system for detailed mapping of prove understanding and computer modeling
beaches beside Monterey Bay, California. Photo of beach processes. Photo credit: Shawn Visit the USGS Multimedia Gallery to
credit: Shawn Harrison, USGS, Aug. 7, 2017, pub- Harrison, USGS, May 12, 2017, public domain. browse more than 10,000 other photos and
lic domain. More: https://www.usgs.gov/centers/ More: https://www.usgs.gov/centers/pcmsc/ videos: https://www.usgs.gov/products/
whcmsc/science/aerial-imaging-and-mapping science/coastal-change multimedia-gallery/
Publication
Publications, continued
Recent Publications
• Barnard, P.L., Erikson, L.H., Foxgrover, • Everhart, C.S., Smith, C.G., and Zaremba, • Goldsmith, D.B., and Kellogg, C.A.,
A.C., Finzi Hart, J.A., Limber, P., O’Neill, N.J., 2018, Radon-222 time-series 2019, Cold-water coral microbiomes
A.C., van Ormondt, M., Vitousek, S., data related to submarine groundwater (Astrangia poculata) from Narragansett
Wood, N., Hayden, M.K., and Jones, J.M., discharge along the western margin Bay—sequence data: U.S. Geological
2019, Dynamic flood modeling essential of Indian River Lagoon, Florida: U.S. Survey data release, https://doi.
to assess the coastal impacts of climate Geological Survey data release, https:// org/10.5066/P9C2XCQQ.
change: Scientific Reports, v. 9, p. 1–13, doi.org/10.5066/P9N3QNFH.
https://doi.org/10.1038/s41598-019- • Goldsmith, D.B., Pratte, Z.A., Kellogg,
40742-z. • Forde, A.S., DeWitt, N.T., Fredericks, J.J., C.A., Snader, S.E., and Sharp, K.H.,
and Miselis, J.L., 2019, Archive of chirp 2019, Stability of temperate coral
• Bellanova, P., Frenken, M., Richmond, subbottom profile data collected in June Astrangia poculata microbiome is
B.M., Schwarzbauer, J., La Selle, S., 2018 from Fire Island, New York: U.S. reflected across different sequencing
Griswold, F., Jaffe, B.E., Nelson, A.R., Geological Survey data release, https:// methodologies: AIMS Microbiology,
and Reicherter, K., 2019, Organic doi.org/10.5066/P9Q8TVHH. v. 5, p. 62–76, https://doi.org/10.3934/
geochemical investigation of far-field microbiol.2019.1.62.
tsunami deposits of the Kahana Valley, • Foxgrover, A.C., Marvin-DiPasquale, M.C.,
O’ahu, Hawai’i: Sedimentology, https:// Jaffe, B.E., and Fregoso, T.A., 2019, Slough • Green, R.H., Lowe, R.J., Buckley, M.L.,
doi.org/10.1111/sed.12583. evolution and legacy mercury remobilization Foster, T., and Gilmour, J., 2019, Physical
induced by wetland restoration in South mechanisms influencing localized patterns
• Bruno, J.F., Cote, I.M., and Toth, L.T., San Francisco Bay: Estuarine, Coastal and of temperature variability and coral
2019, Climate change, coral loss, and the Shelf Science, v. 220, p. 1–12, https://doi. bleaching within a system of reef atolls:
curious case of the parrotfish paradigm: org/10.1016/j.ecss.2019.02.033. Coral Reefs, https://doi.org/10.1007/
Why don’t marine protected areas s00338-019-01771-2.
improve reef resilience? Annual Review • Ganju, N.K., 2019, Marshes are the new
of Marine Science, v. 11, p. 307–334, beaches—Integrating sediment transport • Hapke, C.J., Kramer, P.A., Fetherston-
https://doi.org/10.1146/annurev- into restoration planning: Estuaries and Resch, E.H., Baumstark, R.D., Druyor,
marine-010318-095300. Coasts, https://doi.org/10.1007/s12237- R., Fredericks, X., and Fitos, E., 2019,
019-00531-3. (Publications continued on page 19)
Feb. - Mar. 2019 Sound Waves 18 Photo Roundup / PublicationsPublications, continued
(Publications continued from page 18)
Florida Coastal Mapping Program— Massachusetts: Open-File Report • Sun, Z., Jang, J., and Santamarina,
Overview and 2018 workshop report: 2018–1181, https://doi.org/10.3133/ J.C., 2018, Time-dependent pore
Open-File Report 2019–1017, 28 p., ofr20181181. filling: Water Resources Research,
https://doi.org/10.3133/ofr20191017. v. 54, p. 10242–10253, https://doi.
• Peters, K.E., Lillis, P.G., Lorenson, T., org/10.1029/2018WR023066.
• Kuffner, I.B., 2019, Underwater and Zumberge, J.E., 2019, Geochemically
temperature on off-shore coral reefs distinct oil families in the onshore and • Takesue, R.K., and Storlazzi, C.D.,
of the Florida Keys, U.S.A. (ver. 4.0, offshore Santa Maria basins, California: 2019, Stream sediment geochemistry of
March 2019): U.S. Geological Survey AAPG Bulletin, v. 103, p. 243–271, four small drainages on the north shore
data release, https://doi.org/10.5066/ https://doi.org/10.1306/07111818014. of Kauai west of Hanalei: Open-File
F71C1TZK. Report 2019–1007, 18 p., https://doi.
• Richey, J.N., Thirumalai, K., Khider, org/10.3133/ofr20191007.
• Lamborg, C., Mincer, T., Buchanan, D., Reynolds, C.E., Partin, J.W., and
W., Collins, C., Swarr, G., Ganguli, Quinn, T.M., 2019, Considerations for • Terrano, J.F., Smith, K.E.L., Pitchford,
P.M., Whalen, K., Bothner, M.H., and Globigerinoides ruber (white and pink) J., McIlwain, J., and Archer, M., 2019,
Valiela, I., 2019, Mercury speciation and paleoceanography: Comprehensive Shoreline change analysis for the
retention in a salt marsh undergoing long- insights from a long-running Grand Bay National Estuarine Research
term fertilization: Estuarine, Coastal and sediment trap: Paleoceanography Reserve, Mississippi Alabama—1848
Shelf Science, v. 218, p. 188–196, https:// and Paleoclimatology, https://doi. to 2017 (ver. 2.0, February 2019): U.S.
doi.org/10.1016/j.ecss.2018.11.031. org/10.1029/2018PA003417. Geological Survey data release, https://
doi.org/10.5066/P9JMA8WK.
• Mark, H.F., Lizarralde, D., Collins, J.A., • Richey, J.N., Thirumalai, T., Khider,
Miller, N.C., Hirth, G., Gaherty, J.B., and D., Reynolds, C.E., Partin, J., and • Walton, M.A.L., Roland, E.C., Walter,
Evans, R.L., 2019, Azimuthal seismic Quinn, T.M., 2019, Globigerinoides J.I., Gulick, S.P.S., and Dotray, P.J., 2019,
anisotropy of 70 Ma Pacific-tplate upper ruber Sediment Trap Data in the Gulf Seismic velocity structure across the 2013
mantle: Journal of Geophysical Research of Mexico: U.S. Geological Survey Craig, Alaska rupture from aftershock
B: Solid Earth, v. 124, p. 1889–1909, data release, https://doi.org/10.5066/ tomography: Implications for seismogenic
https://doi.org/10.1029/2018JB016451. P9KK7UD6. conditions: Earth and Planetary Science
Letters, v. 507, p. 94–104, https://doi.
• Marot, M.E., Smith, C.G., • Rosenberger, K.J., Storlazzi, C.D., and org/10.1016/j.epsl.2018.11.021.
McCloskey, T.A., Locker, S.D., Dartnell, P., 2019, Morphodynamics of
Khan, N.S., and Smith, K.E.L., 2019, a field of crescent-shaped rippled scour • Yates, K.K., Moore, C.S., Goldstein,
Sedimentary data from Grand Bay, depressions: Northern Monterey Bay, CA: N.H., and Sherwood, E.T., 2019, Tampa
Alabama/Mississippi, 2014–2016: U.S. Marine Geology, v. 407, p. 44–59, https:// Bay Ocean and Coastal Acidification
Geological Survey data release, https:// doi.org/10.1016/j.margeo.2018.10.006. Monitoring Quality Assurance Project
doi.org/10.5066/P9FO8R3Y. Plan: Open-File Report 2019–1003,
• Rueda, A.C., Cagigal, L., Pearson, https://doi.org/10.3133/ofr20191003.
• Oberle, F.K.J., Gibbs, A.E., Richmond, S., Antolínez, J., Storlazzi, C.D., van
B.M., Erikson, L.H., Waldrop, M.P., Dongeren, A., Camus, P., and Mendez, • Yates, K.K., Zawada, D.G., and Arsenault,
and Swarzenski, P.W., 2019, Towards F.J., 2019, HyCReWW: A hybrid coral S.R., 2018, Projected seafloor elevation
determining spatial methane distribution reef wave and water level metamodel: change in the Upper Florida Keys 25,
on Arctic permafrost bluffs with an Computers & Geosciences, v. 127, 50, 75, and 100 years from 2002: U.S.
unmanned aerial system: SN Applied p. 85–90, https://doi.org/10.1016/j. Geological Survey data release, https://
Sciences, v. 1, p. 1–9, https://doi. cageo.2019.03.004. doi.org/10.5066/P9CI9LNH.
org/10.1007/s42452-019-0242-9.
• Stalk, C.A., Miselis, J.L., Nelson, T.R., • Yates, K.K., Zawada, D.G., and
• Pendleton, E.A., Baldwin, W.E., Reynolds, B.J., Fredericks, J.J., DeWitt, Arsenault, S.R., 2019, Projected seafloor
Ackerman, S.D., Foster, D.S., Andrews, N.T., Farmer, A.S., Wilcox, H.S., and elevation along the Florida Reef Tract
B.D., Schwab, W.C., and Brothers, Lemon M.K., 2018, Coastal bathymetry from Deerfield Beach to Homestead,
L.L., 2019, Shallow geology, sea-floor data collected in June 2018 from Fire Florida—25 years from 2014 based on
texture, and physiographic zones of the Island, New York—Wilderness breach historical rates of mean elevation change:
inner continental shelf from Aquinnah and shoreface: U.S. Geological Survey U.S. Geological Survey data release,
to Wasque Point, Martha’s Vineyard, data release, https://doi.org/10.5066/ https://doi.org/10.5066/P9UTAE37.
and Eel Point to Great Point, Nantucket, F7PC30N8.
Publications 19 Sound Waves Feb. - Mar. 2019You can also read