ESTIMATED TRANSMISSIBILITY AND IMPACT OF SARS-COV-2 LINEAGE B.1.1.7 IN ENGLAND - SCIENCE
←
→
Page content transcription
If your browser does not render page correctly, please read the page content below
RESEARCH ARTICLES

                                                                                                                       Cite as: N. G. Davies et al., Science
                                                                                                                         10.1126/science.abg3055 (2021).

Estimated transmissibility and impact of SARS-CoV-2
lineage B.1.1.7 in England
Nicholas G. Davies1*, Sam Abbott1†, Rosanna C. Barnard1†, Christopher I. Jarvis1†,
Adam J. Kucharski1†, James D. Munday1†, Carl A. B. Pearson1†, Timothy W. Russell1†,
Damien C. Tully1†, Alex D. Washburne2†, Tom Wenseleers3†, Amy Gimma1, William Waites1,
Kerry L. M. Wong1, Kevin van Zandvoort1, Justin D. Silverman4, CMMID COVID-19 Working
Group1‡, COVID-19 Genomics UK (COG-UK) Consortium‡, Karla Diaz-Ordaz5, Ruth Keogh5,
Rosalind M. Eggo1, Sebastian Funk1, Mark Jit1, Katherine E. Atkins1,6, W. John Edmunds1
1
Centre for Mathematical Modelling of Infectious Diseases, London School of Hygiene and Tropical Medicine, London, UK. 2Selva Analytics LLC, Bozeman, MT, USA.

                                                                                                                                                                   Downloaded from http://science.sciencemag.org/ on March 8, 2021
3
 Lab of Socioecology and Social Evolution, KU Leuven, Leuven, Belgium. 4College of Information Science and Technology, Pennsylvania State University, University
Park, PA, USA. 5Centre for Statistical Methodology and Department of Medical Statistics, London School of Hygiene and Tropical Medicine, London, UK. 6Centre for
Global Health, Usher Institute of Population Health Sciences and Informatics, University of Edinburgh, Edinburgh, UK.
*Corresponding author. Email: nicholas.davies@lshtm.ac.uk
†These authors contributed equally to this work.
‡See supplementary materials for list of consortium members and affiliations.

A novel SARS-CoV-2 variant, VOC 202012/01 (lineage B.1.1.7), emerged in southeast England in November
2020 and is rapidly spreading toward fixation. Using a variety of statistical and dynamic modelling
approaches, we estimate that this variant has a 43–90% (range of 95% credible intervals 38–130%)
higher reproduction number than preexisting variants. A fitted two-strain dynamic transmission model
shows that VOC 202012/01 will lead to large resurgences of COVID-19 cases. Without stringent control
measures, including limited closure of educational institutions and a greatly accelerated vaccine roll-out,
COVID-19 hospitalisations and deaths across England in 2021 will exceed those in 2020. Concerningly,
VOC 202012/01 has spread globally and exhibits a similar transmission increase (59–74%) in Denmark,
Switzerland, and the United States.

In December 2020, evidence began to emerge that a novel                           202012/01. Estimates of the growth rate, disease severity,
SARS-CoV-2 variant, Variant of Concern 202012/01 (lineage                         and impact of this novel variant are crucial for informing
B.1.1.7, henceforth VOC 202012/01), was rapidly outcompet-                        rapid policy responses to this potential threat.
ing preexisting variants in southeast England (1). The vari-
ant increased in incidence during a national lockdown in                          Characteristics of the new variant
November 2020, which was mandated in response to a pre-                           VOC 202012/01 is defined by 17 mutations (14 non-
vious and unrelated surge in COVID-19 cases, and continued                        synonymous point mutations and 3 deletions), of which
to spread following the lockdown despite ongoing re-                              eight are in the spike protein, which mediates SARS-CoV-2
strictions in many of the most affected areas. Concern over                       attachment and entry into human cells. At least three muta-
this variant led the UK government to enact stronger re-                          tions potentially affect viral function. Mutation N501Y is a
strictions in these regions on 20 December 2020, and even-                        key contact residue in the receptor binding domain and en-
tually to impose a third national lockdown on 5 January                           hances virus binding affinity to human angiotensin convert-
2021. As of 15 February 2021, VOC 202012/01 comprises                             ing enzyme 2 (ACE2) (3, 4). Mutation P681H is immediately
roughly 95% of new SARS-CoV-2 infections in England, and                          adjacent to the furin cleavage site in spike, a known region
has now been identified in at least 82 countries (2). Our cur-                    of importance for infection and transmission (5, 6). Deletion
rent understanding of effective pharmaceutical and non-                           ∆H69/∆V70 in spike has arisen in multiple independent
pharmaceutical control of SARS-CoV-2 does not reflect the                         lineages of SARS-CoV-2, is linked to immune escape in im-
epidemiological and clinical characteristics of VOC                               munocompromised patients, and enhances viral infectivity

First release: 3 March 2021                                         www.sciencemag.org              (Page numbers not final at time of first release) 1
in vitro (7, 8). This deletion is also responsible for certain     community COVID-19 tests instead of COG-UK sequence
commercial testing kits failing to detect the spike glycopro-      data (Table 1, model 2h; fig. S6). Data from other countries
tein gene, with genomic data confirming these S gene target        yield similar results: we estimate that R for VOC 202012/01
failures in England are now overwhelmingly due to the new          relative to other lineages is 55% (45–66%) higher in Den-
variant (1).                                                       mark, 74% (66–82%) higher in Switzerland, and 59% (56–
     The proportion of COVID-19 cases attributable to VOC          63%) higher in the United States, with consistent rates of
202012/01 is rapidly increasing in all regions of England,         displacement across regions within each country (Table 1,
following an initial expansion in the South East (Fig. 1A),        models 3a–c; figs. S6 and S7).
and is spreading at comparable rates among males and fe-                As an alternative approach, we performed a regression
males and across age and socioeconomic strata (Fig. 1B).           analysis of previously-estimated reproduction numbers from
One potential explanation for the spread of VOC 202012/01          case data against the frequency of S gene target failure in
within England is a founder effect: that is, if certain regions    English upper-tier local authorities (Fig. 2D), using local
had higher levels of transmission as a result of more social       control policies and mobility data as covariates and includ-
interactions, variants that were more prevalent within these       ing a time-varying spline to capture any unmeasured con-
regions could become more common overall. Changes in               founders. This yielded an estimated increase in R for VOC

                                                                                                                                        Downloaded from http://science.sciencemag.org/ on March 8, 2021
social contact patterns correlate closely with changes in          202012/01 of 43% (38–48%), increasing to a 57% (52–62%)
transmission (9) (Fig. 1, C and D) and with COVID-19 bur-          increase if the spline was not included (Table 1, model 4a–
den in England (10). However, we did not find substantial          b). The various statistical models we fitted yield slightly dif-
differences in social interactions between regions of high         ferent estimates for the growth rate of VOC 202012/01, re-
and low VOC 202012/01 prevalence, as measured by Google            flecting different assumptions and model structures, but all
mobility (11) and social contact survey data (12) from Sep-        identify a substantially increased growth rate (table S1).
tember to December 2020 (Fig. 1, E and F). Therefore, the
apparent decoupling between contact rates and transmis-            Mechanistic hypotheses for the rapid spread
sion in late 2020 may suggest altered transmission charac-         To understand possible biological mechanisms for why VOC
teristics for VOC 202012/01.                                       202012/01 spreads more quickly than preexisting variants,
                                                                   we extended an age- and regionally-structured mathemati-
Measuring the new variant’s growth rate                            cal model of SARS-CoV-2 transmission (10, 15) to consider
VOC 202012/01 appears unmatched in its ability to outcom-          two co-circulating variants (fig. S8 and tables S2 and S3).
pete other SARS-CoV-2 lineages in England. Analyzing the           The model uses Google mobility data (11), validated by social
COG-UK dataset (13), which comprises over 150,000 se-              contact surveys (10), to capture changes in contact patterns
quenced SARS-CoV-2 samples from across the UK, we found            over time for each region of England. We created five ver-
that the relative population growth rate of VOC 202012/01          sions of the model, each including one alternative parame-
in the first 31 days following its initial phylogenetic observa-   ter capturing a potential mechanism.
tion was higher than that of all 307 other lineages with                The hypotheses we tested are as follows. First, observa-
enough observations to obtain reliable growth-rate esti-           tions of lower Ct values (16–18)—i.e., higher viral load—
mates (Fig. 2A and fig. S1). While the relative growth rate of     support that VOC may be more transmissible per contact
VOC 202012/01 has declined slightly over time, it remains          with an infectious person than preexisting variants (hypoth-
among the highest of any lineage as a function of lineage          esis 1). Second, longitudinal testing data (17) suggest that
age (Fig. 2B), and the lineage continues to expand.                VOC may be associated with a longer period of viral shed-
     To quantify the growth advantage of VOC 202012/01, we         ding, and hence a potentially longer infectious period (hy-
performed a series of multinomial and logistic regression          pothesis 2). Third, the ∆H69/∆V70 deletion in spike
analyses on COG-UK data. A time-varying multinomial                contributed to immune escape in an immunocompromised
spline model estimates an increased growth rate for VOC            patient (7), potentially suggesting that immunity to preexist-
202012/01 of +0.104 days−1 (95% CI 0.100–0.108) relative to        ing variants affords reduced protection against infection
the previously dominant lineage, B.1.177 (Table 1, model 1a;       with VOC (hypothesis 3). Fourth, that VOC initially spread
Fig. 2C and figs. S2 and S3). Assuming a generation interval       during the November 2020 lockdown in England, during
of 5.5 days (14), this corresponds to a 77% (73–81%) increase      which schools were open, suggests that children may be
in the reproduction number R. The growth advantage of              more susceptible to infection with VOC than with preexist-
VOC 202012/01 persists under more conservative model as-           ing variants (hypothesis 4). Children are typically less sus-
sumptions (Table 1, model 1b; fig. S4), is consistent across       ceptible to SARS-CoV-2 infection than adults (19, 20),
all regions of the UK (table S1, model 2a; fig. S5), and is sim-   possibly because of immune cross-protection due to other
ilar when measured from S gene target failures among               human coronaviruses (21), which could be less protective

First release: 3 March 2021                            www.sciencemag.org       (Page numbers not final at time of first release)   2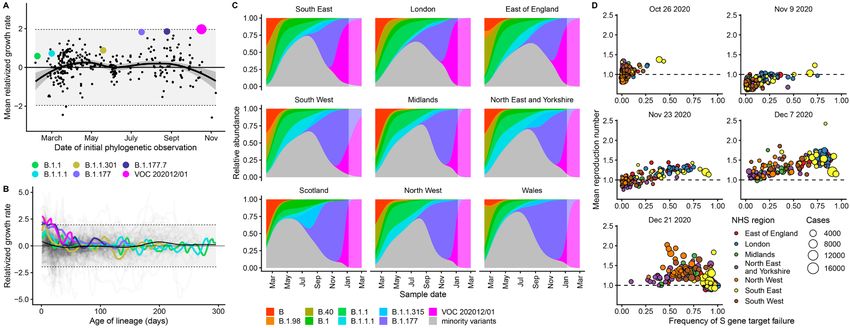
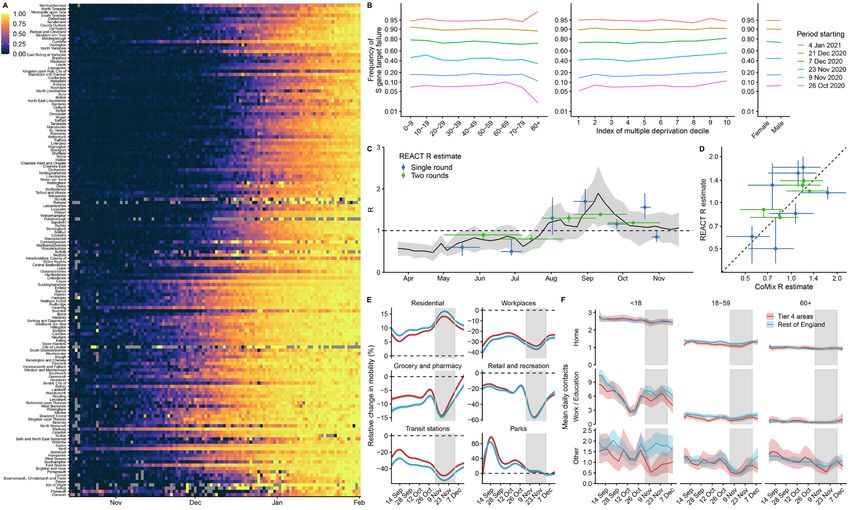
against VOC. Finally, VOC could have a shorter generation         tive transmissibility, estimated at 65% (95% CrI: 39–93%)
time than preexisting variants (hypothesis 5). A shorter gen-     higher than preexisting variants for the three most heavily
eration time could account for an increased growth rate           affected NHS England regions, or 82% (43–130%) when es-
without requiring a higher reproduction number, which             timated across all seven NHS England regions (Table 1,
would make control of VOC 202012/01 via social distancing         model 5a). These estimates of increased transmissibility are
measures relatively easier to achieve.                            consistent with our statistical estimates and with a previous
     We fit each model to time series of COVID-19 deaths,         estimate of a 70% increased reproduction number for VOC
hospital admissions, hospital and ICU bed occupancy, PCR          202012/01 (16). This model reproduces observed epidemio-
prevalence, seroprevalence, and the proportion of communi-        logical dynamics for VOC 202012/01 (Fig. 3C and fig. S17).
ty SARS-CoV-2 tests with S gene target failure across the         Without the introduction of a new variant with a higher
three most heavily affected NHS England regions, over the         growth rate, the model is unable to reproduce observed dy-
period of 1 March–24 December 2020 (Fig. 3 and figs. S9 to        namics (Fig. 3, D and E, and figs. S17 to S19), further high-
S14). We assess models using Deviance Information Criteria        lighting that changing contact patterns do not explain the
(DIC) and by comparing model predictions to observed data         spread of VOC 202012/01.
for the 14 days following the fitting period (i.e., 25 December

                                                                                                                                       Downloaded from http://science.sciencemag.org/ on March 8, 2021
2020–7 January 2021). Of the five hypotheses assessed, hy-        Implications for COVID-19 dynamics in England
pothesis 1 (increased transmissibility) had the lowest (i.e.,     Using the best-performing transmission model (increased
best) combined DIC and predictive deviance. Hypotheses 2          transmissibility) fitted to all seven NHS England regions, we
(longer infectious period) and 4 (increased susceptibility in     compared projected epidemic dynamics under different as-
children) also fitted the data well, although hypothesis 4 is     sumptions about control measures from mid-December
not well supported by household secondary attack rate data        2020 to the end of June 2021. We compared four scenarios
(fig. S15) or by age-specific patterns of S gene target failure   for non-pharmaceutical interventions (NPIs) introduced on
in the community (fig. S16), neither of which identify a sub-     1 January 2021: (i) a moderate-stringency scenario with mo-
stantial increase in susceptibility among children. Hypothe-      bility levels as observed in the first half of October 2020; (ii)
ses 3 (immune escape) and 5 (shorter generation time) fit         a high-stringency scenario with mobility levels as observed
poorly (Fig. 3A and table S4). In particular, hypothesis 5        during the second national lockdown in England in Novem-
predicted that the relative frequency of VOC 202012/01            ber 2020, with schools open; (iii) the same high-stringency
should have dropped during stringent restrictions in late         scenario, but with schools closed until 15 February 2021;
December 2020, because when two variants have the same            and (iv) a very high-stringency scenario with mobility levels
Rt < 1 but different generation times, infections decline fast-   as observed during the first national lockdown in early April
er for the variant with the shorter generation time.              2020, with schools closed (fig. S20). In combination with
     We fitted a combined model incorporating the five hy-        these NPI scenarios, we considered three vaccination sce-
potheses above, but it was not able to identify a single con-     narios: no vaccinations; 200,000 vaccinations per week; and
sistent mechanism across NHS England regions,                     2 million vaccinations per week. We assumed that vaccine
demonstrating that a wide range of parameter values are           rollout starts on 1 January 2021 and that vaccinated indi-
compatible with the observed growth rate of VOC 202012/01         viduals have a 95% lower probability of disease and a 60%
(fig. S14). Based on our analysis, we identify increased          lower probability of infection than unvaccinated individuals.
transmissibility as the most parsimonious model, but em-          For simplicity, we assumed that vaccine protection was con-
phasize that the five mechanisms explored here are not mu-        ferred immediately upon receipt of one vaccine dose. Note
tually exclusive and may be operating in concert.                 that these projections serve as indicative scenarios rather
     The increased transmissibility model does not identify a     than formal predictive forecasts.
clear increase or decrease in the severity of disease associat-        Regardless of control measures, all regions of England
ed with VOC 202012/01, finding similar odds of hospitalisa-       were projected to experience a new wave of COVID-19 cases
tion (estimated odds ratio of hospitalisation given infection,    and deaths in early 2021, peaking in February 2021 if no
0.92 [95% credible intervals 0.77–1.10]), critical illness (OR    substantial control measures are introduced, or in mid-
0.90 [0.58–1.40]), and death (OR 0.90 [0.68–1.20]), based         January 2021 if strong control measures succeeded in reduc-
upon fitting to the three most heavily affected NHS England       ing R below 1 (Fig. 4A). In the absence of substantial vaccine
regions (Fig. 3B). These estimates should be treated with         roll-out, the number of COVID-19 cases, hospitalisations,
caution, as we would not expect to identify a clear signal of     ICU admissions and deaths in 2021 were predicted to exceed
severity when fitting to data up to 24 December 2020, given       those in 2020, even with stringent NPIs in place (Table 2).
delays between infection and hospitalization or death. How-       Implementing more stringent measures in January 2021
ever, the fitted model finds strong evidence of higher rela-      (scenarios iii and iv) led to a larger rebound in cases when

First release: 3 March 2021                           www.sciencemag.org       (Page numbers not final at time of first release)   3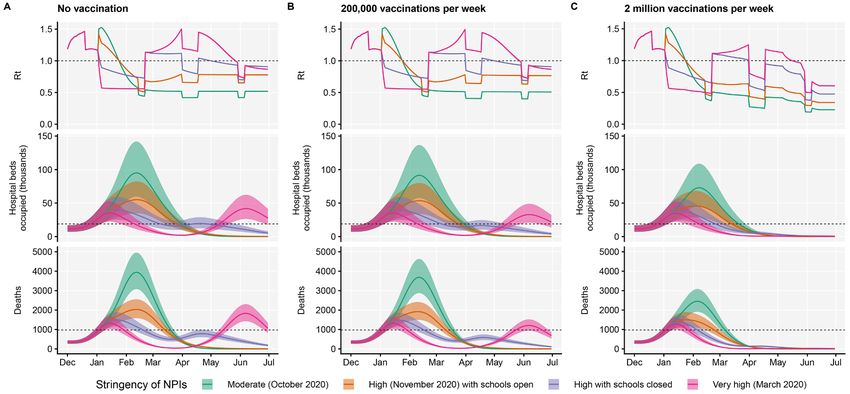
simulated restrictions were lifted in March 2021, particular-           The rise in transmission from VOC 202012/01 has cru-
ly in those regions that had been least affected up to De-         cial implications for vaccination. First, it means prompt and
cember 2020 (fig. S21). However, these more stringent              efficient vaccine delivery and distribution is even more im-
measures may buy time to reach more widespread popula-             portant to reduce the impact of the epidemic in the near
tion immunity through vaccination. Vaccine roll-out further        future. Increased transmission resulting from VOC
mitigates transmission, although the impact of vaccinating         202012/01 will raise the herd immunity threshold, meaning
200,000 people per week—similar in magnitude to the rates          the potential burden of SARS-CoV-2 is larger and higher
reached in December 2020—was relatively small (Fig. 4B             vaccine coverage will be required to achieve herd immunity.
and fig. S22). An accelerated uptake of 2 million people fully     It is therefore extremely concerning that VOC 202012/01 has
vaccinated per week (i.e., 4 million doses for a two-dose vac-     spread to at least 82 countries globally (2). Although VOC
cine) had a much more substantial impact (Fig. 4C and fig.         202012/01 was first identified in England, a rapidly spread-
S23). However, accelerated vaccine roll-out has a relatively       ing variant has also been detected in South Africa (25, 26),
limited impact on peak burden, as the peak is largely medi-        where there has been a marked increase in transmission in
ated by the stringency of NPIs enacted in January 2021, be-        late 2020. Another variant exhibiting immune escape has
fore vaccination has much of an impact. The primary                emerged in Brazil (27, 28). Thus, vaccination timelines will

                                                                                                                                        Downloaded from http://science.sciencemag.org/ on March 8, 2021
benefit of accelerated vaccine roll-out lies in helping to avert   also be a crucial determinant of future burden in other
a resurgence of cases following the relaxation of NPIs, and        countries where similar new variants are present. Second,
in reducing transmission after the peak burden has already         there is a need to assess how VOC 202012/01 and other
been reached.                                                      emerging lineages affect the efficacy of vaccines (29, 30).
     As a sensitivity analysis, we also ran model projections      Vaccine developers may need to consider developing formu-
with a seasonal component such that transmission is 20%            lations with variant sequences, and powering post-licensure
higher in the winter than in the summer (22), but this did         studies to detect differences in efficacy between the preex-
not qualitatively affect our results (fig. S24 and table S5).      isting and new variants. Licensing authorities may need to
                                                                   clarify abbreviated pathways to marketing for vaccines that
Discussion                                                         involve altering strain formulation without any other
Combining multiple behavioral and epidemiological data             changes to their composition.
sources with statistical and dynamic modelling, we estimat-             There are limitations to our analysis. We have consid-
ed that the novel SARS-CoV-2 variant VOC 202012/01 has a           ered a small number of intervention and vaccination scenar-
43–90% (range of 95% credible intervals 38–130%) higher            ios, which should not be regarded as the only available
reproduction number than preexisting variants of SARS-             options for policymakers. Our transmission model does not
CoV-2 in England, assuming no changes to the generation            explicitly capture care home or hospital transmission of
interval. Based on early population-level data, we were una-       SARS-CoV-2, and is fit to each region of England separately
ble to identify whether the new variant is associated with         rather than pooling information across regions and explicit-
higher disease severity. Theoretical considerations suggest        ly modelling transmission between regions. There are also
that mutations conferring increased transmissibility to            uncertainties in the choice of model used to generate these
pathogens may be inextricably linked to reduced severity of        predictions, and the exact choice will yield differences in the
disease (23). However, this framework assumes that a long          measures needed to control the epidemic. We note that even
history of adaptive evolution has rendered mutations yield-        without increased susceptibility of children to VOC
ing increased transmissibility inaccessible without a de-          202012/01, the more efficient spread of the variant implies
crease in virulence, which does not obviously hold for a           that the difficult societal decision of closing schools will be a
recently emerged human pathogen such as SARS-CoV-2.                key public health question for multiple countries in the
Regardless, without strengthened controls, there is a clear        months ahead.
risk that future epidemic waves may be larger—and hence                 We only assess relative support in the data for the
associated with greater burden—than previous waves. The            mechanistic hypotheses proposed, but there may be other
UK government initiated a third national lockdown on 5             plausible mechanisms driving the resurgence of cases that
January 2021 in response to the rapid spread of VOC                we did not consider, and we have not identified the specific
202012/01, including school closures. Educational settings         combination of mechanisms driving the increased transmis-
are among the largest institutions linked to SARS-CoV-2            sion of VOC 202012/01. We identify increased transmissibil-
clusters that remained open during the November 2020               ity as the most parsimonious mechanistic explanation for
lockdown (24), which means the enacted school and univer-          the higher growth rate of VOC 202012/01, but a longer infec-
sity closures may substantially assist in reducing the burden      tious period also fits the data well (table S4) and is support-
of COVID-19 in early 2021.                                         ed by longitudinal testing data (17). Our conclusions about

First release: 3 March 2021                            www.sciencemag.org       (Page numbers not final at time of first release)   4
school closures were based on the assumption that children the COG-UK Consortium (13) (5 February 2020–6 January
had reduced susceptibility and infectiousness compared to 2021) and Pillar 2 SARS-CoV-2 testing data provided by Pub-
adults (19), but the precise values of these parameters and lic Health England (1 October 2020–7 January 2021) for es-
the impact of school closures remains the subject of scien- timating the frequency of S gene target failure in England.
tific debate (31). We based our assumptions about the effi- COG-UK sequencing data for Northern Ireland were exclud-
cacy of NPIs on the measured impact on mobility of ed due to low sample sizes.
previous national lockdowns in England, but the impact of To assess the spread of VOC 202012/01 in Denmark,
policy options cannot be predicted with certainty. Switzerland and the USA, we used publicly available se-
Despite these limitations, we found strong evidence that quence data giving the incidence of VOC 202012/01 aggre-
VOC 202012/01 is spreading substantially faster than preex- gated by week and region provided by the Danish Covid-19
isting SARS-CoV-2 variants. Our modelling analysis suggests Genome Consortium and the Statens Serum Institut (32) (15
this difference could be explained by an overall higher infec- October 2020–28 January 2021), sequence and RT-PCR
tiousness of VOC 202012/01, but not by a shorter generation 501Y.V1 rescreening data giving the incidence of VOC
time or immune escape alone. Further experimental work 202012/01 in different regions of Switzerland provided by
will provide insight into the biological mechanisms for our Christian Althaus and Tanja Stadler and the Geneva Univer-
Downloaded from http://science.sciencemag.org/ on March 8, 2021
observations, but given our projections of a rapid rise in sity Hospitals, the Swiss Viollier Sequencing Consortium
incidence from VOC 202012/01—and the detection of other from ETH Zürich, the Risch laboratory, the University Hos-
novel and highly-transmissible variants (25–28)—there is an pital Basel, the Institute for Infectious Diseases, University
urgent need to consider what new approaches may be re- of Bern and the Swiss National Covid-19 Science Task Force
quired to sufficiently reduce the ongoing transmission of (33, 34) (2 November 2020–11 Feb 2021), and publicly avail-
SARS-CoV-2. able US nation-wide Helix SARS-CoV-2 Surveillance data,
comprising both S-gene target failure data and randomly
Materials and methods selected S-negative samples that were sequenced to infer the
Summary of control measures in England in late 2020 proportion of S-negative samples that were the VOC (35, 36)
Following a resurgence of cases in September and October (6 September–11 February 2020).
2020, a second national lockdown was implemented in Eng- To estimate mobility, we used anonymised mobility data
land, from 5 November to 2 December 2020. Restrictions collected from smartphone users by Google Community
included a stay-at-home order with exemptions for exercise, Mobility (11). Percentage change in mobility per day was
essential shopping, obtaining or providing medical care, calculated for each lower-tier local authority in England and
education and work for those unable to work from home. a generalised additive model with a spline for time was fit-
Schools were kept open. Non-essential shops, retail and lei- ted to these observations to provide a smoothed effect of the
sure venues were required to close. Pubs, bars and restau- change in mobility over time (Fig. 1C).
rants were allowed to offer takeaway services only. To estimate social contact rates (Fig. 1D), we used data
Following the second national lockdown, regions in England on reported social contacts from the CoMix survey (12),
were assigned to tiered local restrictions according to medi- which is a weekly survey of face-to-face contact patterns,
um, high and very high alert levels (Tiers 1, 2 and 3). In re- taken from a sample of approximately 2500 individuals
sponse to rising cases in southeast England and concerns broadly representative of the UK population with respect to
over VOC 202012/01, the UK government announced on 19 age and geographical location. We calculated the distribu-
December 2020 that a number of regions in southeast Eng- tion of contacts using 1000 bootstrap samples with re-
land would be placed into a new, more stringent ‘Tier 4’, placement from the raw data. Bootstrap samples were
corresponding to a Stay at Home alert level. Tier 4 re- calculated at the participant level, then all observations for
strictions were broadly similar to the second national lock- those participants are included in a sample to respect the
down restrictions. As cases continued to rise and VOC correlation structure of the data. We collect data in two
202012/01 spread throughout England, on 5 January 2021 a panels which alternate weekly, therefore we calculated the
third national lockdown was introduced in England, with mean smoothed over the 2 week intervals to give a larger
schools and universities closed and individuals advised to number of participants per estimate and account for panel
stay at home, with measures to be kept in place until at effects. We calculated the mean number of contacts (face to
least mid-February 2021. face conversational contact or physical contact) in the set-
tings “home”, “work”, “education” (including childcare,
Data sources nurseries, schools and universities and colleges), and “other”
To assess the spread of VOC 202012/01 in the United King- settings. We calculate the mean contacts by age group and
dom, we used publicly-available sequencing-based data from area of residence (those areas which were subsequently
First release: 3 March 2021 www.sciencemag.org (Page numbers not final at time of first release) 5placed under Tier 4 restrictions on 20 December 2020 as where T is the mean generation interval. The multiplicative
they were experiencing high and rapidly increasing inci- increase being equal to exp(∆r.T) is an approximation that
dence, and those areas of England that were not placed un- holds for a delta-distributed generation interval, but we
der these restrictions). The mean number of contacts is show in the Supplementary Material that this is a good ap-
influenced by a few individuals who report very high num- proximation for the gamma-distributed generation interval
bers of contacts (often in a work context). The means shown that we assume. In our calculations, we used estimated
here are calculated based on truncating the maximum SARS-CoV-2 mean generation times T of either 5.5 days (14)
number of contacts recorded at 200 per individual per day. (Table 1) or 3.6 days (37, 38) (table S1).
We compare Rt estimates derived from CoMix (12) to those Rt analysis. We calculated the weekly proportion of pos-
derived from the REACT-1 prevalence survey (9) for Eng- itive tests that were S-gene negative out of all positive tests
land. that tested for the S-gene by English upper-tier local author-
ity. We used reproduction number estimates obtained using
Statistical methods in brief the method described in (37) and (39) and implemented in
Growth of VOC 202012/01 following initial phylogenetic ob- the EpiNow2 R package (40), downloaded from
servation. For each lineage i in the COG-UK dataset, we https://github.com/epiforecasts/covid-rt-estimates/blob/
Downloaded from http://science.sciencemag.org/ on March 8, 2021
pool the number of sequences observed within that lineage master/subnational/united-kingdom-
across the UK for every day, t, yielding integer-valued se- local/cases/summary/rt.csv. We then built a separate model
quence counts N(i, t). We estimate the time-varying expo- of the expected reproduction number in UTLA i during
nential growth rates of cases of each strain, r(i, t), using a week t starting in the week beginning the 5 October 2020 as
negative binomial state-space model correcting for day-of- a function of local restrictions, mobility indicators, residual
week effects whose dispersion parameter was optimized for temporal variation, and proportion of positive tests with S
each strain by marginal likelihood maximization. We de- gene target failure. The residual temporal variation is mod-
fined the relativized growth rate of a lineage i at time t as eled either as a region-specific thin-plate regression spline
ρ(i, t) = r ( i, t ) − r ( t ) σ r ( t ) , where r ( t ) is the average (“Regional time-varying”) or a static regional parameter
(“Regional static”). The key estimand is the relative change
growth rate of all circulating strains at time t and σr(t) the in reproduction number in the presence of S gene target
standard deviation of growth rates across all lineages at failure that is not explained by any of the other variables.
time t, such that ρ(i, t) is analogous to a z-statistic or Wald-
type statistic and allows comparison of growth rate differ- Transmission dynamic model
ences across time when the average growth rate and scale of We extended a previously developed modelling framework
growth rate differences varies. structured by age (in 5-year age bands, with no births,
Competitive advantage and increased growth rate of deaths, or aging due to the short timescales modeled) and
VOC-202012/01. To estimate the increase in growth rate of by geographical region (10, 15) to include two variants of
VOC 202012/01, we fitted a set of multinomial and binomial SARS-CoV-2 (VOC 202012/01 and non-VOC 202012/01). The
generalized linear mixed models (GLMMs), in which we es- model is a discrete-time deterministic compartmental model
timated the rate by which the VOC displaces other resident which allows for arbitrary delay distributions for transitions
SARS-CoV-2 variants across different regions in the UK, between compartments. We fitted this model to multiple
based on both the COG-UK sequence data as well as the S regionally-stratified data sources across the 7 NHS England
gene target failure data. In the analysis of the S gene target regions as previously: deaths, hospital admissions, hospital
failure data, binomial counts were adjusted for the true pos- bed occupancy, ICU bed occupancy, daily incidence of new
itive rate. For comparison, we also calculated the growth infections, PCR prevalence of active infection, seropreva-
advantage of the VOC in Denmark, Switzerland and the US lence, and the daily frequency of VOC 202012/01 across each
based on both sequencing and S gene target failure data. All of the regions as measured by S gene target failure frequen-
models took into account sample date and region plus, if cy corrected for false positives. The model assumes that in-
desired, their interaction, and all mixed models took into dividuals with clinical symptoms are more infectious than
account possible overdispersion and for the UK further in- individuals with subclinical infection (19). We assume that
cluded local-tier local authority as a random intercept. From vaccinated individuals have a lower probability of both clin-
these models, we estimated the difference in Malthusian ical and subclinical infection (fig. S9), but that vaccinated
growth rate between other competing variants ∆r, as well as individuals who do develop clinical or subclinical infection
the expected multiplicative increase in basic reproduction are as infectious as unvaccinated individuals with clinical or
number Rt and infectiousness, assuming unaltered genera- subclinical infection. To model school closure, we removed
tion time, which can be shown to be equal to exp(∆r.T), all school contacts from our contact matrix based upon
First release: 3 March 2021 www.sciencemag.org (Page numbers not final at time of first release) 6POLYMOD data and varying over time according to Google testing vaccine efficacy. Science 369, 1603–1607 (2020). Medline
Mobility indices, as described previously (10). See supple- 4. T. N. Starr, A. J. Greaney, S. K. Hilton, D. Ellis, K. H. D. Crawford, A. S. Dingens, M.
mentary materials for details of Bayesian inference includ- J. Navarro, J. E. Bowen, M. A. Tortorici, A. C. Walls, N. P. King, D. Veesler, J. D.
Bloom, Deep Mutational Scanning of SARS-CoV-2 Receptor Binding Domain
ing likelihood functions and prior distributions. Reveals Constraints on Folding and ACE2 Binding. Cell 182, 1295–1310.e20
Our individual transmission model fits to separate NHS (2020). doi:10.1016/j.cell.2020.08.012 Medline
regions of England produce independent estimates of pa- 5. M. Hoffmann, H. Kleine-Weber, S. Pöhlmann, A Multibasic Cleavage Site in the
rameters such as relative transmissibility and differences in Spike Protein of SARS-CoV-2 Is Essential for Infection of Human Lung Cells. Mol.
odds of hospitalisation or death resulting from infection Cell 78, 779–784.e5 (2020). doi:10.1016/j.molcel.2020.04.022 Medline
with VOC 202012/01. In order to produce overall estimates 6. T. P. Peacock et al., The furin cleavage site of SARS-CoV-2 spike protein is a key
determinant for transmission due to enhanced replication in airway cells. bioRxiv
for these parameters, we model posterior distributions from 10.1101/2020.09.30.318311 [preprint]. 30 September 2020.
individual NHS regions as draws from a mixture distribu-
7. S. A. Kemp et al., Neutralising antibodies drive Spike mediated SARS-CoV-2
tion, comprising a normally-distributed top-level distribu- evasion. medRxiv 10.1101/2020.12.05.20241927v2 [preprint]. 19 December
tion from which central estimates for each NHS region are 2020.
drawn. We report the mean and credible intervals of the 8. S. Kemp et al., Recurrent emergence and transmission of a SARS-CoV-2 Spike
top-level distribution when reporting model posterior esti- deletion ΔH69/V70. bioRxiv 10.1101/2020.12.14.422555 [preprint]. 21
Downloaded from http://science.sciencemag.org/ on March 8, 2021
mates for England. December 2020.
In model fitting, we assume that our deterministic 9. “Real-Time Assessment of Community Transmission findings” (2021);
www.imperial.ac.uk/medicine/research-and-impact/groups/react-study/real-
transmission model approximates the expectation over sto- time-assessment-of-community-transmission-findings/.
chastic epidemic dynamics. This is not exact (41) but the 10. N. G. Davies, R. C. Barnard, C. I. Jarvis, T. W. Russell, M. G. Semple, M. Jit, W. J.
error in this approximation is small for the population-level Edmunds, Association of tiered restrictions and a second lockdown with COVID-
processes we are modelling, as it decays with 1/N (42). This 19 deaths and hospital admissions in England: A modelling study. Lancet Infect.
approach is well developed for state space models of com- Dis. S1473-3099(20)30984-1 (2020). doi:10.1016/S1473-3099(20)30984-1
Medline
municable disease dynamics that fit an epidemic process to
11. Google, COVID-19 Community Mobility Reports (2021);
observed data via a stochastic observation process.
www.google.com/covid19/mobility/.
12. C. I. Jarvis, K. Van Zandvoort, A. Gimma, K. Prem, P. Klepac, G. J. Rubin, W. J.
Apparent growth of VOC 202012/01 not a result of Edmunds, CMMID COVID-19 Working Group, Quantifying the impact of physical
testing artefacts distance measures on the transmission of COVID-19 in the UK. BMC Med. 18, 124
The apparent frequency of VOC 202012/01 could be inflated (2020). doi:10.1186/s12916-020-01597-8 Medline
relative to reality if this variant leads to increased test- 13. COG-UK Consortium, Public Data & Analysis (2021);
seeking behavior (e.g., if it leads to a higher rate of symp- https://www.cogconsortium.uk/tools-analysis/public-data-analysis-2/.
toms than preexisting variants). However, this would not 14. L. Ferretti et al., The timing of COVID-19 transmission. medRxiv
10.1101/2020.09.04.20188516 [preprint]. 7 September 2020.
explain the growth in the relative frequency of VOC
15. N. G. Davies, A. J. Kucharski, R. M. Eggo, A. Gimma, W. J. Edmunds, T. Jombart,
202012/01 over time. Mathematically, if variant 1 has growth
K. O’Reilly, A. Endo, J. Hellewell, E. S. Nightingale, B. J. Quilty, C. I. Jarvis, T. W.
rate r1 and variant 2 has growth rate r2, the relative frequen- Russell, P. Klepac, N. I. Bosse, S. Funk, S. Abbott, G. F. Medley, H. Gibbs, C. A. B.
cy over time is a2 exp(r2t) / (a1 exp(r1t) + a2 exp(r2t)), where Pearson, S. Flasche, M. Jit, S. Clifford, K. Prem, C. Diamond, J. Emery, A. K. Deol,
a1 and a2 are the frequency of variant 1 and 2, respectively, S. R. Procter, K. van Zandvoort, Y. F. Sun, J. D. Munday, A. Rosello, M.
at time t = 0. However, if variant 1 has probability x of being Auzenbergs, G. Knight, R. M. G. J. Houben, Y. Liu, Effects of non-pharmaceutical
interventions on COVID-19 cases, deaths, and demand for hospital services in
reported and variant 2 has probability y, and both have the UK: A modelling study. Lancet Public Health 5, e375–e385 (2020).
growth rate r, the relative frequency over time is a2 y exp(rt) doi:10.1016/S2468-2667(20)30133-X Medline
/ (a1 x exp(rt) + a2 y exp(rt)), which is constant. 16. New and Emerging Respiratory Virus Threats Advisory Group, “NERVTAG
meeting on SARS-CoV-2 variant under investigation VUI-202012/01” (2020);
https://khub.net/documents/135939561/338928724/SARS-CoV-
REFERENCES AND NOTES 2+variant+under+investigation%2C+meeting+minutes.pdf/962e866b-161f-
1. Public Health England, “Investigation of novel SARS-COV-2 variant: Variant of 2fd5-1030-32b6ab467896.
Concern 202012/01” (2020); 17. S. Kissler, J. R. Fauver, C. Mack, C. G. Tai, M. I. Breban, A. E. Watkins, R. M.
www.gov.uk/government/publications/investigation-of-novel-sars-cov-2- Samant, D. J. Anderson, D. D. Ho, N. D. Grubaugh, Y. Grad, “Densely sampled
variant-variant-of-concern-20201201. viral trajectories suggest longer duration of acute infection with B.1.1.7 variant
2. Á. O’Toole, “Tracking the international spread of SARS-CoV-2 lineages B.1.1.7 and relative to non-B.1.1.7 SARS-CoV-2” (preprint, 2021);
B.1.351/501Y-V2” (2021); https://virological.org/t/tracking-the-international- https://dash.harvard.edu/handle/1/37366884.
spread-of-sars-cov-2-lineages-b-1-1-7-and-b-1-351-501y-v2/592. 18. N. G. Davies et al., Increased hazard of death in community-tested cases of
3. H. Gu, Q. Chen, G. Yang, L. He, H. Fan, Y.-Q. Deng, Y. Wang, Y. Teng, Z. Zhao, Y. SARS-CoV-2 Variant of Concern 202012/01. medRxiv
Cui, Y. Li, X.-F. Li, J. Li, N.-N. Zhang, X. Yang, S. Chen, Y. Guo, G. Zhao, X. Wang, 10.1101/2021.02.01.21250959 [preprint]. 11 February 2021.
D.-Y. Luo, H. Wang, X. Yang, Y. Li, G. Han, Y. He, X. Zhou, S. Geng, X. Sheng, S. 19. N. G. Davies, P. Klepac, Y. Liu, K. Prem, M. Jit, R. M. Eggo, CMMID COVID-19
Jiang, S. Sun, C.-F. Qin, Y. Zhou, Adaptation of SARS-CoV-2 in BALB/c mice for Working Group, Age-dependent effects in the transmission and control of
First release: 3 March 2021 www.sciencemag.org (Page numbers not final at time of first release) 7COVID-19 epidemics. Nat. Med. 26, 1205–1211 (2020). doi:10.1038/s41591-020- C. Unson-O’Brien, I. Shimeliovich, A. Gazumyan, M. Caskey, P. J. Bjorkman, R.
0962-9 Medline Casellas, T. Hatziioannou, P. D. Bieniasz, M. C. Nussenzweig, mRNA vaccine-
20. R. M. Viner, O. T. Mytton, C. Bonell, G. J. Melendez-Torres, J. Ward, L. Hudson, C. elicited antibodies to SARS-CoV-2 and circulating variants. Nature (2021).
Waddington, J. Thomas, S. Russell, F. van der Klis, A. Koirala, S. Ladhani, J. doi:10.1038/s41586-021-03324-6 Medline
Panovska-Griffiths, N. G. Davies, R. Booy, R. M. Eggo, Susceptibility to SARS- 31. K. T. D. Eames, N. L. Tilston, W. J. Edmunds, The impact of school holidays on the
CoV-2 Infection Among Children and Adolescents Compared With Adults: A social mixing patterns of school children. Epidemics 3, 103–108 (2011).
Systematic Review and Meta-analysis. JAMA Pediatr. 175, 143–156 (2021). doi:10.1016/j.epidem.2011.03.003 Medline
doi:10.1001/jamapediatrics.2020.4573 Medline 32. Danish Covid-19 Genome Consortium, “Genomic overview of SARS-CoV-2 in
21. K. W. Ng, N. Faulkner, G. H. Cornish, A. Rosa, R. Harvey, S. Hussain, R. Ulferts, C. Denmark” (2021); www.covid19genomics.dk/statistics.
Earl, A. G. Wrobel, D. J. Benton, C. Roustan, W. Bolland, R. Thompson, A. Agua- 33. M. Reichmuth, E. Hodcroft, J. Riou, C. L. Althaus, M. Schibler, I. Eckerle, L. Kaiser,
Doce, P. Hobson, J. Heaney, H. Rickman, S. Paraskevopoulou, C. F. Houlihan, K. F. Suter, M. Huber, A. Trkola, B. Hasse, J. Nilsson, R. Buonomano, A. Wepf, U.
Thomson, E. Sanchez, G. Y. Shin, M. J. Spyer, D. Joshi, N. O’Reilly, P. A. Walker, Karrer, R. Neher, “Transmission of SARS-CoV-2 variants in Switzerland” (2021);
S. Kjaer, A. Riddell, C. Moore, B. R. Jebson, M. Wilkinson, L. R. Marshall, E. C. https://ispmbern.github.io/covid-19/variants/.
Rosser, A. Radziszewska, H. Peckham, C. Ciurtin, L. R. Wedderburn, R. Beale, C.
Swanton, S. Gandhi, B. Stockinger, J. McCauley, S. J. Gamblin, L. E. McCoy, P. 34. “SARS-CoV-2 variants of concern in Switzerland” (2021); https://ibz-
Cherepanov, E. Nastouli, G. Kassiotis, Preexisting and de novo humoral immunity shiny.ethz.ch/covidDashboard/variant-plot/index.html.
to SARS-CoV-2 in humans. Science 370, 1339–1343 (2020). 35. N. L. Washington et al., Genomic epidemiology identifies emergence and rapid
doi:10.1126/science.abe1107 Medline transmission of SARS-CoV-2 B.1.1.7 in the United States. medRxiv
Downloaded from http://science.sciencemag.org/ on March 8, 2021
22. S. M. Kissler, C. Tedijanto, E. Goldstein, Y. H. Grad, M. Lipsitch, Projecting the 10.1101/2021.02.06.21251159 [preprint]. 7 February 2021.
transmission dynamics of SARS-CoV-2 through the postpandemic period. 36. Helix OpCo LLC, helix-covid19db (2021); https://github.com/myhelix/helix-
Science 368, 860–868 (2020). doi:10.1126/science.abb5793 Medline covid19db.
23. S. A. Frank, Models of parasite virulence. Q. Rev. Biol. 71, 37–78 (1996). 37. S. Abbott, J. Hellewell, R. N. Thompson, K. Sherratt, H. P. Gibbs, N. I. Bosse, J. D.
doi:10.1086/419267 Medline Munday, S. Meakin, E. L. Doughty, J. Y. Chun, Y.-W. D. Chan, F. Finger, P.
24. Public Health England, “National flu and COVID-19 surveillance reports” (2020); Campbell, A. Endo, C. A. B. Pearson, A. Gimma, T. Russell, S. Flasche, A. J.
www.gov.uk/government/statistics/national-flu-and-covid-19-surveillance- Kucharski, R. M. Eggo, S. Funk, Estimating the time-varying reproduction
reports. number of SARS-CoV-2 using national and subnational case counts. Wellcome
Open Res. 5, 112 (2020). doi:10.12688/wellcomeopenres.16006.2
25. H. Tegally et al., Emergence and rapid spread of a new severe acute respiratory
syndrome-related coronavirus 2 (SARS-CoV-2) lineage with multiple spike 38. T. Ganyani, C. Kremer, D. Chen, A. Torneri, C. Faes, J. Wallinga, N. Hens,
mutations in South Africa. medRxiv 10.1101/2020.12.21.20248640 [preprint]. 22 Estimating the generation interval for coronavirus disease (COVID-19) based on
December 2020. symptom onset data, March 2020. Eurosurveillance 25, 2000257 (2020).
doi:10.2807/1560-7917.ES.2020.25.17.2000257 Medline
26. C. A. B. Pearson, T. W. Russell, N. G. Davies, A. J. Kucharski, CMMID COVID-19
Working Group, W. J. Edmunds, R. M. Eggo, “Estimates of severity and 39. K. Sherratt et al., Evaluating the use of the reproduction number as an
transmissibility of novel SARS-CoV-2 variant 501Y.V2 in South Africa” (CMMID epidemiological tool, using spatio-temporal trends of the Covid-19 outbreak in
Repository, 2021); https://cmmid.github.io/topics/covid19/sa-novel- England. medRxiv 10.1101/2020.10.18.20214585 [preprint]. 20 October 2020.
variant.html. 40. S. Abbott, EpiNow (2020); https://zenodo.org/record/3957490#.X-JX-
27. F. Naveca, C. da Costa, V. Nascimento, V. Souza, A. Corado, F. Nascimento, Á. en7SHE.
Costa, D. Duarte, G. Silva, M. Mejía, K. Pessoa, L. Gonçalves, M. J. Brandão, M. 41. D. Mollison, Spatial Contact Models for Ecological and Epidemic Spread. J. R.
Jesus, R. Pinto, M. Silva, T. Mattos, L. Abdalla, J. H. Santos, R. Costa-Filho, G. L. Stat. Soc. Ser. A 39, 283–313 (1977).
Wallau, M. M. Siqueira, E. Delatorre, T. Gräf, G. Bello, P. C. Resende, “SARS-CoV- 42. S. N. Ethier, T. G. Kurtz, Markov Processes: Characterization and Convergence
2 reinfection by the new Variant of Concern (VOC) P.1 in Amazonas, Brazil” (Wiley, 1986).
(virological.org, 2021); https://virological.org/t/sars-cov-2-reinfection-by-the-
43. N. G. Davies, Analysis data and code for “Estimated transmissibility and impact
new-variant-of-concern-voc-p-1-in-amazonas-brazil/596.
of SARS-CoV-2 lineage B.1.1.7 in England” (Zenodo, 2021);
28. E. C. Thomson, L. E. Rosen, J. G. Shepherd, R. Spreafico, A. da Silva Filipe, J. A. https://zenodo.org/record/4562961.
Wojcechowskyj, C. Davis, L. Piccoli, D. J. Pascall, J. Dillen, S. Lytras, N.
44. A. Rambaut, E. C. Holmes, Á. O’Toole, V. Hill, J. T. McCrone, C. Ruis, L. du Plessis,
Czudnochowski, R. Shah, M. Meury, N. Jesudason, A. De Marco, K. Li, J. Bassi, A.
O. G. Pybus, A dynamic nomenclature proposal for SARS-CoV-2 lineages to
O’Toole, D. Pinto, R. M. Colquhoun, K. Culap, B. Jackson, F. Zatta, A. Rambaut, S.
assist genomic epidemiology. Nat. Microbiol. 5, 1403–1407 (2020).
Jaconi, V. B. Sreenu, J. Nix, I. Zhang, R. F. Jarrett, W. G. Glass, M. Beltramello, K.
doi:10.1038/s41564-020-0770-5 Medline
Nomikou, M. Pizzuto, L. Tong, E. Cameroni, T. I. Croll, N. Johnson, J. Di Iulio, A.
Wickenhagen, A. Ceschi, A. M. Harbison, D. Mair, P. Ferrari, K. Smollett, F. 45. J. Helske, KFAS: Exponential family state space models in R. J. Stat. Softw. 78,
Sallusto, S. Carmichael, C. Garzoni, J. Nichols, M. Galli, J. Hughes, A. Riva, A. Ho, 10.18637/jss.v078.i10 (2017). doi:10.18637/jss.v078.i10
M. Schiuma, M. G. Semple, P. J. M. Openshaw, E. Fadda, J. K. Baillie, J. D. 46. J. T. Morton, C. Marotz, A. Washburne, J. Silverman, L. S. Zaramela, A. Edlund, K.
Chodera, S. J. Rihn, S. J. Lycett, H. W. Virgin, A. Telenti, D. Corti, D. L. Robertson, Zengler, R. Knight, Establishing microbial composition measurement standards
G. Snell, ISARIC4C Investigators, COVID-19 Genomics UK (COG-UK) Consortium, with reference frames. Nat. Commun. 10, 2719 (2019). doi:10.1038/s41467-019-
Circulating SARS-CoV-2 spike N439K variants maintain fitness while evading 10656-5 Medline
antibody-mediated immunity. Cell 10.1016/j.cell.2021.01.037 (2021).
47. A. D. Washburne, D. E. Crowley, D. J. Becker, K. R. Manlove, M. L. Childs, R. K.
doi:10.1016/j.cell.2021.01.037 Medline
Plowright, Percolation models of pathogen spillover. Philos. Trans. R. Soc.
29. E. Mahase, Covid-19: Novavax vaccine efficacy is 86% against UK variant and London Ser. B 374, 20180331 (2019). doi:10.1098/rstb.2018.0331 Medline
60% against South African variant. BMJ 372, n296 (2021). Medline
48. M. Travisano, R. E. Lenski, Long-term experimental evolution in Escherichia coli.
30. Z. Wang, F. Schmidt, Y. Weisblum, F. Muecksch, C. O. Barnes, S. Finkin, D. IV. Targets of selection and the specificity of adaptation. Genetics 143, 15–26
Schaefer-Babajew, M. Cipolla, C. Gaebler, J. A. Lieberman, T. Y. Oliveira, Z. Yang, (1996). doi:10.1093/genetics/143.1.15 Medline
M. E. Abernathy, K. E. Huey-Tubman, A. Hurley, M. Turroja, K. A. West, K.
49. L.-M. Chevin, On measuring selection in experimental evolution. Biol. Lett. 7,
Gordon, K. G. Millard, V. Ramos, J. D. Silva, J. Xu, R. A. Colbert, R. Patel, J. Dizon,
First release: 3 March 2021 www.sciencemag.org (Page numbers not final at time of first release) 8210–213 (2011). doi:10.1098/rsbl.2010.0580 Medline 68. A. T. Levin, W. P. Hanage, N. Owusu-Boaitey, K. B. Cochran, S. P. Walsh, G.
50. T. Day, S. Gandon, Applying population-genetic models in theoretical Meyerowitz-Katz, Assessing the age specificity of infection fatality rates for
evolutionary epidemiology. Ecol. Lett. 10, 876–888 (2007). doi:10.1111/j.1461- COVID-19: Systematic review, meta-analysis, and public policy implications. Eur.
0248.2007.01091.x Medline J. Epidemiol. 35, 1123–1138 (2020). doi:10.1007/s10654-020-00698-1 Medline
51. S. W. Park, B. M. Bolker, D. Champredon, D. J. D. Earn, M. Li, J. S. Weitz, B. T. 69. D. Simpson, “Statistical Modeling, Causal Inference, and Social Science” (2018);
Grenfell, J. Dushoff, Reconciling early-outbreak estimates of the basic https://statmodeling.stat.columbia.edu/2018/04/03/justify-my-love/.
reproductive number and its uncertainty: Framework and applications to the 70. S. A. Lauer, K. H. Grantz, Q. Bi, F. K. Jones, Q. Zheng, H. R. Meredith, A. S. Azman,
novel coronavirus (SARS-CoV-2) outbreak. J. R. Soc. Interface 17, 20200144 N. G. Reich, J. Lessler, The Incubation Period of Coronavirus Disease 2019
(2020). doi:10.1098/rsif.2020.0144 Medline (COVID-19) From Publicly Reported Confirmed Cases: Estimation and
52. J. Wallinga, M. Lipsitch, How generation intervals shape the relationship between Application. Ann. Intern. Med. 172, 577–582 (2020). doi:10.7326/M20-0504
growth rates and reproductive numbers. Proc. R. Soc. B 274, 599–604 (2007). Medline
doi:10.1098/rspb.2006.3754 Medline 71. Q. Li, X. Guan, P. Wu, X. Wang, L. Zhou, Y. Tong, R. Ren, K. S. M. Leung, E. H. Y.
53. E. B. Hodcroft et al., Emergence and spread of a SARS-CoV-2 variant through Lau, J. Y. Wong, X. Xing, N. Xiang, Y. Wu, C. Li, Q. Chen, D. Li, T. Liu, J. Zhao, M.
Europe in the summer of 2020. medRxiv 10.1101/2020.10.25.20219063 Liu, W. Tu, C. Chen, L. Jin, R. Yang, Q. Wang, S. Zhou, R. Wang, H. Liu, Y. Luo, Y.
[preprint]. 27 November 2020. Liu, G. Shao, H. Li, Z. Tao, Y. Yang, Z. Deng, B. Liu, Z. Ma, Y. Zhang, G. Shi, T. T. Y.
Lam, J. T. Wu, G. F. Gao, B. J. Cowling, B. Yang, G. M. Leung, Z. Feng, Early
54. W. J. Browne, S. V. Subramanian, K. Jones, H. Goldstein, Variance partitioning in Transmission Dynamics in Wuhan, China, of Novel Coronavirus-Infected
multilevel logistic models that exhibit overdispersion. J. R. Stat. Soc. Ser. A 168, Pneumonia. N. Engl. J. Med. 382, 1199–1207 (2020).
Downloaded from http://science.sciencemag.org/ on March 8, 2021
599–613 (2005). doi:10.1111/j.1467-985X.2004.00365.x doi:10.1056/NEJMoa2001316 Medline
55. Comprehensive R Archive Network, “Transformations and link functions in 72. H. Nishiura, N. M. Linton, A. R. Akhmetzhanov, Serial interval of novel coronavirus
emmeans”; https://cran.r- (COVID-19) infections. Int. J. Infect. Dis. 93, 284–286 (2020).
project.org/web/packages/emmeans/vignettes/transformations.html#bias- doi:10.1016/j.ijid.2020.02.060 Medline
adj.
73. Q. Bi, Y. Wu, S. Mei, C. Ye, X. Zou, Z. Zhang, X. Liu, L. Wei, S. A. Truelove, T.
56. B. Ripley, “Feed-Forward Neural Networks and Multinomial Log-Linear Models” Zhang, W. Gao, C. Cheng, X. Tang, X. Wu, Y. Wu, B. Sun, S. Huang, Y. Sun, J.
[R package nnet version 7.3-14] (2020); https://cran.r- Zhang, T. Ma, J. Lessler, T. Feng, Epidemiology and transmission of COVID-19 in
project.org/package=nnet. 391 cases and 1286 of their close contacts in Shenzhen, China: A retrospective
57. Comprehensive R Archive Network, “Models supported by emmeans”; cohort study. Lancet Infect. Dis. 20, 911–919 (2020). doi:10.1016/S1473-
https://cran.r-project.org/web/packages/emmeans/vignettes/models.html. 3099(20)30287-5 Medline
58. Public Health England; Coronavirus in the UK; 74. J. Mossong, N. Hens, M. Jit, P. Beutels, K. Auranen, R. Mikolajczyk, M. Massari, S.
https://coronavirus.data.gov.uk/details/healthcare. Salmaso, G. S. Tomba, J. Wallinga, J. Heijne, M. Sadkowska-Todys, M. Rosinska,
59. Office for National Statistics Geography Teams, “Covid 19 local restriction tiers W. J. Edmunds, Social contacts and mixing patterns relevant to the spread of
by area”; https://github.com/ONSgeo/Covid19_Tiers. infectious diseases. PLOS Med. 5, e74 (2008).
doi:10.1371/journal.pmed.0050074 Medline
60. H. Gibbs, C. I. Jarvis, R. M. Eggo, uk_tier_data (2021); DOI:
10.5281/zenodo.4421649. 75. Office for National Statistics, “Population estimates for the UK, England and
Wales, Scotland and Northern Ireland: Mid-2018” (2019);
61. S. Abbott, J. Hickson, H. S. Badr, S. Funk, P. Ellis, P. Monticone, J. D. Munday, J.
www.ons.gov.uk/peoplepopulationandcommunity/populationandmigration/pop
Allen, C. A. B. Pearson, S. Meakin, EpiNow2; DOI: 10.5281/zenodo.3957489.
ulationestimates/bulletins/annualmidyearpopulationestimates/mid2018.
62. P.-C. Bürkner, Advanced Bayesian Multilevel Modeling with the R Package brms.
R J. 10, 395–411 (2018). doi:10.32614/RJ-2018-017
ACKNOWLEDGMENTS
63. Public Health England, “Investigation of novel SARS-CoV-2 variant Variant of
Three anonymous reviewers gave helpful suggestions. We thank Public Health Eng-
Concern 202012/01: Technical briefing 3” (2021);
land, COG-UK Consortium volunteers (UK); the Danish Covid-19 Genome Consorti-
https://assets.publishing.service.gov.uk/government/uploads/system/upload
um, the Statens Serum Institut (DK); Christian Althaus, Tanja Stadler, Lorenz Risch,
s/attachment_data/file/950823/Variant_of_Concern_VOC_202012_01_Techni
the Geneva University Hospitals, the Swiss Viollier Sequencing Consortium at ETH
cal_Briefing_3_-_England.pdf.
Zürich, the Risch laboratory, the University Hospital Basel, the Institute for Infectious
64. R. V. Lenth, Estimated Marginal Means, aka Least-Squares Means [R package Diseases at University of Bern, the Swiss National Covid-19 Science Task Force (CH);
emmeans version 1.5.3] (2020); https://cran.r-project.org/package=emmeans. and Helix OpCo, LLC (US) for providing data. Sharon Peacock, Ewan Harrison, Mads
65. C. J. F. T. Braak, C. J. F. Ter Braak, A Markov Chain Monte Carlo version of the Albertsen, Christian Althaus, Tanja Stadler, Lorenz Risch, and Karthik Gangavarapu
genetic algorithm Differential Evolution: Easy Bayesian computing for real facilitated data access. Alex Selby suggested improvements to the analysis code.
parameter spaces. Stat. Comput. 16, 239–249 (2006). doi:10.1007/s11222-006- Troy Day gave useful advice for calculating selective benefit and transmission ad-
8769-1 vantage. Stefan Flasche, Rein Houben, Stéphane Hué, Yalda Jafari, Mihály Koltai,
Fabienne Krauer, Yang Liu, Rachel Lowe, Billy Quilty, and Julián Villabona Arenas
66. A. B. Docherty, E. M. Harrison, C. A. Green, H. E. Hardwick, R. Pius, L. Norman, K.
gave input during conception and manuscript drafting. Funding: NGD: UK Research
A. Holden, J. M. Read, F. Dondelinger, G. Carson, L. Merson, J. Lee, D. Plotkin, L.
and Innovation (UKRI) Research England; National Institute for Health Research
Sigfrid, S. Halpin, C. Jackson, C. Gamble, P. W. Horby, J. S. Nguyen-Van-Tam, A.
(NIHR) Health Protection Research Unit in Immunisation (NIHR200929); UK Medical
Ho, C. D. Russell, J. Dunning, P. J. Openshaw, J. K. Baillie, M. G. Semple, Features
Research Council (MRC) (MC_PC_19065). SA: Wellcome Trust (WT)
of 20,133 UK patients in hospital with covid-19 using the ISARIC WHO Clinical
(210758/Z/18/Z). RCB: European Commission (EC) (EpiPose 101003688). CIJ:
Characterisation Protocol: Prospective observational cohort study. BMJ 369,
Global Challenges Research Fund managed through Research Councils UK and the
m1985 (2020). doi:10.1136/bmj.m1985 Medline
Economic and Social Research Council (RECAP ES/P010873/1). AJK: WT
67. H. Salje, C. Tran Kiem, N. Lefrancq, N. Courtejoie, P. Bosetti, J. Paireau, A. (206250/Z/17/Z); NIHR (NIHR200908). JDM: WT (210758/Z/18/Z). CABP: Bill &
Andronico, N. Hozé, J. Richet, C.-L. Dubost, Y. Le Strat, J. Lessler, D. Levy-Bruhl, Melinda Gates Foundation (BMGF) (OPP1184344); UK Foreign, Commonwealth and
A. Fontanet, L. Opatowski, P.-Y. Boelle, S. Cauchemez, Estimating the burden of Development Office (FCDO) / WT (221303/Z/20/Z). TWR: WT (206250/Z/17/Z).
SARS-CoV-2 in France. Science 369, 208–211 (2020). AG: EC (EpiPose 101003688). WW: NIHR (COV0335), MRC (MR/V027956/1). KvZ:
doi:10.1126/science.abc3517 Medline
First release: 3 March 2021 www.sciencemag.org (Page numbers not final at time of first release) 9You can also read