Colombian dry moist forest transitions in the Llanos Orientales-A comparison of model and pollen-based biome reconstructions
←
→
Page content transcription
If your browser does not render page correctly, please read the page content below
Palaeogeography, Palaeoclimatology, Palaeoecology 234 (2006) 28 – 44
                                                                                                            www.elsevier.com/locate/palaeo

Colombian dry moist forest transitions in the Llanos Orientales—A
  comparison of model and pollen-based biome reconstructions
                    Robert Marchant a,*, Juan Carlos Berrı́o b,c, Hermann Behling d,
                               Arnoud Boom b, Henry Hooghiemstra e
                               a
                                     Environmental Department, University of York, Heslington, York, YO103DD, UK
                              b
                                    Department of Geography, University of Leicester, University Road, Leicester, UK
                      c
                        Instituto de Ciencias Naturales (ICN), Universidad Nacional de Colombia, A.A. 7495, Bogotá, Colombia
                                     d
                                       Centre for Tropical Ecology, Fahrenheitstrass. 1, D-28359 Bremen, Germany
     e
         Institute of Biodiversity and Ecosystem Dynamics, University of Amsterdam, Postbus 94062, 1090 GB Amsterdam, The Netherlands
                                                 Received 23 July 2004; accepted 20 October 2005

Abstract

    Colombian vegetation, at the ecological level of the biome, is reconstructed at six sites using pollen data assigned a priori to plant
functional types and biomes. The chosen sites incorporate four savanna sites (Laguna Sardinas, Laguna Angel, El Piñal and Laguna
Carimagua), a site on the transition between savanna and Amazon rainforest (Loma Linda) and a site within the Amazon rainforest
(Pantano de Monica). The areal extent of tropical moist forest, tropical dry forest and steppe have been subject to significant change:
differential responses of the vegetation to climatic shifts are related to changes in plant available moisture, duration of dry season and
edaphic controls on the vegetation. The record from El Piñal shows that the present-day savanna vegetation, dominated by steppe
(Poaceae) with little occurrence of woody savanna taxa (e.g. Curatella, Byrsonima), was present since the last glacial period of the
northern hemisphere. Unfortunately, El Piñal is located on an edaphic savanna and is not particularly responsive to registering
change. Most records cover the early Holocene; one site records the El Abra stadial (Younger Dryas equivalent), when forest
expansion reflects more humid climatic conditions and higher plant available moisture. During the early and middle Holocene, the
maximum expansion of steppe and tropical dry forest occurred, indicating that dry climatic conditions continued to around 4000 14C
BP. The following period, from shortly before 4000 14C BP, is characterised by an increase in forest and gallery forests, reflecting a
wetter period probably with a shorter annual dry season. Anthropogenic influence on the vegetation is recorded by all the records
over the last millennial, particularly characterised by a reduction in forest cover and high amplitude changes in vegetation.
    Biome transitions from one type to another, and the environmental controls on this shift, are investigated by applying a
vegetation model (BIOME-3). The model uses climatic data from six meteorological stations that, encompass a range of
environments within lowland Colombia, which are similar to the pollen data. The signals of vegetation change can be translated
to the main environmental controls of temperature and moisture to indicate the degree of change needed in these parameters to
record the vegetation change depicted by the pollen data. Moisture balance is the dominant control on driving vegetation change
whether under seasonal or annual control. The combined reconstruction from pollen data and model output of biome-scale
vegetation dynamics for lowland Colombia allows an understanding of the environmental controls to be developed.
D 2005 Elsevier B.V. All rights reserved.

Keywords: Biome; Colombia; Environmental change; Llanos Orientales; Pollen; Vegetation modelling

 * Corresponding author. Tel.: +44 1904 434061.
   E-mail address: rm524@york.ac.uk (R. Marchant).

0031-0182/$ - see front matter D 2005 Elsevier B.V. All rights reserved.
doi:10.1016/j.palaeo.2005.10.028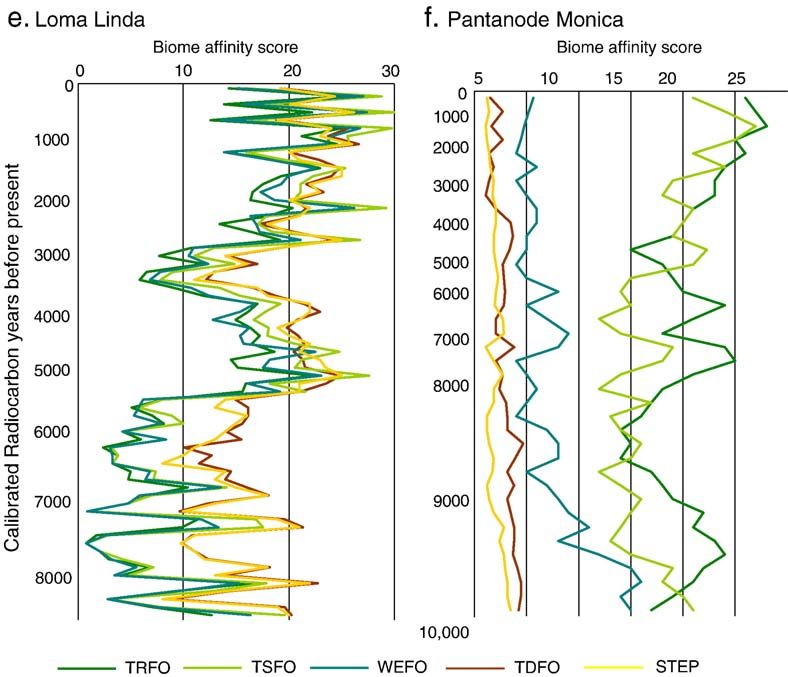
R. Marchant et al. / Palaeogeography, Palaeoclimatology, Palaeoecology 234 (2006) 28–44            29

1. Introduction                                                    2. Area descriptions, methods and material studied

    The history of dry ecosystems in the Neotropics, and           2.1. Environment and vegetation
in Colombia in particular, is poorly understood as few
natural archives (lakes, mires) accumulate sediments                   The Llanos Orientales is a large low-lying plain in
over long time periods, subsequently recording evidence            the northeast of Colombia situated to the east of the
of environmental change. From those sites available,               Andes and to the north of Amazonia. Climate in
lowland tropical ecosystems are shown to be highly                 Llanos Orientales can be classified as tropical diurnal;
dynamic, even at the course ecological resolution of               differences in monthly temperature are generally small
the biome. For instance, the vegetation at lowland sites           although daily fluctuations may be large (20 8C),
has changed from tropical rain forest to tropical seasonal         especially during the dry seasons. The climate is
forest to steppe biomes since 18,000 14C BP (Marchant              dominated by two systems: the Inter-Tropical Conver-
et al., 2002a). More broadly, a synthesis of all pollen            gence Zone (ITCZ) and moisture derived from the
data from Neotropical savannas, north and south of the             Atlantic Ocean. The two rainy seasons, from March
equator, showed that these expanded in areal extent                to May, and October to December, are separated by
during the full glacial times due to markedly drier cli-           dry seasons January to February, and June to Septem-
matic conditions (Behling and Hooghiemstra, 2001).                 ber. The average precipitation is 950 mm yr 1 with an
Spatial and temporal foci on Colombia have investigated            average of 175 mm in March (Berrio et al., 2003);
vegetation change along an altitudinal gradient (March-            however, there is considerable variation in this (IGAC,
ant et al., 2001a), during the past 6000 years at sub-             1998). A strong environmental gradient has an edaph-
millennial resolution (Marchant et al., 2001b), 3000 year          ic, rather than a climatic, basis: extensive sandstone
intervals back to the Last Glacial Maximum (LGM)                   areas in the east of Colombia provide a free-draining
(Marchant et al., 2002a), and over the last 450,000                substrate, and hence a water-stressed environment for
years (Marchant et al., 2002b). These previous applica-            the vegetation that resulted in open tropical dry forest
tions demonstrate the sensitivity of the Colombian pol-            and steppe biomes.
len data to register environmental change due to the                   The vegetation of lowland Colombia has been de-
underlying data being of a high quality (floristically             scribed by Cuatrecasas (1958) who determined vege-
diverse and with good radiocarbon dated chronologies)              tation zones based mainly on altitude, climate
and quantity. In addition to providing a method to                 (predominately rainfall) and aspect. Dry forest ecosys-
investigate vegetation response, biome-based environ-              tems form a substantial part of the vegetation in
mental reconstructions can also provide an excellent               Colombia, the composition of these, mainly based
validation tool for vegetation model-based reconstruc-             on data from the Caribbean, has been documented
tions (Clausen and Esch, 1994; Marchant et al., in press;          by Gentry (1995). Areas characterised by xerophytic
Jolly et al., 1998a,b) that can be used to isolate and             vegetation are found in the Caribbean plains (Murphy
manipulate environmental variables such as tempera-                and Lugo, 1995), Cauca, Magdalena and Patia valleys,
ture, precipitation, the seasonal variations of these, and         and in the Chicamocha canyon. Dugand (1941, 1970)
changes in CO2 concentration ([CO2]atm) (Foley et al.,             studied the dry forests in the Caribbean lowlands and
1996; Marchant et al., 2002b). New insights into vege-             the dry deciduous forest on the Magdalena flood-
tation response to environmental change derived from               plains. The main arboreal taxa on the flat valley
new techniques lead to a re-evaluation of how vegetation           floor and the hills, where fires occur frequently, are
dynamics reflect climate change. For example, in                   Byrsonima crassifolia, Curatella americana and
Colombia analysis of compound-specific carbon-decay                Scheelea butyraceae. The flora of the Llanos Orien-
compounds has led to a re-evaluation of the oscillation            tales is complicated by a dense drainage network that
of tropical vegetation belts in response to climate                dissects plain feeding into the Orinoco drainage sys-
change; sub-components of the vegetation belts, partic-            tem (Fig. 1); along these rivers gallery forest grows
ularly the balance between C3 and C4 grasses behave                with a floristic composition, at the generic and family
differentially to past climate change (Boom et al., 2002).         level, similar to that of Amazonian rainforest (Sal-
The focus of the current investigation is to extend this           gado-Labouriau, 1997). Although steppe senso stricto
approach to apply a vegetation model (BIOME-3) and                 does not occur in Colombia, this terminology main-
compare the reconstruction with those derived from                 tains consistency with the Latin American reconstruc-
pollen data from the Llanos Orientales and its extension           tion (Marchant et al., submitted for publication) rather
to dry/moist forest transitions.                                   than a more appropriate term such as dgrass savannaT.
30                          R. Marchant et al. / Palaeogeography, Palaeoclimatology, Palaeoecology 234 (2006) 28–44

                                                                               Latin American Pollen Database (http://www.ngdc.
                                                                               noaa.gov/paleo.html). The sites were chosen as they
                                                                               form a gradient of decreasing savanna nature; from
                                                                               strong edaphic savanna (El Piñal) to tropical rainforest
                                                                               (Pantano de Monica) (Table 1). To enable cross-site
                                                                               comparisons radiocarbon dates were used to apply a
                                                                               linear age–depth model for each site. Radiocarbon dates
                                                                               are standardised as calibrated ages by using calibration
                                                                               curves derived from the Calib 4.3 computer software
                                                                               (Stuiver et al., 1998; http://radiocarbon.pa.qub.ac.uk/
                                                                               calib/calib.html). Applicability of this method to pro-
                                                                               vide dating control was checked, again on a site-by-site
                                                                               basis, for sedimentary contemporaneity (in terms of
                                                                               sedimentary hiatuses and rapid changes in sediment
                                                                               type about the radiocarbon data) and dating problems
                                                                               (such as age reversals and large standard errors attached
                                                                               to uncalibrated radiocarbon dates).

                                                                               2.3. Method for translating pollen data to biomes

                                                                                   Before the pollen data can be analysed it is necessary
                                                                               to determine a classification of the potential vegetation
                                                                               types as sensed through the pollen data. The range of
                                                                               PFTs and biomes are determined specifically for dry
Fig. 1. Map of Colombia indicating the site locations refereed to in the       moist forest, how the former combine to describe the
text; those sites where pollen data are available are denoted by a
                                                                               latter, are presented in Table 2. The PFTs that charac-
circle, the meteorological station locations are denoted by a square.
The numbers in each of the symbol relate to location details presented         terise vegetation on the Llanos Orientales can be placed
in Tables 1 and 4 for the palaeoecological sites and the meteorological        into two main groups: tropical (non-frost tolerant) and
stations, respectively.                                                        xerophytic (drought tolerant). The Colombian pollen
                                                                               taxa were assigned to one or more of the PFTs (Table
2.2. Material studied                                                          3) depending on the modern ecological range of the
                                                                               parent taxa responsible for producing the pollen. These
    Over the past five decades, palynologists have col-                        assignments were made following reference to a wide
lected numerous pollen-based records from Colombia.                            body of evidence from several floras, botanical and
These were concentrated initially, in common with                              palynological studies and personal communication
many tropical areas, at high altitudes (Van der Ham-                           with modern ecologists and palaeoecologists as collated
men, 1962; Van Geel and Van der Hammen, 1973);                                 within a dictionary of the distribution and ecological
more recently there has been a focus on low altitude                           requirements of the parent taxa (Marchant et al.,
sites (Behling and Hooghiemstra, 1999; Berrı́o et al.,                         2002c). Prior to the analysis aquatic and fern taxa
2000a,b, 2002). All data used here are the raw pollen                          were removed from the analysis as these commonly
counts that are currently being prepared for entry to the                      respond to very specific local environmental condi-

Table 1
Location of Colombian sites with pollen data that are included within our analysis
Site                  No.    Longitude Latitude Altitude Age range Present biome Sample type RC             Site publications
El Piñal             1        70.40        4.09     185        0–19,000     STEP          Lake         8   Behling   and Hooghiemstra,   1999
Carimagua             2        77.95        1.80      10        0–8270       TDFO          Lake         6   Behling   and Hooghiemstra,   1999
Sardinas              3        69.45        4.95      80        0–11,570     TSFO          Lake         7   Behling   and Hooghiemstra,   1998
Angel                 4        70.58        4.45     205        0–10,000     STEP          Lake         7   Behling   and Hooghiemstra,   1998
Loma Linda            5        73.45        3.34     310        0–8700       TSFO          Lake         8   Behling   and Hooghiemstra,   1998
Pantano de Monica     6        72.08        0.66     160        0–11,570     TRFO          Lake         9   Behling   et al., 1999a
Each site is assigned a numerical code that relates to the site identifiers on Fig. 1.
R. Marchant et al. / Palaeogeography, Palaeoclimatology, Palaeoecology 234 (2006) 28–44 31
Table 2 Output from the biomisation analysis is in the form
Plant functional types (PFTs) and biomes determined for the investi- of a range of daffinity scoresT to the a prior determined
gation on dry–moist forest dynamics
biomes for each depth analysed. In the previous large-
Codes Plant functional types
scale applications the highest affinity score has been
g Grass used for mapping as a colour-coded circle relating to
Tr1 Wet tropical raingreen trees
the biome with the highest affinity score for each site in
Tr2 Dry tropical raingreen trees
Te1 Wet tropical evergreen trees the analysis (Marchant et al., 2001b, 2002a). Although
Te2 Dry tropical evergreen trees this is suitable for the reconstructions possible at a large
txts Tropical xerophytic trees and shrubs continental/sub-continental scale, when investigating a
tf Tropical forbs/herbs small area, more information can be derived from the
tef Temperate forbs/herbs
analysis.
sf Steppe forbs/herbs
wte Warm temperate broadleafed evergreen trees and shrubs
2.4. Vegetation modelling
Codes Biomes Plant functional types
TRFO Tropical Rain Forest Tr1, Te1, tf
The BIOME-3 vegetation model is a biogeography-
TSFO Tropical Seasonal Forest Tr2, Te2, tf, wte based model that predicts PFT dominance based on
TDFO Tropical Dry Forest Tr2, Te2, txts, sf, tef environmental conditions, ecophysiological constraints
WEFO Warm Evergreen Forest Te2 tf, wte and resource limitations (Prentice et al., 1992). Inputs to
STEP Steppe g, Tr2, sf BIOME-3 are temperature, precipitation, cloudiness,
The table also indicates how each biome is described by a unique set soil texture, atmospheric pressure and [CO2]atm (Fig.
of PFTs. 2). The level of [CO2]atm prescribed to BIOME-3 has a
direct influence on gross primary productivity via a
tions, particularly hydrology, rather than being reflec- photosynthetic algorithm and competitive balance bet-
tive of wider environment controls that are the focus of ween C3 and C4 plants (Haxeltine and Prentice, 1996).
our investigation. Following this input, a coupled carbon and water flux
Table 3
Assignment of pollen taxa from the sites presented in Table 1 to the PFTs presented in Table 3
PFT codes Pollen taxa
g Poaceae
Tr1 Acalypha, Aegiphila, Alchornea, Anthodiscus, Anthostomella fuegiana, Apocynaceae, Araliaceae, Arecaceae, Arcella,
Bombacaceae, Croton, Crotalaria, Heliocarpus, Humiria, Inga, Lamanonia, Loranthaceae, Macrolobium, Malpighiaceae,
Malvaceae, Mauritia, Moraceae, Oreopanax, Piper, Rhipsalis, Rubiaceae, Rutaceae, Tiliaceae, Urticaceae, Vismia
Tr2 Acalypha, Alibertia, Andira-type, Annona, Bignoniaceae, Byrsonima, Casearia-type, Copaifera, Cordia, Coriaria, Cuphea,
Curatella, Hieronima, Ipomoea, Mauritia, Meliaceae, Meliosma, Mimosa, Palicourea, Panopsis, Piper, Rosaceae, Schinus,
Trema, Vallea, Warswiczia, Xylosma
Te1 Alchornea, Amanoa, Anacardiaceae, Anemia, Apeiba, Apocynaceae, Arecaceae, Astronium, Bombacaceae, Brunellia,
Cecropia, Celastraceae, Celtis, Clethera, Combretaceae, Didymopanax, Euphorbiaceae, Euterpe, Fabaceae, Ficus, Humulus,
Iriartea, Mabea, Macrolobium, Mauritia, Maripa, Maytenus, Meliaceae, Menispermaceae, Moraceae, Myrsine, Myrtaceae,
Ocotea-type, Oreopanax, Rauvolfia, Sapium, Sapotaceae, Sophora, Taperira, Tournefortia, Vismia
Te2 Bauhinia, Bignoniaceae, Boraginaceae, Bromeliaceae, Brosimum, Brunellia, Bulnesia, Bursera, Caryophyllaceae, Casearia-
type, Cecropia, Celtis, Crotolaria, Didymopanax, Humiria, Inga, Leguminosae, Macrocarpea, Metopium, Sapium, Schinus,
Strutanthus, Taperira, Vitis, Xylosma
txts Acalypha, Alternanthera, Anacardiaceae, Bauhinia, Byrsonima, Byttneria, Caryocar, Clusia, Copaifera, Cuphea, Curatella,
Evolvus, Ipomoea, Protium, Siparuna, Stryphnodendron
tf Acanthaceae, Apiaceae, Apium, Asteraceae, Begonia, Bromeliaceae, Calyceraceae, Genipa, Gomphorena, Gunnera,
Hebenaria, Jungia, Justicia, Ranunculaceae, Rubiaceae, Scrophulariaceae, Siparuna, Thalictrum, Urticaceae, Verbenaceae,
Viburnum, Xyris
tef Acanthaceae, Apiaceae, Apium, Asteraceae, Borreria, Bravaisia, Bromeliaceae, Euphorbia, Galium, Genipa, Gomphrena,
Gunnera, Halenia, Hebenaria, Iresine, Iridaceae, Jungia, Justicia, Malvaceae, Moraceae, Nertea, Stevia, Umbelliferae,
Urticaceae, Xyris, Zornia
sf Amaranthaceae/Chenopodiaceae, Anarcardiaceae, Apiaceae, Borreria, Caryophyllaceae, Ephedra, Eriocaulon, Eriogonum,
Euphorbiaceae, Gaimardia, Gilia, Gleichenia, Gomphrena, Halenia, Hebenaria, Lamiaceae, Mutisia, Polygala,
Rhamanaceae, Xyris
wte Acalypha, Aegiphila, Alchornea, Alibertia, Allophylus, Araliaceae, Brunellia, Clusia, Croton, Crotolaria, Cydista, Euterpe,
Genipa, Gentiana, Ludwigia, Luehea, Metopium, Mimosa, Panopsis, Proteaceae, Schinus, Solanaceae, Trema, Vernonia32 R. Marchant et al. / Palaeogeography, Palaeoclimatology, Palaeoecology 234 (2006) 28–44
meteorological station (Fig. 1, Table 4). The model is
run to determine the range of environmental conditions
that would be incorporated in a transition from the
present climatic condition to those of the last glacial
maximum (LGM). Environmental conditions were
controlled for temperature, precipitation and [CO2]atm.
As the LGM is the origin for our reconstruction focus
we run the model at 200 ppm [CO2]atm with the other
environmental parameters being kept constant. Tem-
perature and precipitation were set to present day mean
annual values, as recorded at the nearby meteorological
station, and then set to reduce by approximately 8 8C
and 600 mm yr 1, respectively. This range was chosen
Fig. 2. Schematic of the BIOME-3 vegetation model indicating as it encompasses the maximum climate change expe-
environmental inputs.
rienced at the LGM.
model is used to calculate leaf area index (LAI) and net 3. Results
primary productivity (NPP) for each PFT. The NPP is
used to form a series of prescribed PFTs using resource Results from the biome analysis are portrayed as
availability (water, nutrient, CO2 and light), which then X–Y plots of biome affinity scores vs. time (Fig. 3).
combine to form biomes (Fig. 2). The translation of The six plots are arranged in a gradient of decreasing
pollen data to biomes provides an opportunity to test savanna nature, thus arranged from strong edaphic
the outputs from a vegetation model that similarly savanna (El Piñal (Fig. 3a) to tropical rainforest (Pan-
constructs biomes. Here we applied the BIOME-3 ve- tano de Monica, Fig. 3f). Results from the vegetation
getation model that was developed as a tool for inte- modelling are portrayed as box plots with the envi-
grating the impacts of changes in climate and CO2 on ronment gradients of moisture and temperature form-
ecosystem structure and function (Haxeltine and Pren- ing the X–Y axes, respectively (Fig. 4). These plots are
tice, 1996). The model is based on the same environ- arranged in along a gradient of decreasing savanna
mental perspectives that govern our interpretation of the nature.
pollen data; that the vegetation is in equilibrium with
the ambient environment. Similar to our treatment of 3.1. Biome reconstructions from pollen data
the pollen data, output from BIOME-3 computes affi-
nity (in the form of NPP) to a series of plant functional Rather than describing change from each site, the
types. Recorded vegetation changes observed from the pollen-based results will be portrayed as a series of
pollen data are compared to model output that is run at periods: dlate glacial and transition to the HoloceneT,
a range of boundary conditions. In conjunction with dearly to mid HoloceneT and dmid to late HoloceneT.
the data based approach we use the BIOME-3 model
as a vehicle to describe how the vegetation will change 3.1.1. Late glacial and transition to the Holocene
in response to fluctuating environmental conditions. The only site to extend to the late glacial is El Piñal
BIOME-3 is modified to represent vegetation change (Fig. 3a), and this does so at quite a low resolution with
within a single pixel where data is available from a only five samples comprising the lower 8000 years;
Table 4
Location details for the six meteorological stations used to run the BIOME-3 vegetation model
Site Site no. Longitude Latitude Altitude Present biome
Arauca 1 70.15 7.10 320 Xeric woodlands scrub
Cucuta 2 72.50 8.00 800 Short grassland
Barranquilla 3 74.95 11.00 100 Short grassland
Bucaramanga 4 72.75 7.45 240 Tropical seasonal forest
Villavicencio 5 74.05 4.80 300 Tropical rain forest
Quibdo 6 76.85 5.85 240 Tropical rain forest
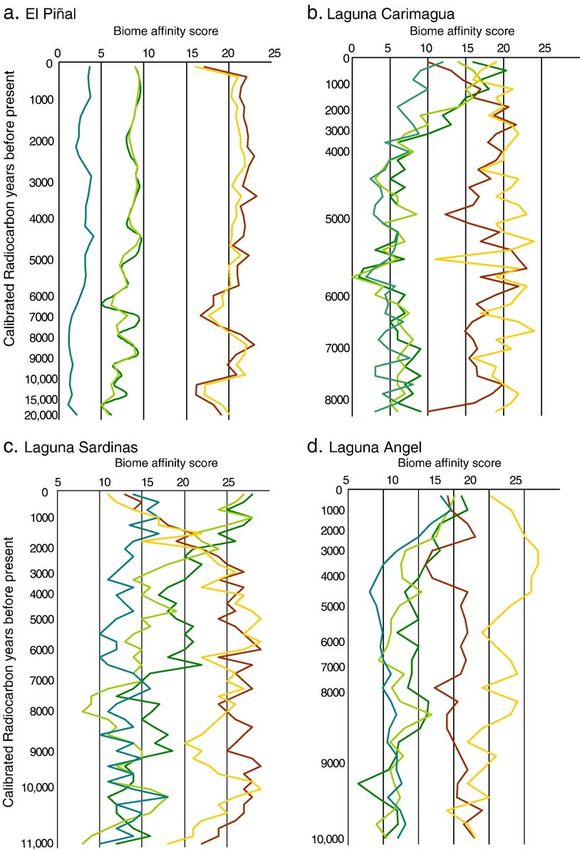
Each site is assigned a numerical code that relates to the site identifiers on Fig. 1.R. Marchant et al. / Palaeogeography, Palaeoclimatology, Palaeoecology 234 (2006) 28–44 33 however it is possible to show that tropical dry forest The record from Pantano de Monica (Fig. 3f) interest- was present at the LGM. Interestingly, this changes ingly records a steady decrease in the affinity to warm little from the present vegetation although the more temperate forest in the early part of the Holocene, a mesic biomes of tropical rain forest and tropical sea- trend that may be a continuation from the late glacial sonal forest have their lowest affinity scores. There is a period. sharp increase in the affinity score of the tropical dry forest biome going into the Holocene with a concom- 3.1.2. Early to mid Holocene itant rise in affinity to the tropical rain forest biome, All the sites record the early Holocene. Although possible coeval with the El Abra (Younger Dryas equiv- there are site-specific signatures of change, the general alent). The only other site to register this period trend is one of increasing affinities to steppe and tropical (Laguna Sardinas, Fig. 3c) also records a rise in affinity dry forest towards the mid-Holocene. El Piñal (Fig. 3a) score to the tropical dry forest biome about this time. shows very little change whereas Loma Linda (Fig. 3e) Fig. 3. X–Y plots of biome affinity scores vs. time arranged in a gradient of decreasing savanna nature, thus arranged from strong edaphic savanna (El Piñal, 3a) to tropical rainforest (Pantano de Monica, 3f).
34                     R. Marchant et al. / Palaeogeography, Palaeoclimatology, Palaeoecology 234 (2006) 28–44

                                                         Fig. 3 (continued).

shows very high variability as the tropical dry forest                slightly different response, at the latter site there is
biome becomes quite dominant at the site, as denoted by               high variation in the signal over the last 2000 years,
the strong anti-phase relationship with the more mesic                again possibly a response to rapid vegetation change
biomes of tropical rain forest and tropical seasonal                  following human activity.
forest. Interestingly, a number of sites recorded the high-
est affinity to the tropical dry forest biome around 6000             3.2. Vegetation modelling
14
   C BP, whereas at Pantano de Monica there is a de-
creased affinity to the tropical rain forest biome (Fig. 3f).             The vegetation changes are broadly analogous to
                                                                      those recorded from our pollen-based reconstructions
3.1.3. Mid to late Holocene                                           with one major exception: one benefit of BIOME-3 is
    Again all the sites record the mid Holocene to late               its ability to separate grass-dominated biomes on the
Holocene. The general trend observable at Laguna                      basis of NPP and the relative response of the C3 and C4
Carimagua (Fig. 3b), Laguna Sardinas (Fig. 3c),                       grasses; therefore, there are more grassland types than
Laguna Angel (Fig. 3d) and Pantano de Monica (Fig.                    possible from the pollen data. Thus, the model output
3f) if a transition to more mesic vegetation; at the                  provides an indication on the range of potential vege-
former three sites this is characterised by a reduction               tation types at the LGM. At the lowland sites of Cucuta
in tropical dry forest where as at the later site there is an         (Fig. 4a) and Baranquilla (Fig. 4b) the importance of
increase in tropical rain and tropical seasonal forest                moisture reduction is again apparent as shown by the
biomes. The timing and magnitude of this change is                    predominance of the horizontal boundaries between the
quite synchronous and dramatic, appearing to occur                    biomes. Interestingly, moisture appears to be a less
between 5000 and 3000 14C BP. At Loma Linda (Fig.                     important control at Baranquilla (Fig. 4b) compared
3e) there is a rapid increase in the affinity scores to all           to Cucuta (Fig. 4a) as recorded by the stronger vertical
the biomes although there are occasions in the last 4000              gradient between the dry savanna and short grassland.
years where tropical seasonal forest biome dominates.                 The control of moisture continues to be important at the
Many of the records show a change in the last few                     slightly higher sites of Bucaranmanga (Fig. 4c) and
thousand years, the common signal being a reduction in                Arauca (Fig. 4d), both being characterised by xerophy-
forest at all sites, apart from Laguna Sardinas (Fig. 3c)             tic woods and shrub prior to the transition to grass-
and Loma Linda (Fig. 3e), thought to stem from human                  dominated biomes, again portrayed by strong vertical
activity. Laguna Sardinas and Loma Linda show a                       gradients. Two mesic lowland sites of Villavicencio
R. Marchant et al. / Palaeogeography, Palaeoclimatology, Palaeoecology 234 (2006) 28–44 35 Fig. 4. Biome reconstructions derived from the BIOME-3 vegetation model for the six locations where meteorological data are available. Mean annual temperature (8C) is shown along the Y axis with mean annual precipitation (mm yr 1) shown along the X axis. The present-day climate space is represented for each location by the top right hand corner in each plot—temperature and precipitation are set to reduce by 8 8C and 600 mm yr 1 to simulate the environment experienced since the LGM for the region of Colombia encompassed by our records. (Fig. 4e) and Quibdo (Fig. 4f); both show the domi- 4. Discussion nance of tropical rain forest and the dominance of the temperature gradient in precipitating vegetation change. The discussion will be divided into five main sec- Results from Quibdo (Fig. 4f), located in the hyper- tions: (1) a general section on Late Quaternary biome humid area, shows that even under substantial moisture changes and palaeoenvironmental interpretations avail- changes the tropical rain forest biome remains to be able from BIOME-3 model output and connections to reconstructed. the pollen data, (2) three sections that focus on the late
36                   R. Marchant et al. / Palaeogeography, Palaeoclimatology, Palaeoecology 234 (2006) 28–44

glacial and transition to the Holocene, the early to mid           plant distribution are predominately driven by changes
Holocene, and the mid to late Holocene and finally, a              in moisture and how this interacts with low [CO2]atm;
section that discusses the more recent results relating to         CO2 change manifested as a variation in water use
anthropogenic activity and evidence of this from the               efficiency (WUE) (Farquhar, 1997). Under conditions
analysis.                                                          of low [CO2]atm plants have to transpire more to
                                                                   achieve the same level of photosynthesis and hence
4.1. Late Quaternary biome changes and palaeoenvi-                 NPP; halving the [CO2]atm is comparable to halving
ronmental interpretations                                          the rainfall (Farquhar, 1997). Although it has been
                                                                   shown that some C3 plants can respond to decreased
    In most previous applications of the biomisation               [CO2]atm by increasing the amount of stoma on the leaf
technique to pollen data, only the most dominant                   lamella (Wagner et al., 1999), this is difficult to apply to
biome has been used to describe the reconstructed                  late glacial interglacial transitions as one of the main
vegetation (Jolly et al., 1998a,b; Tarasov et al., 1998;           impacts on plants appears to be reduced water use
Marchant et al., submitted for publication). However, as           efficiency rather than a physiological response to low
discussed in a previous application of the technique to            [CO2]atm (Cowling and Sykes, 2000). For example, if
Colombian pollen data (Marchant et al., 2004a), this               the stomata have a wider aperture, or are more nume-
results in a large amount of lost information. Coarsen-            rous, this will result in more water being evaporated.
ing of the palaeoecological signal to a single biome can           Thus, no matter how the stomata compensate for the
provide an erroneous vegetation reconstruction, for                variation in [CO2]atm, C4 plants will always have a
example, if the dominant biome (highest affinity                   competitive advantage under environments charac-
score) would be applied to Laguna Angel (Fig. 3d), a               terised by relative water stress (Boom et al., 2002).
steppe biome would be reconstructed throughout and                     One problem in palaeoenvironmental reconstruc-
the record would be viewed as unresponsive to envi-                tions from single sites is that vegetation change may
ronmental change. With interesting vegetation response             result from multiple causes, i.e. a change in tempera-
recorded by biomes with relatively low affinity scores,            ture may have a similar effect as a change in moisture
it is crucial to interpret biome reconstruction with the           or [CO2]atm. Indeed, our analysis shows that inter-site
realisation a large amount of information lies behind the          vegetation response varies considerably, emphasising
biome dot maps that is dhiddenT but can be used to                 the importance of understanding temporal and spatial
differentiate subtle intra-biome differences (Marchant et          variability and hence the misconception that climate
al., 2001b, 2002b; Marchant and Hooghiemstra, 2001).               change would, at any one time, give the same signal
This understanding of dwhat lies beneathT is particularly          throughout a region (Huntley, 1999). Site selection is
important when the pollen data are used for palaeocli-             crucial in understanding controls on environmental
mate reconstructions. Many palaeoclimate reconstruc-               change, and how the vegetation reflects this. The
tions are driven with a modern analogue-driven transfer            varied nature of vegetation change, as recorded by
function (Farrera et al., 1999), under the assumption              the pollen data, is also apparent from the BIOME-3
that interactions between the abiotic and biotic envi-             model output used to simulate the influence of chang-
ronment remain constant through time, that commonly                ing environmental conditions. Applying a vegetation
do not take into account non-climatic parameters such              model allows separation, and subsequent investigation
as volcanic activity, fire (Cavelier et al., 1998; Rull,           on the impact on, of change in a range of environmen-
1999), UV-B insolation (Flenley, 1998) or atmospheric              tal parameters from the site to the region. Although
composition, in particular changing CO2 levels (March-             BIOME-3 provides a useful tool to investigate impact
ant et al., 2002b). Such omissions can lead to signifi-            of changing environmental conditions on vegetation,
cant errors in these estimates that are then used,                 that can add value to the interpretation of palaeoeco-
sometimes indiscriminately, by other disciplines. Pre-             logical data, a series of improvements would greatly
dicting and detecting forest responses to changes in               improve its utility. Particularly important within the
non-climatic factors present significant challenges that           context of our investigation are soil–vegetation rela-
require creative solutions (Graham et al., 1990) such as           tionships and soil hydrology that are more variable
adapting a vegetation model. For example, concentra-               than parameterised within the BIOME-3 model that
tions of CO2 reduced to glacial levels (200 ppmV, Petit            currently has a two-layered simple bucket approach.
et al., 1999) have been shown to have a very significant           Additional components that describe the length and
impact on tropical vegetation (Jolly and Haxeltine,                character of dry seasons (such as when is the main
1997; Boom et al., 2002). Changes in dry–moist forest              concentration of rainfall) and soil hydrology would be
R. Marchant et al. / Palaeogeography, Palaeoclimatology, Palaeoecology 234 (2006) 28–44 37
useful model developments; this is highly achievable expansion of savanna would have been greatly aided by
where there are good local meteorological and soils reduced CO2 concentrations and the resultant compe-
datasets locally available. These parameters are partic- titive advantage attained by C4 grasses over C3 plants
ularly important for moist and dry forest transitions in by better WUE (Haberle and Maslin, 1999; Marchant et
tropical regions where, unlike temperate areas, mois- al., 2002b), as is the case at higher altitudes (Boom et
ture is the main component that determines seasonality al., 2002). However, to see if lowland steppe expansion
rather than temperature. around the LGM is a spatially consistent signal, addi-
Late Quaternary vegetation history of the Neotropi- tional sites with sediments that date to the LGM are
cal phytogeographical realm is still poorly resolved: a required. Given that significant sediment accumulation
significantly greater number of sites are needed to in moisture-stressed environments are quite rare, deve-
determine more precisely the complexities of environ- lopments in vegetation modelling can help to fill in
mental change and the driving mechanisms behind this. gaps where there are deficiencies in data.
Such a wish is not purely academic with ensuing results
being important in model testing (Peng et al., 1998), 4.3. Early to mid Holocene
developing biogeographical theory (Tuomisto and Ruo-
kolainen, 1997), and understanding issues concerned Relative to the present day, the sites under analysis
with biodiversity and early human-environmental inter- here mainly record a shift to more xeric vegetation
actions (Marchant et al., 2004b). New sites, located in during the early to mid Holocene. Relatively dry con-
key areas, combined with the application of a range of ditions have also been indicated for lowland Colombia
proxies of environmental change, are required to refine for the mid-Holocene although the peak of dry condi-
our understanding on the sensitivity of the Neotropics tions, occurring between 6500 and 4500 14C BP, varied
to Late Quaternary climatic variations, how the envi- considerably between sites (Behling et al., 1999a). This
ronment responds to this variation, and how this signal signal of mid-Holocene aridity is recorded regionally
can be interpreted in light of comparable data from with dry environmental conditions in southern Brazil
adjacent areas. An increased volume of physical data extending from the early Holocene until approximately
would be aided by a philosophical move for interpret- 4500 14C BP when there was an increase in arboreal
ing data away from the dpresent is the key to the pastT to taxa (Alexandre et al., 1999). The driest phase in central
the dpast is the key to the presentT. Brazil is at approximately 5000 14C BP, with relatively
moist climate conditions similar to today setting in after
4.2. Late glacial period and transition to the Holocene 4000 14C BP (Ledru, 1993). Although fire has been
proposed as being responsible for late Holocene varia-
The precise dating of the LGM in Colombia, as tion in the forest/savanna boundary in Brazil (Desjar-
elsewhere in South America, is problematic (Bush et dins et al., 1996), this relative aridity is also thought to
al., 1990; Hooghiemstra and Van der Hammen, 1998; reflect an extended dry season during this period (Behl-
Ledru et al., 1998). In the Colombian lowlands El Piñal ing, 1997). A dry phase is also recorded at many
is the only site with sediments dating to the LGM. Andean sites, for example, in northern Chile desicca-
However, although there are good radiocarbon data to tion of the Puna ecosystem is recorded between 8000
constrain sediments to the LGM, the sedimentation rate and 6500 14C BP (Baied and Wheeler, 1993). On the
and the ensuing resolution of the vegetation reconstruc- central Peruvian Andes, a dry warm climate was en-
tion is very low. Although this is only one site from an countered between 7000 and 4000 14C BP (Hansen et
edaphic savanna, results do not agree with the sugges- al., 1994). d 18O measurements from the Huascarán ice
tion that closed Byrsonima-dominated savanna prece- core record taken from highland Peru shows that mid-
ded the open savannas of today (Wijmstra and van der Holocene climatic warming and drying was recorded
Hammen, 1966). The signals from the site are mirrored from 8200 to 5200 14C BP, with maximum aridity
regionally (Behling and Hooghiemstra, 2001) with between 6500 and 5200 14C BP (Thompson et al.,
sparse vegetation characterising the Plateau of Mato 1995). On the Bolivian Andes, a dry phase is recorded
Grosso (Servant et al., 1993) that extends to the coastal from approximately 5500 14C BP (Abbot et al., 1997).
areas of Guyana and Surinam. Indeed, the reconstruc- Farther north, within the Lake Valencia catchment,
tion from El Piñal may reflect the majority of the area dominant taxa during this period include Bursera,
presently covered by drier types of tropical forest that Piper and Trema (Bradbury et al., 1981), these tropical
were probably characterised by more open forest raingreen taxa indicate the presence of a seasonal cli-
around the LGM. The modelled results show that the mate with relatively dry conditions (Marchant et al.,38 R. Marchant et al. / Palaeogeography, Palaeoclimatology, Palaeoecology 234 (2006) 28–44
2002c). Low lake levels in central Panama also indicate Marchant et al., 2002a). Vegetation at numerous
that environmental conditions at this period were more Colombian sites record a shift between 4000 and
xeric (Piperno et al., 1991; Bush et al., 1992) whereas 3500 14C BP indicative of relatively moist environmen-
sites on the Yucatán peninsula show a shift to warm tal conditions resulting from increased precipitation,
evergreen forest, characteristic of warmer conditions, decreased evaporation, a shorter dry season or a com-
persisted from the early Holocene until approximately bination of these factors (Marchant et al., 2001a). The
6500 14C BP (Brown, 1985). Despite a large body of strength of this climatic signal was remarkable, for
evidence for a mid-Holocene dry period, there still example, the level of Lake Titicaca increased by some
remains a debate about the intensity, and even the 100 m about 3800 14C BP (Cross et al., 2000). Farther
occurrence, of this. Salgado-Labouriau et al. (1998) to the south, increased moisture levels recorded in the
suggests that most savanna areas were characterised high altitude ice-core record of Sajama followed an
by increased rainfall between 7000 and 6000 14C BP. increase in snow accumulation as recorded by a de-
One of the main mechanisms used to determine crease in aerosols from 3400 14C BP (Thompson, 1992;
moisture shifts in Colombia is fluctuation in the South- Thompson et al., 2000). However, this was not a single
ern Oscillation and the migration of the ITCZ (Martin et uni-directional event: mid Holocene environmental var-
al., 1997). Rather than changes in the median position iability was recorded by four noticeable dust events
of the ITCZ, changes in the character of the ITCZ dated between 5550 and 2350 14C BP (Thompson et
oscillation, such as greater latitudinal range for annual al., 1995). A similarly complex signal was recorded in
migration, can be invoked to explain vegetation the Quelccaya ice cap (Thompson et al., 1984).
changes (Behling and Hooghiemstra, 2001). Martin et A relatively synchronous climatic signal to wetter
al. (1997) suggests that during the mid-Holocene, the climatic conditions was centred about 4000 14C BP as
ITCZ was located farther north than its present-day relatively mesic forests extended across the Llanos
position, resulting in a summer rainfall deficit compen- Orientales, herb savanna changed to a shrub-dominated
sated by increased winter precipitation, in short greater savanna, and shrub savanna to tropical moist forests
seasonality. However, due to the topographical influ- (Berrı́o et al., 2002a,b). In addition to general forest
ence of the Andes and the convergence of westerly and expansion, a trend that may still be in progress (Behling
easterly winds, the ITCZ has a sinusoidal profile over and Hooghiemstra, 1998), this period of vegetation
northern South America; therefore, to explain moisture change is specifically characterised by a marked in-
changes over north-eastern South America, the impor- crease in palms (Euterpe/Geonoma, Mauritia and
tance of convective moisture sources cannot be over- Mauritella) (Behling and Hooghiemstra, 1999). This
estimated. Reduced precipitation, particularly in mid vegetation shift may be in response to a wetter climate,
latitude western South America, is likely to result probably with a short dry season and/or human influ-
from a reduction in the intensity of the westerly climate ence (Behling and Hooghiemstra, 1998, 1999; Berrı́o et
systems. It is also possible that episodic dry events that al., 2002a,b). Interestingly, Mauritella increases around
presently occur in South America in relation to sea- Laguna Angel, whereas Mauritia is the main taxon to
surface temperature anomalies of the Pacific Ocean increase around Laguna Sardinas (Behling and Hoo-
were more frequent in the mid-Holocene (Markgraf, ghiemstra, 1998). In addition to being an indicator of
1993). This later suggestion has also been used to human activity, Mauritia is also known to grow under
explain increased fire frequency in southeast Brazil higher moisture availability (Berrı́o et al., 2002a,b;
(Alexandre et al., 1999). Marchant et al., 2002c).
More regionally, the stratigraphy from a site situated
4.4. Mid Holocene to late Holocene in the hyper-humid (precipitation N 10,000 mm yr 1)
lowland rainforest near the Pacific coast (El Caimito)
There are a growing number of studies from the records sandy sediments at about 4200 years which are
South American tropics that document the timing and indicative of increased fluvial activity in response to
strength of mid to late Holocene environmental change greater moisture levels (Velez et al., 2001, 2005). On
that are a testament to the highly responsive nature of the northern boundary of the Amazonian rainforest in
tropical sediment archives to climate change (Marchant French Guinea, fires have been less frequent since 3000
14
and Hooghiemstra, 2004). In addition to these site- C BP when forests appeared to be relatively humid in
specific studies, a number of synthesis studies docu- comparison to the present-day (Charles-Dominique et
mented broad-scale patterns of vegetation change al., 1998). In Amazonia, a pollen record from along the
(Behling and Hooghiemstra, 2001; Behling, 2002; Rio Curuá indicates a rise in river level followingR. Marchant et al. / Palaeogeography, Palaeoclimatology, Palaeoecology 234 (2006) 28–44 39
relatively wet conditions around 3500 14C BP (Behling mid-Holocene, and the sphere of influence is primarily
and Lima da Costa, 2001). This environmental signal is within the tropics, this appears to be a major factor
similarly recorded in south-central Brazil where from driving change about 4000 14C BP. The establishment
4000 14C BP, tree-dominated vegetation communities of this major ocean circulation system had a direct
developed in areas previously characterised by savanna impact on Atlantic SST and associated circulation. As
(Alexandre et al., 1999). At the present southern bound- an additional layer to these climate mechanisms, the
ary of the Amazonian rain forest, pollen evidence indi- relatively local impacts of increased dust loading (vol-
cates a marked southerly expansion in rainforest at canic or terrestrial), changed albedo and CH4 would
about 3500 14C BP when there was a sharp increase have contributed to the climate shift, resulting in in-
in the presence of Isöetes, an indicator of permanent creased rate or magnitude of change that was mani-
lakes (Mayle et al., 2000). However, not all sites show a fested locally. The period around 4000 14C BP is
uniform environmental signal around 4000 14C BP. A characterised by high variability in all these factors
dry, rather than wet, period is suggested from Ecuador- (Marchant and Hooghiemstra, 2004). Added complex-
ian Amazonia between 4200 and 3150 14C BP (Bush ity is caused by steep environmental gradients associ-
and Colinvaux, 1988; Liu and Colinvaux, 1985). After ated with non-climatic factors (Marchant and
about 4000 14C BP the climate of equatorial South Hooghiemstra, 2004). For example, the presence of
America became moister, essentially resembling mod- the tropical dry forest biome in lowland Colombia,
ern conditions (Ledru et al., 1998; Marchant and Hoo- e.g. the catchment of El Piñal results from a combina-
ghiemstra, 2004). tion of strongly seasonal conditions at present and
One of the main climatic systems to influence the locally strong edaphic influence (Behling and Hoo-
relatively recent climate dynamic in north-eastern South ghiemstra, 1999).
America is a change in the character of ENSO that is There are still numerous questions that remain re-
known to have evolved markedly over time (Markgraf garding environmental variability in the Llanos Orien-
et al., 2000). One recent record documenting long-term tales, providing answers to these will allow a better
variability in the behaviour of ENSO comes from the understanding on how Neotropical areas reflect, and in
Galapagos Island where a well-dated sedimentary re- turn respond, to changes in major climate-forcing fac-
cord indicates minimal El Niño activity during the mid tors. Moreover, processes should not be investigated in
Holocene with a rapid increase in the frequency of isolation but possible combinations need to be investi-
events at about 4200 14C BP (Riedinger et al., 2002). gated in terms of enhanced impacts or resonances that
These records from the Pacific Islands are also consis- may lead to particularly rapid, unidirectional, and rela-
tent with evidence from western South America where tively long lived periods of change. To develop such an
marine molluscan remains indicate a population struc- understanding, high resolution, multiproxy data are
ture change at about 3450 14C BP which may be required that target particular periods with increased
associated with a change in flooding frequency driven temporal and spatial resolution. Inherent in this is the
by El Niño events around 3600 14C BP (Wells, 1990). need for closer connections between climate/vegetation
Records from continental South America also support model development and palaeo data generation in a
these oceanic records. Laminated sediments from a lake way that is mutually beneficial to data producers and
situated in the Ecuadorian Andes show a clear increase users.
in El Niño activity about 5000 14C BP (Rodbell et al.,
1999). Given the dynamic series of events about this 4.5. Anthropogenic influence
period (Marchant and Hooghiemstra, 2004), it seems
unlikely that any single climate mechanism was respon- The majority of the sites record a reduction in forest
sible for driving the shift in climate around 4000 14C in the uppermost samples, primarily dating to the last
BP. Changes in different components of the earth–at- 2000–3000 years. A previous investigation indicating
mosphere–ocean system have a magnifying, or buffer- the presence and spread of degraded vegetation indi-
ing, effect on underlying climatic change. Changes, cates an expansion in this type since the mid Holocene,
direct or resonant, in ENSO, solar activity, volcanic (Marchant et al., submitted for publication). Separating
activity, ice-sheet dynamics and Atlantic circulation, out human-induced and climate-induced changes can
and how they impacted on the vegetation locally be problematic as the environmental signals from both
would have been buffered by local environmental con- forcing factors are often similar and can be easily
ditions and atmosphere–ocean–land feedbacks. As confused. Indeed, there can be a danger in over-inter-
ENSO is shown to be particularly active from the preting such records, particularly when aiming to de-40 R. Marchant et al. / Palaeogeography, Palaeoclimatology, Palaeoecology 234 (2006) 28–44
duce a regional reconstruction when only the local or establishment of a trade connection to another loca-
conditions are recorded. The relevance of Holocene tion. Such a situation would make the relatively dry
climatic shifts, however difficult to separate out, are areas of Colombia; such as the Llanos Orientales and
paramount to understanding cultural change; climatic the dry inter Andean valleys, more attractive for habi-
events resulting in ecosystem changes have an impor- tation. The widespread occurrence of this signal in
tant bearing in the evolution of culture (Gnécco, 1999). tropical Latin America, and the opposite shift to a
Notwithstanding doubts about unidirectional dcause and relatively arid environment in Africa, is highly interest-
effectT relationships between environmental and cultur- ing and its characterisation and possible cultural inter-
al change, there are strong synchronicities between connections should be a target of future investigation
archeo-historical and palaeoenvironmental data (Proc- (Marchant and Hooghiemstra, 2004). At approximately
tor, 1998). This synthesis has indicated areas, and 2000 14C BP the concentration of degraded vegetation
periods, where our interpretations are particularly con- at lowland sites extends to the higher altitudes in
tentious due either to a lack of information or Colombia (Marchant et al., submitted for publication)
conflicting data sets that should be targets for new although there was no significant collapse in lowland
initiatives. To develop some tantalising links that com- agricultural systems as widely documented for Peruvian
bine theories of climate change and environmental and cultures (Kolata, 1986; Bray, 1990; Chepstow-Lusty et
cultural response, there is a strong need to work more al., 1996; Moore, 1991) and more recently the Maya
closely with the archaeological community. (Hodell et al., 1995). Start of forest recovery at Timbio
There is a growing amount of evidence against the is thought to occur slightly before the arrival of the
suggestion that lowland tropical forests were unable to Spanish conquistadors (Wille et al., 2000) when agri-
support substantial human populations due to humid cultural practices changed. Although Behling et al.
climates, poor soils and profusion of pests (Pringle, (1999a) suggested that some tropical landscapes
1998). Palaeoindians probably lived in the Chocó Rain reverted to forest following the arrival of the Spanish,
forest since at least 3460 14C BP (Behling et al., 1999b). our analysis does not show this to be the case although
Indeed, Holden (1998) suggests that farming in the the resolution in the uppermost sections of the cores
Americas may have begun within tropical forests. Direct needs to be increased to substantiate this claim.
archaeological evidence indicates that human occupa-
tion of lowland tropical rain forest that dates back to 5. Conclusions
approximately 10,000 14C BP (Gnécco, 1999; Gnécco
and Mohammed, 1994). Barse (1990) documented a The standard treatment of primary pollen data from
centralised population in the middle Orinoco Basin (a Llanos Orientales permits a spatial and temporal per-
forest/savanna transitional environment) that used uni- spective on the response of dry–moist vegetation types
facial stone tools dating to the early Holocene. Charcoal to climatic forcing since last glacial period. Combining
dated before approximately 4000 14C BP within the Rio these data with a vegetation model has allowed us to
Buritaca catchment provides direct evidence to support determine the factors driving vegetation change and
the suggestion that Amerindians were frequently using how these vary over space and time. The application
fires for clearing lands, probably for the cultivation of of a vegetation model is shown to be a useful tool with
Zea mays (Hérrera, 1985). Cavelier et al. (1998) suggest which to test ideas that result from these data analysis.
such impact was able to transform moist forest ecosys- Moisture dynamics are shown to be key in forcing
tems to secondary growth and eventually savanna. Ar- vegetation change in the Llanos Orientales, particularly
chaeological evidence indicates human impact from the due to the link with WUE under conditions of low
middle Holocene at several sites on the Colombian [CO2]atm.
savanna where Pre-Colombians were living close to Tropical South America experienced a major syn-
the rivers cultivating Zea mays and other plants from chronous change to higher precipitation and/or a
the gallery forest (Berrı́o et al., 2000a,b). shorter dry season about 4000 14C BP. Whatever mech-
Interestingly, a number of lowland sites record the anism is invoked to explain the vegetation changes,
earlier increase in mesic vegetation as a marked in- increasingly it is shown that tropical palaeoecology is
crease in palms (Mauritia and Mauritella) that began highly responsive.
from approximately 3800 14C BP in response. The mid There is a need to develop a better understanding
Holocene onset of wetter environment, and the associ- between the tropical signals of environmental change,
ated impact of increase climatic variability on how these correspond to those of temperate latitudes,
resources, may be manifested as a concerted migration and what are the mechanisms, both atmospheric andR. Marchant et al. / Palaeogeography, Palaeoclimatology, Palaeoecology 234 (2006) 28–44 41
oceanographic that transmit these signals. This could be Behling, H., Hooghiemstra, H., 1998. Late Quaternary palaeoecology
the first a step in developing a better understanding of and palaeoclimatology from pollen records of the savannas of the
Llanos Orientales in Colombia. Palaeogeogr. Palaeoclimatol.
past environmental variability and the mechanisms re- Palaeoecol. 139, 251 – 267.
sponsible for driving the change. Given the strength of Behling, H., Hooghiemstra, H., 1999. Environmental history of the
this relationship there is a real need to incorporate Colombian savannas of the Llanos Orientales since the Last
tropical research within research programs that have a Glacial Maximum from lake records El Piñal and Carimagua. J.
Paleolimnol. 21, 461 – 476.
predominately temperate focus.
Behling, H., Hooghiemstra, H., 2000. Holocene Amazon rain forest-
savanna dynamics and climatic implications: high-resolution pol-
Acknowledgements len record from Laguna Loma Linda in eastern Colombia. J. Quat.
Sci. 15, 687 – 695.
The Netherlands Organisation for Scientific Re- Behling, H., Hooghiemstra, H., 2001. Neotropical savanna environ-
search (NWO) funded research on Colombian biome ments in space and time: Late Quaternary inter-hemispheric com-
reconstructions under award 750:198:08 to Henry parisons. In: Markgraf, V. (Ed.), Interhemispheric Climate
Linkages. Academic Press.
Hooghiemstra and Robert Marchant. Luisa Herrera Behling, H., Lima da Costa, M., 2001. Holocene vegetation and
and an anonymous reviewer are thanked for insightful coastal environmental changes from the Lago Crispim record in
comments on an earlier version of this manuscript. northeastern Para State, eastern Amazonia. Rev. Palaeobot. Paly-
Numerous people have offered support and comment nol. 114, 145 – 155.
on the research at various stages of development, Behling, H., Berrio, J.C., Hooghiemstra, H., 1999a. Late Quaternary
pollen records from the middle Caqueta river basin in central
none more so than the people who have made their Colombian Amazon. Palaeogeogr. Palaeoclimatol. Palaeoecol.
pollen data available for the analysis, without such 145, 193 – 213.
contributions, this work would not have been possi- Behling, H., Hooghiemstra, H., Negret, A.J., 1999b. Holocene history
ble. In particular, we thank Sandy Harrison and Colin of the Chocó rain forest from Laguna Piusbi, Southern Pacific
Lowlands of Colombia. Quat. Res. 50, 300 – 308.
Prentice for discussions throughout the development
Berrı́o, J.C., Hooghiemstra, H., Behling, H., Van der Borg, K.,
of the broader-scale Latin American biomisation. Par- 2000a. Late Holocene history of savanna gallery forest from
ticular thanks must go to Vera Markgraf and Eric Carimagua area, Colombia. Rev. Palaeobot. Palynol. 111,
Grimm for their energies in establishing, and devel- 295 – 308.
oping, the Latin American Pollen Database (LAPD) to Berrı́o, J.C., Behling, H., Hooghiemstra, H., 2000b. Tropical rain
which the pollen data presented here are being pre- forest history from the Colombian Pacific area: a 4200-yr pollen
record from Laguna Jotaordó. Holocene 10, 749 – 756.
pared for entry. Berrı́o, J.C., Hooghiemstra, H., Marchant, R., Rangel, O., 2002a. Late
glacial and Holocene history of the dry forest area in the south
References Colombian Cauca Valley. J. Quat. Sci. 17, 667 – 682.
Berrio, J.C., Hooghiemstra, H., Behling, H., Botero, P., van der Borg,
Abbot, M.B., Seltzer, G., Kelts, K.R., Southon, J., 1997. Holocene K., 2002b. Late Quaternary savanna history of the Colombian
palaeohydrology of the tropical Andes from lake records. Quat. Llanos Orientales from Laguna Chenevo and Mozambique: a
Res. 47, 70 – 80. transect synthesis. Holocene 12, 35 – 48.
Alexandre, A., Meunier, J.D., Marriotti, A., Soubies, F., 1999. Late Berrio, J.C., Arbelaez, M.V., Duivenvoorden, J.F., Cleef, A.,
Holocene phytolith and carbon-isotope record from a latosol at Hooghiemstra, H., 2003. Pollen representation and succes-
Salitre, south-central Brazil. Quat. Res. 51, 187 – 194. sional vegetation change on the sandstone plateau of Arara-
Baied, C.A., Wheeler, J.C., 1993. Evolution of high Andean cuara, Colombian Amazonia. Rev. Palaeobot. Palynol. 126,
Puna ecosystems: environment, climate, and cultural change 163 – 181.
over the last 12,000 years in the central Andes. Mt. Res. Dev. Boom, A., Marchant, R.A., Hooghiemstra, H., Sinninghe Damste,
13, 145 – 156. J.S., 2002. CO2 and temperature-controlled altitudinal shifts of
Barse, W.P., 1990. Preceramic occupations in the Orinoco valley. C4- and C3- dominated grasslands allow reconstruction of UCO2.
Science 250, 1388 – 1390. Palaeogeogr. Palaeoclimatol. Palaeoecol. 177, 29 – 45.
Bradbury, J.P., Leyden, B., Salgado-Labouriau, M.L., Lewis, J., Bray, W., 1990. Agricultural renascence in the high Andes. Nature
W.M., Schubert, C., Binford, M.W., Schubert, C., Binford, 345, 385.
M.W., Frey, D.G., Whitehead, D.R., Weibezahn, F.H., 1981. Brown, B., 1985. A summary of Late Quaternary pollen records from
Late Quaternary environmental history of Lake Valencia, Vene- Mexico west of the Isthmus of Tehuantepec. In: Bryant, V.M.,
zuela. Science 214, 1299 – 1305. Holloway, R.G. (Eds.), Pollen Records of Late Quaternary North
Behling, H., 1997. Late Quaternary vegetation, climate and fire American Sediments. American Association of Stratigraphic Paly-
history of the Araucaria forest and campos region from Serra nologists Foundation, Dallas, Texas.
Campos Gerais, Parana State (South Brazil). Rev. Palaeobot. Bush, M.B., Colinvaux, P., 1988. A 7000-year pollen record from the
Palynol. 97, 109 – 121. Amazon lowlands, Ecuador. Vegetatio 76, 141 – 154.
Behling, H., 2002. Carbon storage increases by major forest ecosys- Bush, M., Colinvaux, P., Wiemann, M.C., Piperno, D.R., Liu, K.,
tems in tropical South America since the Last Glacial Maximum 1990. Late Pleistocene temperature depression and vegetation
and the early Holocene. Quat. Int. 18, 35 – 42. change in Ecuadorian Amazonia. Quat. Res. 34, 330 – 345.You can also read