MDM2 induces EMT via the B Raf signaling pathway through 14 3 3
←
→
Page content transcription
If your browser does not render page correctly, please read the page content below
ONCOLOGY REPORTS 46: 120, 2021

                                  MDM2 induces EMT via the B‑Raf
                                  signaling pathway through 14‑3‑3
                      MENGTING OU1, XICHAO XU1, YING CHEN1, LI LI1, LU ZHANG1, YI LIAO2,
                      WEICHAO SUN1, CHRISTINE QUACH3, JIANGUO FENG4 and LILING TANG1

         1
        Key Laboratory of Biorheological Science and Technology, Ministry of Education, College of Bioengineering,
    Chongqing University; 2Department of Cardiothoracic Surgery, Southwest Hospital, Third Military Medical University,
         Chongqing 400044, P.R. China; 3Department of Molecular Microbiology and Immunology, University of
       Southern California, Los Angeles, CA 90033, USA; 4Department of Anesthesiology, The Affiliated Hospital of
                            Southwest Medical University, Luzhou, Sichuan 646000, P.R. China

                                         Received October 12, 2020; Accepted March 23, 2021

                                                         DOI: 10.3892/or.2021.8071

Abstract. MDM2 proto‑oncogene, E3 ubiquitin protein ligase                Subsequently, the present study explored the mechanism
(MDM2) is a well‑known oncogene and has been reported                     by which MDM2 promoted EMT and revealed that MDM2
to be closely associated with epithelial‑to‑mesenchymal                   induced EMT by upregulating EMT‑related transcription
transition (EMT). The present study first demonstrated that               factors via activation of the B‑Raf signaling pathway through
the expression levels of MDM2 were markedly increased in                  tyrosine 3‑monooxygenase activation protein ε using RNA
TGF‑β ‑induced EMT using quantitative PCR and western                     sequencing and western blotting. This mechanism depended
blotting. In addition, MDM2 was demonstrated to be associ‑                on the p53 gene. Furthermore, in vivo experiments and the
ated with pathological grade in clinical glioma samples by                colony formation experiment demonstrated that MDM2 could
immunohistochemical staining. Furthermore, overexpression                 promote tumor progression and induce EMT via the B‑Raf
of MDM2 promoted EMT in glioma, lung cancer and breast                    signaling pathway. Since EMT contributes to increased drug
cancer cell lines using a scratch wound migration assay.                  resistance in tumor cells, the present study also explored the
                                                                          relationship between MDM2 and drug sensitivity using an
                                                                          MTT assay, and identified that MDM2 promoted cell insen‑
                                                                          sitivity to silibinin treatment in an EMT‑dependent manner.
                                                                          This finding is crucial for the development of cancer thera‑
Correspondence to: Dr Liling Tang, Key Laboratory of
Biorheological Science and Technology, Ministry of Education,             pies and can also provide novel research avenues for future
College of Bioengineering, Chongqing University, 174 Shazhengjie,         biological and clinical studies.
Shapingba, Chongqing 400044, P.R. China
E‑mail: tangliling@cqu.edu.cn                                             Introduction
Dr Jianguo Feng, Department of Anesthesiology, The Affiliated
Hospital of Southwest Medical University, 25 Taiping Street,              MDM2 proto‑oncogene, E3 ubiquitin protein ligase (MDM2)
Jiangyang, Luzhou, Sichuan 646000, P.R. China                             is a well‑known oncogene that has been reported to be closely
E‑mail: fengjianguo@swmu.edu.cn                                           associated with different disease phenotypes (1). MDM2 is a
                                                                          specific target gene of p53 and is a unique ubiquitin‑protein
Abbreviations: MDM2, MDM2 proto‑oncogene, E3 ubiquitin                    ligase associated with numerous cancer types (1). MDM2
protein ligase; EMT, epithelial‑to‑mesenchymal transition; 14‑3‑3,        can transfer from the nucleus to the cytoplasm and degrade
tyrosine 3‑monooxygenase activation protein ε; B‑RAF, B‑Raf               various substrates, such as p53 (2). In addition, MDM2 and
proto‑oncogene, serine/threonine kinase; RSK, 90 KDa ribosomal            p53 can form a negative‑feedback loop (2). The p53 gene
protein S6 kinase; β‑arrestin1, subtype 1 of β‑arrestin protein family;   enhances MDM2 protein expression, while MDM2 inhibits
β‑arrestin2, subtype 2 of β‑arrestin protein family; Snail, Snail
                                                                          p53 through simultaneously ubiquitinating and degrading
family transcriptional repressor 1; Slug, Snail family transcriptional
                                                                          p53 (2,3). P53 is a cancer suppressor the function of which
repressor 2; ZEB1, zinc finger E‑box binding homeobox 1; E‑CAD,
E‑cadherin; N‑CAD, N‑cadherin; VIM, vimentin; GSEA, Gene                  can be eliminated by MDM2 activity (2,3). Therefore, MDM2
Set Enrichment Analysis; SqRT‑PCR, semi‑quantitative reverse              is related to tumor formation, anti‑apoptosis effects and drug
transcription PCR; qPCR, quantitative PCR; p70S6K, ribosomal              resistance (4,5).
protein S6 kinase; 4EBP1, eukaryotic translation initiation factor 4E         Epithelial‑to‑mesenchymal transition (EMT) is a dynamic
binding protein 1                                                         and complex process. When EMT occurs, epithelial cells
                                                                          change their morphology, lose their polarity, and acquire
Key words: MDM2, EMT, B‑Raf, 14‑3‑3, drug sensitive                       the features and potential of mesenchymal cells (6). EMT is
                                                                          involved in embryonic development, wound healing, inva‑
                                                                          sion and metastasis in tumor cells (6). Notably, EMT serves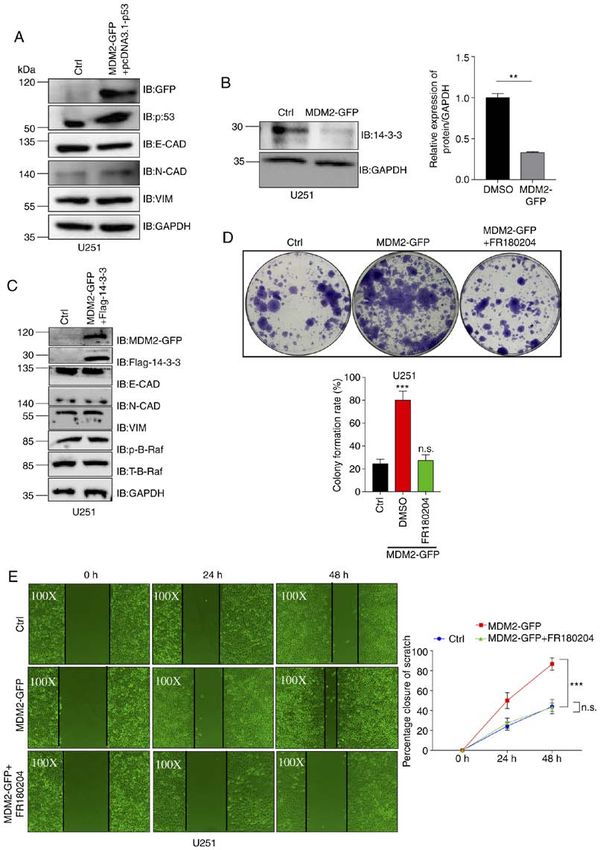
2 OU et al: MDM2 INDUCES EMT VIA ACTIVATION OF B-Raf
a crucial role in tumor progression (6). According to previous EMT contributes to the resistance of cancer cells to chemo‑
studies, the expression levels of MDM2 are increased in therapy agents. According to previous studies, numerous
TGF‑ β ‑induced EMT (2,3,7,8). Therefore, MDM2 is an chemicals have been used in cancer treatments (7,8,30‑32).
important part of tumor cell invasion, metastasis and the EMT However, they often have little or no effect on cells that have
process. In certain invasive ductal breast carcinoma models, undergone EMT (30). EMT is also involved in the drug resis‑
overexpression of MDM2 promotes the invasion and migration tance of breast cancer cells, and these resistant cancer cells
of tumor cells (7). A previous study reported that MDM2 can exhibit increased migration and invasion activities (31,32). In
promote EMT by upregulating the expression of Snail family some human glioma cell models, EMT is necessary for tumor
transcriptional repressor 1 (Snail) in breast cancer cells (4). cells to acquire resistance to drugs (33,34). Furthermore, EMT
A number of articles have reported the close relationship has been reported to be associated with drug resistance and
between MDM2 and EMT in other cancer cells (4‑8). MDM2 sensitivity to numerous chemotherapeutics in non‑small‑cell
induces the migration of tumor cells by inhibiting E‑cadherin lung carcinoma, breast cancer and bladder cancer (35,36).
(E‑CAD) expression (7,8). However, to the best of our knowl‑ Based on previous studies and data, the present study
edge, the mechanism by which MDM2 promotes EMT is still attempted to reveal the mechanism of MDM2‑mediated
unknown. induction of EMT. In addition, the present study aimed to
The MAPK/ERK signaling pathway is a complex and explore whether p53 is involved in MDM2‑mediated EMT.
highly conserved cellular signaling pathway widely used Since EMT contributes to the drug resistance of tumor cells,
in eukaryotic cells, and it is important for the occurrence, the present study also tried to reveal the relationship between
development and malignant transformation of tumors (9). MDM2 and drug sensitivity.
Raf/MEK/ERK is a classical and important pathway involved
in tumor development, leading to abnormal proliferation, inva‑ Materials and methods
sion, growth and distant metastasis of malignant tumors (10).
Various in vitro experiments have demonstrated the important Plasmid vector construction. Plasmid construction was
roles of Raf/MEK/ERK signaling in the development of performed as described in our previous studies (37‑39).
cancer; however, there are still numerous unknowns regarding pLenti‑CMV‑MDM2‑green fluorescent protein (GFP)‑puro
the involvement of this pathway with cancer (9‑11). A number was constructed based on a plenti‑CMV‑puro backbone. The
of studies have reported that Raf/MEK/ERK signaling present study first PCR‑amplified the MDM2 sequence lacking
can participate in EMT, while the mechanism by which a termination codon using the plasmid pcDNA3.1‑MDM2 as
Raf/MEK/ERK signaling is involved in and affects EMT is a template using the following primer pair and the Prime Star
unclear (9‑11). Therefore, with the continuous progress and DNA Polymerase kit (Takara Bio, Inc.): Forward, 5'‑CGC
updating of diagnosis and treatment technology, the specific GCCACCATGGTGAGGAGCAGGCAAAT‑3' and reverse,
regulatory mechanism for the Raf/MEK/ERK signaling 5'‑ACGCGGGGAAATAAG‑3'. The PCR conditions used
pathway to block its induction of tumor biological behavior were as follows: 94˚C for 5 min; 94˚C for 30 sec; 56˚C for
has become a focus of current cancer research (9‑11). 60 sec; 72˚C for 1 min; 72˚C for 10 min; 4˚C for 10 min; cycle
Tyrosine 3‑monooxygenase activation protein ε number, 35. PCR fragments were purified on a 1.5% agarose gel
(14‑3‑3) proteins are a family of highly conserved small with ethidium bromide using the E.Z.N.A.® DNA Kit (Omega
proteins (12). At present, 14‑3‑3 proteins are regarded as Bio‑Tek, Inc.). A purified GFP cDNA fragment that lacked an
a major class of molecular chaperones, with >200 proteins initiation codon was PCR‑amplified using plenti‑CMV‑GFP
having been demonstrated to be targeted by them, and as a template by the following primer pair and the Prime Star
the list is still expanding (12). A turning point in under‑ DNA Polymerase kit (Takara Bio, Inc.): Forward, 5'‑CGTCAG
standing the role of 14‑3‑3 proteins was the discovery that ATCCGCTAGCGCTACCGGTCG‑3' and reverse, 5'‑GCT
14‑3‑3 proteins bind to specific phosphorylated motifs in TACT TGTACAGCTCGTCCATGCCG‑3'. The PCR condi‑
protein targets in 1996 (13). The majority of target proteins tions used were as follows: 94˚C for 5 min; 94˚C for 30 sec;
contain 14‑3‑3‑binding motif(s) with the following amino 55˚C for 30 sec; 72˚C for 30 sec; 72˚C for 10 min; 4˚C for
acid sequences: RSXpSXP (mode I) and RXY/FXpSXP 10 min; cycle number, 32. PCR fragments were purified on a
(mode II) or ‑pS/pTX(1‑2)‑CO2 H (mode III) (where X is 1.5% agarose gel with ethidium bromide using the E.Z.N.A.®
not Pro) (14‑16). Upon interaction with a target, 14‑3‑3 DNA Kit (Omega Bio‑Tek, Inc.). Overlap PCR was used to
proteins alter target protein modifications, activities and connect the purified MDM2 and GFP fragments using the
cellular localizations, and thus regulate five major cellular following primer pair and the Prime Star DNA Polymerase
functions: Cell cycle regulation, apoptosis, signal transduc‑ kit (Takara Bio, Inc.): Forward, 5'‑CGCG CCACCATGGTG
tion, metabolism and intracellular protein trafficking (17‑23). AGGAGCAGGCAAAT‑3' and reverse, 5'‑GCTTACTTGTAC
Notably, previous studies have revealed that B‑Raf contains AGCTCGTCCATGCCG‑3'. The PCR conditions used were as
at least two binding sites for 14‑3‑3, and 14‑3‑3 could combine follows: 94˚C for 5 min; 94˚C for 30 sec; 56˚C for 60 sec; 72˚C
with B‑Raf to affect the activation of B‑Raf (14‑16). It is for 1.5 min; 72˚C for 10 min; 4˚C for 10 min; cycle number,
interesting to note that 14‑3‑3 can deactivate B‑Raf directly 35. PCR fragments were purified on a 1.5% agarose gel with
by making it locate to the cytoplasm (24‑27). Under basal ethidium bromide using the E.Z.N.A.® DNA Kit (Omega
conditions, B‑Raf phosphorylation creates docking sites for Bio‑Tek, Inc.). Subsequently, Kozak sequences were added
14‑3‑3 proteins, resulting in the sequestration of B‑Raf in to the purified MDM2‑GFP fragment and restriction enzyme
the cytoplasm as an off‑state (28,29). 14‑3‑3 deficiency can sites for BamHI and SalI were also inserted. The recombinant
directly lead to B‑Raf reactivation (28,29). fragment and pLenti‑CMV‑puro were digested with BamHI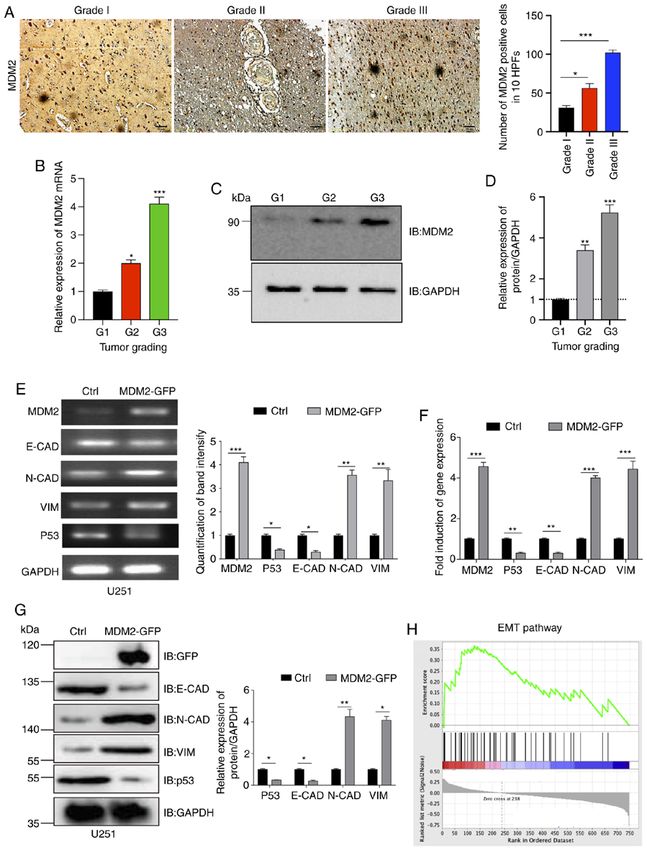
ONCOLOGY REPORTS 46: 120, 2021                                                      3

and SalI (Takara Bio, Inc.), respectively, and then T4 ligase    Co‑transfection and lentivirus transduction. According to the
(Takara Bio, Inc.), was used to form the recombinant plasmid     manufacturer's protocols of the PloyFect Effectene Transfection
pLenti‑CMV‑MDM2‑GFP‑puro plasmid (Fig. S1A and B). In            Reagent (Qiagen, Inc.) The second generation lentiviral system
the present study, fragments and plasmids were digested with     plasmid plenti‑CMV‑MDM2‑GFP‑puro, pCMV‑VSV‑G
Takara QuickCut enzymes (Takara Bio, Inc.) and fragments         (Addgene, Inc.) and pCMV‑dR8.2 dvpr (Addgene, Inc.) (at a
and vectors were ligated with T4 ligase (Takara Bio, Inc.). In   ratio of 4:1:3; 2 µg total plasmids) were co‑transfected into
the present study, the pLenti‑CMV‑MDM2‑GFP‑puro plasmid          293T packaging cells. Additionally, plenti‑CMV‑puro empty
sequencing process was conducted at Sangon Biotech Co., Ltd.     vector (Addgene, Inc.), pCMV‑VSV‑G and pCMV‑dR8.2 dvpr
Stbl3 competent cells were used for plasmid transformation,      (at a ratio of 4:1:3; 2 µg total plasmids) were co‑transfected into
and plasmid was extracted from Stbl3 using a TIANGEN             293T packaging cells as a control group for control stable cell
Kit. The pLenti‑CMV‑MDM2‑GFP‑puro plasmid sequencing             lines. All cells were cultured at 37˚C with 5% CO2 for 8 h, and
result and original sequence were aligned using APE software     the media were replaced by fresh media. After 24 and 36 h,
(version 2.0; https://jorgensen.biology.utah.edu/wayned/ape/;    media were collected in centrifuge tubes. Subsequently,
Fig. S1B). Flag‑14‑3‑3 and pcDNA3.1‑p53 were purchased           media were concentrated by ultracentrifugation at 16,100 x g
from Addgene, Inc.                                               for 30 min at 4˚C and filtered with a 4‑µm filter. Viral titers
                                                                 were measured, and then recombinant lentiviral particles
Cell culture. U251MG, A549, MCF‑7 and 293T cells (The Cell       (107 TU/ml) were added to U251, A549 and MCF7 cells. The
Bank of Type Culture Collection of The Chinese Academy           multiplicity of infection for U251, A549 and MCF7 cells was
of Sciences) were used in the present study. All cell lines      3, 40 and 30, respectively. Equal volumes of complete media
were cultured at 37˚C with 5% CO2. Ham's F‑12K (Kaighn's)        that contained 8 µg/ml Polybrene (Sigma‑Aldrich; Merck
Medium (Thermo Fisher Scientific, Inc.) was used to culture      KGaA) were then added. The media were replaced with fresh
A549 cells. U251MG, 293T and MCF‑7 cells were cultured           media containing 2 µg/ml Puromycin (Puro; Sigma‑Aldrich;
in DMEM with high glucose (HyClone; Cytiva). All media           Merck KGaA) for selection after 24 h for stable cell line
were supplemented with 10% FBS (Shanghai ExCell Biology,         enrichment. The duration of the selection process was 7 days.
Inc.) and 100 µg/ml penicillin and streptomycin to make          Subsequently, complete media with 1 µg/ml Puro for mainte‑
complete medium. Media were changed every other day. The         nance were used to culture this purified stable cell line. Then,
inhibitors and activators used in the present study included     2x10⁵ cells per well were seeded into six‑well plates using
an ERK inhibitor (FR180204; 10 µM, 24 h; cat. no. S7524;         0.25% Trypsin‑EDTA solution (Sigma‑Aldrich; Merck KGaA)
Selleck Chemicals), a 90 KDa ribosomal protein S6 kinase         for 5 min at 37˚C, and then the stable cells were collected for
(RSK) inhibitor (SL0101; 50 µM, 24 h; cat. no. 77307‑50‑7;       qPCR and western blotting.
Sigma‑Aldrich; Merck KGaA), vemurafenib (2 µM, 24 h;
cat. no. A3004; APeXBIO Technology LLC), a MEK                   Western blot analysis. Cells were harvested in 1.5‑ml micro‑
inhibitor U0126 (2 µM, 24 h; cat. no. 9903; Cell Signaling       centrifuge tubes and washed with PBS. Subsequently, Nonidet
Technology, Inc.), TGF‑ β (10 ng/ml, 48 h; cat. no. 8915;        P (NP)‑40 lysis buffer (2% NP‑40, 80 mM NaCl, 100 mM
Cell Signaling Technology, Inc.) and 20 mM Citrate pH 3.0        Tris‑HCl and 0.1% SDS) was added to the cells, and PMSF
(Sterile) (cat. no. 9871; Cell Signaling Technology, Inc.). To   (1 mM; Thermo Fisher Scientific, Inc.) was supplemented. Cell
examine TGF‑β inducing EMT, U251 cells were incubated            lysate was incubated on ice for 5 min and then the lysate was
with 10 ng/ml TGF‑β, and the control group was incubated         centrifuged at 16,100 x g for 10 min at 4˚C. The sample protein
with an equal volume of 20 mM citrate solution buffer, which     concentration was determined using a Bio‑Rad Protein DC
was the buffer solution for TGF‑β.                               Assay kit (Bio‑Rad Laboratories, Inc.). Protein samples (50 µg
                                                                 per lane) from the control group and treatment group were
Plasmid transfection. pcDNA6B, pcDNA6B‑Flag‑14‑3‑3,              subjected to SDS‑PAGE (15%). Next, proteins were transferred
pcDNA3.1 and pcDNA3.1‑p53 were purchased from Addgene,           from gels to a 0.45‑µm PVDF membrane (EMD Millipore)
Inc. Before transfection, MDM2‑GFP stable cells were             at 200 mA for 70 min. The membranes were blocked with
digested by tryptase that contained EDTA when the cells          5% BSA (Sigma‑Aldrich; Merck KGaA) in PBS with 0.02%
were 80% confluent. Then, 2x10⁵ cells/well were seeded           Tween 20 for 1 h at room temperature. Membranes were incu‑
into six‑well plates (Suzhou Beaver Biomedical Engineering       bated with the primary antibodies (diluted to recommended
Co., Ltd.). pcDNA6B‑Flag‑14‑3‑3 or pcDNA3.1‑p53 plasmid          concentration with 5% BSA) overnight at 4˚C. The antibodies
(2 µg) were transfected using PloyFect Effectene Transfection    used were as follows: Anti‑GAPDH (rabbit; dilution, 1:1,000
Reagent (Qiagen, Inc.) according to the manufacturer's proto‑    for western blotting; cat no. 10494‑1‑AP; ProteinTech Group,
cols when cells were 60‑80% confluent. Related empty vector      Inc.), anti‑GFP (mouse; dilution, 1:1,000 for western blotting;
(2 µg) was also transfected into MDM2‑GFP stable cells using     cat no. 66002‑1‑Ig; ProteinTech Group, Inc.), anti‑p53 (mouse;
PloyFect as a control group. Cells were cultured at 37˚C with    dilution, 1:1,000 for western blotting; cat no. TA808657;
5% CO2 for 8 h, and then the media were replaced with fresh      OriGene Technologies, Inc.), phosphorylated (p‑)B‑Raf (dilu‑
media. After transfection, cells were cultured at 37˚C with 5%   tion, 1:1,000 for western blotting; cat. no. 2696; Cell Signaling
CO2 for 36 h. When the transfection was finished, cells were     Technology, Inc.), B‑Raf (dilution, 1:1,000 for western blotting;
harvested in 1.5‑ml microcentrifuge tubes for determination      cat. no. 14814; Cell Signaling Technology, Inc.), p‑MEK (dilu‑
of gene overexpression by quantitative PCR (qPCR). Samples       tion, 1:1,000 for western blotting; cat. no. 3958; Cell Signaling
successfully transfected with plasmids were further tested by    Technology, Inc.), MEK (dilution, 1:1,000 for western
western blotting.                                                blotting; cat. no. 4694; Cell Signaling Technology, Inc.),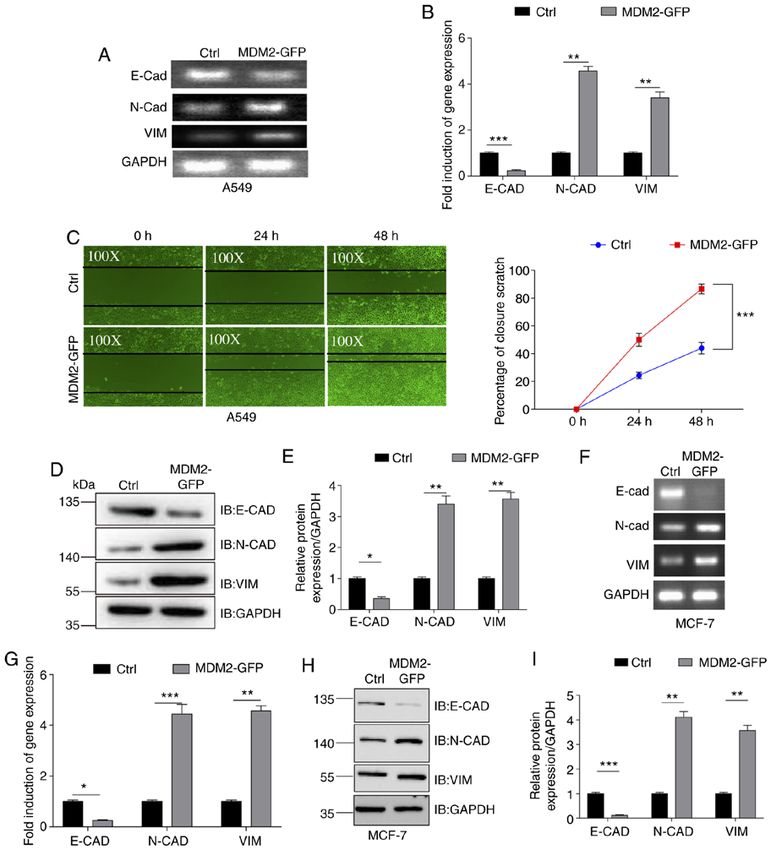
4                                    OU et al: MDM2 INDUCES EMT VIA ACTIVATION OF B-Raf

p‑ERK (T202/Y204) (dilution, 1:1,000 for western blotting;         Immunohistochemistry. Tissue sections were fixed in 10%
cat. no. 4370; Cell Signaling Technology, Inc.), ERK (dilution,    neutral buffered formalin at room temperature for 48 h and
1:1,000 for western blotting; cat. no. 4695; Cell Signaling        then embedded in paraffin. The thickness of tissue sections
Technology, Inc.), p‑ribosomal protein S6 kinase (p70S6K)          was 4 µm. For immunohistochemical staining, slides were
(T389) (dilution, 1:1,000 for western blotting; cat. no. 9206S;    placed in a 65˚C incubator for 30 min. Tissue slides were
Cell Signaling Technology, Inc.), p70S6K (dilution, 1:1,000 for    deparaffinized in xylene for 5 min, then in fresh xylene for
western blotting; cat. no. 9202S; Cell Signaling Technology,       another 5 min, 100% ethanol for 5 min, 95% ethanol for
Inc.), p‑eukaryotic translation initiation factor 4E binding       5 min and 75% ethanol for 5 min, and then washed in water
protein 1 (4EBP1) (T37/46) (dilution, 1:1,000 for western          for 5 min. Endogenous peroxidase was blocked with 3%
blotting; cat. no. 9451T; Cell Signaling Technology, Inc.),        hydrogen peroxide. Antigen retrieval was achieved using a hot
4EBP1(dilution, 1:1,000 for western blotting; cat. no. 9644S;      water bath (100˚C) and 10 mM citric sodium buffer (pH 6.0)
Cell Signaling Technology, Inc.), 14‑3‑3 (pan) (dilution,          for 15 min. Sections were then blocked with 5% BSA for 1 h
1:1,000 for western blotting; cat. no. 8312; Cell Signaling        at room temperature and incubated overnight at 4˚C with the
Technology, Inc.), E‑CAD (dilution, 1:1,000 for western            indicated primary antibodies in 5% BSA: E‑CAD (dilution,
blotting; cat. no. 20874‑1‑AP; ProteinTech Group, Inc.),           1:100; cat. no. 20874‑1‑AP; ProteinTech Group, Inc.) and
N‑cadherin (N‑CAD; dilution, 1:1,000 for western blotting;         N‑CAD (dilution, 1:50; cat. no. GTX‑127345; GeneTex, Inc.).
cat. no. GTX‑127345; GeneTex, Inc.), vimentin (VIM; dilution,      Antibody binding was detected using the EnVision™ Dual
1:1,000 for western blotting; cat. no. 5741T; Cell Signaling       Link System‑HRP DAB kit (undiluted; cat. no. K4010; Dako;
Technology, Inc.), zinc finger E‑box binding homeobox 1            Agilent Technologies, Inc.). Anti‑Rabbit HRP labeled polymer
(ZEB1; dilution, 1:1,000 for western blotting; cat. no. 3396T;     (cat. no. K4010; Dako; Agilent Technologies, Inc.) was used
Cell Signaling Technology, Inc.), Snail (dilution, 1:1,000 for     to cover tissues, followed by incubation for 30 min at room
western blotting; cat. no. 3879T; Cell Signaling Technology,       temperature. Subsequently, 20 µl DAB (~1 drop) in 1 ml DAB
Inc.), Snail family transcriptional repressor 2 (Slug; dilution,   substrate buffer was applied to each slide and incubated for
1:1,000 for western blotting; cat. no. 9585T; Cell Signaling       5 min. Sections were then counterstained with hematoxylin
Technology, Inc.), GFP (dilution, 1:1,000 for western blot‑        for 5 min at room temperature, followed by washing of the
ting; cat. no. GTX‑113617; GeneTex, Inc.) and Flag (dilution,      slides at room temperature. After staining, the slides were
1:1,000 for western blotting; cat. no. F3165; Sigma‑Aldrich;       washed with running tap water for 5 min. Subsequently, tissue
Merck KGaA). GAPDH served as a control. Then, appropriate          slides were placed in 75% ethanol for 5 min, 95% ethanol for
anti‑rabbit and anti‑mouse secondary antibodies (cat nos.          5 min, 100% ethanol for 5 min, xylene for 5 min and then in
SA00001‑1 and SA00001‑2; ProteinTech Group, Inc.; dilution,        fresh xylene for another 5 min. For negative controls, primary
1:3,000 with 5% BSA) were added to the membranes for 1 h at        antibodies were excluded. The mitotic index was quantified by
room temperature. Subsequently, membranes were exposed to          viewing and capturing images of 10 random high‑power fields
ECL solution (cat no. WBKLS0500; EMD Millipore) using an           for each tissue section on a Keyence All‑In‑One Fluorescence
Amersham Imager 600 machine (GE Healthcare). For protein           Microscope (Keyence Corporation), using a 40x or 20x
expression intensity measurement and quantification, densi‑        objective. For evaluation and quantification of immunohis‑
tometry of the bands was performed using ImageJ version 1.49       tochemical data, 10 fields within the tumor area under high
software (National Institutes of Health).                          power magnification (40x) were randomly selected for evalu‑
                                                                   ation using ImageJ version 1.49 software (National Institutes
RNA extraction, cDNA synthesis and qPCR analysis. A                of Health). The investigators performed blind counting for all
RNeasy Mini kit (cat. no. 74104; QIAGEN Inc.) was used to          quantifications.
extract total RNA of U251, MCF7 and A549 cells. The RNA
products isolated using this kit were loaded on a 1% agarose       Clinical patient glioma samples. All clinical patient glioma
gel and separated by electrophoresis. Subsequently, bands for      samples were obtained from The Affiliated Hospital of
28S RNA, 18S RNA and 5S RNA were inspected to ensure               Southwest Medical University (Luzhou, China). Recruitment
that RNA was extracted correctly. Next, the RNA quality and        was between March 2017 and May 2018. And the recruitment
concentration were assayed using a Nanodrop 2000 spectro‑          patient mean age is 33 years old. And all patient ages are
photometer (Thermo Fisher Scientific, Inc.). A total of 1 µg       among 18‑59 years old. The recruitment patient proportion is
RNA was used for cDNA synthesis using the iScript™ cDNA            50 percent male and 50 percent female. The inclusion criteria
Synthesis Kit (cat no. 170‑8890; Bio‑Rad Laboratories, Inc.).      were: i) Signature of informed consent voluntarily; ii) patho‑
The reverse transcription (RT) conditions were as follows:         logical diagnosis of glioma; iii) aged 18‑59 years old, male
25˚C for 5 min, 46˚C for 20 min, 95˚C for 60 sec, hold at 4˚C.     and female; iv) normal blood‑routine test; and v) normal liver
Primers used for qPCR are listed in Table I. PerfeCTa®             function. The exclusion criteria were: i) Patients unwilling to
SYBR® Green SuperMix (cat no. 95054‑100; Quantabio)                participate in the experiment or had poor compliance; ii) other
was used for qPCR and the conditions were as follows: 95˚C         clinical trials being conducted; iii) previous history of brain
for 3 min, 95˚C for 15 sec, 55˚C for 45 sec, 72˚C for 30 sec,      tumor and radiotherapy conducted; iv) multiple lesions with
total of 35 cycles. A CFX96 Touch Real‑Time PCR Detection          extensive radiation volume; and v) with history of radiotherapy
System (Bio‑Rad Laboratories, Inc.) was used to obtain and         for brain tumors.
analyze the data. Actin was used to normalize gene expres‑             All samples were obtained from resection surgery and
sion levels. For quantification, the 2‑ΔΔCq method was used for    handled following clinical guidelines and in compliance with
this experiment (40).                                              ethical standards (approval no. Y2019045; Southwest Medical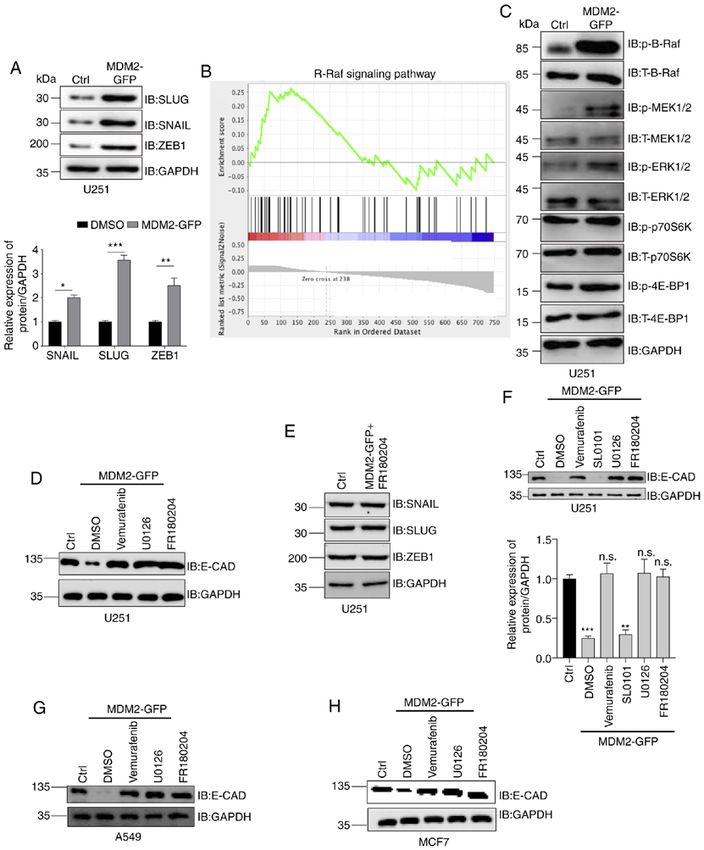
ONCOLOGY REPORTS 46: 120, 2021                                                    5

Table I. List of primers used for quantitative PCR.

Gene                                     Forward (5'‑3')                                            Reverse (5'‑3')

ACTIN                           GCTCGTCGTCGACAACGGCT                                  CAAACATGATCTGGCTCATCTTCTC
E‑CAD                           CTGAGAACGAGGCTAACG                                    TTCACATCCAGCACATCC
ZEB1                            GTGGCGGTAGATGGTAAT                                    CTGTTTGTAGCGACTGGA
SNAIL                           CCCCAATCGGAAGCCTAA                                    CCTTTCCCACTGTCCTCAT
SLUG                            TCCTGGTCAAGAAGCATT                                    GAGGAGGTGTCAGATGGA
MDM2                            CGGGAGTCCGCAGTCTTA                                    GCTTGAGGGTCTGAATCTTG
VIMENTIN                        CCAGGCAAAGCAGGAGTC                                    CGAAGGTGACGAGCCATT
N‑CAD                           CACTGCTCAGGACCCAGAT                                   TAAGCCGAGTGATGGTCC
P53                             CACCCGCGTGCTAATGG                                     ATGCTGTGTGTACTCTGCTTGAACT

All these primers were designed for human genes. E‑CAD, E‑cadherin; H, human; MDM2, MDM2 proto‑oncogene, E3 ubiquitin protein
ligase; N‑CAD, N‑cadherin; ZEB1, zinc finger E‑box binding homeobox 1.

University Ethics Committee, Luzhou, China). An informed         (version 3.3.20; Illumina, Inc.). Raw sequence data (.bcl files)
consent document was signed by the patients to agree to the      generated from Illumina HiSeq were converted into Fastq
use of their samples in scientific research. Clinical samples    files and de‑multiplexed using Illumina's bcl2fastq software
were graded according to tumor cell density, mitotic index,      (version 2.17; Illumina, Inc.). One mismatch was allowed for
degree of necrosis from the WHO Classification of Tumors         index sequence identification. The quality of Fastq files was
(3rd Edition) (41). Samples were frozen at ‑196˚C in liquid      checked with FastQC (version 0.11.8; Baraham Bioinformatics
nitrogen for qPCR, western blotting and paraffin sectioning      group; http://www.bioinformatics.babraham.ac.uk/). To be
for subsequent histological examination.                         referred to as ‘differentially expressed’, a gene had to have a
                                                                 false discovery rate adjusted P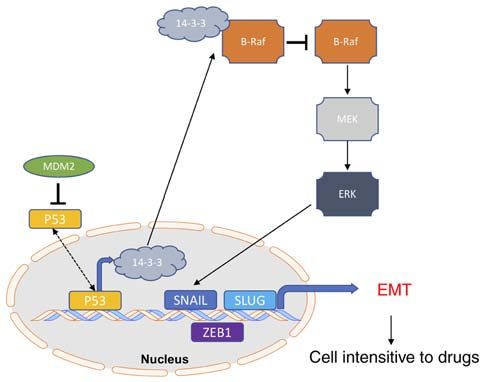
6                                    OU et al: MDM2 INDUCES EMT VIA ACTIVATION OF B-Raf

light microscope (Olympus Corporation). ImageJ (version 1.49;      present study were grouped using Adobe Illustrator software
National Institutes of Health) was used to analyze these           (version 24.0; Adobe Systems, Inc.).
images, and the cell migration ratio was calculated as follows:
N=[1‑(Dn /D 0)] x100%, where N represents the ratio of cell        Statistical analysis. Data were normalized using control
migration, Dn represents the closure distance at the sampling      markers. Data from each group were obtained from at least
time and D0 represents the original distance.                      three replicates. Mean values and SD are presented. In this
                                                                   study, statistical analysis was performed using GraphPad
Animal experiments. NOD/SCID mice (stock no. 001303)               Prism 6.0 software (GraphPad Software, Inc.). Statistical
were purchased from Chengdu Dossy Experimental Animals             significance was analyzed using an unpaired Student's t‑test
Co., Ltd. All animal experiments were performed following          or one‑way ANOVA with Tukey's post hoc test to correct for
the guidelines that were reviewed and approved by Southwest        multiple comparisons. P
ONCOLOGY REPORTS 46: 120, 2021 7 Figure 1. MDM2 expression is upregulated in TGF‑β ‑induced epithelial‑to‑mesenchymal transition. (A) U251 cells were incubated with 10 ng/ml TGF‑β for 72 h and MDM2 expression was analyzed by semi‑quantitative reverse transcription PCR. The control group was incubated with an equal volume buffer solution in the U251 cell line. GAPDH was used as a control. (B) U251 cells were incubated with 10 ng/ml TGF‑β for 72 h and the MDM2 expression was analyzed by quantitative PCR. GAPDH was used as a control. (C) MDM2, p53, E‑CAD, N‑CAD and VIM protein expression was analyzed by western blotting in U251 cells treated with 10 ng/ml TGF‑β for 72 h. GAPDH was used as a loading control. (D) Semi‑quantitative analysis of the expression levels of MDM2, E‑CAD, N‑CAD, VIM and p53 in U251 cells treated with 10 ng/ml TGF‑β for 72 h. GAPDH was used as a control. For all quantifications, data are presented as the mean ± SD derived from three independent experiments. Comparisons were made using Student's t‑test. *P
8                                            OU et al: MDM2 INDUCES EMT VIA ACTIVATION OF B-Raf

Figure 2. MDM2 overexpression induces EMT in U251 cells. (A) Immunohistochemical staining of MDM2 and quantification of positive MDM2 cells in
10 HPFs. Data are from clinical patient glioma samples that represented 5‑6 patients from each group. Scale bars, 50 µm. (B) qPCR analyses of MDM2
expression in indicated clinical patient glioma samples (three randomly selected samples per group). GAPDH served as a control. (C) Immunoblot analyses
of MDM2 expression in indicated clinical patient glioma samples. GAPDH served as a loading control. (D) Densitometric quantitation of the relative expres‑
sion levels of the MDM2 protein in the clinical patient glioma samples. n=3 independent experiments. (E) MDM2, p53 and EMT levels were analyzed by
semi‑quantitative reverse transcription PCR. Ctrl referred to the U251 cell line with stable overexpression of plenti‑CMV‑puro empty vector. GAPDH was used
as a control. (F) MDM2, p53 and E‑CAD, N‑CAD and VIM expression was analyzed by qPCR. Ctrl referred to the U251 cell line with stable overexpression
of plenti‑CMV‑puro empty vector. (G) Immunoblot analyses and semi‑quantitative analysis of the expression levels of MDM2, E‑CAD, N‑CAD, VIM and
p53 in stable MDM2 overexpression cells and control cells. Ctrl referred to the U251 cell line with stable overexpression of plenti‑CMV‑puro empty vector.
(H) Gene Set Enrichment Analysis plot for U251 cells showing the most significantly changed EMT pathway gene set. Note that the EMT gene signature was
significantly upregulated upon expression of MDM2 but downregulated upon expression of empty vector. For all quantifications, data are presented as the
mean ± SD derived from three independent experiments. Statistical significance was analyzed using an unpaired Student's t‑test in (E, F and G) Statistical
significance was analyzed using one‑way ANOVA with Tukey's post hoc test to correct for multiple comparisons in (A, B and D). *P
ONCOLOGY REPORTS 46: 120, 2021                                                                    9

Figure 3. MDM2 overexpression induces EMT in A549 and MCF7 cells. (A) EMT levels were analyzed by SqRT‑PCR. GAPDH served as a control. Ctrl
referred to the A549 cell line with stable overexpression of plenti‑CMV‑puro empty vector. (B) E‑CAD, N‑CAD and VIM levels were analyzed by qPCR in a
A549 stable cell line. Ctrl referred to the A549 cell line with stable overexpression plenti‑CMV‑puro empty vector. GAPDH served as a control. (C) Migration
of MDM2‑GFP‑overexpressing A549 cells (magnification, x100) and control cells (magnification, x100) at 0, 24 and 48 h after wounding. Data are presented as
the percentage closure of each scratch at 0, 24 and 48 h after wounding. MDM2 overexpression significantly induced cell migration in A549 cells. Ctrl referred
to the A549 cell line with stable overexpression of plenti‑CMV‑puro empty vector. (D) E‑CAD, N‑CAD and VIM levels were analyzed by western blotting
in a MDM2‑overexpressing A549 stable cell line and A549 control cells. Ctrl referred to the A549 cell line with stable overexpression of plenti‑CMV‑puro
empty vector. (E) Semi‑quantification of the relative expression levels of the E‑CAD, N‑CAD and VIM levels in a MDM2‑overexpressing A549 stable cell
line and A549 control cells. n=3 independent experiments. Ctrl referred to the A549 cell line with stable overexpression of plenti‑CMV‑puro empty vector.
(F) EMT levels were analyzed by SqRT‑PCR in MCF7 stable cell lines. Ctrl referred to the MCF7 cell line with stable overexpression of plenti‑CMV‑puro
empty vector. GAPDH served as a control. (G) E‑CAD, N‑CAD and VIM levels were analyzed by qPCR in MCF7 stable cell lines. Ctrl referred to the MCF7
cell line with stable overexpression of plenti‑CMV‑puro empty vector. GAPDH served as a control. (H and I) E‑CAD, N‑CAD and VIM expression was
analyzed by western blotting in MCF7 stable cell lines. Ctrl referred to the MCF7 cell line with stable overexpression of plenti‑CMV‑puro empty vector. For
all quantifications, data are presented as the mean ± SD derived from three independent experiments. Comparisons were made using Student's t‑test. *P
10                                            OU et al: MDM2 INDUCES EMT VIA ACTIVATION OF B-Raf

Figure 4. MDM2 induces epithelial‑to‑mesenchymal transition progression via the B‑Raf signaling pathway. (A) Snail, Slug and ZEB1 expression was analyzed
by western blotting in stable MDM2‑overexpressing U251 cells and control U251 cells. Ctrl referred to the U251 cell line with stable overexpression of
plenti‑CMV‑puro empty vector. GAPDH was used as a control, and semi‑quantitative analysis is shown. (B) Gene Set Enrichment Analysis plot of U251 cells
showing the most significantly changed B‑Raf signaling pathway set. Note that the B‑Raf signaling pathway was significantly upregulated upon expression of
MDM2 but downregulated upon expression of empty vector. (C) Western blot analysis of the levels of p‑B‑Raf, p‑MEK, p‑ERK, p‑P70S6K and p‑4EBP1 in
stable MDM2‑overexpressing U251 cells and control U251 cells. Ctrl referred to the U251 cell line with stable overexpression of plenti‑CMV‑puro empty vector.
GAPDH served as a control. (D) E‑CAD levels were analyzed by western blotting in control U251 cells and stable MDM2‑overexpressing U251 cells following
treatment with DMSO, vemurafenib (B‑Rafi at 2 µM for 24 h), U0126 (MEKi at 20 µM for 24 h) and FR180204 (ERKi at 10 µM for 24 h). Ctrl referred to the
U251 cell line with stable overexpression of plenti‑CMV‑puro empty vector. GAPDH was used as a control. (E) Snail, Slug and ZEB1 levels were analyzed by
western blotting in control U251 cells and stable MDM2‑overexpressing U251 cells treated with FR180204 (ERKi at 10 µM for 24 h). Ctrl referred to the U251
cell line with stable overexpression of plenti‑CMV‑puro empty vector. GAPDH was used as a normalization control. (F) E‑CAD expression was analyzed by
western blotting in stable control U251 cells and stable MDM2‑overexpressing U251 cells treated with Vemurafenib, U0126, FR180204 and SL0101 (RSKi
at 50 µM for 24 h). Ctrl referred to the U251 cell line with stable overexpression of plenti‑CMV‑puro empty vector. GAPDH was used as a control, and the band
density was semi‑quantified. (G) E‑CAD expression was analyzed by western blotting in stable control A549 cells and stable MDM2‑overexpressing A549
cells treated with DMSO, vemurafenib (B‑Rafi at 2 µM for 24 h), U0126 (MEKi at 20 µM for 24 h), and FR180204 (ERKi at 10 µM for 24 h). Ctrl referred to
the A549 cell line with stable overexpression of plenti‑CMV‑puro empty vector. GAPDH was used as a control. (H) E‑CAD levels were analyzed by western
blotting in stable control MCF7 cells and stable MDM2‑overexpressing MCF7 cells treated with DMSO, vemurafenib (B‑Rafi at 2 µM for 24 h), U0126 (MEKi
at 20 µM for 24 h) or FR180204 (ERKi at 10 µM for 24 h). Ctrl referred to the MCF7 cell line with stable overexpression of plenti‑CMV‑puro empty vector.
GAPDH was used as a control. For all quantifications, data are presented as the mean ± SD derived from three independent experiments. Statistical significance
was analyzed using an unpaired Student's t‑test for A, and one‑way ANOVA with Tukey's post hoc test was used to compare the indicated group and Ctrl in F.
*
 P
ONCOLOGY REPORTS 46: 120, 2021                                                   11

expression levels of E‑CAD and p53, and markedly increased         may have been upregulated when MDM2 was overexpressed.
the protein expression levels of N‑CAD and VIM (Fig. 2G).          Snail, Slug and ZEB1 are the most important transcriptional
MDM2 overexpression and control U251 cell lines were then          factors of EMT (Fig. 4A) (6,43,44). Therefore, Snail, Slug
used for RNA‑Seq. GSEA revealed that the EMT pathway               and ZEB1 protein expression was analyzed by western blot‑
gene set was closely associated with the expression levels of      ting in stable MDM2‑overexpressing U251 cells and control
MDM2 compared with the control group (Fig. 2H). Overall,           U251 cells. As shown in the semi‑quantification data, MDM2
MDM2 overexpression could induce EMT in U251 cells.                overexpression significantly upregulated the protein expres‑
                                                                   sion levels of Snail, Slug and ZEB1 (Fig. 4A). Since these
MDM2 overexpression induces EMT in A549 and MCF7                   transcription factors were activated, the present study aimed
cancer cells. The aforementioned results demonstrated that         to determine the upstream signaling pathway driving their
overexpression of MDM2 could promote EMT in the U251               upregulation. Therefore, GSEA was used to analyze these two
glioma cell line. Subsequently, the present study examined         stable cell lines, and revealed that the gene set for the B‑Raf
whether MDM2 overexpression induced EMT in other cancer            signaling pathway was closely associated with MDM2 expres‑
cell lines. Lentivirus from 293T cells was added to the A549       sion compared with the control group (Fig. 4B). Additionally,
lung cancer cell line to yield control A549 cells and A549 cells   GSEA was used to analyze whether the mTOR signaling
stably overexpressing MDM2‑GFP. Green fluorescence was             pathway was associated with the expression levels of MDM2.
observed in stable A549 cells after purification (Fig. S1E), and   However, according to the present data, no significant asso‑
the gene and protein expression levels of MDM2‑GFP were            ciation was observed between the mTOR signaling pathway
assessed by qPCR (Fig. S2A) and western blotting (Fig. S2B).       and MDM2 overexpression in U251 cells (data not shown).
Subsequently, the gene expression levels of E‑CAD, N‑CAD           Subsequently, western blotting was used to analyze the levels
and VIM were determined by SqRT‑PCR and qPCR in these              of p‑B‑Raf, p‑MEK and p‑ERK to verify whether the B‑Raf
two stable A549 cell lines (Fig. 3A and B). As shown in the        signaling pathway was activated by MDM2 overexpression.
quantification analysis, MDM2 overexpression significantly         Consistent with the present GSEA data, western blotting
decreased the gene expression levels of E‑CAD and signifi‑         demonstrated that the B‑Raf signaling pathway was activated
cantly increased the gene expression levels of N‑CAD and           (Fig. 4C). Furthermore, the levels of p‑P70S6K and p‑4EBP1,
VIM. Furthermore, the migration ability of these two stable        downstream target genes of mTOR, were determined by
cell lines was determined. Scratch wound assays were used to       western blotting (45‑47). No significant changes in the levels
evaluate their migration abilities and the percentage closure of   of p‑P70S6K and p‑4EBP1 were detected, indicating that this
the scratch wound was quantified at 0, 24 and 48 h post injury     process was independent of the mTOR signaling pathway
in these two cell lines (Fig. 3C). As shown by the images          (Fig. 4C). E‑CAD levels were also analyzed by western blotting
of migration and quantification data, the percentage closure       in stable control U251 cells and stable U251 cells overexpressing
in the MDM2 overexpression group was higher than that in           MDM2‑GFP following treatment with DMSO, vemurafenib
the control group at 24 and 48 h post injury (Fig. 3C). These      (B‑Raf inhibitor) (48,49), U0126 (MEK inhibitor) (50,51) and
data demonstrated that MDM2 overexpression increased the           FR180204 (ERK inhibitor) (52,53). As shown in Fig. 4, vemu‑
cell migration abilities of A549 cells. Additionally, E‑CAD,       rafenib, U0126 and FR180204 could prevent the decrease in
N‑CAD and VIM protein expression was analyzed by western           the protein expression of E‑CAD (Fig. 4D and F). However,
blotting (Fig. 3D and E). Consistently, MDM2 overexpression        RSK inhibitor SL0101 did not affect the protein expression of
significantly decreased the protein expression levels of E‑CAD     E‑CAD (Fig. 4D and F), which suggested that inhibition of
and significantly increased the protein expression levels of       B‑Raf signaling could prevent MDM2 from inducing EMT. In
N‑CAD and VIM (Fig. 3D and E). Therefore, the present data         other words, MDM2 promoted EMT by activating the B‑Raf
demonstrated that MDM2 overexpression induced EMT in the           signaling pathway. Subsequently, the protein expression levels
A549 lung cancer cell line. Furthermore, this was also tested      of Snail, Slug and ZEB1 were analyzed by western blotting
in the MCF7 breast cancer cell line. Green fluorescence was        in MDM2‑overexpressing U251 cells which were treated with
observed in stable MCF7 cells after purification (Fig. S1F),       FR180204 and in control U251 cells (U251 cell line with
and gene and protein expression levels of MDM2‑GFP were            stable overexpression of plenti‑CMV‑puro empty vector). No
assessed by qPCR (Fig. S2C) and western blotting (Fig. S2D).       significant changes in the expression levels of Snail, Slug or
According to SqRT‑PCR, qPCR and western blotting data,             ZEB1 were detected between the two groups by western blot‑
MDM2 overexpression also induced EMT in MCF7 cells                 ting, which suggested that ERK inhibition could inhibit the
(Fig. 3F‑H). Therefore, overexpression of MDM2 promoted            increase of these EMT transcription factors (Fig. 4E). These
EMT in a number of cancer cell lines.                              data verified that MDM2 induced EMT by upregulating
                                                                   EMT transcription factors via the B‑Raf signaling pathway.
MDM2 induces EMT by activating B‑Raf signaling. Previously,        Additionally, the present data demonstrated that B‑Raf inhibi‑
it was demonstrated that MDM2 promoted EMT in glioma               tors, MEK inhibitors and ERK inhibitors could all rescue the
cells (U251), lung cancer cells (A549) and breast cancer cells     protein expression levels of E‑CAD. RSK is a downstream
(MCF7). However, the mechanism by which MDM2 induced               protein kinase of ERK (54,55). To determine whether compo‑
EMT was not clear. Therefore, the present study aimed to           nents downstream of ERK also participated in this process,
determine the mechanism driving this EMT. It was previously        western blotting was used to analyze E‑CAD protein expres‑
identified that the protein expression levels of E‑CAD, N‑CAD      sion in control U251 cells and MDM2‑overexpressing U251
and VIM were altered, and the gene levels were also altered.       cells treated with SL0101 (RSK inhibitor). As shown in the
This suggested that the transcription factors that control EMT     western blot images and semi‑quantification data, only the
12 OU et al: MDM2 INDUCES EMT VIA ACTIVATION OF B-Raf Figure 5. MDM2‑mediated B‑Raf signaling pathway activation via 14‑3‑3 is dependent on p53. (A) MDM2, p53, E‑CAD, N‑CAD and VIM protein expression was analyzed by western blotting in control U251 cells and stable MDM2‑overexpressing U251 cells transfected with pcDNA3.1‑p53. Ctrl referred to the U251 cell line with stable overexpression of plenti‑CMV‑puro empty vector. GAPDH was used as a control. (B) Western blot analysis of the expression levels of 14‑3‑3 in stable MDM2‑overexpressing U251 cells and control U251 cells. Ctrl referred to the U251 cell line with stable overexpression of plenti‑CMV‑puro empty vector. GAPDH was used as a control. Semi‑quantitative analysis data are shown. (C) MDM2, 14‑3‑3, E‑CAD, N‑CAD, VIM and p‑B‑Raf protein expression was analyzed by western blotting in control U251 cells and stable MDM2‑overexpressing U251 cells expressing Flag‑14‑3‑3. Ctrl referred to the U251 cell line with stable overexpression of plenti‑CMV‑puro empty vector. GAPDH was used as a control. (D) Colony formation assay for control U251 cells, stable MDM2‑overexpressing U251 cells and stable MDM2‑overexpressing U251 cells treated with FR180204 (ERKi at 10 µM). Ctrl referred to the U251 cell line with stable overexpression of plenti‑CMV‑puro empty vector. Data are presented as the mean ± SD percentage of colonies for each group after 14 days (bottom). n=3 independent experiments. (E) Images of the migration of control U251 cells (magnification, x100), stable MDM2‑GFP overexpressing U251 cells (magnification, x100) and stable MDM2‑GFP‑overexpressing U251 cells treated with FR180204 (ERKi at 10 µM) (magnification, x100) at 0, 24 and 48 h after wounding. MDM2 could induce cell migration in U251 cells and FR180204 treatment could rescue this cell migration in scratch wound assays. Ctrl referred to the U251 cell line with stable overexpression of plenti‑CMV‑puro empty vector. For all quantifications, data are presented as the mean ± SD derived from three independent experiments. Statistical significance was analyzed using an unpaired Student's t‑test in B, and one‑way ANOVA with Tukey's post hoc test was used to compare the indicated group and Ctrl or two indicated groups in D and E. **P
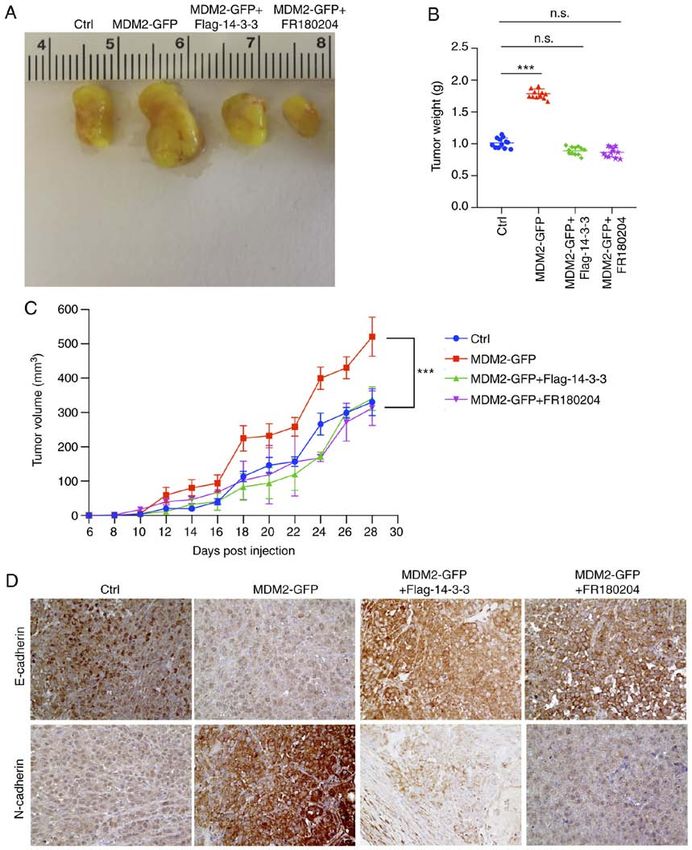
ONCOLOGY REPORTS 46: 120, 2021                                                                 13

Figure 6. B‑Raf signaling, which is activated by MDM2, can promote glioma xenograft tumor progression. (A) Representative images of tumors of NOD/SCID
mice bearing U251 xenografts stably expressing empty vector, MDM2, MDM2 together with 14‑3‑3 or MDM2 together with an ERK inhibitor. Tumors isolated
on day 28 after subcutaneous injection. Ctrl referred to tumors, which were injected with the stable overexpression of plenti‑CMV‑puro empty vector U251
cell line. Data are from one representative animal of 5‑6 animals from each group. (B) Tumor weight from experiment in (A) upon autopsy at day 28 post
injection. Ctrl referred to tumors, which were injected with the stable overexpression of plenti‑CMV‑puro empty vector U251 cell line. Results are presented
as the mean weight (g) ± SD for 5‑6 mice per group. (C) Tumor volume of xenografts formed after subcutaneous injection of NOD/SCID mice with U251 cells
stably expressing indicated plasmids. Ctrl referred to tumors, which were injected with the stable overexpression of plenti‑CMV‑puro empty vector U251 cell
line. Results are presented as the mean volume ± SD for 5‑6 mice per group per time point. (D) Immunohistochemical staining of E‑cadherin and N‑cadherin
in indicated U251 xenograft tumor genotypes (magnification, x400). Data are from 1 animal that was representative of the 5‑6 animals from each group
(n=5‑6 mice per group). Ctrl referred to tumors, which were injected with the stable overexpression of plenti‑CMV‑puro empty vector U251 cell line. For all
quantifications, data are presented as the mean ± SD derived from three independent experiments. Comparisons were made using Student's t‑test. ***P
14                                            OU et al: MDM2 INDUCES EMT VIA ACTIVATION OF B-Raf

Figure 7. MDM2 overexpression prevents sensitivity to growth inhibition by silibinin in U251, A549 and MCF7 cells. (A) After cells were treated with the
indicated doses of silibinin (0, 10, 20, 40, 60, 80, 100 or 200 µM), cell viabilities were determined using an MTT assay after 24 h in control U251 cells and
MDM2‑overexpressing U251 cells. Ctrl referred to the U251 cell line with stable overexpression of plenti‑CMV‑puro empty vector. (B) After cells were treated
with the indicated doses of silibinin (0, 10, 20, 40, 60, 80, 100 and 200 µM), cell proliferation were determined using an MTT assay after 48 h in control U251
cells and MDM2‑overexpressing U251 cells. Ctrl referred to the U251 cell line with stable overexpression of plenti‑CMV‑puro empty vector. (C) After cells
were treated with the indicated doses of silibinin (0, 10, 20, 40, 60, 80, 100 and 200 µM), cell proliferation were determined using an MTT assay after 48 h
in control A549 cells and MDM2‑overexpressing A549 cells. Ctrl referred to the A549 cell line with stable overexpression of plenti‑CMV‑puro empty vector.
(D) After cells were treated with the indicated doses of silibinin (0, 10, 20, 40, 60, 80, 100 and 200 µM), cell proliferation were determined using an MTT assay
after 48 h in control MCF7 cells and MDM2‑overexpressing MCF7 cells. Ctrl referred to the MCF7 cell line with stable overexpression of plenti‑CMV‑puro
empty vector. (E) Control U251 cells and MDM2‑overexpressing U251 cells were treated with the indicated doses of silibinin (80 and 100 µM) for 48 h, and
total mRNA was subjected to SqRT‑PCR to analyze VEGF expression. Ctrl referred to the U251 cell line with stable overexpression of plenti‑CMV‑puro
empty vector. GAPDH served as a normalization control. (F) Total mRNA from control U251 cells and MDM2‑overexpressing U251 cells was subjected
to quantitative PCR to analyze the changes in MDM2, β ‑arrestin1, β ‑arrestin2, MMP‑2, MMP‑9 and VEGF expression. Ctrl referred to the U251 cell line
with stable overexpression of plenti‑CMV‑puro empty vector. GAPDH was used as a control. Quantitative analysis data are shown. (G) Control A549 cells
and MDM2‑overexpressing A549 cells were treated with the indicated doses of silibinin (80 and 100 µM) for 48 h, and then total mRNA was subjected to
SqRT‑PCR to analyze VEGF expression. Ctrl referred to the U251 cell line with stable overexpression of plenti‑CMV‑puro empty vector. GAPDH served
as a control. (H) Control MCF7 cells and MDM2‑overexpressing MCF7 cells were treated with the indicated doses of silibinin (80 and 100 µM) for 48 h,
and then total mRNA was subjected to SqRT‑PCR to analyze changes in VEGF expression. Ctrl referred to the U251 cell line with stable overexpression of
plenti‑CMV‑puro empty vector. GAPDH served as a normalization control. For all quantifications, data are presented as the mean ± SD derived from three
independent experiments. Statistical significance was analyzed using an unpaired Student's t‑test in (F), and one‑way ANOVA with Tukey's post hoc test was
used to compare the indicated group and the 0 µM group within the Ctrl type, or the indicated group and the 0 µM group within the MDM2‑GFP type, or
two indicated groups in A‑D. *P
ONCOLOGY REPORTS 46: 120, 2021                                                     15

vemurafenib, U0126 or FR180204. Similar to the results in            wounding. As shown in the images of the migration and the
U251 cells, B‑Raf, MEK and ERK inhibitors could all rescue a         quantification data, the percentage closure of the scratch in
decrease in E‑CAD protein expression (Fig. 4G). Furthermore,         the MDM2 overexpression group was higher than that in the
the same experiment was repeated in MCF7 cells (Fig. 4H).            control group at 24 and 48 h post wounding (Fig. 5E). However,
To summarize, MDM2 induced EMT by upregulating EMT                   there was no significant difference between MDM2 U251 cells
transcription factors via activation of ERK regulated by B‑Raf.      treated with FR180204 and the control group, which meant
                                                                     that the migration ability was inhibited by ERK inhibition in
MDM2 activates B‑Raf signaling through 14‑3‑3 and p53.               MDM2 U251 cells (Fig. 5E). To summarize, MDM2 induced
As demonstrated in the aforementioned experiments, MDM2              EMT by activating the B‑Raf signaling pathway through
induced EMT by upregulating EMT transcription factors                14‑3‑3, which depended on p53.
through ERK. Furthermore, it was revealed that MDM2
expression was associated with the degradation of p53, thus          B‑Raf signaling, which is activated by MDM2, can promote
decreasing the protein expression levels of p53 (Fig. 2E‑G).         glioma xenograft tumor progression. To assess whether
Therefore, the present study aimed to explore whether the            MDM2 activated B‑Raf signaling function in tumor progres‑
mechanism of MDM2‑induced EMT depended on p53. qPCR                  sion, a xenograft model was established in NOD/SCID mice
and western blotting were used to analyze p53, E‑CAD,                with U251 tumors. In agreement with the colony formation
N‑CAD and VIM protein expression in control U251 cells               data (Fig. 5D), MDM2 expression accelerated tumor growth.
and U251 cells overexpressing p53 together with MDM2‑GFP             By contrast, tumor growth was significantly inhibited when
(Figs. 5A and S2E). As shown in Fig. 5, overexpression of p53        MDM2 was overexpressed together with 14‑3‑3 or when
rescued the decrease of E‑CAD and inhibited the increase             treated with an ERK inhibitor (Fig. 6A‑C). These results
of N‑CAD and VIM (Fig. 5A). These results indicated that             indicated that the MDM2‑activated B‑Raf signaling pathway
the overexpression of p53 inhibited EMT induced by MDM2.             promoted clonogenicity and glioma xenograft tumor growth.
In other words, MDM2‑induced EMT was p53‑dependent.                      Immunohistochemical analyses also demonstrated
Previous studies have reported that 14‑3‑3 is one of the most        increased N‑CAD expression and decreased E‑CAD expres‑
important p53 transcriptional targets (56‑59). Notably, 14‑3‑3       sion in U251 xenografts expressing MDM2, which represented
can deactivate Raf directly and prevent its activation (24‑27).      the occurrence of an EMT process (Fig. 6D). Loss of E‑cadherin
The present study used western blot analysis to determine the        has been associated with accelerated tumor progression and
expression levels of 14‑3‑3 in stable MDM2‑overexpressing            metastasis (6,7). By contrast, EMT was inhibited in xenografts
U251 cells and control U251 cells. As shown by the                   overexpressing MDM2 together with 14‑3‑3 or those treated
semi‑quantitative analysis data, 14‑3‑3 expression was mark‑         with an ERK inhibitor (Fig. 6D). This demonstrated a partial
edly decreased in stable MDM2‑overexpressing U251 cells              EMT‑like process in MDM2 tumors, which was reversed in
compared with the control group (Fig. 5B). Furthermore, as           tumors which overexpressed Flag 14‑3‑3 or were treated with
the most important downstream autophagy transcription                FR180204. Collectively, these results indicated that the B‑Raf
factor of 14‑3‑3, transcription factor EB (TFEB) expression          signaling pathway serves as a downstream effector of MDM2,
was decreased following MDM2 overexpression in the U251              contributing to tumor progression and higher metastatic
cell line (data not shown). Previously, the relationship of 14‑3‑3   potential.
with B‑Raf has been discussed, and it has been revealed that
lower 14‑3‑3 expression is associated with an activated B‑Raf        MDM2 promotes cell insensitivity to drug treatment by
signaling pathway (39), which was consistent with the present        inducing EMT. It has been reported that EMT contributes
B‑Raf signaling pathway data. Therefore, the present study           to cancer cell resistance to chemotherapy agents (30‑32).
aimed to verify whether MDM2 activated the B‑Raf signaling           According to previous studies, numerous chemicals have
pathway via 14‑3‑3. 14‑3‑3 overexpression was checked by             little or no effect on cells that have undergone EMT in a
qPCR (Fig. S2F) and MDM2, 14‑3‑3, E‑CAD, N‑CAD, VIM                  number of cancer types, for example breast cancer cells and
and p‑B‑Raf protein levels were analyzed by western blotting         glioma (30‑32). Therefore, the present study aimed to explore
in control cells and cells stably overexpressing MDM2 together       whether MDM2 could promote cell insensitivity to drug treat‑
with Flag‑14‑3‑3 (Fig. 5C). Overexpression of 14‑3‑3 inhib‑          ment by inducing EMT. Silibinin, also known as silybin, is
ited the activation of the B‑Raf signaling pathway. Notably,         a promising cancer treatment drug (60,61). The present study
overexpression of 14‑3‑3 rescued the decrease in E‑CAD and           aimed to determine whether overexpression of MDM2 could
inhibited the increase in N‑CAD and VIM, which meant that            affect drug sensitivities. First, stable overexpression MDM2
overexpression of 14‑3‑3 could prevent MDM2‑induced EMT              U251 cells and control cells were treated with indicated doses
(Fig. 5C). The colony formation abilities of control cells and       of silibinin (0, 10, 20, 40, 60, 80, 100 and 200 µM) and cell
MDM2‑overexpressing U251 cells with or without FR180204              viability was determined using an MTT assay after 24 h.
were determined. As shown in the quantification data, MDM2           As shown in the quantification data, control cells were more
overexpression significantly increased the colony formation          sensitive to 40, 60, 80 and 100 µM silibinin treatment than
rate. However, this increased colony formation rate induced by       MDM2‑U251 cells at 24 h (Fig. 7A). Subsequently, an MTT
MDM2 could be inhibited by treatment with an ERK inhibitor           assay was used again after 48 h in these two cell lines. Similar
(Fig. 5D). Scratch wound assays were used to detect the migra‑       to the data from 24 h, control cells were more sensitive to silib‑
tion abilities in control cells and MDM2‑overexpressing U251         inin treatment than MDM2‑U251 cells at 48 h (Fig. 7B). This
cells with or without FR180204 treatment. The percentage             suggested that MDM2 promoted cell insensitivity to silibinin
closure of the scratch was quantified at 0, 24 and 48 h after        by inducing EMT in the U251 glioma cell line. Furthermore,
You can also read