Estrogen as an Essential Resource and the Coexistence of ER+ and ER Cancer Cells
←
→
Page content transcription
If your browser does not render page correctly, please read the page content below
ORIGINAL RESEARCH
                                                                                                                                         published: 17 August 2021
                                                                                                                                    doi: 10.3389/fevo.2021.673082

                                            Estrogen as an Essential Resource
                                            and the Coexistence of ER+ and ER−
                                            Cancer Cells
                                            Irina Kareva 1* and Joel S. Brown 2
                                            1
                                             Computational and Modeling Sciences Center, Arizona State University, Tempe, AZ, United States, 2 Department
                                            of Integrated Mathematical Oncology, Moffitt Cancer Center, Tampa, FL, United States

                                            Diagnosis of estrogen sensitivity in breast cancer is largely predicated on the ratio of ER+
                                            and ER− cancer cells obtained from biopsies. Estrogen is a growth factor necessary for
                                            cell survival and division. It can also be thought of as an essential resource that can
                                            act in association with other nutrients, glucose, glutamine, fatty acids, amino acids,
                                            etc. All of these nutrients, collectively or individually, may limit the growth of the cancer
                                            cells (Liebig’s Law of the Minimum). Here we model estrogen susceptibility in breast
                                            cancer as a consumer-resource interaction: ER+ cells require both estrogen and glucose
                                            as essential resources, whereas ER− only require the general resource. The model
                                            predicts that when estrogen is the limiting factor, other nutrients may go unconsumed
                                            and available at higher levels, thus permitting the invasion of ER− cells. Conversely,
                                            when ER− cells are less efficient on glucose than ER+ cells, then ER− cells limited by
                                            glucose may be susceptible to invasion by ER+ cells, provided that sufficient levels of
                           Edited by:
                                            estrogen are available. ER+ cells will outcompete ER− cells when estrogen is abundant,
                    Frederick R. Adler,
 The University of Utah, United States      resulting in low concentrations of interstitial glucose within the tumor. In the absence
                      Reviewed by:          of estrogen, ER− cells will outcompete ER+ cells, leaving a higher concentration of
                      Deepti Mathur,        interstitial glucose. At intermediate delivery rates of estrogen and glucose, ER+ and
     Memorial Sloan Kettering Cancer
                Center, United States
                                            ER− cells are predicted to coexist. In modeling the dynamics of cells in the same
                  Russell C. Rockne,        tumor with different resource requirements, we can apply concepts and terms familiar
     Beckman Research Institute, City
                                            to many ecologists. These include: resource supply points, R∗ , ZNGI (zero net growth
              of Hope, United States
                                            isoclines), resource depletion, and resource uptake rates. Based on the circumstances
                  *Correspondence:
                         Irina Kareva       favoring ER+ vs. ER− breast cancer, we use the model to explore the consequences
                    ikareva@asu.edu         of therapeutic regimens that may include hormonal therapies, possible roles of diet in
                                            changing cancer cell composition, and potential for evolutionarily informed therapies.
                  Specialty section:
        This article was submitted to       More generally, the model invites the viewpoint that cancer’s eco-evolutionary dynamics
 Behavioral and Evolutionary Ecology,       are a consumer-resource interaction, and that other growth factors such as EGFR or
               a section of the journal
   Frontiers in Ecology and Evolution       androgens may be best viewed as essential resources within these dynamics.
        Received: 26 February 2021          Keywords: subsistence levels, estrogen dependence, ER+ /ER− breast cancer, evolutionary steering,
           Accepted: 22 July 2021           mathematical model, Liebig’s Law of the Minimum
         Published: 17 August 2021
                              Citation:
       Kareva I and Brown JS (2021)
                                            INTRODUCTION
  Estrogen as an Essential Resource
and the Coexistence of ER+ and ER−
                                            Food-webs within ecosystems describe the trophic relationship between species of an ecological
                         Cancer Cells.      community. There can be predators, prey and resources, where different species find themselves
          Front. Ecol. Evol. 9:673082.      consuming those on a lower trophic level, while being consumed by those on a higher one
     doi: 10.3389/fevo.2021.673082          (Rosenzweig, 1971; Oksanen et al., 1981). Predators exploit prey, prey exploit resources, and

Frontiers in Ecology and Evolution | www.frontiersin.org                         1                                          August 2021 | Volume 9 | Article 673082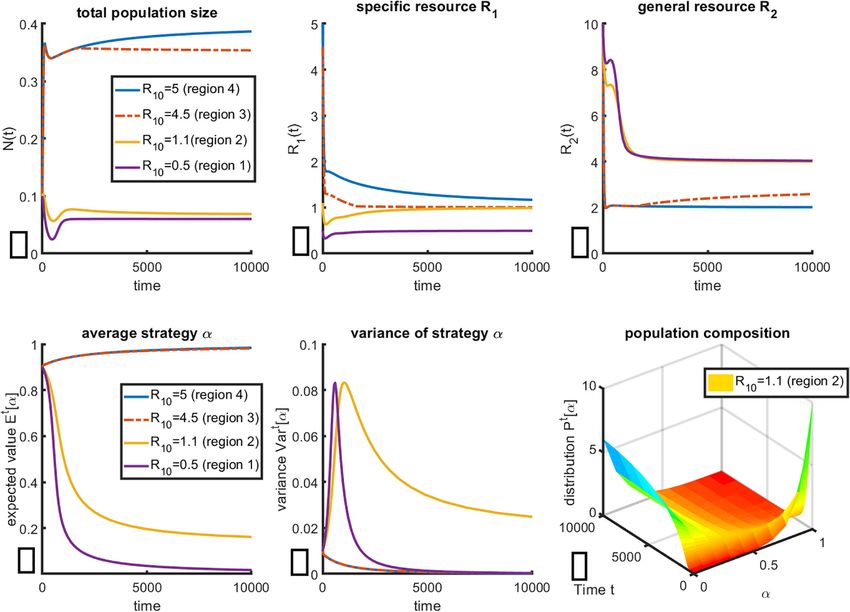
Kareva and Brown                                                                                                    Estrogen as an Essential Resource

resource renewal fuels the food-web. For species on the same               cells. Hormones are examples of such specific resources that serve
trophic level, competition is often indirect. One individual               to regulate specific cells within specific tissues; examples of such
competes with another by consuming and depressing                          resources include estrogen for glandular tissue in the breast and
the availability of shared resources. Such ecosystems may                  testosterone for glandular tissue in the prostate that are necessary
have two, three, four, or possibly even more trophic levels                for these cells to proliferate. Even as all other nutrients are in
(Oksanen and Oksanen, 2000).                                               ample supply, proliferation of subsets of cells can be controlled
   A key element of consumer-resource dynamics is the                      by regulating the hormone supply. Hormones, therefore, serve
nutritional relationship of resources to the consumer, often               as essential resources relative to the pool of other resources. Yet,
showcased by the “beer and pretzel” example of complementary               as growth factors, they do not provide fuel or material for the
resources. To a consumer, two resources may be perfect                     cell. Nevertheless, specific cells have evolved to be metabolically
substitutes, complementary, hemi-essential or essential (Tilman,           wired to require these growth factors as keys (they generally
1980). Two nutrients are perfect substitutes if the value                  form a dimer with another molecule within the cell (Duffy, 2006;
of a given diet is a linear, weighted average of the two                   Razandi et al., 2004; Lallous et al., 2013) to initiate metabolic
nutrients in the diet. They are complementary if there are                 pathways, including the possibility of cell division. They are
diminishing returns to fitness from consuming more of one                  used up in the process and metabolically broken down. As such,
of the resources. They are hemi-essential if (i) a non-zero                they are a faux resource, whose adaptive value is for the whole
amount of each must be consumed, (ii) there are diminishing                organism and not for the individual cell (Tilman, 1982).
returns to consuming more of one, and (iii) consuming more                    Breast cancer cells, at least initially, carry the ancestral trait of
of one resource increases the value of consuming the other                 requiring estrogen as an essential resource. The ability of cells
(Letnic and Crowther, 2013).                                               to recognize and utilize estrogen is mediated through estrogen
   Two resources are essential if some ratio of the two must               receptors (ER), which have been an appealing therapeutic target
be consumed to achieve higher reward. That is, increasing                  for patients with breast cancer since their discovery over a century
consumption of the first resource has no value if consumption              ago. Beatson (1896) first observed in 1896 that removing the
of the second resource limits the diet’s value, and vice-versa.            ovaries can lead to breast cancer remission. Over half a century
Such resources conform to Liebig’s Law of the Minimum (Liebig,             later, estrogen and its receptors were confirmed as key actors
1876). In the context of agriculture, Justus Freiherr von Liebig           in breast cancer (Jensen et al., 1971), marking the beginning of
(von Liebig, 1840; Liebig, 1876) noted that beyond a certain               therapies to interfere with ER signaling to treat the disease.
point adding more of one nutrient, such as nitrogen, did not                  Once a patient’s breast cancer is clinically detectable, cells of
increase yields as some other nutrient, such as phosphorus, was            the tumor can be classified as ER+ (requiring estrogen) or ER−
now the limiting resource. With two resources, at any given time           (lacking estrogen receptors) by immunohistochemical staining of
just one or the other resource is limiting unless they conform             tumor biopsies. Most primary breast cancers possess both types
to a specific ratio in the diet. Essential resources impact the            of cells coexisting within the tumor. Breast cancers are scored
dynamics of both more traditional ecosystems, such as plants or            pathologically as ER+ or ER− based on the percentage of cells
microbes, as well as the dynamics within the ecosystem of the              exhibiting the estrogen receptor. Patients with ER+ breast cancer
human body. Essential resources may characterize the nutrient              typically have a more favorable prognosis compared to ER−
or molecular requirements of normal cells, as well as cancer cells         patients, with the arsenal of therapeutic interventions expanded
within their host.                                                         to include therapies that interfere with estrogen production or
   While normal cells are not free-living single celled organisms,         estrogen signaling. Women that score as ER− have fewer therapy
they do rely on consumption of blood-born or tissue-generated              options (Hammond et al., 2010).
nutrients that can serve as fuel, as structural molecules, or as              Ecologically, within a breast cancer tumor we expect to
functional molecules (Thompson, 2011). Some of these nutrients             observe at least three distinct types of communities: all ER+ , all
can be thought of as general resources that are used by all cells in       ER− or a community of the two coexisting together. Coexistence
the human body (Palm and Thompson, 2017; Amend et al., 2018).              seems to be the norm (Jensen et al., 1971; Harvey et al., 1999;
These can include glucose, oxygen, and amino acids. Among                  Caruana et al., 2020). Here, we want to leverage ecological
these, some are essential, such as the essential amino acids (e.g.,        insights about consumer-resource dynamics and resource
lysine) that cannot be synthesized from other amino acids or               subsistence levels to explore the circumstances favoring ER+ vs.
obtained in another way. Many other molecules can be used as               ER− breast cancer. We explore the possibilities for evolutionarily
fuel or metabolically transformed into the building blocks for             steering cancer cell frequencies through nutrient manipulations.
structural and functional purposes (Hosios et al., 2016).                  To achieve this goal, we model interactions of cancer cells
   Some nutrients can be described as specific resources in that           with a general (glucose) and a specific (estrogen) resource
only a subset of cell types or tissues need and use them. For              subject to Liebig’s Law of the Minimum as a consumer-resource
instance, in humans only a subset of cells in the liver and brain          interaction. We consider nutrient uptake rates, resource supply
can, in general, take up and metabolize fructose; most of our cells        rates, and the proliferation and survival consequences to cancer
cannot (Oppelt et al., 2017). Furthermore, in some cases, the need         cells of their nutrient uptake. We identify conditions favoring
for a specific resource by a subset of cell types has evolved as an        ER+ or ER− cancer cells in the tumor microenvironment and
adaption for the whole organism to control the proliferation or            discuss strategies that may impact success of hormone-based
metabolic activity of these cell subsets without impacting other           therapeutic interventions.

Frontiers in Ecology and Evolution | www.frontiersin.org               2                                       August 2021 | Volume 9 | Article 673082

Kareva and Brown                                                                                                        Estrogen as an Essential Resource

MODEL DESCRIPTION                                                               resources. If resource 1 is limiting, then the cancer cell will
                                                                                consume all encountered items of resource 1 but only some of
In our modeling framework, we consider two types of consumers.                  the encountered items of resource 2. The amount of resource 2
Consumers using strategy 1, S1 , use both specific and general                  consumed when it is not limiting is just that amount needed to
resources (ER+ cells), while consumers using strategy 2, S2 , rely              fully utilize resource 1. And vice-versa if resource 2 is limiting.
only on general resources (ER− cells). Evidence suggests that in
some cases these consumer strategies are heritably distinct and
as such are pure strategies that breed true. In other cases, cancer             EQUILIBRIUM CONDITIONS
cells can switch between the strategies.
    Let the individuals within the population of cancer cells be                In the absence of consumption by the cancer cells, resources
denoted as xα (t), where α represents a mixed strategy of using                 will achieve a steady state level at R01 = Rk011 for specific resource
S1 with probability α. If α = 1, cells only use S1 , and if α = 0, cells        R1 , and R02 = Rk022 for general resource R2 . In consumer-resource
only use S2 .                                                                   theory, these levels are referred to as resource supply points.
    Cells utilizing strategy S1 depend on both the specific                     This represents the highest standing crop of resources that is
resourceR1 (t), such as estrogen, and the general resourceR2 (t),               achievable within the tumor.
such as glucose, as essential resources to the cell. Parameters                     Each consumer strategy, S1 and S2 , will have a subsistence
aij (per time) represent the probability of encountering a given                level of resource abundance, R1 ∗ and R2 ∗ , below which it will
item of the resource, while parameters bij represent the conversion             have negative fitness (declining numbers) and above which fitness
rate of resources into the proliferation daughter cells; we also                will be positive (increasing numbers). The subsistence level of
assume that there exists some intrinsic cell death rate δ. Finally,             resources can be found by setting the fitness of a consumer
we can describe the fitness (per capita proliferation rate), F 1 (t),           strategy equal to zero and solving for the associated R∗ .
of cells using strategy S1 based on Liebig’s Law of the Minimum                     When α = 1, cells require both resources (ER+ cells), and
as F1 (t) = min(b11 a11 R1 (t) , a21 b21 R2 (t)). Cells that use strategy       thus subsistence levels for both resources are R∗1 = a11δb11 when
S2 depend only on general resource R2 (t) and grow at a
                                                                                R2 ≥ a21δb21 , or R∗2 = a21δb21 when R1 ≥ a11δb11 . That is, these are
rate F2 (t) = a22 b22 R2 (t). Together, the change over time in a
population with ER+ (xα = 0 ) and ER− (xα = 1 ) cancer cells can                the minimal levels of both resources that an ER+ cell requires for
be described as:                                                                survival. In consumer resource theory, the graph of this in the
                                                                                state space of R2 vs. R1 forms an elbow, and it describes the zero
                       0
                      xα=1 = xα=1 F1 (R1 , R2 ) − δxα=1                         net growth isocline (ZNGI) for a consumer harvesting essential
                                                                                resources (see Figure 1).
                       0
                      xα=0 = xα=0 F2 (R2 ) − δxα=0 .                 (1)
                                                                                    Conversely, for cells with α = 0, which depend only on the
Next, we assume that resources R1 (t) and R2 (t) have constant                  general resource R2 , the resource subsistence level is given by
inflow rates R01 and R02 , respectively, and are cleared or                     R∗2 = a22δb22 . In the state space of R2 vs. R1 , this describes a
consumed by normal cells at rates k1 and k2 per unit of the                     horizontal line, and it is the zero net growth isocline of strategy
resources R1 (t) andR2 (t), respectively. Resource R2 (t) can be                S2 (Figure 1). Above this line, cells with strategy S2 have positive
consumed by cells using strategy S1 or strategy S2 , while R1 (t) can           fitness and below this line their fitness is negative. By the
only be consumed by cells using strategy S1 . These assumptions                 definition of this strategy, the fitness of individuals with S2 is
are captured by the following system of equations:                              independent of the availability of the specific resource, R1 .
                                                                                    In a consumer-resource model there are limits to growth for
      dxα=1 (t)
                = xα=1 (t) min(a11 b11 R1 (t) , a21 b21 R2 (t))                 the consumers. Consumers, intra- and inter-specifically, compete
         dt                                                                     with each other. This competition is indirect via depletion of
                  −δxα=1 (t)                                                    the standing crop of resources. This means that each species
      dxα=0 (t)                                                                 has a carrying capacity determined by the population size that
                = xα=0 (t)a22 b22 R2 (t) − δxα=0 (t)                            depresses resource availability to its R∗ . At population sizes
         dt
                                                                                above this level, R will be driven below R∗ and the consumer’s
          N(t) = xα=1 (t) + xα=0 (t)                                            population growth will be negative, and vice-versa for population
      dR1 (t)                                                                   sizes below this level.
              = R01 − k1 R1 (t) − αxα=0 (t) min
        dt
                                         b21                                    Role of Tradeoff
                 a11 R1 (t) , a21 R2 (t)
                                         b11                                    For there to be any possibility for the two consumer strategies
      dR2 (t)                                                                   to coexist, their ZNGIs must intersect at positive values of R1

              = R02 − k2 R2 (t) − αxα=0 (t) a21 min a11 R1 (t)                  and R2 as shown in Figure 1. The only way for the ZNGIs to
        dt
                b11
                                                                               not intersect is if the subsistence level of the general resource is
                    , a21 R2 (t) − (1 − α)xα=1 (t) a22 R2 (t)  (2)              lower for S2 than for S1 . In this case, cancer cells with strategy
                b21
                                                                                S2 will drive the level of the general resource to the point,
In formulating these dynamics, we assume that cancer cells                      where consumers using strategy S1 will starve no matter what the
using strategy S1 do not overconsume either of the essential                    abundance of the specific resource, R1 . Thus, for ER+ cancer cells

Frontiers in Ecology and Evolution | www.frontiersin.org                    3                                      August 2021 | Volume 9 | Article 673082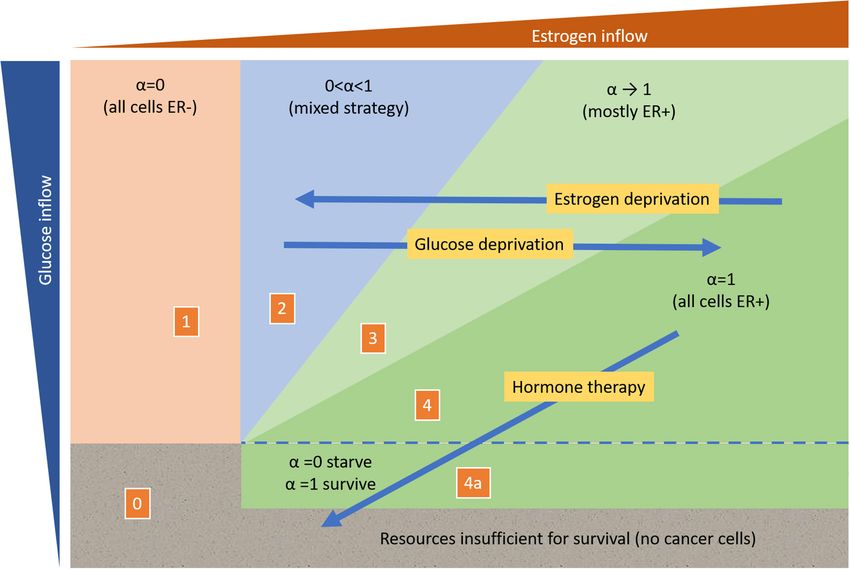
Kareva and Brown                                                                                                                 Estrogen as an Essential Resource

  FIGURE 1 | Outcome of consumer resource dynamics as influenced by the resource supply point. The five regions show the qualitatively different outcomes
  described by System (Rosenzweig, 1971).

to persist in the tumor, there must be a tradeoff, such that the                    glucose than ER+ (a22 > a21 ), a lower conversion efficiency
ER− cells free of the specific resource pay the price by having                     (b21 > b22 ), and a lower overall product (a21 b21 > a22 b22 ).
a higher subsistence level on the general resource compared to                      Beyond satisfying these conditions, the selection of relative
the ER+ cells: a21δb21 < a22δb22 , which means a21 b21 > a22 b22 . It is            magnitudes was arbitrary.
noteworthy that if hormone therapy or time permit ER− cancer                           With this tradeoff, ER+ cells have a lower R∗ on glucose
cells to break free of this constraint, then all the cancer cells will              ( = general resource) than ER− cells when estrogen has a
be ER− and unaffected and essentially resistant to all forms of                     sufficiently high resource supply. With a surplus of estrogen, ER+
hormonal therapies.                                                                 cells can achieve a higher population size than ER− cells for a
    ER− breast cancers or ER+ cell lines such as MCF-7 that                         given resource supply of glucose. Furthermore, increasing the
have been selected in the lab to be ER− exhibit a rewiring of                       resource supply of glucose will raise the equilibrium population
various metabolic pathways (Leung et al., 2010; Nayar et al.,                       size of cancer cells. Some evidence supports this prediction. For
2019). These can include the MAPK/ERK signaling pathways                            instance, when grown as mono-cultures in 3-D spheroids, ER+
that seem to bypass the estrogen receptor pathway in normal                         MCF-7 cells had higher carrying capacities than ER− MDA-MB-
cells of ER+ breast cancer cells (Peng et al., 2017). The rewired                   231 cells (Freischel et al., 2020). Whether biopsies of women with
metabolic pathways are associated with upregulation of glucose                      ER+ breast cancer exhibit higher densities of cancer cells than
transporters, GLUT1, and increased glycolysis (faster but less                      those with ER− breast cancer remains, to our knowledge, an open
efficient use of glucose). Of relevance to our parameter selection,                 and interesting question.
the relative availability of estrogen and glucose alters glucose
uptake and metabolism by ER+ MCF-7 cells. In support of the                         The Role of Resource Supply Points
idea that these are essential resources, increased estrogen for                     From here onwards we will assume that this tradeoff exists and
MCF-7 cells results in increased glucose uptake and metabolism                      that the ZNGIs do cross, as shown in Figure 1. The outcomes of
(Kulkoyluoglu-Cotul et al., 2019). This suggests that the MCF-                      the consumer-resource interactions now depend on the resource
7 cells had been limited by estrogen, and so had suppressed                         supply points. Even without competition from consumers using
utilization of glucose. With more estrogen, the amount of                           strategy S1 , consumer strategy S1 will be absent if the supply
glucose that could be usefully utilized was thus increased. For                     points of either of the resources is below subsistence level.
these reasons, we assigned the ER− a higher encounter rate on                       Similarly, even in the absence of competition from consumers

Frontiers in Ecology and Evolution | www.frontiersin.org                        4                                          August 2021 | Volume 9 | Article 673082
Kareva and Brown                                                                                                    Estrogen as an Essential Resource

using S1 , consumer strategy S2 will be absent if the resource              INTRODUCING POPULATION
supply point for the general resource is below its subsistence level.       HETEROGENEITY WITH RESPECT TO
    Region 0 of Figure 1: The cancer cell population cannot sustain
itself and will go extinct if the resource supply points are below          STRATEGY SELECTION
the subsistence levels of both consumer strategies.
                                                                            In this section we address the question of how a population that
    Region 1 of Figure 1: Only consumer ER− cells (α = 0) will be
                                                                            is heterogeneous with respect to resource consumption strategy
present in the cancer cell population if the resource supply point
                                                                            will evolve over time with respect to both its initial composition
of glucose (general resource) is above S2 ’s R∗ but the resource
                                                                            and properties of cells and the environment, i.e., with respect to
supply point of estrogen (specific resource) is below the R∗ of the
                                                                            variations in parameters R01 , R02 , aij , bij as defined in Table 1.
ER+ cells.
                                                                            For that, we assume that each individual cell in the population
    Region 4a of Figure 1: Only ER+ cells can be present if the
                                                                            possesses a strategy parameter of α that belongs to the interval
resource supply point is above their subsistence levels of glucose
                                                                            [0,1]. With this assumption, the population can consist of
and estrogen, and the resource supply point on glucose is below
                                                                            individuals that use either the pure strategy (cases analyzed in
the R∗ of the ER− strategy.
                                                                            the previous section), or any mixture of the two pure strategies.
    When the resource supply point, R’, is above the subsistence
                                                                            There is value in allowing for both possibilities: a mix of two
R∗ ’s for both the ER+ and ER− strategies, then there are 3 possible
                                                                            pure strategies vs. a continuum of mixed strategies. In the case
outcomes. In all cases, both strategies could exist in the absence
                                                                            of estrogen receptor status in breast cancer, evidence suggests
of the other, but the presence of cancer cells using a particular
                                                                            cases in which ER+ and ER− are heritably distinct and other cases
strategy can influence resource depletion in a manner that does
                                                                            where the trait is phenotypically plastic (Polyak, 2007; Dai et al.,
not permit both consumer strategies to be present.
                                                                            2017; Sahoo et al., 2021).
    Region 2 of Figure 1: A mix of ER+ and ER− cells (0 < α < 1)
                                                                               We can consider the dynamics of any starting distribution of
becomes the expected outcome, when the ER+ cells are limited
                                                                            mixed strategies through the application of the Hidden Keystone
by estrogen and consume so little of the available glucose that
                                                                            Variable (HKV) method (Kareva and Karev, 2019); the specific
they would leave a standing crop of glucose above the R∗ of
                                                                            details of transformations necessary to apply the HKV method to
the ER− cells. This outcome becomes likely when the resource
                                                                            this system of equations are given in Supplementary Appendix.
supply point exhibits a high ratio of glucose to estrogen. The
                                                                            The final system of equations reads as follows:
resulting equilibrium sees the coexistence of both cell types and
the depletion of resources to the intersection of the ZNGIs.                       dR1 (t)
                                                                                           = R01 − k1 R1 (t) − Et [α]N(t) min
Namely, the level of estrogen matches the R∗ of the ER+ cells,                       dt
and the level of glucose matches the R∗ of the ER− cells.
                                                                                                           a21 b21 R2 (t)

    Region 3 of Figure 1: With a moderate ratio of glucose to                                 a11 R1 (t) ,
                                                                                                                b11
estrogen, the ER+ cells will still be limited by estrogen. This
means that they leave a level of glucose above their R∗ ; however,                dR2 (t)
                                                                                           = R02 − k2 R2 (t) − Et [α]N(t) min
if this level of glucose is below the R∗ of the ER− cells, they will                 dt
slowly and eventually be excluded from the community of cancer
                                                                                    a11 b11 R1 (t)

cells. In this region, the cancer will tend toward all ER+ (α = 1).                                , a21 R2 (t) − (1 − Et [α])N(t)a22 R2 (t) (3)
                                                                                         b21
The standing crop of resources will have estrogen at the R∗ of the
ER+ cells, and the standing crop of glucose will be above that of           where Et [α] is the expected value of the strategy parameter that
the ER+ cells and below that of the ER− cells.                              changes over time as the population evolves, and N(t) is the
    Region 4 of Figure 1: With a low ratio of glucose to estrogen           total population size of all the cells. Derivations for expression
at the resource supply point, the ER+ cells will be glucose                 describing Et [α] and N(t) are given in Supplementary Appendix.
limited and not estrogen limited. When this happens, they will              Using this transformed system of equations we can now calculate
drive glucose levels down to their R∗ for glucose. Since this is            change in population size, expected value and variance of α over
lower than the R∗ on glucose for the ER− cells, the ER− cells               time, thus enabling us to track evolution of the population with
will be outcompeted from this community. One should see a                   respect to resource consumption strategy subject to variations in
rapid equilibration on a community of just ER+ cancer cells                 environmental conditions.
(α = 1).
    All of the qualitatively different regions shown in Figure 1 can
be solved for analytically from the consumer resource dynamics              RESULTS
as summarized in the figure. This analysis allows us to predict
the resource-dependent boundaries between different population              Model Analysis
compositions. Specifically, we can predict resource steady state            We use equations (Oksanen and Oksanen, 2000) to firstly
levels given a fixed population composition with respect to                 demonstrate the existence of the 4 qualitatively different regimes
resource consumption strategy. Next, we perform the inverse                 of coexistence of consumers with the resource, and the resulting
analysis and predict what composition the population will evolve            final strategy, that are shown in Figure 1. The results of our
toward, subject to variations in resource availability and initial          simulations are given in Figure 2. We change the inflow rate
population composition.                                                     R01 of the specific resource, R1 , keeping all other parameter

Frontiers in Ecology and Evolution | www.frontiersin.org                5                                      August 2021 | Volume 9 | Article 673082
Kareva and Brown Estrogen as an Essential Resource
TABLE 1 | Variables and parameters used when there are 2 pure strategies, α (Figure 2D), changes in the variance of α and change in
System (Rosenzweig, 1971), and when there is a distribution of mixed strategies,
the population composition over time. Equations used for these
System (Oksanen and Oksanen, 2000).
calculations are derived in Supplementary Appendix.
Variables/ Meaning Initial Units For the set of parameter values given in Table 1, R01 =
parameters conditions/ 5 corresponds to region 4, where over time the population
sample evolves toward Strategy 1; α → 1, and therefore all the cells
values
in the population require both resources (for the case when
xα (t) Population density of cells xα (0) > 0 Cells/Vol R1 represents estrogen, this corresponds to all ER+ cells); the
characterized by having a strategy variance (Figure 2E) tends to 0 over time, confirming that at
value of 0 < α < 0 steady state, the population is indeed homogeneous with respect
N(t) Total population size when there is a N(0) = 0.1 Cells/Vol to strategy α. It is easy to confirm that the equilibrium levels of the
specific resource R1 is greater than a11δb11 , while the equilibrium
distribution of mixed strategies with
population sizes denoted by xα;
level of the general resource R2 tends toward S1 ’s R∗ of a21δb21 , as
R
N(t) = A xα dα
R1 (t) Amount of specific resource (i.e., R1 (0) = 10 Moles/Vol expected (see Figure 1).
estrogen)
Here the model predicts an initially counterintuitive
R2 (t) Amount of general resource (i.e., R2 (t) = 10 Moles/Vol
observation: even though the population is composed solely
glucose)
of ER+ cells, there exists a surplus of estrogen (resource R1 ).
p(t) Auxiliary “keystone” variable necessary p(0) = 0 n/a
for introducing population heterogeneity However, this makes sense within the framework of Liebig’s
using the Hidden Keystone Variables Law of the Minimum: the general resource R2 is limiting, which
(HKV) method (Kareva and Karev, 2019) results in a surplus of the specific resource R1 . This prediction
q(t) Auxiliary “keystone” variable necessary q(0) = 0 n/a can also have important diagnostic implications, as will be
for introducing population heterogeneity discussed later.
using the HKV method
Decreasing the value of R01 to 4.5 corresponds to region
α Strategy value. If α = 1, the cell requires 0≤α≤1 n/a
both resources and grows according to
3, where final population composition still tends to α → 1
Liebig’s principle of limiting resources; if (Figures 2D,E). However, the final levels of both resources are
α = 0, the cell only requires general different, as can be seen in Figures 2B,C. General resource R2 is
resource R2 . Strategy values 0 < α < 0 no longer limiting, and thus its equilibrium levels are higher than
represent mixed strategies in the previous case, while the equilibrium levels of the specific
a11 Encounter rate of resource R1 by cells 0.1 1/time resource R1 are lower. Notably, final population size (Figure 2A)
with α = 1
is lower in region 3 than in region 4, even though final population
b11 Rate of conversion of resource R1 into 0.1 x/R1
cells with α = 1
composition is nearly identical. In this region, estrogen is the
a21 Encounter rate of resource R2 by cells 0.1 1/time
limiting resource for the population of ER+ cells.
with α = 1 Further reducing the value of R01 = 1.1 corresponds to region
b21 Rate of conversion of resource R2 into 0.05 x/R2 2, which predicts the coexistence of ER+ and ER− negative
cells with α = 1 cells as a mixed strategy (Figure 2D). Notably, this population
a22 Encounter rate of resource R2 by cells 0.25 1/time is heterogeneous at steady state, since its variance over time is
with α = 0 non-zero (Figure 2E). The change in population composition
b22 Rate of conversion of resource R2 into 0.01 x/R2 can also be shown in Figure 2F, which plots distribution of cell
cells with α = 0
clones with respect to α over time. As one can clearly see, the
δ Natural death rate of cells xα (t) 0.01 1/time
population composition changes over time but does not become
k1 Natural clearance rate of specific 0.01 1/time
concentrated at a single value of α, as happens for the other cases
resource R1
(not shown). Here, specific resource R1 is limiting for ER+ cells
k2 Natural clearance rate of general 0.01 1/time
resource R2 (Figure 2B), and thus the level of general resource R2 is at the
R01 Inflow rate of specific resource R1 k1 × R1 (0) R1 /time highest level possible. This level corresponds to the R∗ of the
R02 Inflow rate of general resource R2 k2 × R2 (0) R2 /time ER− cells.
µ Parameter of initial distribution −50 < µ < n/a Finally, reducing R01 to 0.5, effectively minimizing the level of
50 specific resource R1 below subsistence levels, predictably results
in a population that consists entirely of ER− cells (α → 0). This
population has the smallest final population size (Figure 2A) and
values constant as reported in Table 1; the initial distribution is fully limited by the general resourceR2 .
is assumed to be truncated exponential on the interval [0,1]; These simulations confirm that the model described by
other truncated initial distributions can be chosen subject to data System (Oksanen and Oksanen, 2000) exhibits the outcomes
availability. We then evaluate changes in total population size predicted and summarized in Figure 1. The simulations show
N(t) (Figure 2A), changes in the standing crop of the specific the consumer-resource dynamics toward these outcomes and
resource R1 (Figure 2B) and the general resource R2 (Figure 2C); equilibria. The model tracks changes in the strategy distribution
change in the mean value of the cancer cells’ strategy parameter and the final population composition. The simulations verify
Frontiers in Ecology and Evolution | www.frontiersin.org 6 August 2021 | Volume 9 | Article 673082Kareva and Brown Estrogen as an Essential Resource
FIGURE 2 | Evolution of the population of consumers over time with respect to resource consumption strategy subject to change in resource availability. Initial values
of R01 were chosen to provide representative plots of the 4 key regions of Figure 1. (A) Change in total population size N(t); (B) Equilibrium level of specific resource
R1 (here interpreted as estrogen) and (C) equilibrium level of general resource R2 , here interpreted as glucose, calculated from System (Oksanen and Oksanen,
2000); (D) change in mean strategy α ∈ [0, 1]; (E) change in variance of α over time; (F) a representative plot of change in population composition changes over
time, for R01 = 1.1, corresponding to region 2 of Figure 1. All other parameter values are held constant at values given in Table 1.
that changing the ratio of the resource supply points of the
two resources results in corresponding changes in the standing
Final Population Composition Is Invariant
crop of the two resources, determining whether the tumor to Initial Distribution of Cell Clones in the
is expected to have all ER+ , all ER− or a mix of both cell Population
types. We additionally demonstrate that populations with mixed In the previous section we demonstrated that relative levels
equilibrium strategy are heterogeneous at steady state (rather of specific and general resources affect final population
than being composed of a single cell clone). Finally, we note composition. Now we evaluate the impact of initial population
that final population size of cancer cells is largest when ER+ composition on final strategy distribution.
cells dominate the tumor, i.e., cells with largest values of α. For that, we change the value of parameter µ in Equation
This last result happens because ER+ dominated tumors occur (Thompson, 2011) that dictates the initial distribution of mixed
when the ER+ cells are limited by the general resource and strategies in the cancer cell population to see how populations
not the specific resource. Since ER+ cells are more efficient with different initial mean values of α change over time. In the
on the general resources (lower R∗ ), they can support a larger following we hold all other parameters constant at values given
population size than if it were a tumor composed of ER− . in Table 1 unless indicated otherwise. A representative plot of a
Whether cancers scored as ER+ have a higher overall density population in region 2 of Figure 1 is given in Figure 3.
of cancer cells than those scored ER− provides a testable As one can see, changes in initial population composition
prediction of the model. do not affect the steady state value of α or the variance of the
Next, we evaluate how composition of the initial population; they only affect time necessary to reach the steady
population affects the steady state strategy distribution. state, which is expected. From this we can conclude that within
Frontiers in Ecology and Evolution | www.frontiersin.org 7 August 2021 | Volume 9 | Article 673082Kareva and Brown Estrogen as an Essential Resource
FIGURE 3 | Impact of initial distribution on final population composition. (A) Final mean strategy α and (B) variance are invariant to initial distribution.
the frameworks of the proposed model, it is the relative resource smaller and smaller proportion of the encountered items of the
supply points that will drive the evolution of the population over specific resource will actually be consumed by the S1 cancer cells.
time, and thus it may be possible to steer population composition In Figure 4D we can see that indeed there exists a range
by manipulating resources. of intermediate mixed strategies between regions of evolution
toward pure strategies α → 0 and α → 1, in correspondence
Evolution of Population With Respect to with the theoretically predicted regions described in Figure 1.
Moreover, Figure 4E shows that highest variance, and thus
Resource Availability highest degree of population heterogeneity, is observed for
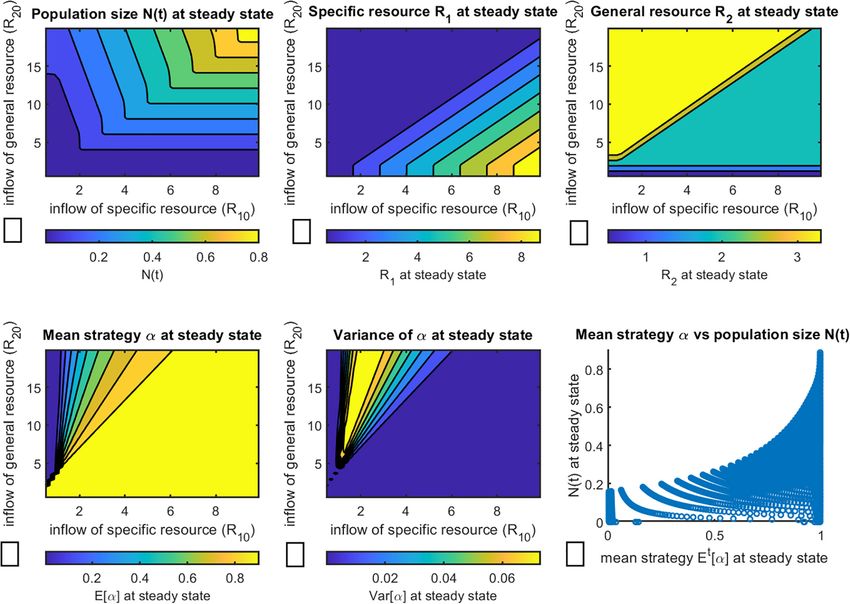
Next, we construct a more integrated picture of the dependence of
populations with intermediate values of α. This may have
population composition and resource availability on final strategy
therapeutic implications, since more heterogeneous populations
at steady state. The data were collected as follows: for various
of cancer cells may indicate a more aggressive cancer in terms
combinations of resource supply rates R01 ∈ [0.1, 20] and R20 ∈
of developing metastases or resistance to therapy (Marusyk and
[0.1, 10], the simulation was run until the population reached
Polyak, 2010; Rajput et al., 2017; Marusyk et al., 2020).
a steady state, at which point the corresponding values for total
population size (Figure 4A), specific resource R1 (Figure 4B),
general resource R2 (Figure 4C), average strategy α (Figure 4D),
and average variance of α (Figure 4E) were noted. Additionally, IMPLICATIONS FOR HORMONAL
we plotted the relationship between final population size and final THERAPIES OF BREAST CANCER
average strategy at steady state in Figure 4F, showing clearly that
final population size increases as α → 1. The direct impact of nutrient inflow rates on population
As expected, final population size is predicted to be largest composition raises the possibility of “evolutionary steering”
when both resources are most abundant (Figure 4A). The (Stanková et al., 2019), aimed at promoting a more
resulting equilibrium abundances of the two resources do not therapeutically susceptible composition of cancer cell types.
directly depend on the resource supply points but on the resulting Ideally, we would devise strategies to steer the populations
community composition. When the resource supply point of the toward a point where neither ER+ nor ER− cells can persist
general resource is high and that of the specific resource low, (Region 0 in Figure 1). However, this cannot be achieved
a mixed strategy results. Over this region of coexistence, the directly through nutrient manipulation without harming the
specific resource will equilibrate on the subsistence level R∗ of host, since the general resources (glucose) are required by all
consumer strategy 1 (Figure 4B), and the general resource will cells of the body.
equilibrate on the subsistence R∗ of strategy 2 (Figure 4C). As An alternative approach involves steering the population
changing the ratio of resource supply points shifts the system composition toward the ER+ phenotype, which is more
from mixed strategies to all S1 (α → 1), the limiting resource susceptible to therapeutic interventions. Such interventions
switches from the specific to the general resource. Once this include several endocrine-based therapies, such as tamoxifen,
happens, the general resource will always equilibrate on S1 ’s fulvestrant and aromatase inhibitors (AIs). Development of
R∗ for that resource (Figure 4C), and the specific resource at tamoxifen, initially a contraceptive, has been a critical advance
equilibrium will continue to increase (Figure 4B) as the ratio of in breast cancer treatment (Jordan, 2003; Quirke, 2017). It acts
the general to specific resource declines. This happens because a as a selective ER modulator (SERM), interfering with signaling
Frontiers in Ecology and Evolution | www.frontiersin.org 8 August 2021 | Volume 9 | Article 673082Kareva and Brown Estrogen as an Essential Resource FIGURE 4 | Evaluation of population composition and equilibrium values at steady state subject to variation of resource inflow rates. (A) population size N(t); (B) equilibrium levels of specific resource R1 ; (C) equilibrium levels of general resource R2 ; (D) mean strategy E t [α] ∈ [0, 1]; (E) variance Var t [α]; (F) mean strategy E t [α] vs. population size N(t) at steady state. between ER and estrogen, although it has been shown to have ER expression using immunohistochemistry (IHC). Tumors may both antagonist and weak agonist activity. Fulvestrant acts to show a continuum of expression levels among the constituent not only block but also downregulate ER without agonist activity cancer cells, some cells showing no expression at all (ER− (Osborne et al., 2004). Both are effective in breast cancer, yet cells). Generally, all cells exhibiting expression “at any intensity” both can select for resistant cancer cells (Riggins et al., 2007; are reported as positive (Hammond et al., 2010). However, Mills et al., 2018), namely those that are ER− or resistant Layfield et al. (2003) showed that there exists considerable through other mechanisms. AIs are small molecules that block variability between ER classifications on the same tissue block conversion of precursor compounds into estrogenic molecules when analyzed by different laboratories. Similar discrepancies (Smith and Dowsett, 2003). AIs, such as anastrozole, letrozole, have been reported by Goldstein et al. (2003) and Nkoy and exemestane, have proven effective as monotherapies (Mauri et al. (2010) highlighting differences in laboratory protocols et al., 2006) and in combination with tamoxifen (Johnston (Ibarra et al., 2010). A nationwide assessment of positivity et al., 2005; Winer et al., 2005; Early Breast Cancer Trialists’ rates in the Netherlands (Dooijeweert et al., 2019) identified Collaborative Group (Ebctcg), 2015). limited variability in a more recent analysis, but absolute With a range of options available for estrogen-dependent variations still existed. tumors, it is particularly important to provide therapeutic options Next, even if there were no inter-laboratory inconsistencies, to all patients who can benefit. Breast tumors can harbor a another question remains: what level of ER expression within combination of ER+ and ER− cells, but what fraction of ER+ the tumor is therapeutically relevant? Two main scoring methods cells within the tumor is high enough to qualify the patient for have been used for evaluating the extent of ER positivity: H-score hormone therapies? This question is not as straightforward as and Allred score. Allred score (Allred et al., 1998) combines the one might believe. One issue concerns inconsistency between proportion of positive-staining tumor cells and the intensity of testing facilities in how they classify tumors as ER+ or ER− . staining to give a score between 0 and 8. H-score (Goulding et al., Typically, one or several sections from a biopsy are stained for 1995) aims to capture the full range of staining percentages and Frontiers in Ecology and Evolution | www.frontiersin.org 9 August 2021 | Volume 9 | Article 673082
Kareva and Brown                                                                                                           Estrogen as an Essential Resource

  FIGURE 5 | Impact of possible resource-dependent intervention strategies on predicted tumor composition.

intensities in tumor samples rather than just the average intensity                 on setting a threshold of 1% ER+ cancer cells for reporting
of the Allred score. H-scores range from 1 to 300. A larger                         a patient’s breast cancer as ER positive (Hammond et al.,
score corresponds to a higher intensity of staining. A score of                     2010). With regards to scoring, this corresponds to a minimum
1 corresponds to up to 1% ER+ cells among the cancer cells                          Allred score of 3, which can be seen with as few as 1–10%
within the tumor.                                                                   weakly staining cells, and an H-score of over 1 (Table 10 in
    Some studies however suggest that there are actually few                        Hammond et al., 2010).
cases of tumors being weakly ER+ vs. entirely ER− . They                                While the main rationale for the 1% cutoff is to expand access
suggest that ER staining results in a bimodal distribution of                       to treatment options to as many patients as possible, it may be
tumor types (Collins et al., 2005). The lack of consistency in                      too low for statistically significant efficacy. Morgan et al. (2011)
testing and potential misclassification of weakly ER+ tumors as                     showed that low levels of expression, defined as H-score ≤ 50,
ER+ tumors prompted Collins et al. (2005) to perform internal                       resulted in lower overall disease-free survival when treated with
IHC analysis of immune-stains of 825 breast cancer samples,                         only endocrine therapy. Chen et al. (2018) showed that patients
estimating proportion of ER+ tumor cells, and grading samples                       with ER+ staining between 1 and 9% gained no significant benefit
using the Allred score. The authors showed that in 817 cases                        from endocrine therapy, unlike ER+ tumors with over 10%
(99.0%), either all of the cancer cells in the tumor showed an                      positive staining. Raghav et al. (2012) also showed that patients
absence of staining (all ER− cells) or over 70% of the cells were                   with tumors with 1–5% ER positive expression gained no clinical
ER+ . Thus, 818 cases (99.2%) exhibited Allred scores of either 0                   benefit from endocrine therapy.
or 7/8. These results prompted the authors to conclude that in                          Even though weakly positive tumors are classified as eligible
most cases, an overwhelming number of breast cancer patients’                       to receive endocrine therapies, it seems that therapeutic success
tumors can be classified as completely ER− or unambiguously                         would be greater if one could increase the proportion of ER+ cells
ER+ , with only a small fraction of tumors showing very small                       in these tumors prior to administering endocrine therapy. Within
frequencies of ER+ cells and thus appearing weakly positive. It                     the framework proposed here, this may be possible through
is noteworthy that Allred scores of 7 or 8 means there are still a                  resource manipulation.
sizeable frequency of ER− cancer cells within the tumor.                                As we have shown above, the proportion of ER+ cells that
    The question of whether even weakly positive tumors should                      rely on both resources increases with increased estrogen inflow,
be treated with endocrine therapies was addressed in 2010 at                        or with reduced glucose inflow. Perhaps it might be feasible
the American Society of Clinical Oncology (ASCO)/College of                         to externally increase estrogen concentration to favor ER+ cells
American Pathologists (CAP) meeting. A panel of experts agreed                      over ER− ones without compromising patient health, but as

Frontiers in Ecology and Evolution | www.frontiersin.org                       10                                     August 2021 | Volume 9 | Article 673082
Kareva and Brown Estrogen as an Essential Resource
yet, this has not been explored experimentally. Such a therapy among the cell lineages occurs for populations that have a mix of
would fall into what has been termed an evolutionary gambit ER+ and ER− cells.
or suckers gambit (Maley et al., 2004; Gatenby and Brown, In Lloyd et al. (2014) examined the frequency of ER+ and
2020). On the other hand, glucose deprivation may be able to −
ER cancer cells from the biopsies of 24 patients; all biopsies
achieve a similar effect (Barbosa and Martel, 2020), priming were obtained from the primary tumor. Six exhibited 100%
the tumor to becoming more receptive to hormone therapy by ER− cells (corresponding to Region 1 of Figure 5), seven had
favoring an increase in the frequency of ER+ cells relative to ER− both phenotypes at 5–10% ER− cells (corresponding to Region
ones (Figure 5). 2 of Figure 5) and 11 were 100% ER+ cells (corresponding
If the tumor is primarily composed of ER+ cells, then to Regions 3 or 4 of Figure 5). The authors found that
estrogen deprivation therapies will have initial success but might ER− tumors exhibit less vasculature. Lack of vasculature may
eventually drive the tumor toward either all ER− or a mixture reduce the inflow of both glucose (and other general resources)
of both ER+ and ER− cells. Adding glucose deprivation or and estrogen, but the level of estrogen may drop below the
enhancing the resource supply of estrogen relative to other subsistence level of the ER+ cells, leaving a higher standing
nutrients may set up an evolutionary double-bind (Gatenby et al., crop of underutilized general resources, thereby favoring ER−
2009), where the resulting resource dynamics force an ER+ tumor cells (to our knowledge, this prediction remains untested). The
that is highly susceptible to hormone therapy (Figure 5). authors hypothesize that anti-estrogen therapy (e.g., Tamoxifen)
can select for ER− independent cells, while “cyclic introduction
of estrogen may improve survival rate by continually altering,
DISCUSSION rather than unilaterally shifting, toward an ER− population.”
The authors suggest that “modulation (and not eradication
Here we analyzed a consumer-resource model with two resources or extinction of certain population) may prove to be an
subject to Liebig’s Law of the Minimum to describe evolution advantageous treatment strategy,” a hypothesis that is supported
of a heterogeneous population of cancer cells as influenced by the proposed mathematical model.
by resource availability. We evaluated the impact of a general The proposed model is built on the underlying theory of
resource, such as glucose, and a specific resource, such as essential resources and Liebig’s Law of the Minimum. For ER+
estrogen, on the conditions for coexistence by a phenotype that cells, estrogen may be a hemi-essential resource (it certainly is
requires both, and a phenotype that only requires the general not a perfectly substitutable one). Had we modeled estrogen
resource. Our model was intended for breast cancer, where ER+ as a hemi-essential resource for ER+ cancer cells, our results
and ER− cancer cells are frequently found coexisting within the would remain qualitatively unchanged. The model, however,
same patient’s tumor. We solved analytically for conditions under would lose much of its analytic tractability as fitness would now
which the tumor should have pure or mixed strategies (Figure 1). involve the product of consumption rates of estrogen and the
This involved calculating the subsistence levels of resources (R∗ ) general resource.
for the ER+ and ER− cancer cell strategies, there zero net growth Direct evidence for estrogen acting as an essential resource is
isoclines (ZNGI), and the effect of the resource supply points of that ER+ cells cannot survive and proliferate in the absence of
glucose and estrogen on the composition of cancer cell strategies. estrogen, no matter the abundance of other nutrients (Martin
We then confirmed theoretical predictions these results by et al., 2003; Comsa et al., 2015). Furthermore, in the absence
showing that if a heterogeneous population can evolve over time, of sufficient quantities of other nutrients such as glucose, fatty
it will evolve toward the predicted population composition and acids and amino acids, cancer cells cannot survive or proliferate
resource equilibrium levels. We assessed population evolution regardless of the availability of estrogen. Finally, like other
by changes in the mean and variance of a distribution of resources, estrogen becomes depleted and used up by the cells
mixed strategies, where a given strategy gives the probability of rather than continuously being recycled (Gudas et al., 1995).
exhibiting the ER− or ER+ phenotype (Figure 2). We showed Indirect evidence suggests that estrogen may act as an essential
that in this system, population evolution is invariant to initial or hemi-essential resource in line with Liebig’s Law. Mathews
distribution of cell clones in the populations, and that over et al. (2020) quantified the effect of long-term glucose deprivation
time the final population composition is dictated only by the on various cancer cell lines in vitro. Cell lines were stabilized at
supply of each resource (Figure 3), suggesting that resource typical human glucose level of 6 mmol/L, with the intervention
manipulation can be used to impact the composition of the group then receiving 3 mmol/L of glucose for 90 days. The
population (Figure 5). authors observed that glucose deprivation had different effect
To test this hypothesis, we varied relative inflow rates for on different cell lines, with MDA-MB-231 cell line (ER− ), the
both the general and specific resource and evaluated where the highly aggressive triple negative breast cancer cell line, being
population evolved over time (Figure 4). Specifically, in our most sensitive to the metabolic intervention, while the non-
simulations we allowed the population to evolve to steady state, tumorigenic epithelial cell line MCF 10A (ER+ ) was least
at which point we evaluated composition of the population affected. For the purposes of model validation, more decisive
(mean strategy and variance of strategies), as well as equilibrium experiments involving ER+ and ER− cell lines should include
abundances of resources. In addition to confirming predicted varying resource availabilities, and mono- vs. co-culturing to then
levels of both resources at a steady state, the model analysis quantify changes in population composition over time (Freischel
revealed that the highest variance in the mixed strategies found et al., 2020). If estrogen and general nutrients function as essential
Frontiers in Ecology and Evolution | www.frontiersin.org 11 August 2021 | Volume 9 | Article 673082Kareva and Brown Estrogen as an Essential Resource
resources, then nutrient modulation may be an effective strategy mentioned in the introduction, in these models, resources
for cancer modulation. can be perfect substitutes, complementary, hemi-essential, or
The potential benefit on cancer therapy of glucose deprivation essential. The resources themselves may be co-occurring and
through a ketogenic diet has been discussed extensively in the last encountered at random or distributed in separate patches or
several years (Klement, 2017; Weber et al., 2018). Khodabakhshi habitats (Hunt and Brown, 2018). The nutritional relationship
et al. (2020) reported results of a randomized controlled between the resources and their distribution in space strongly
clinical trial, evaluating the effects of ketogenic diet on patients influence the potential for the coexistence of different consumers
with breast cancer undergoing chemotherapy. In neoadjuvant (Vincent et al., 1996).
patients, they found that overall survival increased in the The analysis of these models has general features described
intervention group compared to the control group. In another by the resource supply point of the nutrients (inflows), ZNGIs
trial by the same authors (Khodabakhshi et al., 2021) evaluated of the consumer species, and the depletion of the resource
changes in biomarkers of breast cancer patients undergoing by the consumers. For models like ours that are non-spatial
chemotherapy. Patients on a ketogenic diet showed significant and achieve a steady-state, coexistence requires that the ZNGIs
decreases in TNF-alpha and insulin levels after 12 weeks of of the consumers intersect, meaning that there is a tradeoff
treatment, as well as increase in IL-10. All of these changes are among consumers between the subsistence levels of the resources.
associated with better patient outcomes. Additional experiments Furthermore, the resource supply points must lie in an
are needed to evaluate relative contributions of different intermediate range of the state space of resource abundances but
mechanisms triggered by glucose deprivation in the presence outside of each consumer species’ ZNGI. Finally, the consumers
and absence of estrogen. In addition to manipulating cancer- must deplete the resources along different trajectories. For a
cell population composition and density, glucose deprivation two-resource two-consumer species system, when coexistence
may also influence immune modulation (Chang et al., 2015; is possible, the equilibrium abundance of resources generally
Buck et al., 2017; Klein Geltink et al., 2018) and vasculature lies at the intersection of the two ZNGIs; and the equilibrium
(Lloyd et al., 2014). population sizes of the two species is what will drive the resource
abundances form the supply point to this intersection.
Broader Context Within Cancer An extensive theoretical and empirical body of literature exists
The model applies to any cancer that is dependent on specific in ecology on consumer-resource dynamics, including essential
growth factors including androgen-dependent prostate cancers. resources (Abrams, 1987; Fox and Vasseur, 2008). Much of
Epidermal growth factors (EGF) are typical regulators of many this work is in the context of phytoplankton under chemostat
tissue types and they can influence cell proliferation and cell (batch or continuous flow) conditions (Harmand et al., 2017;
differentiation. Cancers that are wildtype for EGFR (epidermal De Rijcke et al., 2020). The essential resources can be either
growth factor receptor) require EGF as an essential resource. light and other nutrients, or the nutrients themselves such as
Other cancer cells, such as EGFR mutant lung cancer, mutate so nitrogen and phosphorus. Model extensions can include resource
that the receptor is permanently turned on, produce their own pulsing, diffusion gradients within the medium or water column,
growth factors or stimulate neighboring normal cells, such as and large numbers of consumer species and nutrient conditions
fibroblasts, to produce growth factors for them. (Dubinkina et al., 2019; Stojsavljevic et al., 2019).
In most of these cases, the growth factor serves as an essential Tumors can be thought of as rather viscous chemostats,
resource necessary for survival and proliferation. The need for where blood delivers nutrients and removes both residual
these growth factors or hormones derives from the ancestry of nutrients and metabolites. In this work, our system was quite
the cancer cells. They retain the primitive trait of the normal simple, with two co-occurring essential resources, applicable to
cells of that tissue type. The need for these growth factors is part cancers requiring growth hormones or growth factors. More
of the organism-wide homeostatic control of tissue-specific cell generally, cancers provide a relatively unexplored opportunity
proliferation and activity. Because these hormones and growth to apply and test consumer-resource theory (Palmer et al.,
factors are not strictly necessary for the survival of an individual 2011; Seynhaeve and Ten Hagen, 2018). Such applications could
cell, there can be strong selection, accelerated by therapy, for include ecological “priming” of tumors to be most receptive
a subset of the cancer cells to evolve independence from these. to therapy, although tracking resource dynamics, cancer cell
Cancer cell types that are growth factor independent may either compositions, and interactions within the tumor is not yet
replace the others or coexist as a mixed strategy of different possible. It can at best be inferred from radiographic imaging
phenotypes. We believe our model provides a simple mechanistic (MRI, PET scans, CT scans). Jarrett et al. (2020) showed the
explanation for when growth factor independent cancer cell types value of combining MRI and PET scans for inferring cancer
will either outcompete, coexist with, or be outcompeted by the cell densities, the distribution of cancer cells with respect to
cancer cell type that requires the growth factor. expression of HER2, and mathematically modeling breast-cancer
patient responses to neoadjuvant therapies targeting HER2. Their
model, like ours, considers the importance of a growth factor
Broader Context Within (Human epidermal growth factor). Unlike ours, they use a logistic
Consumer-Resource Models growth model instead of a consumer-resource model; and theirs
Our model falls well within the class of consumer-resource explicitly considers space using partial differential equations and
models proposed and developed by Tilman (1980, 1982). As a diffusion term representing cell dispersal.
Frontiers in Ecology and Evolution | www.frontiersin.org 12 August 2021 | Volume 9 | Article 673082You can also read