Addressing concentrations of disadvantage Auburn case study report - Australian Housing and Urban Research Institute - Australian Housing and ...
←
→
Page content transcription
If your browser does not render page correctly, please read the page content below
Addressing
         concentrations of
Report

         disadvantage
         Auburn case study report

         authored by
         Hazel Easthope

         for the
         Australian Housing and Urban
         Research Institute
         at The University of New South Wales

         November 2014

         ISBN: 978-1-922075-69-7
ACKNOWLEDGEMENTS
This material was produced with funding from the Australian Government and the
Australian state and territory governments. AHURI Limited gratefully acknowledges
the financial and other support it has received from these governments, without which
this work would not have been possible.
AHURI comprises a network of university Research Centres across Australia.
Research Centre contributions, both financial and in-kind, have made the completion
of this report possible.
The authors are thankful for the generous help provided by the numerous research
participants who gave up their time and contributed their expertise to this study. We
are also grateful for the analyses of census data and media outputs undertaken by our
City Futures colleagues Edgar Liu and Ryan Van Nouwelant.

DISCLAIMER
AHURI Limited is an independent, non-political body which has supported this project
as part of its program of research into housing and urban development, which it hopes
will be of value to policy-makers, researchers, industry and communities. The opinions
in this publication reflect the views of the authors and do not necessarily reflect those
of AHURI Limited, its Board or its funding organisations. No responsibility is accepted
by AHURI Limited or its Board or its funders for the accuracy or omission of any
statement, opinion, advice or information in this publication.

                                                                                        i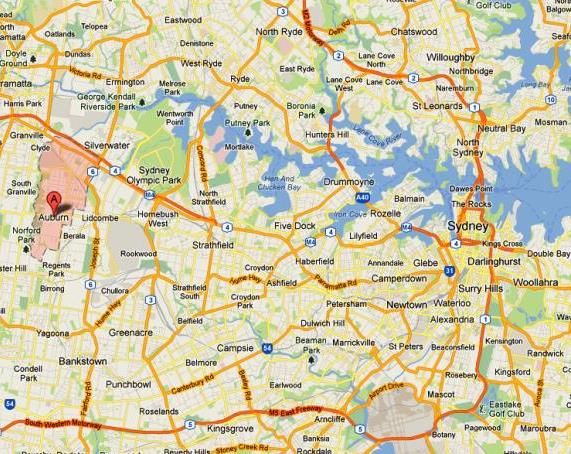
CONTENTS
LIST OF TABLES ....................................................................................................... IV
LIST OF FIGURES ...................................................................................................... V
1       INTRODUCTION ................................................................................................. 1
1.1     Case study area overview .................................................................................... 1
1.2     Case study research aims .................................................................................... 2
1.3     Case study methodology...................................................................................... 2
2       BACKGROUND TO THE AREA .......................................................................... 4
3       PLACES WHERE DISADVANTAGED PEOPLE LIVE ........................................ 6
3.1     Overview .............................................................................................................. 6
3.2     Specific groups vulnerable to disadvantage ......................................................... 7
      3.2.1 Recent migrants .......................................................................................... 7
      3.2.2 Youth .......................................................................................................... 8
      3.2.3 Women ..................................................................................................... 10
4      PLACE DISADVANTAGE IN AUBURN............................................................. 11
4.1     Contextualising place disadvantage in the area ................................................. 11
      4.1.1 Transport .................................................................................................. 11
      4.1.2 Employment .............................................................................................. 11
      4.1.3 Education .................................................................................................. 12
      4.1.4 Health services ......................................................................................... 12
      4.1.5 Community services .................................................................................. 12
      4.1.6 Public space ............................................................................................. 13
4.2     Area perceptions ................................................................................................ 13
4.3     Community cohesion and fragmentation ............................................................ 15
4.4     Spatial concentrations of disadvantage .............................................................. 15
5       THE ROLE OF HOUSING SYSTEMS AND MARKETS IN CONCENTRATING
        DISADVANTAGE .............................................................................................. 17
6       POLICY INTERVENTIONS TO ADDRESS OR REMEDY DISADVANTAGE .... 20
6.1     Conceptualising place focused initiatives ........................................................... 20
6.2     Initiatives targeted at disadvantaged people in place ......................................... 20
6.3     Initiatives to promote community cohesion ......................................................... 21
6.4     Housing market policies to address disadvantage.............................................. 22
      6.4.1 Provision of new private properties ........................................................... 22
      6.4.2 Council provision of affordable housing..................................................... 23
6.5     Factors affecting policy implementation.............................................................. 23
      6.5.1 Communication and coordination .............................................................. 23
      6.5.2 Rapid population change .......................................................................... 25
7       CONCLUSION ................................................................................................... 27
7.1     The cultural makeup of the area is likely to change ............................................ 27
7.2     There will be a lot of private property development in the area........................... 27
7.3     The population will continue to increase ............................................................. 27

                                                                                                                             ii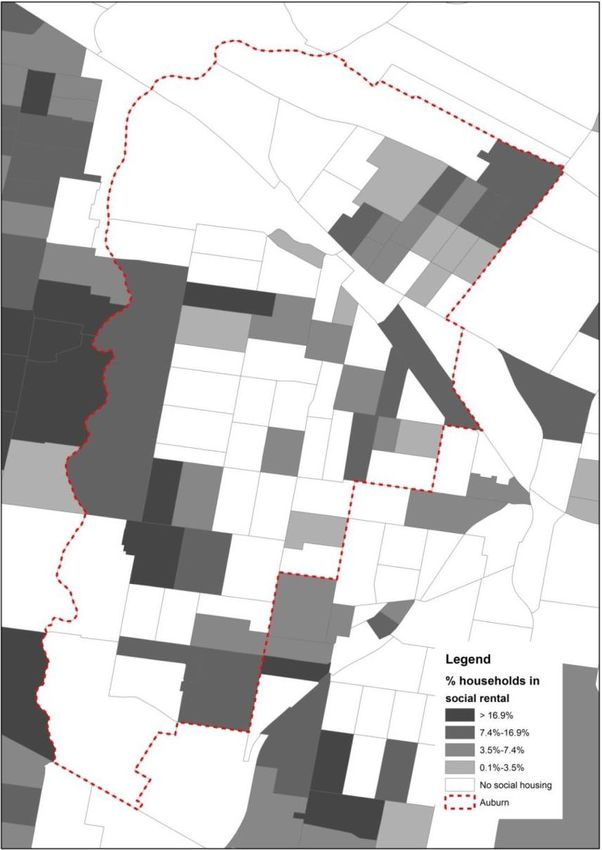
7.4     Auburn will become a popular shopping and services hub for the broader region28
REFERENCES ........................................................................................................... 29
APPENDICES ............................................................................................................. 31
Appendix 1: Case study area profile—Auburn ............................................................. 31
Appendix 2: Selected policy interventions to address disadvantage in Auburn ............ 62

                                                                                                                       iii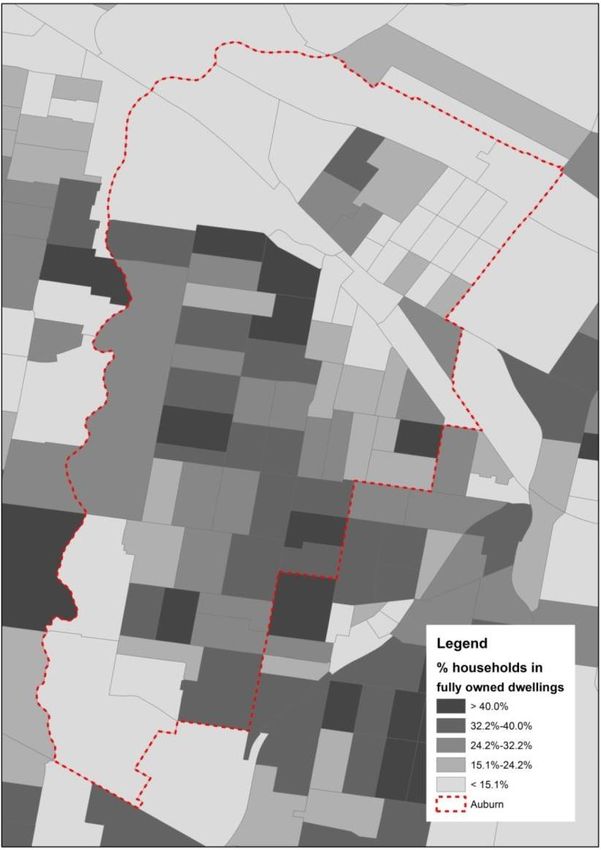
LIST OF TABLES
Table 1: Comparison of key demographics between Auburn suburb and Greater
    Metropolitan Sydney, 2011................................................................................... 6

Table A1: Selected demographic characteristics for Auburn suburb, Auburn SA3 and
    Greater Metropolitan Sydney, 2011.................................................................... 35
Table A2: Ancestry, county of birth, language and religious affiliation for Auburn
    suburb, Auburn SA3 and Greater Metropolitan Sydney, 2011 ............................ 36
Table A3: Employment and occupation characteristics for Auburn suburb, Auburn SA3
    and Greater Metropolitan Sydney, 2011 ............................................................. 37
Table A4: Unpaid work for Auburn suburb, Auburn SA3 and Greater Metropolitan
    Sydney, 2011 ..................................................................................................... 38
Table A5: Travel to work for Auburn suburb, Auburn SA3 and Greater Metropolitan
    Sydney, 2011 ..................................................................................................... 38
Table A6: Educational qualifications for Auburn suburb, Auburn SA3 and Greater
    Metropolitan Sydney, 2011................................................................................. 39
Table A7: Residential mobility for Auburn suburb, Auburn SA3 and Greater
    Metropolitan Sydney, 2011................................................................................. 39
Table A8: Housing characteristics for Auburn suburb, Auburn SA3 and Greater
    Metropolitan Sydney, 2011................................................................................. 40
Table A9: Household type for Auburn suburb, Auburn SA3 and Greater Metropolitan
    Sydney, 2011 ..................................................................................................... 40
Table A10: Dwelling characteristics for Auburn suburb, Auburn SA3 and Greater
    Metropolitan Sydney, 2011................................................................................. 41
Table A11: Housing tenure for Auburn suburb, Auburn SA3 and Greater Metropolitan
    Sydney, 2011 ..................................................................................................... 41
Table A12: Selected demographic characteristics for Auburn suburb, Auburn SA3 and
    Greater Metropolitan Sydney, 2001 and 2011 .................................................... 43
Table A13: Selected employment characteristics for Auburn suburb, Auburn SA3 and
    Greater Metropolitan Sydney, 2001 and 2011 .................................................... 44
Table A14: Educational qualifications for Auburn suburb, Auburn SA3 and Greater
    Metropolitan Sydney, 2001 and 2011 ................................................................. 45
Table A15: Housing characteristics for Auburn suburb, Auburn SA3 and Greater
    Metropolitan Sydney, 2001 and 2011 ................................................................. 45
Table A16: Household characteristics for Auburn suburb, Auburn SA3 and Greater
    Metropolitan Sydney, 2001 and 2011 ................................................................. 46
Table A17: Dwelling characteristics for Auburn suburb, Auburn SA3 and Greater
    Metropolitan Sydney, 2001 and 2011 ................................................................. 46
Table A18: Tenure for Auburn suburb, Auburn SA3 and Greater Metropolitan Sydney,
    2001 and 2011 ................................................................................................... 47
Table A19: Travel time to major commercial and employment centres from Auburn . 54
Table A20: Selected policy interventions to address disadvantage in Auburn ........... 62

                                                                                                                      iv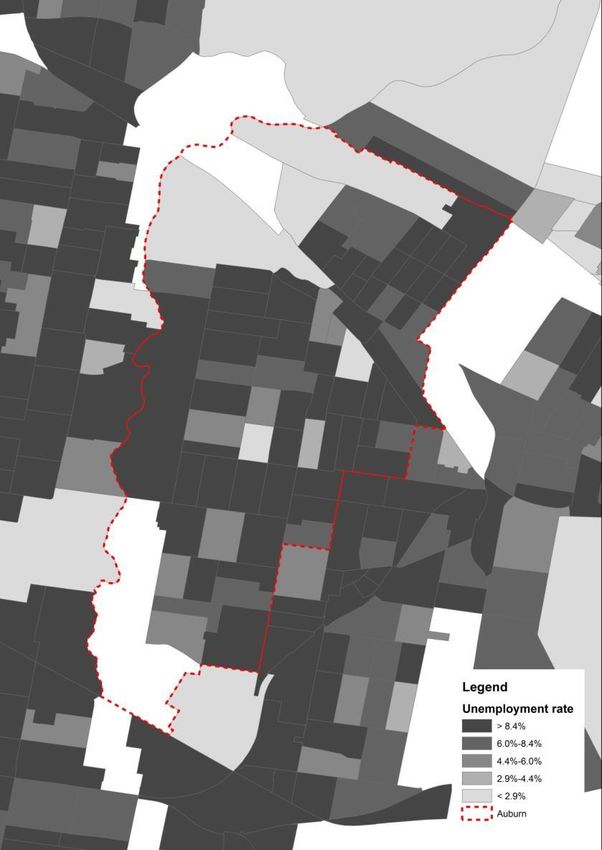
LIST OF FIGURES
Figure 1: Auburn suburb ............................................................................................. 1
Figure 2: Socio-economic indexes for areas—index of relative socio-economic
    disadvantage, Auburn SSC, 2011 ........................................................................ 8

Figure A1: Map of Auburn suburb ............................................................................. 32
Figure A2: Socio-Economic Indexes for Areas—Index of Relative Socio-Economic
    Disadvantage, Auburn SSC, 2011...................................................................... 34
Figure A3: Auburn SSC, 2011 ................................................................................... 48
Figure A4: Population distribution, Auburn SSC, 2011 .............................................. 49
Figure A5: Proportion of low-income households in rental stress*, Auburn SSC, 2011
     .......................................................................................................................... 50
Figure A6: Proportion of population who are recently arrived overseas born residents
    (since 2006), Auburn SSC, 2011 ........................................................................ 51
Figure A7: Proportion of households that are couple families with children, Auburn
    SSC, 2011 ......................................................................................................... 52
Figure A8: Auburn and surrounding commercial and employment centres ................ 53
Figure A9: Proportion of households in fully owned homes, Auburn SSC, 2011 ........ 55
Figure A10: Proportion of households in mortgaged homes, Auburn SSC, 2011 ....... 56
Figure A11: Proportion of households in private rental, Auburn SSC, 2011 ............... 57
Figure A12: Proportion of households in social rental, Auburn SSC, 2011 ................ 58
Figure A13: Proportion of population (15+) who are unemployed, Auburn SSC, 2011
     .......................................................................................................................... 59
Figure A14: Concentrations of low-income households ............................................. 60
Figure A15: Proportion of population who left school at Year 10 or before, Auburn
    SSC, 2011 ......................................................................................................... 61

                                                                                                                                v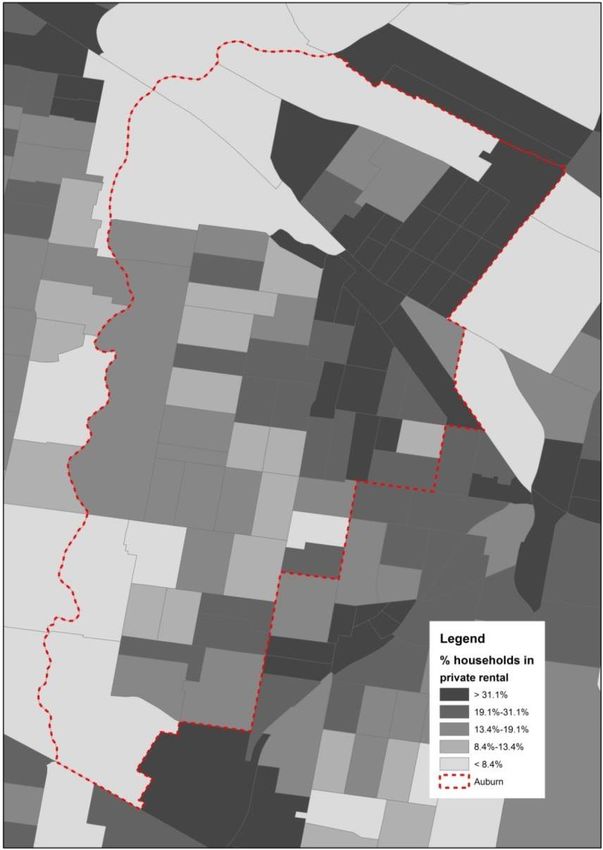
1      INTRODUCTION
1.1    Case study area overview
Auburn is a middle-ring suburb in Sydney approximately 17 kilometres west of the
Sydney CBD (see Figure 1). It is located within the local government area of Auburn
and the Level 3 Statistical Area (SA3) of Auburn. In 2011, Auburn suburb had a
population of 33 125 residents, comprising almost half of the total population of the
Auburn local government area population of 73 738 (and the SA3 population of
74 421).
Figure 1: Auburn suburb

Source: Google Maps

One of six case study locations for the current research; it was chosen to represent
‘Type 2’ disadvantaged suburbs—that is, socio-economically under-privileged areas
with a relatively high incidence of two-parent families and overseas movers. This
demographic profile tends to be associated with areas containing a high proportion of
private rental properties.
For the purposes of case study selection a ‘disadvantaged suburb’ (DS) is one in
which at least 50 per cent of ABS census collector districts are ranked in the lowest
decile of the national distribution on the ABS Socio-Economic Index for Areas
(SEIFA). In housing market terms, Type 2 DS areas are characterised as ‘lower price
suburbs’ based on property sale prices.

                                                                                   1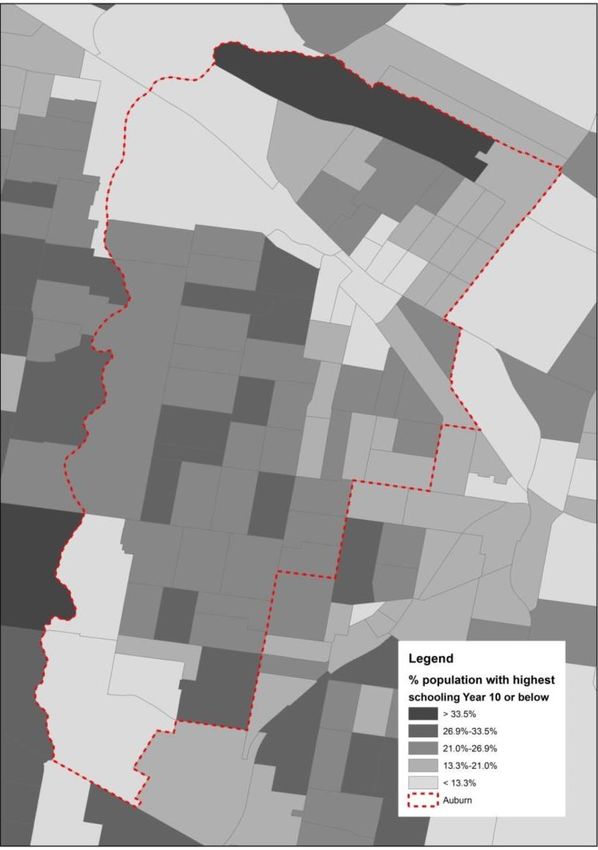
1.2 Case study research aims
The case study work was undertaken as part of a larger project looking into
concentrations of disadvantage in Australia’s major capital cities—Sydney, Melbourne
and Brisbane. The overall aims of the research are to investigate:
1. How concentrations of social disadvantage are conceptualised, defined and
measured?
2. What housing and urban processes contribute to the creation and perpetuation of
these patterns?
3. What are the consequences of living in a disadvantaged area for the residents
concerned?
4. How can policy-makers and others respond to spatial disadvantage in ‘best for
people, best for place’ terms?
The main objectives of the case study work were to better understand the experience
of living in a ‘disadvantaged area’, to explore the pros and cons of their local area
from the resident perspective and to investigate the role that housing, planning and
associated interventions may play in either exacerbating or tackling local problems.
Higher level aims included exploring the extent to which urban Australia’s ‘most
disadvantaged areas’ are seen as such by local people and whether negative
‘neighbourhood effects’ are operative. This refers to the possibility that living in a ‘poor
neighbourhood’ can compound the impact of poverty and disadvantage affecting an
individual (Atkinson & Kintrea 2001). While such a scenario has been evidenced
within the context of North American and European cities (Galster 2009), it remains an
open question as to whether the scale and depth of spatially concentrated
disadvantage in Australia could give rise to such an outcome.
Also important in the fieldwork was to ‘ground truth’ or validate the disadvantaged
area typology category attributed each case study locality.
1.3 Case study methodology
Undertaken May–July 2013, the case study work involved five elements:
Background analysis of 2001 and 2011 census data on the selected suburb.
Analysis of media coverage relating to the selected suburb (and, in this instance,
the broader Auburn area).
Document analysis—government and other reports about the selected suburb and
surrounding area.
In-depth interviews with local stakeholders.
Resident focus group meeting.
Spanning the period 2003–13, the media analysis covered the three major
metropolitan papers for Sydney—The Australian, The Sydney Morning Herald and
The Daily Telegraph—as well as radio (ABC) and television (ABC and SBS) news
broadcasts, as well as selected documentaries on commercial TV channels.
Stakeholder interviewee selection was to some extent guided according to a standard
list of potentially relevant participants (e.g. local council social planner, real estate
agent, social housing manager, police representative, support service provider,
community group spokesperson). However, it also involved ‘snowballing’—that is,
being guided by interviewee recommendations as to other potentially appropriate
contributors.
2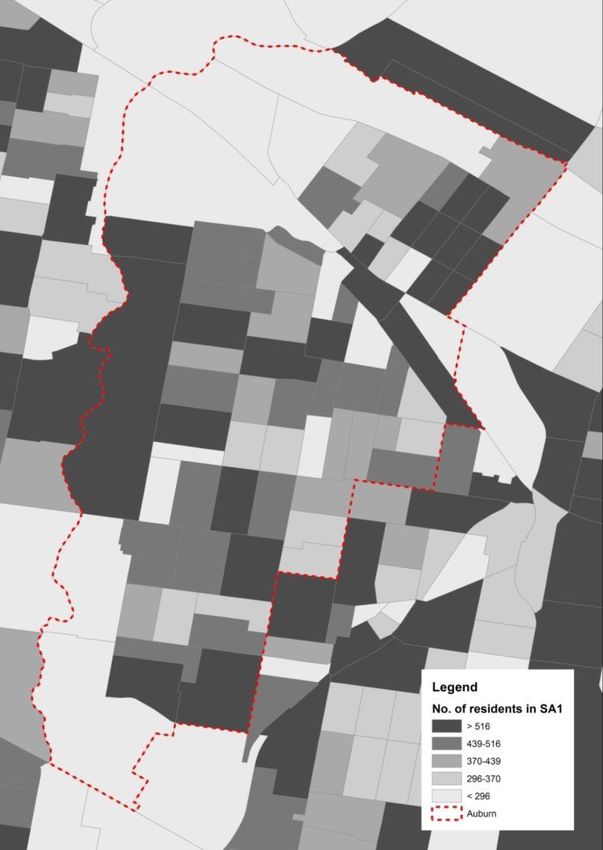
In Auburn, seven people were interviewed from five organisations, which can be
classified broadly as:
Local government (1 interview).
Not for profit housing provider (1 interview).
Industry/commerce (1 interview).
NGO community worker / support provider (2 interviews).
Respondent views represented in this report are not attributed to individuals or
specific organisations.
The resident focus group involved an ethnically and demographically diverse group of
ten local people recruited with the kind assistance of the local council and multiple
community groups.
Stakeholder interviews and residents focus group discussions were structured
according to master topic guides common to all case studies within the wider project.
However, for stakeholder interviews these were necessarily adapted as appropriate to
the area of knowledge/responsibility of the interviewees concerned.
3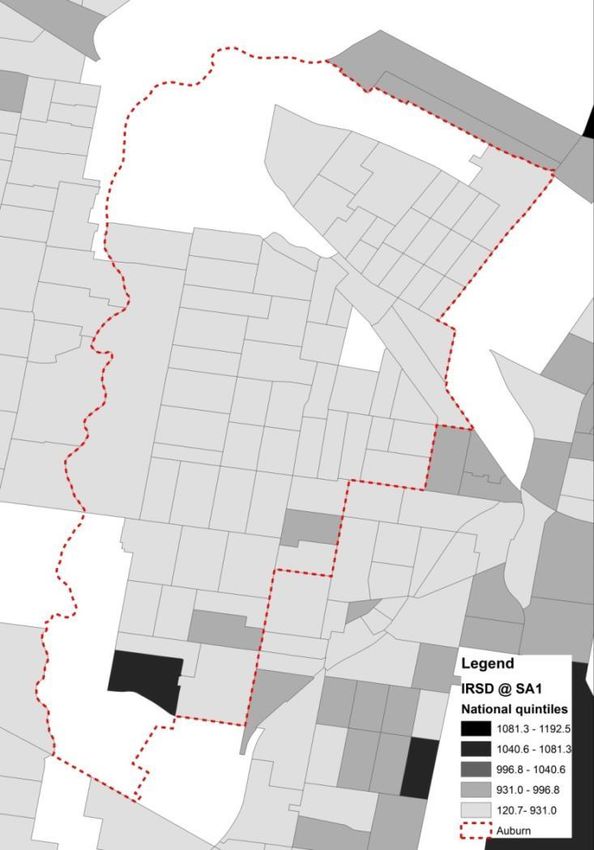
2      BACKGROUND TO THE AREA
Auburn is notable for the large number of new migrants who move into the area,
including refugees and humanitarian entrants. In the five years between 2007 and
2012, over 1500 humanitarian entrants settled in the Auburn LGA (Auburn City
Council 2013e). Auburn LGA has been a Refugee Welcome Zone since 2004 (Auburn
City Council 2010a). The Refugee Council of Australia defines a refugee welcome
zone as ‘a local government area which has made a commitment in spirit to
welcoming refugees into the community, upholding the human rights of refugees,
demonstrating compassion for refugees and enhancing cultural and religious diversity
in the community’ (Refugee Council of Australia 2013).
Auburn’s population is very culturally diverse. At the time of the 2011 census, only
31.9 per cent of the population was born in Australia (compared to 59.9% across the
greater metropolitan area), and only 13.5 per cent of the population spoke English at
home (compared to 62.2% across the greater metropolitan area). In fact, a higher
proportion of Auburn’s population spoke Arabic at home (15.6%) than English (see
Appendix 1).
Auburn has seen many waves of new migrants since the post-WWII period. Over that
time people have been attracted to the area by existing communities already
established in the area. Once communities became established, the existing shops,
community organisations, places of worship, cultural celebrations and support
networks attracted new migrants.
In particular, people are attracted to Auburn because of the large Arabic community,
including Arabic businesses and services with Arabic speaking staff (including
banking, Centrelink, doctors and medical centres), and Arabic speaking teachers in
the schools making it easier for children. The large Auburn Gallipoli Mosque is also an
important feature of the area. At the time of the 2011 census, 42.0 per cent of the
population of Auburn suburb identified their religious affiliation as Islam (compared to
4.7% across Greater metropolitan Sydney) (see Appendix 1).
However, while there is a significant Arabic presence, Auburn’s population is very
diverse and includes large populations of Chinese (13.3% of the population) and
Indian-born (5.0% of the population), as well as people born in many other countries
and regions around the world (see Appendix 1).
Overseas migrants are attracted to Auburn for a number of reasons. It is a very
multicultural area, which adds to the vibrancy of the community, and is welcoming to
new migrants who see other people from their countries living in the area. There are
also many services to support recent migrants in Auburn, including humanitarian
entrants and refugees. These include the Torture and Trauma Counselling Service
(STARTTS), Settlement Services International, Auburn Diversity Services and other
settlement support service providers. As well as the mosque, Auburn also has places
of worship for different religious denominations.
Auburn is also a very accessible suburb, with good public transport links to the
Sydney CBD and Parramatta. The cost of living in the area is cheaper relative to
many other parts of Sydney, with shops and services being more affordable.
Auburn suburb has a very mobile population. In 2011, only 51 per cent of the
population lived at the same address as five years previously. An additional 10 per
cent lived in the same SA2 and 12 per cent lived elsewhere in Australia. Significantly,

                                                                                      4
17 per cent of the population lived overseas five years previously1. In the words of one
interviewee, ‘a lot of people come straight from the airport to Auburn’ [NGO
Community worker/support provider].
According to one interviewee, in the past, people would continue living in Auburn over
the long term, but more recently, housing affordability (for both rental and purchase)
has declined. In addition, while there is demand for larger family accommodation,
older style single dwelling housing has been knocked down and replaced with one
and two bedroom apartments. People have been moving out of the area to suburbs
further west as a result of these housing constraints [Local government officer].
Indeed, housing affordability is a major issue facing residents of Auburn suburb (see
Chapter 6).
People who have left Auburn and settled elsewhere in Sydney often return to Auburn
to do their shopping, visit places of worship or use community services. According to
interviewees, people often move to Auburn when they first move to Australia and rent
properties privately, and then move on to other locations within western Sydney later
on, especially Blacktown, Liverpool or Campbelltown, in order to find more affordable
properties to purchase [Local government officer, NFP housing provider].
1
Figures based on Australian Bureau of Statistics (2011) Basic Community Profile—Auburn State
Suburb, Table B39. Balance is ‘not stated’.
53 PLACES WHERE DISADVANTAGED PEOPLE LIVE
3.1 Overview
While Auburn does not suffer from place disadvantage (see Chapter 4), it is certainly
a place where disadvantaged people live.
Compared to the population of Greater Metropolitan Sydney as a whole, the
population of Auburn suburb is particularly notable for the following (see Table 1):
Less people speak English at home.
Less people are born in Australia.
The median age is younger.
There are less older people.
There are more children.
More people are unemployed.
Median weekly individual incomes are lower.
Less people are employed full-time.
More employed people are employed in low-skilled or low-status jobs.
More low-income households pay more than 30 per cent of their income in rent.
More households live in private rental accommodation.
Less households live in fully-owned or mortgaged properties.
Table 1: Comparison of key demographics between Auburn suburb and Greater
Metropolitan Sydney, 2011
Auburn suburb Greater Metropolitan Sydney
Speak English at home 13.5% 62.2%
Born in Australia 31.9% 59.9%
Median age 29 36
Aged 65 or older 8.3% 12.9%
Aged 0–17 25.7% 22.9%
Unemployed 10.8% 5.7%
Median weekly individual income $352 $619
Employed full-time (% population aged 25.5% 38.3%
15 and older)
Employed people employed in low- 46.1% 28.0%
skilled/low-status jobs (% population
aged 15 and older)
Low-income households paying more 32.6% 21.0%
than 30% of income in rent (% of low-
income households with weekly
household income < $600)
Households living in private rental 32.8% 24.6%
Households living in fully-owned or 50.9% 62.6%
mortgaged properties
Source: ABS Census 2011
6Reflecting some of these demographics, in 2011, the majority of SA1 areas in Auburn
suburb were in the lowest quintile of the Socio-Economic Indexes for Areas Index of
Relative Socioeconomic Disadvantage (SEIFA IRSD) (see Figure 2). The SEIFA
IRSD for the suburb as a whole was 855.4.
Typology classification
In the typology developed for this project, Auburn is classified under typology Type 2:
‘high on overseas movers, high on two parent families’. Based on the housing market
analysis, Type 2 suburbs are typically ‘lower price suburbs’ based on property sales.
Auburn is certainly high on overseas movers. Auburn suburb also had a higher
proportion of couple family households with children (37.4%) compared to the greater
metropolitan area (33.0%) (see Appendix 1).
Properties in Auburn are cheaper to purchase than in many other parts of Sydney.
However, the suburb has a higher proportion of private renters (32.8%) than Greater
Metropolitan Sydney as a whole (24.6%), and a smaller proportion of owner occupiers
(50.9% in Auburn compared with 62.6%). Indeed, in the housing market analysis,
Type 2 suburbs were characterised by a high number of private renters. Further, while
private rents are cheaper in Auburn than in many other parts of Sydney, they are not
affordable for many of the people who live there, with one-third of low-income
households spending more than thirty per cent of their income in rent, compared to
one-fifth across the greater metropolitan area (see Appendix1). Across the Auburn
LGA, housing purchase affordability is also constrained for those on lower incomes
living in the area (Commonwealth Government 2009, p.147). Hence many of these
lower price property sales may be being made to private investors rather than local
residents.
3.2 Specific groups vulnerable to disadvantage
Three sub-groups of the population identified by interviewees, focus group
participants and in council documents as particularly disadvantaged in the Auburn
area are recent migrants, young people, and some women.
3.2.1 Recent migrants
One interviewee explained that disadvantage in Auburn is often tied to how recently
people have arrived from overseas [Local government officer]. The lower socio-
economic status of the population is influenced by the low English literacy level of
many newly arrived migrants who need support to learn English so that they can find
work. As well as language issues, being able to navigate Australian systems, finding
out what opportunities and supports are available and dealing with cultural barriers
can be difficult. The Auburn City Community Strategic Plan for 2013–23 notes:
Many new arrivals experience multiple disadvantage including poverty,
housing stress, previous experiences of trauma, interrupted education
experiences, health problems, disability and unemployment which require
additional resources to target their complexities of need. (Auburn City Council
2013d, p.21)
7Figure 2: Socio-economic indexes for areas—index of relative socio-economic
disadvantage, Auburn SSC, 2011
3.2.2 Youth
Auburn suburb has a relatively young population and there is a high proportion of
disengaged young people in Auburn suburb, who are not in school and are not
engaged in employment or training. In Auburn suburb, 13.8 per cent of people aged
15–24 in Auburn North and 12.8 per cent in Auburn South were not employed or
attending an education institute in 2011. This compared with 8.1 per cent for Greater
Sydney. Youth unemployment is also high. In Auburn suburb, 16.9 per cent of 15–24-
year olds in the labour force were unemployed in Auburn North and 17.4 per cent in
Auburn South. This compared with 12.6 per cent for Greater Sydney (Auburn City
Council 2013a, p.9).
According to one interviewee [NGO Community worker/support provider], the main
components of disadvantage as they relate to young people in Auburn are:
High unemployment.
Not enough money, which can affect their ability to get to school or training if they
have insufficient funds for transport.
Conflict between people from different countries and different religions.
Family and intergenerational conflict.
Homelessness.
8A range of barriers to employment for young people were identified by agencies and
reported in the Auburn Youth Strategy. These included ‘language, settlement issues,
lack of work experience, job seeking and vocational skills, and a need for more
appropriate support provided by employment services’ (Auburn City Council 2013a,
p.12).
There are few local employment options for young people in the area aside from fast
food outlets or their family’s business. Those young people who are able to find work
often report racism in the workplace and being paid very low salaries ‘off the books’
[NGO Community worker/support provider].
For those who have not found work, there are many accredited training courses
available for young people who want to work in industry or a trade, and Youth Links
provides free courses in the area to enable people to return to school to finish
Year 10. However, some young people are still unable to find work having completed
these training courses:
That’s often where the disengagement kicks in. Not because of lack of trying in
the first place, but because they’ve tried and not got what they hoped. [NGO
community worker/support provider]
In regards to conflict, racism does not appear to be a major issue for young people.
There are some exceptions where conflicts are tied to the country of origin, such as
conflicts between Lebanese and Turkish or between North and South Sudanese
youth. However, in general conflicts are more likely to occur over religion than
ethnicity [NGO Community worker/support provider]. However, while arguments can
occur based on religion, religion also plays a positive role in the lives of many young
people in Auburn [NGO Community worker/support provider].
Focus group participants and an interviewee [NGO Community worker/support
provider] noted that young people in the area tend to socialise with people from lots of
different countries and that provides them with a good experience to help them to
adapt to change and accept others. In the words of one interviewee ‘no one think’s it’s
odd or weird or forbidden to hang out with people from different cultural backgrounds’
[NGO Community worker/support provider].
However, two focus group participants noted that their daughters had been regularly
bullied growing up in Auburn by boys in their neighbourhood as a result of their
religion (Catholic), and the way that they dressed (wearing shorts or not covering their
hair). One participant said that her daughter had left the area in part as a result of
these experiences.
Also, in some cases, young people might find that they have to keep their
associations with people from different backgrounds secret from their parents. For
example, if a young person is kicked out of home for being drunk and then stay with a
family friend from a different cultural background and their family find out where
they’re staying, that can cause problems [NGO Community worker/support provider].
Indeed, intergenerational conflict was raised as a key safety consideration in
community consultations (Auburn City Council 2013b). A strong culture of community
and family is generally a strength of the area and ‘there’s a feeling that the family and
community have your back … across the many cultures that make up Auburn’ [NGO
Community worker/support provider]. However, where a young person falls foul of
their family, this can cause family tensions that can contribute to a young person
being kicked out of home, or moving away from home. Indeed, intergenerational
conflict is a major contributor to youth homelessness in the area [NGO Community
worker/support provider].
9Youth homelessness in Auburn is not necessarily worse than in other parts of
Western Sydney. However, youth homelessness has been becoming steadily more of
an issue in Auburn and an increasing number of young people have been seeking
support as a result of being homeless [NGO Community worker/support provider].
Despite these challenges for young people in the area, there are also a lot of
opportunities for young people in Auburn. As well as the availability of various support
services and education and training opportunities, there are also many opportunities
to participate in arts and creative activities in the area [NGO Community
worker/support provider].
3.2.3 Women
Focus group participants and interviewees also identified some groups of women in
the Auburn area as being especially disadvantaged [NGO Community worker/support
provider, NFP housing provider]. In particular, this includes:
Women from non-English speaking backgrounds who remain at home to take care
of their children, who can find themselves isolated on arrival in Australia.
Single parents who can experience some degree of discrimination or persecution
through their cultural or ethnic community because of their status as a single
mother.
Women who have arrived in the country on a 204 visa subclass (women at risk).
In these cases, these women are not only disadvantaged in terms of income and
employment, but also may be subject to discrimination and victimisation.
In addition to these specific subgroups of disadvantaged women in the area, an
important issue was raised in the resident focus groups in regards to the isolation
faced by some older women of Anglo background. Focus group participants
recognised that there is a need for young people and recent migrants to be supported,
but the result of focusing on these groups has been that other sub-groups in the
population have been neglected. In particular, they noted that many older Australian-
born women in the area feel isolated, as a lot of the services and locations at which
they could socialize no longer exist, and many of the services in the area are geared
towards younger people and recent arrivals.
104 PLACE DISADVANTAGE IN AUBURN
4.1 Contextualising place disadvantage in the area
This section of the report discusses place disadvantage. The most significant form of
place disadvantage in Auburn is the problem of housing affordability and resulting
concerns about the quality of available housing, overcrowding and rental stress.
These issues are discussed in more detail in Chapter 5. Aside from these problems,
Auburn is a relatively advantaged locality in the Greater Metropolitan Sydney area in
regards to other place-related factors, including transport, education, health, access to
employment and public space.
In the resident focus group, participants were asked what they like about living in
Auburn suburb. People said that Auburn is in a good location, close to the train
station, with good amenities, parks and medical centres nearby.
One participant noted that the fact that many of the staff working in local shops and
services (including doctors) speak other languages means that his family members
who do not speak much English can be more independent in the area. There are also
a lot of service providers and community organisations in the area.
A recurring concern, however, is that a rapidly increasing population in the area
continues to put pressure on existing services and facilities. Between 2001 and 2011,
the population of Auburn suburb grew from 26 711 to 33 125 people, a population
growth rate of 24 per cent, much higher than the population growth rate for the whole
of Greater Metropolitan Sydney of 10 per cent.
Other important considerations raised by focus group participants and interviewees
were the way in which the area is perceived, and the nature of community cohesion
and fragmentation.
4.1.1 Transport
Auburn suburb is serviced by the Western Rail Line of NSW’s City Rail, and has its
own dedicated railway station (Auburn) located at Rawson Street in the northern part
of the suburb, although some train services through the area do not stop at Auburn
(Auburn City Council 2012a, p.15). It is also well serviced by a mix of government and
private bus routes. Its closest major commercial and employment centres are
Strathfield to the east and Parramatta to the west, both of which are serviced by the
Western Rail Line. Major road corridors also pass through this area. As one
interviewee remarked ‘the location itself is a key strength [of Auburn]’ [Local
government officer]. A focus group participant noted that both train and bus services
have improved over time in the area.
Despite these transport connections, 57 per cent of residents across the Auburn LGA
live in transport disadvantaged areas where facilities and services are difficult to
access or unavailable (Auburn City Council 2012a, p.15). In Auburn suburb, transport
disadvantage is a problem for residents living in the southern part of the suburb (see
Section 4.4).
For those people who do own a car and drive to the train station to commute, parking
is very limited and this contributes to the heavy traffic congestion around the CBD of
Auburn and on the Eastern side of Auburn Road [Industry/commerce].
4.1.2 Employment
There are limited employment opportunities in the Auburn LGA for residents of Auburn
suburb. While there are employment lands in the LGA, including the Silverwater
11commercial area, few residents of Auburn work there. Many people who live in Auburn
travel to Parramatta or other parts of Western Sydney for work. Newly arrived
migrants living in Auburn tend to get their first jobs doing unskilled labour on a casual
basis, which can be anywhere in Sydney [Local government officer]. The good public
transport links to the area make this possible.
4.1.3 Education
Auburn LGA is well-served by both public and private primary schools. However, there
is only one public high-school in the area and it is for girls only. This means that boys
have to leave the LGA to attend school either in Granville, Homebush Boys School or
Birrong Boys School [Local government officer]. A focus group participant also noted
that non-Muslim families are often reluctant to send their daughters to the public girls
high school as the school has a ‘Muslim monoculture’.
Generally interviewees and focus group participants thought that schools in the area
were adequate, but one focus group participant noted that some families would not
send their children to the local public schools because they were afraid of the bad
influence of other students, some of whom can be seen hanging around Auburn
station and smoking.
Focus group participants noted that schools in the area are currently under a lot of
pressure because of the rapid population increase in the area, and concern was
raised that there may not be enough schools to cater for the predicted increase in
population.
Auburn’s population currently (at the time of the 2011 census) has a young profile,
with a median age of 29 (compared to 36 for greater metropolitan Sydney). Auburn
also has a higher proportion of school-aged people than the average for Greater
Sydney at both primary school age (9.3% of the population aged 5–11 compared to
8.7% for Sydney) and high school age (8.1% of the population aged 12–17 compared
to 7.4% for Sydney) (see Appendix 1). Assuming future population increases also
include this younger demographic, the pressure on the school system will be greater
as a result of population increase than in other areas in Sydney.
4.1.4 Health services
There are many health services available in Auburn, including medical centres and a
hospital. An interviewee [Industry/commerce] and focus group participants noted that
there are centres that offer different services and specialties, and often have female
doctors and doctors who speak different languages.
However, focus group participants noted that the hospital was under great pressure
both from the large population in the area, and the need to assist a large number of
patients from non-English-speaking backgrounds who require more assistance, and in
some cases culturally-appropriate services from doctors and nurses. Some focus
group participants noted that when they have visited the hospital, if another patient
has arrived with an interpreter, then they have had their appointments ‘bumped’ in
order to suit the interpreter’s availability.
Further adding to the pressure on the hospital, one participant also noted that many of
the beds in the hospital are currently closed as they are not funded by the
government.
4.1.5 Community services
There are many community organisations operating in the Auburn area. Focus group
participants and interviewees noted that services come to Auburn because the area
has a high concentration of disadvantaged people, especially new migrants. There are
12too many services to list here, and many services that cater to a particular ethnic
group, or a group with particular needs. One organisation with a particularly strong
profile in the area is Auburn Diversity Services, which focus group participants
commended for having a large number of programs and engaging very well with the
community. Focus group participants also noted that council plays an important role in
communicating with the many different services in the area (discussed further in
Section 6.5) and that Auburn Library provides services and programs for people from
a range of different ethnic groups.
Residents of Auburn are able to find out about these services through a range of
avenues, including the local free paper, council’s community information directory
(Auburn City Council 2010b), e-mails from council, fliers distributed by service
providers, public noticeboards in the Library and Auburn Diversity Services, and
through personal contacts and networks.
4.1.6 Public space
There are a large number of parks and playgrounds in Auburn suburb. However,
some parks are very heavily used because of the population density in the area. For
example, Auburn Park, which is a local park surrounded by apartments and Bardell
Park, which is a small park in between unit blocks have a lot of pressure placed on
them. The grass in Bardell Park had to be replaced with artificial grass because the
grass could not be maintained because the park was used so much [Local
government officer].
4.2 Area perceptions
Focus group participants agreed that the area is ‘dynamic’ and ‘has a real energy to
it’, which is influenced by the multicultural and diverse population. Participants said
that they enjoyed the cultural diversity of the area, and the fact that it is busy on the
streets.
However, while focus group participants spoke positively about their area, some also
spoke about the negative stigma sometimes associated with the area. One focus
group participant explained that when her real estate agent told her he had found a
property in Auburn that suited her needs, she initially did not want to move to the area
because of its poor image, but ‘when we actually moved in, the feeling is different than
when you think about it from the outside.’ Another focus group participant noted that
her daughter didn’t like to tell people that she was from Auburn because of the stigma
associated with the area; while another had been cautioned that he wouldn’t find good
husbands for his daughters if he continued living in the area.
There was also concern raised by some focus group participants that Auburn, as well
as other areas of Western Sydney, is seen as a ‘dumping ground’ by private
companies and the government. Examples given included the quality of food and
service in supermarkets in the area, which was seen as inferior to that offered in other
parts of Sydney; the level of service in public institutions such as the hospital; plans to
establish an industrial recycling area nearby; and the development of poor quality
private housing. One participant noted that ‘Auburn has traditionally been seen as a
bit of a dumping area with industry, and no matter how many people they bring in,
there’s the idea that Auburn can take it’ while another said ‘the government isn’t
looking after the Western Sydney area, they feel that Western Sydney is a dumping
area, they can dump rubbish real estate here because no one will question.’
Also related to perceptions of the area was a concern around the impact of media
coverage of crime in the area on perceptions of the area. A recent community
consultation undertaken in the Auburn LGA found that key safety considerations
13raised in the community included perceptions of crime based on media coverage
(Auburn City Council 2013b).
Certainly, our review of the coverage given to Auburn by major media outlets found
that local crimes in Auburn attracted broader media attention. In Auburn, there was a
particular focus on gun crimes, the connection of gun crimes with gangs, and the
connection of gangs with Auburn’s Muslim population.
In the Community Safety Survey2, 63 per cent of residents indicated that they were
concerned about crime in their local area and 23 per cent said they had felt at direct
risk of becoming a victim of crime. Interestingly, 50 per cent felt that crime had
increased and only 8 per cent thought it had decreased but in fact, official crime rates
have decreased over the five years to 2013 (Auburn City Council 2013b).
The top ranking crime in Auburn is robbery (of which 75% occurred outdoors).
Between 2007–10, Auburn was ranked 1 or 2 of LGAs in NSW for robbery (based on
offences per 100 000 people). In 2011 it ranked 5th (Auburn City Council 2013b).
In the Auburn Council Community Satisfaction Study, the issue of the perception of
crime was also raised in the four discussion groups held with 45 Auburn residents.
This study reported that:
When told that the crime rate is down in Auburn, residents expressed
frustration that this is not being communicated and celebrated. It’s not news
that Auburn is often associated with safety issues, not only for those who live
here, but for those living outside of the LGA who in turn refuse to visit.
Residents want to feel proud of where they live and therefore want to see the
message of lowering crime rates communicated outside of the community as
well as within. (Micromex Research 2013)
However, one interviewee [NGO community worker/service provider] noted that while
media coverage of Auburn does often focus on a shooting or ‘drug bust’, with the
associated negative stigma, there has also been some positive coverage of Auburn in
the media of late, especially on SBS and the ABC, with the Auburn Community
Development Network frequently being asked to contribute to media reports.
Interestingly, when asked about their own feelings of safety, as opposed to media
portrayals of crime and safety in the area, focus group participants had had different
experiences. Most agreed that while the area has become notorious for small-scale
criminal players and drug-related syndicates, this criminal activity is targeted and
organised rather than random, so ordinary citizens are generally not fearful of being
targeted. However, when it came to feeling safe walking in the area at night, people
were divided. Some said that they felt safe in the area at night because shops were
open and there were people in the streets, while others said that they did not feel safe
walking at night. There was agreement that this largely depended on the area, with
streets close to the station and shopping centre being well-lit and busy, while other
streets are seen as unsafe with one participant noting there are some streets where
ambulances will not go without a police escort. Interestingly, some of the longer term
residents in the focus groups said that Auburn was improving in this regard, with the
area feeling much less safe in the past.
Also of note is the fact that while official crime rates have decreased in the area, only
56 per cent of respondents to the Community Safety Survey who had been victims of
crime had reported it to the police (Auburn City Council 2013b, p.12).
2
This was a survey with 308 people who live, work or visit the Auburn LGA undertaken by Auburn
Council.
144.3 Community cohesion and fragmentation
In general, resident focus group participants and interviewees spoke positively about
the community in Auburn.
Focus group participants gave examples of strong ties between neighbours in their
neighbourhood, with neighbours borrowing things from each other, providing
assistance and giving reciprocal gifts. Another participant noted that there were strong
bonds between neighbours and she was made to feel welcome and safe in her
neighbourhood, an experience she did not have when living in more expensive
suburbs of Sydney previously. However, these experiences were not universal. One
participant noted that she had neighbours who did not speak English, making it hard
to talk to them, and another participant who lived in an apartment building said that
people in the building did not interact much as many had poor English skills. As a
result, people in the building would tend to socialise only with others in their language
group. The mobility of neighbours was also an important factor in making it more
difficult or less desirable to develop relationships, both in apartment buildings with
rapid resident turn over, and also in those properties in which recently arrived
refugees are housed for six months before moving on.
While there are many events held to bring the Auburn community together (see
Section 6.3), some interviewees noted that the Auburn community as a whole is made
up of many different sub-communities. In some cases, people interact mainly within
their own language and cultural group [Local government officer].
There is also fragmentation within some communities. For example, interviewees
noted that the Afghan and Sudanese communities are split according to community
divisions in their countries of origin [Local government officer, NGO community
worker/support provider].
There are also inter-generational divides in the community, compounded by the fact
that a lot of the older population are from an Anglo background and have seen the
area change significantly over the past few decades [Focus group discussion, Local
government officer]. Focus group participants noted that this had resulted in some
older Anglo residents feeling excluded from the broader community and the way that
the community has changed over time, with the majority of services and facilities now
geared towards migrants and younger people.
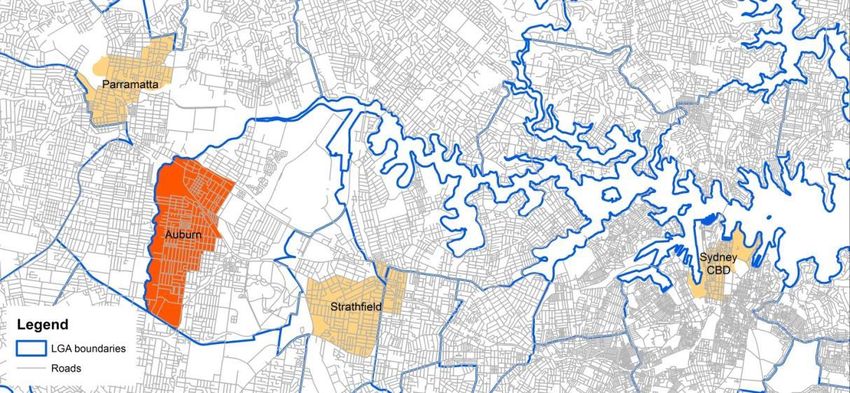
4.4 Spatial concentrations of disadvantage
As well as there being particularly notable sub-groups of the population who are more
disadvantaged in Auburn, there is also a geographical dimension to disadvantage in
the suburb, with some areas of the suburb being more disadvantaged than others.
This reflects differences in residential property density and property quality in different
parts of the suburb.
There is a geographical divide in Auburn in relation to disadvantage between Auburn
North and Auburn South. Auburn North is characterised by apartments and units and
a lot of private rental accommodation, while Auburn South is characterised by older
single dwelling houses. Because Auburn North provides more affordable rental
accommodation, it also houses a higher proportion of disadvantaged people. People
often move to Auburn North for a short period of time until they can find somewhere
else to live. While there are some long-term residents in Auburn North, it is in general
a very transient area [Local government officer].
However, Auburn South suffers from transport disadvantage, which is not a problem
experienced by residents in Auburn North. The large botanic garden precinct
15(14 hectares) in Auburn South has meant that that area is difficult to access by public
transport. The distance from Auburn South to the Auburn CBD is very short in a car,
but car ownership in Auburn suburb is lower than in the other suburbs in the Auburn
LGA, meaning that some residents in this area find it difficult to travel to the Auburn
CBD [Local government officer]. In recognition of this problem, Auburn Council has
begun to operate a free loop shuttle bus, which at the time of writing was operating
three and a half days a week.
At an even smaller scale, disadvantage is concentrated in some specific apartment
developments. For example, one apartment development in Auburn (Auburn Central)
is notorious for having many overcrowded apartments in it, and was mentioned by
many interviewees. There are some streets between the railway line and the freeway
where there are a lot of old and run-down unit blocks that are poorly maintained. This
is the area of Auburn where recently arrived refugees are more likely to settle. In
contrast, on the other side of the railway line towards Granville, there are better quality
properties and there is a lot of expensive real estate in those areas with high rents
[Industry/commerce].
165 THE ROLE OF HOUSING SYSTEMS AND
MARKETS IN CONCENTRATING DISADVANTAGE
A major issue facing residents of Auburn suburb is housing affordability. The
desirability of Auburn as a place to live for new migrants means that there is a lot of
pressure on the local housing market. In the words of one interviewee ‘everyone
wants [to live in] Auburn and it’s not possible’.
The proportion of low-income households (with weekly household incomes below
$600) in housing stress (i.e. paying more than 30% of their income in rent) in Auburn
suburb was 32.6 per cent at the time of the 2011 Census (see Appendix 1), much
higher than for the Sydney Greater Metropolitan Area (with 21.0% of low-income
households in housing stress). Housing stress is not a recent phenomenon in Auburn.
Research carried out using 2006 Centrelink data found that the proportion of people
on low incomes in the private rental market in receipt of Commonwealth Rent
Assistance who were paying more than 30 per cent of their income in rent in Auburn
LGA was 45 per cent (Commonwealth Government 2009, p.147). The same research
noted that between 2001 and 2007 the proportion of dwellings affordable for purchase
by households in the 40th percentile of median income declined from 14 per cent to
2.2 per cent of households in Auburn LGA, making it ‘very difficult for lower income
households to purchase housing in the area’ (Commonwealth Government 2009,
p.147).
Auburn Council’s Community Strategic Plan for 2011–21 identifies ‘housing
affordability, suitability, and quality of development’ as a key challenge for the area
and notes that ‘housing prices and rents are expected to keep rising due to our
strategic location on the railway line between the Sydney and Parramatta CBDs’
(Auburn City Council 2011a, p.34). The council also recognises:
The composition of our population is constantly changing. Anticipating the
types and mix of housing we will need in the future is part of this challenge.
(Auburn City Council 2011a, p.34)
The high demand of recent immigrants to settle in Auburn has also put upward
pressure on private rents. According to one interviewee [Industry/commerce], average
rents in the Auburn area have increased by around 30 per cent in the past five years.
This is a significant increase considering that many recently arrived migrants are
reliant on Centrelink payments. Five years ago an average two-bedroom unit would
have cost $270–290 per week to rent, now the lower end of the market is $320–330
[Industry/commerce]. Focus group participants suggested that average rents for a
two-bedroom unit in the area were significantly higher than this. A search of the online
property search engine Domain found two-bedroom units for rent in Auburn suburb
ranging from $350–450 per week (on 16th October 2013). One resident focus group
participant noted that when he arrived in Auburn in 2001, there were a lot of empty
houses in Auburn available to rent, and it was even possible to negotiate with real
estate agents to get the first few weeks of rent for free. Now the situation is quite the
opposite.
While Auburn’s housing is more affordable than many other parts of Sydney, it
remains unaffordable for many of the people living in the area and those who would
like to live in the area. Housing affordability and access is a particular concern for
single humanitarian entrants who do not have an Australian rental history or a good
income. The lack of English proficiency of many humanitarian migrants also means
that many are unable to find work and are reliant on Centrelink payments [NGO
community worker/service provider].
17You can also read