Global Estimates of the Impact of Income Support during the Pandemic
←
→
Page content transcription
If your browser does not render page correctly, please read the page content below
D E V E LO P M E N T F U T U R E S S E R I E S WO R K I N G PA P E R S

U N I T E D N AT I O N S D E V E L O P M E N T P R O G R A M M E

Mitigating Poverty:
Global Estimates of the Impact of
Income Support during the Pandemic
by Johanna Fajardo-Gonzalez, George Gray Molina, María Montoya-Aguirre, Eduardo Ortiz-Juarez

 UN DP G LOB AL POLI CY NE TWO R K
UNDP is the leading United Nations organization
fighting to end the injustice of poverty, inequality
and climate change. Working with our broad net-
work of experts and partners in 170 countries, we
help nations to build integrated, lasting solutions for
people and planet. Learn more at undp.org or follow
at @UNDP.

The views expressed in this publication are those of
the author(s) and do not necessarily represent those
of the United Nations, including UNDP, or the UN
Member States.

Copyright © UNDP July 2021
All rights reserved
United Nations Development Programme
1 UN Plaza, New York, NY 10075, USA
Mitigating Poverty:
    Global Estimates of the Impact of
    Income Support during the Pandemic
    by Johanna Fajardo-Gonzalez (johanna.fajardo-gonzalez@undp.org), George Gray Molina (george.gray.molina@undp.org),
    Maria Montoya-Aguirre (maria.montoya-aguirre@undp.org) and Eduardo Ortiz-Juarez (eduardo.ortiz.juarez@undp.org)1

1
    Johanna Fajardo-Gonzalez is Policy Specialist, Economist at the Strategic Policy Engagement Unit (SPE) at the UNDP Bureau for Policy and
    Programme Support (BPPS); George Gray Molina is the Head of Strategic Engagement and Chief Economist at BPPS; Maria Montoya-Aguirre is
    Economic Analyst at SPE-BPPS; and Eduardo Ortiz-Juarez is Economist at SPE-BPPS and Researcher at King’s College London.

    The authors are grateful to Jacob Assa, Nathalie Bouche, Lars Jensen, Luis F. Lopez-Calva, Marcela Melendez, Mansour Ndiaye, Christian Oldiges
    and the RBLAC Chief Economist Office for their valuable feedback. Special thanks to Anna Ortubia, Dylan Lowthian, Lesley Wright and Samantha
    Happ for their expert work on communications. The findings, interpretations and conclusions expressed in this paper are entirely those of the authors.

    MITIGATING POVERTY: GLOBAL ESTIMATES OF THE IMPACT OF INCOME SUPPORT DURING THE PANDEMIC                                                            1
Contents
Abstract . . . . . . . . . . . . . . . . . . . . . . . . . . . . . . . . . . . . . . . . . . . . . . . . . . . . . . . . . . . . . . . . . . . . . . . . . . . . . . . . . . . . . . 4
Introduction . . . . . . . . . . . . . . . . . . . . . . . . . . . . . . . . . . . . . . . . . . . . . . . . . . . . . . . . . . . . . . . . . . . . . . . . . . . . . . . . . . . 5
Looking back at the first pandemic year . . . . . . . . . . . . . . . . . . . . . . . . . . . . . . . . . . . . . . . . . . . . . . . . . . . . . . . . . . 7
2.1 How did the world respond? . . . . . . . . . . . . . . . . . . . . . . . . . . . . . . . . . . . . . . . . . . . . . . . . . . . . . . . . . . . . . . 8
Estimating the pandemic-induced increase in poverty . . . . . . . . . . . . . . . . . . . . . . . . . . . . . . . . . . . . . . . . . . . . . 11
3.1 Data and the counterfactual approach to measuring poverty . . . . . . . . . . . . . . . . . . . . . . . . . . . . . . . . 11
3.2 Immediate increases in poverty and welfare losses . . . . . . . . . . . . . . . . . . . . . . . . . . . . . . . . . . . . . . . . . 13
Estimating the poverty-mitigating effect of temporary basic incomes . . . . . . . . . . . . . . . . . . . . . . . . . . . . . . . . 17
4.1. The counterfactual case . . . . . . . . . . . . . . . . . . . . . . . . . . . . . . . . . . . . . . . . . . . . . . . . . . . . . . . . . . . . . . . . . 17
4.2 The actual case: Potential mitigation of poverty increases from 72 planned or implemented schemes
of emergency cash-based social assistance across 41 countries . . . . . . . . . . . . . . . . . . . . . . . . . . . . . 23
Conclusions and implications . . . . . . . . . . . . . . . . . . . . . . . . . . . . . . . . . . . . . . . . . . . . . . . . . . . . . . . . . . . . . . . . . . 34
References . . . . . . . . . . . . . . . . . . . . . . . . . . . . . . . . . . . . . . . . . . . . . . . . . . . . . . . . . . . . . . . . . . . . . . . . . . . . . . . . . . 36
Appendix . . . . . . . . . . . . . . . . . . . . . . . . . . . . . . . . . . . . . . . . . . . . . . . . . . . . . . . . . . . . . . . . . . . . . . . . . . . . . . . . . . . . 41
A. Extrapolated welfare distributions . . . . . . . . . . . . . . . . . . . . . . . . . . . . . . . . . . . . . . . . . . . . . . . . . . . . . . . . 41
C. List of countries included in the simulation of actual income support in Section 4 . . . . . . . . . . . . . . . 46
D.1 Poverty increase and mitigation effect in the sample of 160 countries had developing countries
delivered a monthly TBI to 4.1 billion people equivalent to 0.083 percent of their GDP, 2020 . . . . 47
D.2 Poverty increase and mitigation effect in the sample of 41 countries with actual income support,
2020 . . . . . . . . . . . . . . . . . . . . . . . . . . . . . . . . . . . . . . . . . . . . . . . . . . . . . . . . . . . . . . . . . . . . . . . . . . . . . . . . . 48
MITIGATING POVERTY: GLOBAL ESTIMATES OF THE IMPACT OF INCOME SUPPORT DURING THE PANDEMIC 2Figures Figure 1. Evolution of the number of social protection measures, March 2020 to May 2021 . . . . . . . . . . . . . 9 Figure 2. Spending on social protection measures by income group ($billion, US dollars), March 2020 to May 2021 . . . . . . . . . . . . . . . . . . . . . . . . . . . . . . . . . . . . . . . . . . . . . . . . . . . . . . . . . . . . . . . . . . . . . . 10 Figure 3. Increases in global poverty (million people), 2020 . . . . . . . . . . . . . . . . . . . . . . . . . . . . . . . . . . . . . . . 13 Figure 4. Increases in poverty in LIC, LMIC, and South Asia (million people), 2020 . . . . . . . . . . . . . . . . . . . . 14 Figure 5. Monthly welfare losses among those living below each threshold after the shock by income group ($billion, 2011 PPP), 2020 . . . . . . . . . . . . . . . . . . . . . . . . . . . . . . . . . . . . . . . . . . . . . . . . . . . . . . . . . . . . . . . . 15 Figure 6. Population living below context-adjusted vulnerability lines, 2019 . . . . . . . . . . . . . . . . . . . . . . . . . 18 Figure 7. Poverty increases and mitigation effect had developing countries delivered a monthly TBI to 4.1 billion people equivalent to 0.017 percent of their GDP, 2020 . . . . . . . . . . . . . . . . . . . . . . . . . . . . . 18 Figure 8. Poverty increases and mitigation effect had developing countries delivered a monthly TBI to 4.1 billion people equivalent to 0.05 percent of their GDP, 2020 . . . . . . . . . . . . . . . . . . . . . . . . . . . . . . 19 Figure 9. Poverty changes and mitigation effect had developing countries delivered a monthly TBI to 4.1 billion people equivalent to 0.083 percent of their GDP, 2020 . . . . . . . . . . . . . . . . . . . . . . . . . . . . . 20 Figure 10. Monthly per capita transfer under a TBI scheme in which developing countries invest 0.083 percent per month of their GDP, by regions and income groups (2011 PPP) . . . . . . . . . . . . . . . . . . . . . . . . . . 21 Figure 11. Absolute distribution of the changes in poverty after the pandemic-induced shock and a monthly TBI equivalent to 0.083 percent of developing countries’ GDP (million people), 2020 . . . . . . . . . 21 Figure 12. Increases in poverty in the sample of 41 countries (million people), 2020 . . . . . . . . . . . . . . . . . . . 24 Figure 13. Poverty changes and mitigation effect after the pandemic-induced shock and actual income support in the sample of 41 countries, 2020 . . . . . . . . . . . . . . . . . . . . . . . . . . . . . . . . . . . . . . . . . . . . . . . . . . . . . 25 Figure 14. Absolute distribution of the changes in poverty and vulnerability after the pandemic-induced shock and actual income support in the sample of 41 countries (million people), 2020 . . . . . . . . . . . . . . . . 26 Figure 15. Breakdown of the changes in poverty after the pandemic-induced shock and actual income support in the sample of 41 countries (million people), 2020 . . . . . . . . . . . . . . . . . . . . . . . . . . . . . . . . . . . . . . . 27 Figure 16. Transfer generosity and coverage of actual income support in the sample of 41 countries, 2020 . . 28 Figure B1. Increases in global poverty and vulnerability in a hypothetical scenario of a regressive economic contraction (million people), 2020 . . . . . . . . . . . . . . . . . . . . . . . . . . . . . . . . . . . . . . . . . . . . . . . . . . . . . 16 Figure B2. Poverty changes and mitigation effect had developing countries delivered a monthly TBI to 4.1 billion people equivalent to 0.083 percent of their GDP in a hypothetical scenario of a regressive economic contraction, 2020 . . . . . . . . . . . . . . . . . . . . . . . . . . . . . . . . . . . . . . . . . . . . . . . . . . . . . . . . . 22 Figure B3.1. Increases in poverty in the sample of 41 countries under a regressive contraction (million people), 2020 . . . . . . . . . . . . . . . . . . . . . . . . . . . . . . . . . . . . . . . . . . . . . . . . . . . . . . . . . . . . . . . . . . . . . . . . . 31 Figure B3.2. Absolute distribution of the changes in poverty after the hypothetical pandemic-induced shock of an additional 60 percent hit at the bottom and actual income support in the sample of 41 countries (million people), 2020 . . . . . . . . . . . . . . . . . . . . . . . . . . . . . . . . . . . . . . . . . . . . . . . . . . . . . . . . . . . . . . . . 32 Figure B3.3. Breakdown of the changes in poverty after the hypothetical pandemic-induced shock of an additional 60 percent hit at the bottom after income support in the sample of 41 countries (million people), 2020 . . . . . . . . . . . . . . . . . . . . . . . . . . . . . . . . . . . . . . . . . . . . . . . . . . . . . . . . . . . . . . . . . . . . . . . . . 33 Boxes Box 1. A hypothetical regressive contraction . . . . . . . . . . . . . . . . . . . . . . . . . . . . . . . . . . . . . . . . . . . . . . . . . . . . . 16 Box 2. Would the monthly TBI of 0.083 percent of GDP mitigate the increase in poverty in the short term under the hypothetical scenario of a regressive contraction? . . . . . . . . . . . . . . . . . . . . . . . 22 Box 3. Would actual income support also mitigate poverty in the short term under the hypothetical scenario of a regressive contraction? . . . . . . . . . . . . . . . . . . . . . . . . . . . . . . . . . . . . . . . . . . . . . . . . . . . . . . . . . . . 31 Tables Table 1. Number of countries in the dataset and their combined population by aggregates . . . . . . . . . . . . 12 Table 2. Short-term poverty mitigation (and further short-term poverty reduction) with hypothetical TBI schemes and actual income support in the sample of 41 countries (million people) . . . . . . . . . . . . . . . . . . . 29 MITIGATING POVERTY: GLOBAL ESTIMATES OF THE IMPACT OF INCOME SUPPORT DURING THE PANDEMIC 3
Abstract

This paper reconstructs the full welfare distributions from household surveys of 160 countries, covering
96.5 percent of the global population, to estimate the pandemic-induced increases in global poverty
and provide information on the potential short-term effects of income-support programmes on mitigating
such increases. Crucially, the analysis performs a large-scale simulation by combining the welfare
distributions with the database of social protection measures of Gentilini et al. (2021) and estimates such
effects from 72 actual income-support programmes planned or implemented across 41 countries. The
paper reports three findings: First, the projection of additional extreme poverty, in the absence of income
support, ranges between 117 million people under a distributive-neutral projection and 168 million
people under a distributive-regressive projection —which may better reflect how the shock impacted
poor and vulnerable households. Second, a simulation of the hypothetical effects of a temporary basic
income with an investment of 0.5 percent of developing countries’ GDP, spread over six months, finds
that this amount would mitigate to a large extent, at least temporarily, the increase in global poverty
at both the $1.90- and $3.20-a-day thresholds, although poverty would still increase significantly in the
poorest regions of the world. Third, the analysis of income-support programmes in 41 countries suggests
that they may have mitigated, at least temporarily, the overall increase in poverty in upper-middle
income countries but may have been insufficient to mitigate the increase in poverty at any poverty
line in low-income countries. Income support likely mitigated 60 percent of the increase in poverty at
the $3.20-a-day threshold and 20 percent at the $5.50-a-day threshold among lower-middle-income
countries. This pattern is correlated with the amount of social assistance per capita payments made in
each country.

MITIGATING POVERTY: GLOBAL ESTIMATES OF THE IMPACT OF INCOME SUPPORT DURING THE PANDEMIC                 4
Introduction
                                                                                                                                        1
A key question arising from the pandemic policy response is: Was it robust enough to mitigate income and
jobs losses around the world? While it is still early to adequately assess the welfare effects of multiple
policy measures, this paper provides estimates of the potential influence of income support in mitigating,
at least temporarily, increases in poverty headcount rates vis-à-vis a pure pandemic-induced shock
scenario.2 Clearly, policy responses around the world included more than income support—they included
tax deferrals, service payment waivers and loans and guarantees, as well as various work furlough and
employment insurance programmes, among other measures. But it is also evident that income support
programmes were ubiquitous and made up a significant portion of the response.

Twelve months ago, two of the co-authors of this paper analysed the costs and implementation challenges
of a temporary basic income (TBI) targeting poor and vulnerable people across the developing world (Gray
Molina and Ortiz-Juarez, 2020). This paper revisits that exercise and provides counterfactual information
on the potential short-term effects that income support has on mitigating the increase in poverty, and the
associated financial costs, had countries implemented TBI schemes in response to the shock. To estimate the
pandemic-induced increase in poverty and perform the simulations, the analysis retrieves the distributions
of per capita income and consumption from household surveys in 160 countries (128 developing countries
and 32 advanced economies) that covered about 96.5 percent of the world’s population in 2019–2020. But
the paper also dives into the actual response. Specifically, the analysis exploits these welfare distributions
and the database of social protection measures of Gentilini et al. (2021) to undertake a systematic, large-
scale assessment of the potential short-term effects on mitigating the increase in poverty of 72 cash-
based programmes across 41 countries, which together concentrate a fourth of the global population
and represent a fifth of the total number of countries that have planned or implemented income-support
measures since March 2020.

There are three main findings derived from the simulations. First, spending equivalent to 0.5 percent of
developing countries’ GDP, for a monthly total of $58.1 billion (2011 PPP) spread over six months, would
have sufficed to mitigate, at least temporarily, the increases in global poverty at the $1.90- and $3.20-a-day
poverty lines. Despite the aggregate mitigation, the number of people pushed below these poverty lines
because of the crisis could still be significant within the poorest regions of the world. It is important to
emphasize that the estimates rely on a distribution-neutral economic contraction. This seems unlikely, and
it might well be that the incomes of some segments of the population contracted more than proportionally
during the crisis; e.g., low- and middle-skill workers, women, or the informally employed (see, e.g., ILO
2020, 2021; IMF, 2021a). Although there is no consistent information available on the incidence of the
income contraction across households, the analysis also simulated the mitigating effects of TBI schemes
under an ad hoc regressive contraction that hits proportionally harder the bottom 60 percent of each
country’s population, which concentrates, on average across-countries, most of those living in poverty and
at high-risk of falling into poverty (see section 4). The results suggest that the above investment could have
helped to mitigate an important share of the increase in poverty, but certainly not all of it.

Second, actual income support programmes potentially mitigated the short-term increase in poverty in a
sample of 41 countries. Although this result is driven by upper-middle-income countries that were able to roll
out generous income support, the estimations suggest that low- and lower-middle-income countries may
not have provided transfers large enough to fully mitigate the shock-induced increase in poverty and even
experienced short-term increases in their headcount rates. Finally, although there has been substantial
heterogeneity in the generosity and coverage of the social protection response across countries, mostly
conditional on fiscal capacity and budget adaptation, the limited effectiveness observed in some poorer

2
    While this paper focuses on monetary poverty, it acknowledges that other dimensions of poverty such as education, employment, food security or
    safety are likely sensitive to the existence and timing of the income support provision.

MITIGATING POVERTY: GLOBAL ESTIMATES OF THE IMPACT OF INCOME SUPPORT DURING THE PANDEMIC                                                        5
countries suggests that there is room for action even under significant constraints. Yet, again, the success of these moderate interventions in mitigating the increase in poverty is likely fragile under a scenario in which the income contraction is harder on those at the bottom. Although with important caveats, the results presented in this paper provide some initial benchmarks on how the pandemic shock likely impacted poor and vulnerable households around the world, but also how important policy choices were in potentially mitigating those effects. The remainder of the paper is organized as follows. Section 2 reviews the evidence on the socioeconomic impacts of the COVID-19 pandemic and introduces the income support measures implemented as part of the governments’ policy response to this crisis. Section 3 discusses the construction of the distributions of per capita income or consumption and measures the increases in poverty at different poverty lines. Section 4 estimates the potential magnitude of the mitigation of poverty increase from hypothetical and actual emergency income support around the world. Finally, Section 5 discusses some policy implications and provides a conclusion. MITIGATING POVERTY: GLOBAL ESTIMATES OF THE IMPACT OF INCOME SUPPORT DURING THE PANDEMIC 6
Looking back at the first pandemic year
                                                                                                                                           2
At the onset of the pandemic, most developing countries were riven by pre-existing inequalities that would
eventually threaten the lives and livelihoods of their most vulnerable citizens. A large share of workers in
informal3 and at-risk service sectors (construction, transportation, retail, tourism and hospitality), combined
with absent safety nets, would soon reveal that any social distancing measures would prevent many
people from earning their usual income or earning an income at all. Indeed, following the implementation
of the first lockdowns, the earnings of informal workers were estimated to have contracted by 60 percent
globally in the first month of the crisis, reaching an average contraction of 80 percent among the poorest
countries, whereas estimates covering the whole of 2020 suggest that, relative to 2019, the loss of labour
incomes had reached US$3.7 trillion globally as a result of working-hour losses (equivalent to more than
220 million full-time jobs), with lower-middle-income countries being the hardest hit (ILO, 2020a; ILO, 2021).

The rapid progression of the pandemic across developing countries and the immediate stringent
disruptions to people’s livelihoods that followed sounded the alarms of a potential immediate increase
in global extreme poverty rates (see, e.g., Mahler et al., 2020a, 2020b; Sumner, Hoy and Ortiz-Juarez,
2020; Valensisi, 2020). While increased poverty is perhaps the most salient and visible negative economic
consequence of the COVID-19 pandemic, and the focus of this paper, other critical, related indicators of
social progress have also worsened. For starters, the pandemic-induced crisis has left more people food
insecure worldwide. Some estimates suggests that it has pushed the number of acutely food insecure
people to 270 million in 2020, an 82 percent increase compared to pre-pandemic projections (WFP, 2020).
Studies using household survey data from developing countries suggest that the main reason for this
increase in food insecurity is the loss of incomes resulting from strict lockdowns and restrictions to mobility,4
while such an effect is compounded by disruptions to global and domestic markets and food value chains
(see, e.g., Aggarwal et al., 2020; Amjath-Babu et al., 2020; Khan et al., 2021; Mahajan and Tomar, 2021).

Other analyses suggest that the effects of the pandemic are likely to exert important adverse effects
on gender equality. More women than men lost their jobs or experienced a disproportionate decline in
their incomes, resulting in a widening of gaps in labour market outcomes and opportunities (see, e.g.,
Adams-Prassl et al., 2020; Foucault and Galasso, 2020; Dang and Viet Nguyen, 2021; Montoya-Aguirre,
Ortiz-Juarez and Santiago, 2021). There are at least two factors behind this disparity. First, in contrast with
previous crises, the coronavirus pandemic has particularly affected sectors with high female employment
shares (Alon et al., 2020; ILO, 2020b). Second, the demand for childcare has increased. In response to
closures of schools and day-care centres, more mothers than fathers have reduced their working hours
or shifted to unemployment or even inactivity (see, e.g., Andrew et al., 2020; Blundell et al., 2020; Collins
et al., 2021; Sen, Zhengyun and Hao, 2020; Oreffice and Quintana-Domeque, 2021; Reichelt, Makovi and
Sargsyan, 2021); indeed, estimates suggest that the loss of women’s jobs in 2020 could reach 64 million
globally, with 86 percent moving completely into inactivity (ILO, 2021). A critical gendered outcome is that
domestic violence against women was also exacerbated during the pandemic, with its rise being mainly
associated to lack of employment, low social support, substance abuse, increased stress and poor mental
health (see, e.g., Peterman and O’Donnell, 2020).

There are also potentially harmful, long-lasting consequences on human capital accumulation.
Children have experienced learning losses across a range of subjects, grade levels and geographical
regions due to school closures.5 There is evidence that children have devoted less time to schoolwork,

3
    About 60 percent of total workers in developing countries make a living in non-agricultural informal markets (70 percent when including agriculture)
    (ILO, 2018; p 14).
4
    See, for example, evidence for China (Wang et al., 2021), Guatemala (Ceballos, Hernandez and Paz, 2021), Ethiopia (Hirvonen, de Brauw and Abate,
    2021), Nigeria (Amare et al., 2020) and South Africa (Arndt et al., 2020).
5
    Patrinos and Donnelly (2021) provide a systematic review of the evidence available for developed countries.

MITIGATING POVERTY: GLOBAL ESTIMATES OF THE IMPACT OF INCOME SUPPORT DURING THE PANDEMIC                                                              7
even though parents and schools are providing resources to support their learning process during the pandemic (see, e.g., Bacher-Hicks, Goodman and Mulhern, 2021; Jæger and Blaabæk, 2020; Maldonado and De Witte, 2020). Learning losses have also been amplified due to inadequate access to technical equipment for online schooling (see, e.g., Andrew et al., 2020b; Huber and Helm, 2020). Furthermore, learning delays are much more pronounced for primary-school students and students from low-income households, implying that educational inequalities may persist in the long term (see, e.g., Engzell, Frey and Verhagen, 2020; Gore et al., 2021; Tomasik, Helbling and Moser, 2020). Finally, in terms of health-related indicators, some estimates suggest that the less advantaged groups of the population are likely to suffer high COVID-19-related infections and mortality rates in the future as they often lack access to basic services and good-quality health care, and they tend to live in contexts with persistent conditions of indoor and outdoor pollution and where malnutrition, infectious diseases and other comorbidities are more prevalent (see, e.g., Alkire et al., 2020; Brown, Ravallion and van de Walle, 2020; Walker et al., 2020). There are also indirect health effects that are yet to be fully addressed. Access to essential health services has been severely disrupted, presenting major threats to meeting general and special health-care needs. Krubiner et al. (2021) summarize the evidence and report that most providers diverted to COVID-19 activities and supply chains were seriously affected. For instance, focusing on HIV services, studies report that disruptions to treatment may increase HIV deaths by 10 percent over the next five years, with Sub-Saharan Africa being particularly affected (Hogan et al., 2020; Jewell et al., 2020). Maternal health services have been negatively affected, as well. Antenatal care visits and institutional deliveries declined markedly in Sub-Saharan Africa due to lockdowns (Shapira et al., 2021), while in some Asian countries the quality of intra- and post-partum care and immunization rates experienced major reductions following the containment measures (Headey et al., 2020; KC et al., 2020). 2.1 How did the world respond? Since the start of the pandemic, an ever-increasing number of countries and territories embarked on an aggressive social protection response comprised by social assistance, social insurance and labour market measures. Data from the comprehensive tracker compiled by Gentilini et al. (2021) shows that by the end of March 2020, a total of 283 social protection measures were planned or implemented across 84 countries and territories, whereas by December 2020 their cumulative numbers had reached 1,414 and 215, respectively, and 3,333 measures worldwide by mid-May 2021. During 2020, about two- thirds of the total responses corresponded to social assistance, both cash-based and in-kind, with the former accounting for about a third of the total responses (Figure 1), and although social assistance still dominates in number of responses, the expansion in social protection measures after December 2020 comprised mostly social insurance and labour market programmes. MITIGATING POVERTY: GLOBAL ESTIMATES OF THE IMPACT OF INCOME SUPPORT DURING THE PANDEMIC 8
Figure 1. Evolution of the number of social protection measures, March 2020 to May 2021

                                                                                                                                                      3333

                                                                                                                                                       734

                                                                                                                                                       1107

                                                                                                                                   1414
                                                                                                              1179
                                                                     1024                1055                                     458
                                                 937
                                                                                                              370
                            685                                      310                  323
                                                 283                                                                               412                1492
                             214                                      311                 315                 354
                                                 276
        283                  198
        107                                                                                                   455                 544
                             273                 378                 403                  417
        133
       Mar '20            Apr '20             May '20              Jun '20              Jul '20             Sep '20             Dec '20              May ' 21

               Social insurance and labour market programs                     Other social assistance                Cash based social assistance
Sources: Authors’ elaboration based on Gentilini, Almenfi and Orton (2020), Gentilini, Almenfi and Dale (2020a); Gentilini, Almenfi, Dale, Blomquist et al.
(2020); Gentilini, Almenfi, Dale, Lopez, Mujica et al. (2020); Gentilini, Almenfi, Dale, Lopez and Zafar (2020); Gentilini, Almenfi, Dale, Palacios et al. (2020);
Gentilini, Almenfi, and Dale (2020b); and Gentilini et al. (2021).

The magnitude of the emergency social protection response is unprecedented. Available data on actual
investment for about 15 percent of the 3,333 measures amounts to a world total of about $2.9 trillion (current
US dollars) invested since the start of the pandemic (Gentilini et al., 2021).6 However, the lion’s share of this
effort has been accounted for by high-income economies that have spent about $2.6 trillion, or 87 percent
of the world’s total (Figure 2). When considering social assistance alone, low- to middle-income countries
have allocated $79.6 billion in cash-based and in-kind measures, equivalent to 4.6 percent of the world’s
total spending of $1.7 trillion on these measures. This staggering heterogeneity in the capacity to respond
is dramatic in per capita terms: while high-income countries have allocated an average of $545 in social
assistance and of $847 if social insurance and labour market programmes are added, low- and middle-
income countries have spent a per capita average of just $26 in social assistance and $124 in total social
protection—among low-income countries only, the amounts per capita are as low as $4. The capacity to
respond to the crisis was not only smaller among poorer countries, but further, not all of them were able to
provide any income support to mitigate the short-term effects on income losses.

6
    All monetary figures in this paragraph are expressed in current US dollars. From Section 3 onward, unless otherwise stated, all monetary figures
    are expressed in international dollars adjusted by purchasing power parity at 2011 prices (2011 PPP).

MITIGATING POVERTY: GLOBAL ESTIMATES OF THE IMPACT OF INCOME SUPPORT DURING THE PANDEMIC                                                                             9
Figure 2. Spending on social protection measures by income group ($billion, US dollars), March 2020 to May 2021
0.37%
$10.9
(LMIC)
12.46% 87.12%
$366.7 $2,563.4
0.05%
$1.3
(LIC)
LIC LMIC UMIC HIC
Sources: Authors’ elaboration based on Gentilini et al. (2021).
Notes: LIC = low-income; LMIC = lower-middle-income; UMIC = upper-middle-income; HIC = high-income.
The evidence summarized in this section reveals how the COVID-19 pandemic has negatively affected
households worldwide and how governments have provided a sizeable response to protect the livelihoods
of the most vulnerable individuals. However, important questions remain. First, had countries around the
world implemented temporary basic income schemes, what could have happened in terms of mitigating
the increase in poverty? Second, what has been the potential magnitude of mitigating the increase in
poverty from the actual investment in emergency cash support programmes among those countries that
implemented them? The next section presents the analytical approach followed in this paper to answer
these questions.
MITIGATING POVERTY: GLOBAL ESTIMATES OF THE IMPACT OF INCOME SUPPORT DURING THE PANDEMIC 10Estimating the pandemic-induced
increase in poverty 3
3.1 Data and the counterfactual approach to measuring poverty
To address the questions presented at the end of the last section, this paper built a cross-country
comparable dataset to estimate the potential magnitude of the increase in poverty headcount rates
resulting from the economic shock induced by the COVID-19 pandemic. To do so, the analysis exploited
the latest version of the World Bank’s online dataset of harmonized household income and consumption
surveys, which is the main data source to report comparable indicators of monetary-based poverty at the
regional and global levels (Arayavechkit et al., 2021).7 The user of this dataset cannot observe per capita
income or consumption at the household level, but rather can retrieve the distributions of those indicators
for each country and year (see, e.g., Dykstra, Dykstra and Sandefur, 2014) using an algorithm applied to
the dataset’s application programming interface (Castañeda Aguilar et al., 2019; Zhao, 2019).8
Specifically, the analysis focused on the most recent household surveys for 160 countries containing about
96.5 percent of the world’s population in 2019–2020.9 To retrieve each country’s distribution, the algorithm
computed the cumulative share of the population with per capita income or consumption below an array
of poverty lines that change in value every $0.10 a day per person (2011 PPP),10 starting from $0.10 up to
a maximum value that covers 99.9 percent of the population. From these cumulative shares, individuals
within each $0.10-bin were isolated and then assigned the middle value of their bin as their daily amount of
per capita income or consumption. That is, for those individuals located within the interval [$0, $0.10], each
one holds $0.05; for those within the interval [$0.10, $0.20], each one holds $0.15, and so on. Since not
all household surveys were collected in a year that is common to all 160 countries, a distribution-neutral
extrapolation of per capita income or consumption, while adjusting for population growth, was performed
between each distribution’s actual year and the year 2019, just before the start of the pandemic, in those
countries where data collection occurred before this year.
The extrapolation follows the approach of Prydz et al. (2019),11 in which each value of the distribution is
multiplied by a factor
+1
( )
that represents the annual per capita growth rate between the years and + 1 at
constant prices of two potential indicators from national accounts: household final consumption expenditure
per capita (HFCE) and gross domestic product (GDP) per capita. Notice that applying the same annual growth
rate to each value of the country’s distribution changes its mean value only, while holding its shape constant;
i.e., there are no changes in income or consumption inequality. As noted in Prydz et al. (2019), HFCE is
conceptually closest to the households’ economic activity captured by surveys and, hence, it is adopted
as the preferred source for extrapolation in all countries with the available indicator. In countries where
HFCE is scarce or not available, mainly in Sub-Saharan Africa, the extrapolation uses the annual growth
rate of GDP per capita. To verify the quality and consistency of this exercise, Figure A1 in the Appendix plots
the extrapolated means in each country’s retrieved distribution against the corresponding survey means
extrapolated by the World Bank, suggesting a virtually perfect match between the two exercises.
7
PovcalNet March 2021 global poverty update. Household income or consumption surveys are collected on a country-by-country basis and tend to
differ in key methodological aspects as well as in the criteria for open access. The World Bank has led the task of homogenizing national surveys
for consistent and comparable cross-country analyses on monetary-based poverty.
8
The code, written in the R software, is available from the authors upon request.
9
The average and median years among these surveys are 2015 and 2017, respectively. In the dataset, 114 surveys covering 70 percent of the
population are for the period 2015-2019; 37 surveys covering 29 percent of the population are for the period 2010-2014, and the remaining 9 surveys
covering 1 percent of the population are for before 2010. See the Appendix for further details and the list of countries included in the analysis.
10
From here onward and unless otherwise stated, all monetary figures are expressed in international dollars adjusted by purchasing power parity at
2011 prices (2011 PPP).
11
See also World Bank (2018a), Appendix A, and World Bank (2020), Chapter 1. The latter presents specific details on the extrapolation of per capita
consumption in India, as captured by the latest available survey from 2011. This country is included in the analysis of this paper.
MITIGATING POVERTY: GLOBAL ESTIMATES OF THE IMPACT OF INCOME SUPPORT DURING THE PANDEMIC 11By pooling together the 160 distributions lined up to 2019, poverty headcount rates can be estimated
globally and by groups of countries (Table 1) simply by comparing the monetary values associated with
each bin with typical international thresholds, using the size of the population within each bin as weights.
In particular, an individual is identified as poor if her daily per capita income or consumption is below the
following poverty lines per person: $1.90 a day, equivalent to the median value of the national poverty
lines among low-income countries (LIC) and used for global estimates and comparisons of extreme poverty,
and $3.20 and $5.50 a day, or the median values of the national poverty lines among, respectively, lower-
middle-income (LMIC) and upper-middle-income countries (UMIC) (for further details on these lines, see
Jolliffe and Prydz, 2016). Additionally, the analysis identifies those people living below a vulnerability
threshold of $13 a day per person, which is associated with a low probability, 10 percent or less, to fall into
poverty at the $5.50 poverty line.12
Table 1. Number of countries in the dataset and their combined population by aggregates
GROUP COUNTRIES’ DISTRIBUTIONS POPULATION 2019 (MILLION)
Advanced economies 32 1,020.1
Developing countries 128 6,304.7
East Asia and Pacific (EAP) 19 2,031.0
Europe and Central Asia (ECA) 24 466.1
Latin America and the Caribbean (LAC) 23 591.6
Middle East and North Africa (MNA) 11 362.0
South Asia (SAS) 7 1,779.9
Sub-Saharan Africa (SSA) 44 1,074.1
Income group
Low-income (LIC) 23 561.2
Lower-middle-income (LMIC) 49 2,868.3
Upper-middle-income (UMIC) 46 2,775.6
High-income /a
(HIC) 42 1,119.7
By welfare indicator
Per capita consumption 99 5,653.0
Per capita income 61 1,671.8
Total in dataset 160 7,324.9
World’s total (countries and territories) 217 7,592.0
Total in dataset (% of world’s total) 74% 96.5%
Source: Authors’ elaboration based on World Bank’s PovcalNet (March 2021 global poverty update) for the distributions of per capita income or consumption
and World Development Indicators (May 2021 update) for the world’s total.
Notes: /a Includes the following 10 countries not classified as advanced economies: Chile, Croatia, Hungary, Mauritius, Panama, Poland, Romania, Seychelles,
Trinidad and Tobago, and Uruguay.
To capture the potential effect of the pandemic on poverty in 2020, the analysis implemented the
counterfactual approach used in Mahler et al. (2020a, 2020b) and Lakner et al. (2020a, 2021), which
involves projecting forward the 160 lined up welfare distributions under two different scenarios. The first
scenario uses the country-specific forecasts, as of October 2019, of GDP per capita growth that would have
prevailed in 2020 in the absence of the pandemic (IMF, 2019), while the second uses the corresponding
forecasts, as of April 2021, after taking into account the economic contraction (IMF, 2021b). In the two
scenarios, the analysis followed the standard practice in the above studies that only 85 percent of the
12
This threshold of $13 a day per person is the updated value (2011 PPP) of the cut-off of $10 a day per person (2005 PPP) identified by Lopez-Calva
and Ortiz-Juarez (2014) as the dividing line between vulnerability to poverty and economic security in three Latin American countries (Chile, Mexico
and Peru) and is consistent with the value estimated for countries in Europe and Central Asia by Bussolo et al. (2018).
MITIGATING POVERTY: GLOBAL ESTIMATES OF THE IMPACT OF INCOME SUPPORT DURING THE PANDEMIC 12growth in national accounts is passed through to household income or consumption vectors (see Lakner
et al., 2020b for further details on the estimation of this value). Therefore, the 160 distributions lined up to
2019 were projected for 2020 at 0.85 times the growth rate in GDP per capita between 2019 and 2020,
accounting for the demographic change between both years and assuming, as before, no changes in
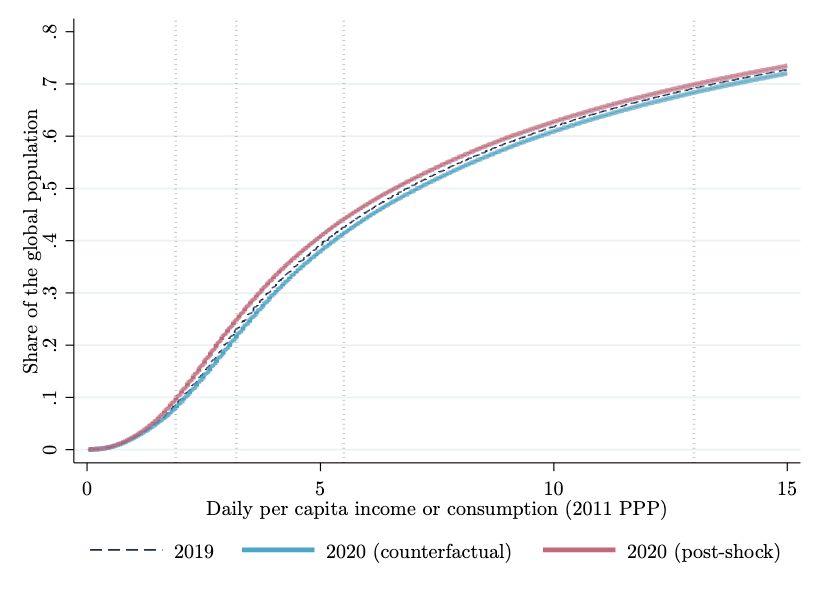
inequality. The analysis has thus produced three per capita welfare distributions: 2019 (lined up) and 2020
with and without the pandemic-induced economic shock (see Figure A2 in the Appendix).
3.2 Immediate increases in poverty and welfare losses
Following the counterfactual approach, the increase in poverty that may be attributable to the pandemic-
induced shock is given by the difference between the two welfare distributions in 2020. Figure 3 shows that
the number of people falling into poverty reaches 117 million at the $1.90-a-day poverty line, 206 million at
$3.20 a day, and 199 million at $5.50 a day,13 whereas the increase in the number of those falling under
the vulnerability threshold reaches 110 million. The total increase can be broken down into those people
who were expected to leave poverty or move above the vulnerability line between 2019 and 2020 had the
pandemic not occurred and those falling below each threshold between 2019 and 2020 after accounting
for the shock. The main finding is that, had the pre-pandemic trends continued, the number of people in
poverty was expected to reduce in 2020 by between 39 million and 65 million people, depending on the
poverty line.
Figure 3. Increases in global poverty (million people), 2020
250
206
199
200
150
141
117 147
110
100
78
103
50
65
52
39
0
$1.90 $3.20 $5.50 $13
Daily poverty and vulnerability thresholds, per person (2011 PPP)
Pandemic-induced Expected to move above each threshold in the absence of shock
Source: Authors’ calculations.
Notes: The breakdown of the number of people falling into poverty is inspired by Figure 1 in Lakner et al. (2021).
13
These results are consistent in orders of magnitude with those reported in Lakner et al. (2021), who estimate an increase of at least 119 million at
$1.90 a day, 228 million at $3.20 a day, and 201 million at $5.50 a day. The differences between the two sets of estimates may be attributable
to i) the source of GDP per capita growth rates to project the dataset to 2020, with and without the shock (Lakner et al. use the Global Economic
Prospects of January 2020 and 2021, whereas this paper relies on the IMF’s World Economic Outlook of October 2019 and April 2021); ii) the value
of individuals’ per capita welfare, which, in this paper, corresponds to the middle value of each $0.10-bin; and iii) the number of countries or territories
in the dataset (the analysis in this paper excluded Guinea-Bissau, Nauru, Somalia, Suriname, Taiwan, United Arab Emirates and Syrian Arab
Republic, either because it was not possible to retrieve the welfare distributions or because no data was found to perform the required projections
to 2020 for those countries).
MITIGATING POVERTY: GLOBAL ESTIMATES OF THE IMPACT OF INCOME SUPPORT DURING THE PANDEMIC 13The estimates reveal that most of the increase in the number of poor people is accrued by LIC and LMIC
and mainly driven by South Asia, which emerges as the hardest hit region by any poverty standard. Figure
4 shows that, of the 117 million people pushed by the pandemic into extreme poverty, 106 million (91
percent) live in LIC and LMIC, with 70 million (60 percent) alone living in South Asia. For higher poverty
lines, LIC and LMIC concentrate the equivalent of 72–87 percent of the global increase, whereas South
Asia accounts for 54–66 percent. Another revealing finding is that, had the economic shock induced by
the pandemic not occurred, these groups of countries comprise most of the total number of people that
was expected to move out of poverty at $1.90 and $3.20 a day and about half of those expected to leave
poverty at the standard of $5.50 a day.
Figure 4. Increases in poverty in LIC, LMIC, and South Asia (million people), 2020
a. Increases among LIC and LMIC b. Increases within South Asia
200 200
179
180 180
160 160
143
137
140 140
120 106 120 107
127
100 100
85
80 121 80 70
70 74
60 60
34
40 40
51 51
20 36 20 36 32
22
0 0
$1.90 $3.20 $5.50 $1.90 $3.20 $5.50
Daily poverty lines, per person (2011 PPP)
Pandemic-induced Expected to move above each threshold in the absence of shock
Source: Authors’ calculations.
Notes: The breakdown of the number of people falling into poverty is inspired by Figure 1 in Lakner et al. (2021). LIC = low-income; LMIC = lower-middle-in-
come. Due to rounding, some totals may not correspond with the sum of the separate figures.
The welfare losses induced by the economic contraction are sizeable and disproportionate among the
poorest countries in the world. After examining the groups of people comprised by those already living
below the poverty lines and those who fell into poverty after the shock, we find the estimates reveal that
the short-term loss of per capita income or consumption could have reached the equivalent of $2.2 billion
per month among those below the $1.90-a-day poverty line and $11–27 billion per month among those
living on less than $3.20 and $5.50 a day, with LIC and LMIC accounting for between 84 and 94 percent
of the total welfare loss, depending on the poverty line (Figure 5). Among those identified as living below
the $13-a-day threshold globally, the welfare loss could have reached a staggering $61 billion per month,
with almost two-thirds being accounted for by LMIC. In per capita terms, the monthly loss among those in
extreme poverty reached $3.2, on average, whereas among those in poverty at $3.20 and $5.50 a day,
it reached an average of $5 and $7.5, respectively, and among those below the vulnerability threshold it
reached $12.6.
MITIGATING POVERTY: GLOBAL ESTIMATES OF THE IMPACT OF INCOME SUPPORT DURING THE PANDEMIC 14Figure 5. Monthly welfare losses among those living below each threshold after the shock by income group
($billion, 2011 PPP), 2020
$70
$60.9
$60
$50 $20,8
$40
$30 $27.4
$20 $36,3
$11.0
$21,4
$10
$2.2 $9,0
$-
$1,90 $3,20 $5,50 $13
Daily poverty and vulnerability thresholds, (2011 PPP)
LIC LMIC UMIC HIC
Source: Authors’ calculations.
Notes: LIC = low-income; LMIC = lower-middle-income; UMIC = upper-middle-income; HIC = high-income.
It is hard to tell yet for how long these welfare losses have persisted, whether they have caused assets
depletion leading households to acute states of material deprivation, or whether the increases in global
poverty have been rather transitory. Evidence from previous crises, however, suggests that the loss of
incomes is especially hard during the shock and tends to persist with a low recovery well beyond the end
of the crisis (e.g., Davis and von Wachter, 2011). More recent estimates from telephone surveys collected
from April to June 2020 across households in nine LMIC suggest that the drop in living standards persisted
for at least three months after the start of the pandemic and, crucially, that households’ coping strategies
and even some government assistance proved insufficient to compensate for the losses (Egger et al., 2021).
It is also unclear how the contraction in income was allocated across households, as this depends on
their relative position in the distribution—and, perhaps, this will never be known with certainty, as the
collection of robust survey data was severely hampered in most countries during 2020. Yet, given the
interaction between pre-existing conditions of inequality and exclusion with stringent lockdowns, the
closure of non-essential service sector activities and reduced mobility in most developing countries,
there is no harm in presuming that the contraction in incomes may have hit harder low- and middle-
skill workers, women and the informally employed (see, e.g., ILO 2020, 2021; IMF, 2021a), who are
usually found towards the bottom of the distribution. While this paper acknowledges that the assumption
of a distribution-neutral economic contraction is highly uncertain, with no more consistent information
available, the previous estimates of the increase in global poverty are used as the baseline for the
empirical analysis conducted in the next sections.
MITIGATING POVERTY: GLOBAL ESTIMATES OF THE IMPACT OF INCOME SUPPORT DURING THE PANDEMIC 15Box 1. A hypothetical regressive contraction
For illustrative purposes, Figure B1 presents the results of a hypothetical exercise of the increase in
poverty by simulating an additional 60 percent hit among those people at the bottom 60 percent
of the distribution, which comprises a large share of those living either in poverty or at high risk of it
across developing countries (see Figure 6 below)—with a proportional adjustment among the top 40
percent, thus making the economy-wide contraction remain unchanged while allowing for inequality
to increase slightly.14 The results suggest that this regressive contraction could increase the number of
people in poverty at $1.90 and $3.20 a day by 168 million and 305 million, respectively, which implies
an additional 51–99 million relative to the distribution-neutral contraction (see Figure 3 above). Notice
that the global increase at higher thresholds is less pronounced than in the baseline, which is driven by
the proportionally less severe contraction for the top 40 percent that would benefit UMIC in particular.
Figure B1. Increases in global poverty and vulnerability in a hypothetical scenario of a regressive
economic contraction (million people), 2020
350
305
300
250
200
168
145
150
96
100
50
0
$1.90 $3.20 $5.50 $13
Daily poverty and vulnerability thresholds, per person (2011 PPP)
Source: Authors’ calculations.
14
For instance, instead of assuming that a contraction of, say, 2 percent passes through homogeneously to all households as in the distribution-neutral
scenario, the additional hit will lead such contraction to reach 3.2 percent among the bottom 60 percent, but only 0.2 percent among the top 40
percent. The adjustment excludes those 13 countries that recorded positive rates of GDP per capita in 2020: Bangladesh, China, Egypt (Arab
Republic of), Ethiopia, Guinea, Guyana, Iran (Islamic Republic of), Ireland, Myanmar, Tajikistan, Turkey, Tuvalu and Vietnam. This hypothetical
regressive contraction would imply an increase in the global Gini coefficient of about 0.48 percent, relative to the distribution-neutral case.
MITIGATING POVERTY: GLOBAL ESTIMATES OF THE IMPACT OF INCOME SUPPORT DURING THE PANDEMIC 16Estimating the poverty-mitigating effect of temporary basic incomes 4 4.1. The counterfactual case As noted in Section 2, even though the world has witnessed a massive response in emergency social protection and assistance since the start of the pandemic, the lion’s share has been accounted for by high- income countries, which have invested a per capita amount in social assistance that is more than 20 times larger, on average, than the amount spent by developing countries. Not all developing countries, which account for 99–100 percent of the increase in poverty depending on the poverty line, were able to either deliver cash support or to provide it for an extended period, considering the duration of the crisis, while others were able to roll out only in-kind assistance or waivers on utility bills. The pressing question is: Had developing countries implemented schemes of temporary basic incomes (TBI), what could have been the magnitude of the mitigation effect on poverty-increase and its fiscal cost? In a paper released four months into the pandemic, Gray Molina and Ortiz-Juarez (2020) discussed the implementation challenges and costs of TBI schemes that may have had the potential to benefit up to 2.8 billion people based on varying scenarios of per capita transfers, including top-ups up to a minimum income threshold and even a share of countries’ median income. While the authors argued for the affordability of some of those schemes, depending on the duration of the assistance and each country’s living standards, the progression of the pandemic would have eventually exhausted health systems and severely limited fiscal space in some contexts, making the delivery of relatively generous cash support schemes prohibitive, especially in poorer and populous countries. More than one year after the outbreak of COVID-19, instead of simulating the poverty-mitigating effect of those TBI schemes, the analysis in this subsection focuses on schemes whose total cost is equivalent to a portion of GDP that is homogeneous across countries and, arguably, proportional to each country’s fiscal capacity. Similar to Gray Molina and Ortiz-Juarez (2020), it is assumed that such schemes are delivered on an individual basis, regardless of household composition. The target population for the TBI is those living below vulnerability thresholds, which change in value depending on each country’s income level. For starters, the $13-a-day threshold was originally computed in UMIC contexts (see, e.g., Lopez-Calva and Ortiz-Juarez, 2014; Bussolo et al., 2018), where poverty is typically measured with the $5.50-a-day poverty line. While such a threshold may be as informative for global comparisons as measuring poverty with the $1.90-a-day poverty line even in high-income countries (HIC), it may be very demanding in both LIC and LMIC for targeting purposes. In some countries of the latter group, where the typical poverty line equals $3.20 a day, a recent estimate suggests that $5.50 a day is associated with a low vulnerability to poverty (World Bank, 2018b), which is adopted in this paper as the threshold among all LMIC. As for LIC, where poverty is typically measured at $1.90 a day and with no known information of an associated vulnerability threshold, it is simply assumed that those at high risk of poverty at this level are those living below the next international poverty line, i.e., $3.20 a day. Figure 6 shows the percentages and number of people living below such thresholds in 2019 by income group, which reach 61–71 percent and a combined population of about 4.1 billion people. MITIGATING POVERTY: GLOBAL ESTIMATES OF THE IMPACT OF INCOME SUPPORT DURING THE PANDEMIC 17
Figure 6. Population living below context-adjusted vulnerability lines, 2019

                                 80                                                                                                                               2.500
                                                         70,0                                    71,1
                                 70
                                                                                                                                         61,5                     2.000
 Percentages of the population

                                 60                                                            2.038,8

                                 50                                                                                                     1.708,0

                                                                                                                                                                            Million people
                                                                                                                                                                  1.500

                                 40

                                                                                                                                                                  1.000
                                 30

                                 20
                                                                                                                                                                  500
                                 10
                                                        393,1

                                 0                                                                                                                                0
                                                         LIC                                    LMIC                                     UMIC
Source: Authors’ calculations.
Notes: The vulnerability threshold per day, per person, used among LIC equals $3.20, among LMIC equals $5.50 and among UMIC equals $13. The latter
group includes the following 10 developing countries classified as HIC: Chile, Croatia, Hungary, Mauritius, Panama, Poland, Romania, Seychelles, Trinidad
and Tobago, Uruguay. LIC = low-income; LMIC = lower-middle-income; UMIC = upper-middle-income.

In all the simulated schemes, the monthly costs of TBI are derived under the assumption that all developing
countries deliver cash support for at least six months, backed by the above evidence of welfare loss persistence
and slow recovery, with no TBI schemes implemented in advanced economies. The focus on developing
countries is intended to capture the magnitude of the mitigation of poverty increases driven by these countries
only, given the low participation of advanced economies in global poverty rates: less than 0.1 percent at $1.90
and $3.20 a day, and 0.8 percent at $5.50 a day. A first scheme assumes that each developing country has
invested 0.10 percent of its 2019 GDP (2011 PPP) and spread this investment over six months, which is equivalent
to monthly spending of 0.017 percent of the annual GDP, or $11.6 billion globally—enough to compensate for
the monthly loss of $11 billion among those living below $3.20 a day in 2020 (see Figure 5 above). Relative to
the increase in poverty presented in Figure 3 above, this investment could have prevented 19 million people
from falling into extreme poverty at $1.90 a day, about 33–34 million from falling into poverty at either $3.20
or $5.50 a day, and 10 million from falling below the $13-a-day threshold (Figure 7).

Figure 7. Poverty increases and mitigation effect had developing countries delivered a monthly TBI to 4.1
billion people equivalent to 0.017 percent of their GDP, 2020

                                              a. Increases in poverty (million people)                                    b. Mitigation effect (million people)
200                                                                                                       0
 180                                                   173
                                                                       165                                -5
 160
                                                                                                         -10
 140                                                                                                                                                                  -10
 120                                                                                                     -15
                                       97                                                100
 100                                                                                                     -20      -19
     80
                                                                                                         -25
     60
                                                                                                         -30
      40
          20                                                                                             -35                      -33             -34
                 0                                                                                       -40
                                      $1,90           $3,20           $5,50              $13                      $1,90           $3,20           $5,50               $13
                            Daily poverty and vulnerability thresholds, per person (2011 PPP)            Daily poverty and vulnerability thresholds, per person (2011 PPP)
Source: Authors’ calculations.
Notes: The figures in panel a correspond to the increases in poverty after accounting for the pandemic-induced shock and the delivery of a monthly TBI equivalent to
0.017 percent of developing countries’ GDP ($11.6 billion)—or 0.10 percent of GDP ($69.8 billion) over a period of six months. The figures in panel b are the corresponding
differences between the increases in panel a and those presented in Figure 3. Due to rounding, some totals may not correspond with the sum of the separate figures.

MITIGATING POVERTY: GLOBAL ESTIMATES OF THE IMPACT OF INCOME SUPPORT DURING THE PANDEMIC                                                                                             18
A second scheme assumes that government investment amounts to 0.30 percent of developing countries’
GDP spread over six months, equivalent to 0.05 percent of GDP or $34.9 billion per month, which seems
enough to compensate for the monthly loss of $27 billion among the global poor at $5.50 a day (see
Figure 5 above). Having rolled out this TBI scheme, global extreme poverty would have increased by
almost 31 million after the pandemic-induced shock instead of the 117 million reported previously, which
implies that the scheme could have potentially prevented 86 million people from falling into poverty
(Figure 8). Although the increase in global poverty at $3.20 and $5.50 a day would still be sizeable (80
million and 108 million, respectively), the magnitude of the mitigated increase in poverty at these levels
could have reached 126 million and 91 million people, respectively, relative to the scenario with no TBI in
place. Finally, the number of people entering the group of those below $13 a day would have reduced by
43 million, in comparison to the scenario with no TBI in place.
Figure 8. Poverty increases and mitigation effect had developing countries delivered a monthly TBI to 4.1
billion people equivalent to 0.05 percent of their GDP, 2020
a. Increases in poverty (million people) b. Mitigation effect (million people)
120 0
108
100 -20
80 -40
80 -43
66 -60
60
-80
40 -86
31 -100 -91
20 -120
-126
0 -140
$1,90 $3,20 $5,50 $13 $1,90 $3,20 $5,50 $13
Daily poverty and vulnerability thresholds, per person (2011 PPP) Daily poverty and vulnerability thresholds, per person (2011 PPP)
Source: Authors’ calculations.
Notes: The figures in panel a correspond to the increases in poverty after accounting for the pandemic-induced shock and the delivery of a monthly TBI
equivalent to 0.05 percent of developing countries’ GDP ($34.9 billion)—or 0.30 percent of GDP ($209.3 billion) over a period of six months. The figures in
panel b are the corresponding differences between the increases in panel a and those presented in Figure 3. Due to rounding, some totals may not
correspond with the sum of the separate figures.
A third and final scheme assumes that all developing countries have delivered a TBI equivalent to 0.5
percent of their GDP spread over six months, equivalent to monthly spending of 0.083 percent of GDP or
$58.1 billion—almost enough to compensate for the monthly loss of $60 billion among those living with
less than $13 globally (see Figure 5 above). Figure 9 shows that this magnitude of investment could have
mitigated almost entirely the increases in global poverty at the lowest poverty lines, at least temporarily,
despite the economic contraction. Moreover, this TBI scheme could have prevented 169 million people
from falling into poverty at $5.50 a day.
MITIGATING POVERTY: GLOBAL ESTIMATES OF THE IMPACT OF INCOME SUPPORT DURING THE PANDEMIC 19You can also read