Poverty, the Middle Class, and Income Distribution amid COVID-19
←
→
Page content transcription
If your browser does not render page correctly, please read the page content below
AUGUST 2020

 DISCUSSION PAPER SERIES NO. 2020-22

 Poverty, the Middle Class, and Income Distribution
 amid COVID-19

 Jose Ramon G. Albert, Michael Ralph M. Abrigo,
 Francis Mark A. Quimba, and Jana Flor V. Vizmanos

The PIDS Discussion Paper Series constitutes studies that are preliminary and subject to further revisions. They are being circulated in a limited number of copies only for
purposes of soliciting comments and suggestions for further refinements. The studies under the Series are unedited and unreviewed. The views and opinions expressed are
those of the author(s) and do not necessarily reflect those of the Institute. Not for quotation without permission from the author(s) and the Institute.

CONTACT US:
RESEARCH INFORMATION DEPARTMENT
Philippine Institute for Development Studies

18th Floor, Three Cyberpod Centris - North Tower publications@mail.pids.gov.ph
 https://www.pids.gov.ph
EDSA corner Quezon Avenue, Quezon City, Philippines (+632) 8877-4000
Poverty, the Middle Class, and Income Distribution
 amid COVID-19

 Jose Ramon G. Albert
 Michael Ralph M. Abrigo,
 Francis Mark A. Quimba
 Jana Flor V. Vizmanos

PHILIPPINE INSTITUTE FOR DEVELOPMENT STUDIES

 August 2020
 (Revised September 2020)
Abstract

Often development focus has been on measuring and analyzing poverty in order to reduce
poverty. While the poor face future prospects of being perpetually trapped in poverty, the
nonpoor also are vulnerable to poverty. Vulnerability has been particularly recognized in the
wake of the impact of the novel coronavirus (COVID-19) that is likely to yield declines in
incomes because of reduced economic activities. In this study, we provide an updated profile
of the poor in the Philippines, as well as various segments of the income distribution, based on
the 2018 Family Income and Expenditure Survey. We follow the typology of the low, middle,
and high income classes proposed in previous research reports, and simulate the likely effects
of contractions in per capita income on poverty and the entire income distribution amid the
coronavirus pandemic. In estimating the impact of COVID-19 on poverty, and the income
distribution, data are not available at this time. The study makes use of simulation scenarios
and assumptions. We find that in a (medium case) scenario of declines of incomes by 10 percent
across the entire income distribution, the number of poor Filipinos can increase by 5.5 million,
but with the emergency financial subsidies (i.e., the social amelioration program and the small
business wage subsidy in. place) that targeted 90 percent of households, the worsening of
poverty conditions has been managed so that only 1.5 million would fall into poverty, i.e., 4
million less than expected number of Filipinos falling into poverty. These simulation results
are consistent with nowcasting exercises of IFPRI and the World Bank on poverty amid
COVID-19 that assume a global GDP contraction of 3 percent. Further, low-income classes
would, on average, transition only a quarter year more than the baseline of 21.25 years for this
(medium-case) scenario if after the pandemic (and an assumed V-shaped economic recovery),
their incomes would have a constant annual growth of 2.5 percent. However, under tougher
conditions of income contractions of 20 percent with social protection cash assistance, we
simulate that the average time for low income Filipinos to move up into middle income class
would increase by three years from baseline figures. Under a protracted recovery, we would
thus expect a longer period to transition. These results, though relying on simulation scenarios
and simplistic assumptions, are helpful in illustrating the importance of government efforts to
provide social protection not only for the poor but also for segments of the income distribution
that could likely to fall into poverty given income contractions from reduced economic
activities during this COVID-19 pandemic. The study also discusses various policy and data
issues, recommending that the Philippine Statistics Authority start reviewing its official
poverty measurement system, including the current use of income over expenditure as the
poverty metric, as well as the poverty line setting methodology given the changes in income
and expenditure patterns in the past decade (prior to the onset of COVID-19) that improved
living conditions.

Keywords: poor, middle class, inequality, income distribution, novel corona virus, simulation

 1
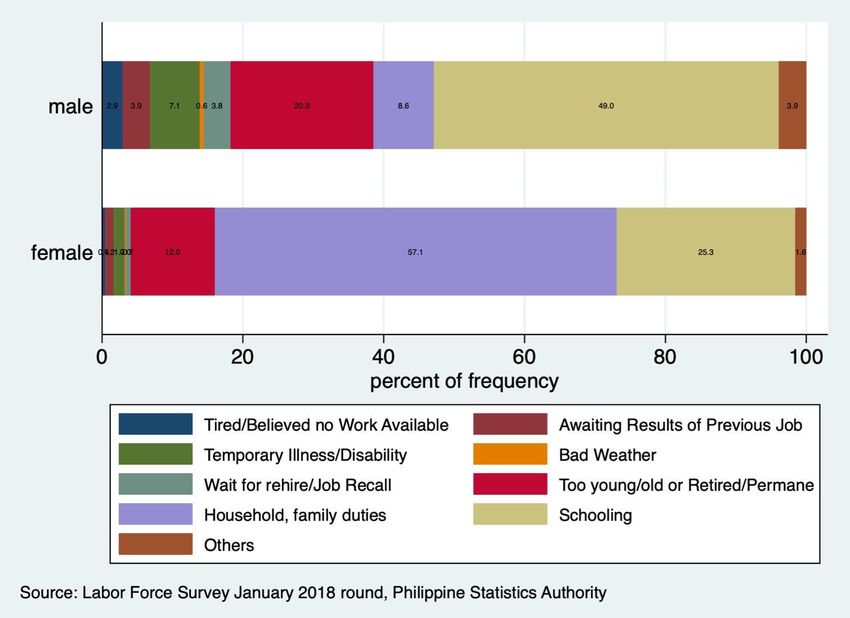
Table of Contents

1. Introduction .............................................................................................. 4

2. The Economic Impact of COVID-19 ........................................................ 5

3. Profile of Poverty and the Middle Class ............................................... 11

 3.1. Official Poverty Measurement System ..................................................... 12

 3.2. Poverty Profile .......................................................................................... 17

 3.3. The Middle Class ..................................................................................... 21

4. Poverty and the Middle Class in the Wake of Covid-19 ...................... 28

 4.1. What to Expect from Various Income Contraction Scenarios? ................. 29

 4.2. Is a Middle Class Society Still Attainable by 2040? .................................. 33

5. Summary of Results, Policy Implications and Ways Forward ........... 35

6. References .............................................................................................. 39

List of Boxes

Box 1. Macro-Policy Responses to COVID-19 .................................................................... 10

Box 2. Summary of Poverty Conditions across Provinces .................................................. 20

List of Tables

Table 1. GDP Growth Outlook in 2020 for ASEAN member economies ................................ 5

Table 2. Poverty Impact of 1% Global Economic Slowdown for ASEAN
 Member Economies: Percentage Increase from Baseline Values............................ 6

Table 3. Increase in Number of People in Poverty in ASEAN member economies Using
 IMF Growth Projections Resulting from COVID-19 .................................................. 7

Table 4. Poverty Headcount Rates (in %) in the Philippines using International and
 National Poverty Lines: 2010-2015........................................................................ 16

Table 5. Distribution of Population and Households (in thousands) by Poverty
 Status and by Regions in 2018 .............................................................................. 17

Table 6. Poverty Incidence, Poverty Gap, Poverty Squared Gap (in %) among
 Filipinos, by Region: 2018 ..................................................................................... 20

 2
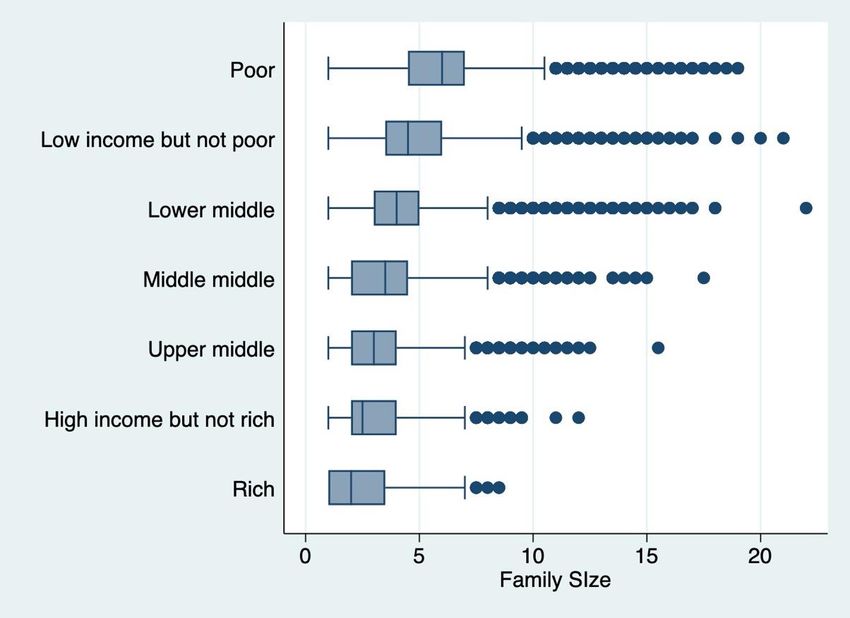
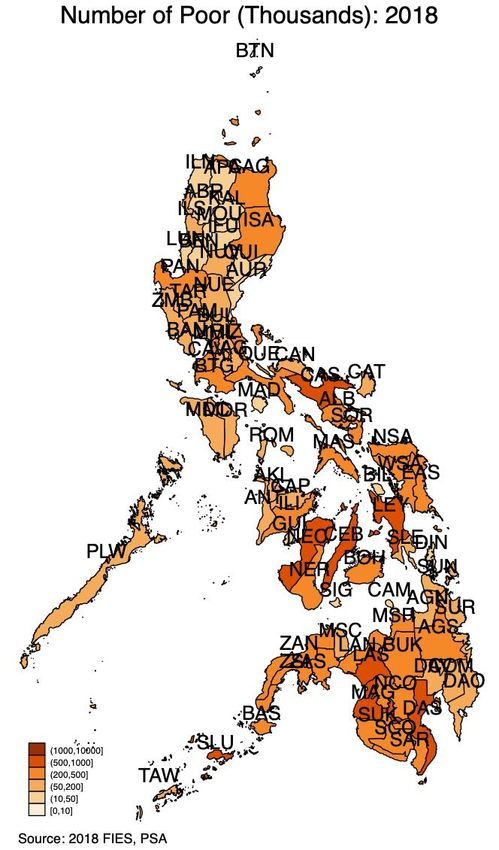
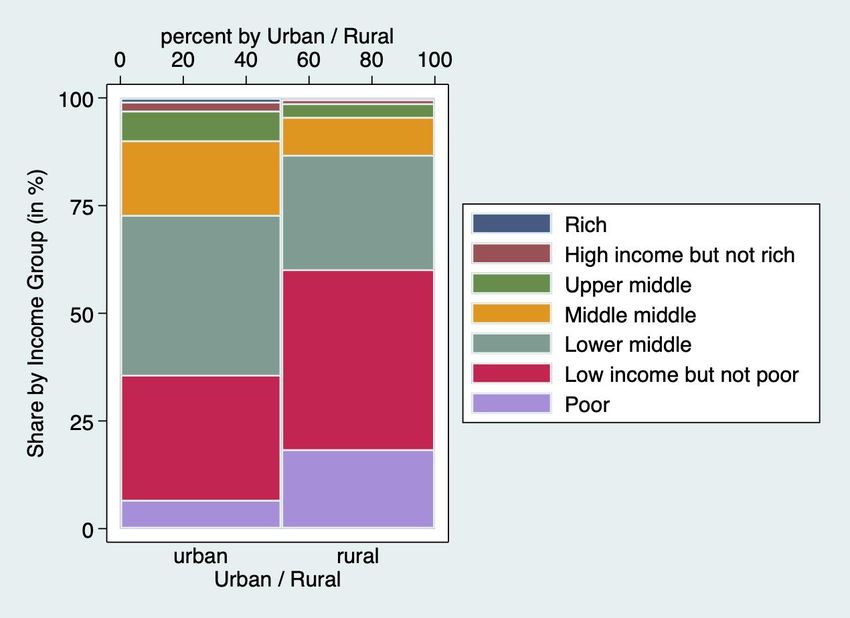
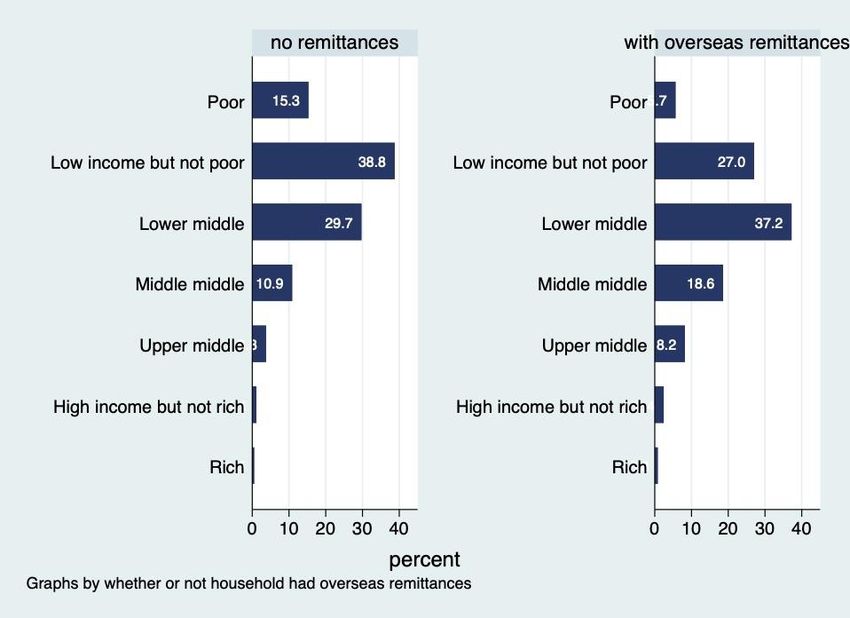
Table 7. Income Groups in the (Per Capita) Income Distribution, Income
 Thresholds and Sizes of Income Groups in 2018 .................................................. 22

Table 8. Percentage Distribution of Households Among Income Classes by
 Region in 2018 ...................................................................................................... 24

Table 9. Poverty Scenarios Assuming Income Contractions and Effective
 Social Protection Targeting ................................................................................... 29

Table 10. Poverty Incidence Estimates by Region Assuming Various Scenarios ................ 31

Table 11. Estimates of Number of Poor Filipinos (in Millions) by Region Assuming
 Various Scenarios ............................................................................................... 32

Table 12. Estimates of Average Monthly Income (in thousand pesos) for a Family
 of Five by Income Groups Assuming Various Scenarios ..................................... 32

Table 13. Number of Years for a Typical Low- Income Person to Transition into
 Middle Class Given Constant Annual Growth in (Real) Income and
 Under Different Scenarios. .................................................................................. 33

Table 14. Poverty Elasticity Estimates for 2003-2018.......................................................... 35

List of Figures

Figure 1. Health Human Resources in the Philippines, by Sex: 1990, 2015 ......................... 9

Figure 2. Reasons for Not Joining Labor Market, by Sex: January 2018. ............................ 10

Figure 3. Poverty Across Provinces in 2018 in terms of (a) Poverty Incidence
 (in percent) and (b) Number of Poor Filipinos (in thousands). ............................... 19

Figure 4. Share of Population (%) in Urban and Rural Areas across Income Classes ......... 23

Figure 5. Share of Income Groups by Urban and Rural Areas (%): 2018. ........................... 24

Figure 6. Distribution of Family Size, by Income Group: 2018 ............................................. 25

Figure 7. Reasons for Not Joining Labor Market, by Sex: January 2018. ............................ 26

Figure 8. Households without and with overseas remittances, by Income Group: 2018. ..... 27

Figure 9. Share (in %) of Food, Alcohol, Tobacco, Education, Health, Transportation
 Expenditures to Total Household Expenditure, by Income Classes: 2018 ............ 28

List of Annex Tables

Table A-1. Distribution of Filipino Population (in Thousands) by Province and
 by Income Groups: 2018 ............................................................................ 45

Table A-2. Distribution of Filipino Households (in Thousands) by Province and
 by Income Groups: 2018 ............................................................................ 51

 3
Poverty, the middle class, and income distribution amid COVID-19

 Jose Ramon G. Albert, Michael Ralph M. Abrigo,
 Francis Mark A. Quimba and Jana Flor V. Vizmanos *

1. Introduction

Last December 2019. the Philippine Statistics Authority (PSA) released official estimates of
poverty based on the results of the 2018 Family Income and Expenditure Survey (FIES).
According to the PSA (2019a), the poverty incidence, i.e., the proportion of people in poverty,
across the country stands at 16.6 percent as of 2018. This estimate is much lower than the
corresponding (revised) estimate of 23.3 percent poor Filipinos in 2015. Furthermore, the
subsistence poverty rate, representing the proportion of Filipinos in extreme poverty who
belong to households with (per capita) incomes lower than food needs, is estimated at 5.2
percent in 2018, nearly half of the 9.1 percent extremely poor Filipinos in 2015.

Improved welfare conditions have led to an expanding middle class, although a larger share of
the middle class still belongs to the lower part of the middle-income bracket (see Albert et al.
2018a for typology on the income distribution, including a definition of the middle class). The
carbon consumption patterns of Filipinos, especially those in the middle class, are more driven
by increasing wealth than by environmental concern and knowledge or any other factors
(Never and Albert 2020). Behavioral insights are vastly needed to identify particular entry
points for changing current or avoiding future carbon-intensive consumption patterns.

There are concerns that the country’s gains in improving welfare conditions during the period
2015 to 2018 can get easily wiped out in the wake of the novel coronavirus (COVID-19)
pandemic. In an attempt to manage the spread of COVID-19, the government has adopted
several measures, including an enhanced Luzon-wide enhanced community quarantine (ECQ)
from March 17 to April 30. The ECQ is to be extended in Metro Manila, CALABARZON,
Central Luzon except Aurora, which is under a general community quarantine (GCQ), and
other select provinces and cities. The ECQ and GCQ, particularly travel restrictions, closures
of schools and other gathering places have resulted in a drastic slowdown in economic
activities. As a result of coronavirus-related morbidity and mortality, the inability of COVID-
19 patients with jobs to work fully effectively for at least several weeks as well as drastic
slowdown of economic activities, labor supply has been reduced. Economic losses between
276.3 billion and PHP 2.5 trillion representing about 1.5% to 13.3% of the 2019 Gross
Domestic Product (GDP), are expected largely as a result of drops in labor supply between 7.4
percent to 19.7 percent (Abrigo et al. 2020).

Regardless of when the ECQ is eventually lifted throughout the country, there is recognition
that the concerted actions meant to contain the virus have rapidly changed how we live, work
and learn, and that a new normal is emerging. This study aims to examine the limited publicly

*
 The first three authors are senior research fellows at the Philippine Institute for Development Studies (PIDS), while the last
author is a research specialist at PIDS. Views expressed are those of the authors and do not necessarily reflect the position of
the PIDS.

 4
available microdata from the 2018 FIES to look into possible scenarios on poverty and the
entire income distribution accounting for some scenarios on reduction of incomes. In the next
section, we review some literature on outlooks regarding the macro-economy and poverty. The
third section firstly describes the official poverty methodology, as well as the methods used to
profile various segments of the income distribution, especially the poor and middle-class. In
this section, we also provide empirical findings based on the 2018 FIES. The fourth section
shows simulation scenarios on income contractions as well as the effects of social protection
programs during the COVID-19. We then close this report with a summary of the findings,
policy issues and some recommendations.

2. The Economic Impact of COVID-19

Outlooks on the Philippine and world economies have been released by various international
organizations reflecting dampened prospects from prior to the onset of the virus (ADB 2020,
IMF 2020, WB 2020). For instance, the Asian Development Bank expects the Philippine
economy to grow at 2.0% in 2020 (ADB 2020), while the International Monetary Fund forecast
for GDP growth forecast is 0.6% for 2020 (IMF 2020). The World Bank, on the other hand,
projects growth in the Philippines to decline to 3.0 percent in the baseline and further expects
a negative 0.5 percent in the lower-case scenario in 2020, from 5.9 percent in 2019 (WB 2020),
given the prospects of shrinking external demand, decline in tourism revenues, and reductions
in remittances (Table 1). All these reflect much reduced expectations of the economic
performance of the Philippines, a big difference from its growth trajectory prior to the
pandemic. Even local researchers have pointed out huge losses in the economy (Abrigo et al.
2020; Habito 2020). The National Economic and Development Authority (NEDA) has thus
slashed its GDP growth projections, and is now expecting growth to fall between -0.6% and
4.3% for 2020. The NEDA has also estimated economic losses from the six-week Luzon ECQ
at 767.19 Billion PhP (equivalent to 3.85% of GDP), with CALABARZON (314.6 Billion PhP)
taking the biggest hit across regions, followed by NCR (269.2 Billion PhP) and Central Luzon
(103.8 Billion PhP). Across economic sectors, losses from retail are estimated at 97.9 Billion
PhP; Industry at 583 Billion PhP; while Agriculture at 73 million PhP. Schools are also
estimating losses ranging from a low of 55 Billion PhP to a high of 142 Billion PhP. Banks
also expect 368 Billion loan defaults.

Table 1. GDP Growth Outlook in 2020 for ASEAN member economies
 2019 Baseline Lower case
 2020 2020
 Indonesia 5.0 2.1 -3.5
 Malaysia 4.3 -0.1 -4.6
 Philippines 5.9 3.0 -0.6
 Thailand 2.4 -3.0 -5
 Viet Nam 7.0 4.9 1.5
 Cambodia 7.1 2.5 1
 Lao PDR 4.8 3.6 2.2
 Myanmar 6.3 3.0 2
 Source: World Bank (2020)

 5
The PSA (2020) has also released information on the first quarter 2020 economic performance
which suggests that GDP for 2020 has contracted by 0.2 percent. Given the likely drop in
incomes and expenditures of households as well as businesses, we would expect a worsening
of poverty conditions. Several estimates have been made on the impact of Covid-19 on poverty
incidence (using international poverty lines1), either using (i) computable general equilibrium
(CGE) model (ILO 2020; Vos et al. 2020a; Vos et al. 2020b) or assumptions regarding the
contraction of per capita household income or consumption (Sumner et al. 2020). The CGE
models estimate how supply and demand shocks, output contractions or changes in trade or
production factors feed into monetary poverty.

 • The ILO (2020), which regularly estimates the working poor (i.e. the proportion of the
 working population earning less than the international poverty lines), estimates that for
 2020, there will be between 9 and 35 million new working poor at a poverty line of
 US$3.20 per day in 2011 purchasing power parity (PPP) prices for lower middle-
 income countries across the developing world.

 • Simulations made by IFPRI (Vos et al. 2020a; 2020b) suggest that a global GDP (GDP)
 slowdown of 1 percent would increase the proportion in the population below US$1.90
 per day in 2011 PPP prices between 1.63 percent and 3.02 percent (corresponding to
 12–22 million more people in extreme poverty) depending on the transmission channel.
 For the Philippines, the increase in extreme poverty rates are expected to be between
 3.0% and 6.0% from the baseline (correspondingly to an increase in the number of
 extremely poor Filipinos between 270 to 600 thousand). (Table 2). Across the whole
 of South East Asia, the proportion below $1.90 can rise between 2.2% to 5.1%.

Table 2. Poverty Impact of 1% Global Economic Slowdown for ASEAN member economies:
Percentage Increase from Baseline Values
 ASEAN member Scenarios
 economies Labor Productivity Total Factor Trade Shock
 Shock Productivity Shock
 Indonesia 4.14 4.86 7.46
 Philippines 2.97 2.52 6.64
 Thailand 2.36 2.22 2.89
 Viet Nam 1.92 9.42 19.32
 Cambodia 3.48 5.3 19.82
 Lao PDR 2.97 2.52 6.64
 Myanmar 2.97 2.52 6.64
 ASEAN-wide 2.24 2.62 5.09

1
 To monitor extreme monetary poverty across the world, World Bank makes use of an international poverty line of $1.90 in
purchasing power parity (PPP) 2011 prices. The World Bank also makes use of other international poverty lines, such as
poverty lines for lower-middle-, upper-middle- and high-income countries respectively at $3.20 PPP, $5.50 PPP, and $21.70
PPP a day. For the Philippines, the World Bank estimates of the proportion in poverty for 2015 are 6.15 percent and 26.04
percent, respectively using $1.90 PPP and $3.20 PPP, respectively. Official estimates of poverty are at 23.3 percent for 2015,
suggesting that the national poverty lines are between the two international poverty lines of $1.90 PPP and $3.20 PPP. (See
World Bank Povcalnet http://iresearch.worldbank.org/PovcalNet/povOnDemand.aspx )

 6
ASEAN member Scenarios
 economies Labor Productivity Total Factor Trade Shock
 Shock Productivity Shock
 Worldwide 1.63 1.88 3.02
Source: Vos et al. (2020a, 2020b)

 • In its World Economic Situation and Prospects report, the United Nations (2020)
 forecasts a 3.2% reduction in global GDP this year, and using its World Economic
 Forecasting Model (WEFM) expects an estimated 34.3 million people to fall into
 extreme poverty (with incomes below $1.9 USD per person per day in 2011 PPP
 prices).

 • Sumner et al. (2020) made use of three simulation scenarios: low, medium, and high
 contractions of (a) 5, (b) 10, and (c) 20 per cent, to estimate the impact on the poverty
 headcount using the international poverty lines of US$1.90, US$3.20 and US$5.50 per
 day in 2011 PPP prices). Extreme poverty, estimated at 10.1% for a poverty line of
 $1.90, is shown to rise to 11.2% or even 15.7% at a reduction of in incomes of 5 percent
 and 20 percent, respectively. Using a higher poverty line of $3.20, the proportion in
 poverty, estimated at 25.2%, would rise to by at least 1.8 percentage points to 27.0%
 with a reduction of 5 percent in incomes (or as much as 4.8 percentage points at 33.0%).

Mahler et al. (2020) make use of the most recent data from PovcalNet and extrapolate forward
using the growth projections from the recently launched World Economic Outlook of IMF
(2020), in which global output is projected to contract by 3% in 2020, and suggest that global
poverty could increase from 8.2% in 2019 to 8.6% in 2020, or equivalent increase the counts
from 632 million people to 665 million people in poverty. Breakdown of simulations on the
impact of COVID-19 on poverty for ASEAN member economies are given below, as per e-
mail communication with these authors (Table 3).

Table 3. Increase in Number of People in Poverty in ASEAN member economies Using IMF
Growth Projections Resulting from COVID-19
 ASEAN Increase in millions of people living
 member below
 state $1.90 per $3.20 per $5.50 per
 day day day
 Cambodia 0.04 0.11 0.27
 Lao PDR 0.1 0.25 0.2
 Indonesia 1.91 5.47 6.29
 Malaysia 0 0 0.06
 Myanmar 0.05 0.82 1.85
 Philippines 0.77 2.63 2.74
 Singapore 0 0.01 0.01
 Thailand 0 0.14 1.88
 Vietnam 0.19 0.58 0.97
Source: Email communication with dmahler@worldbank.org

 7
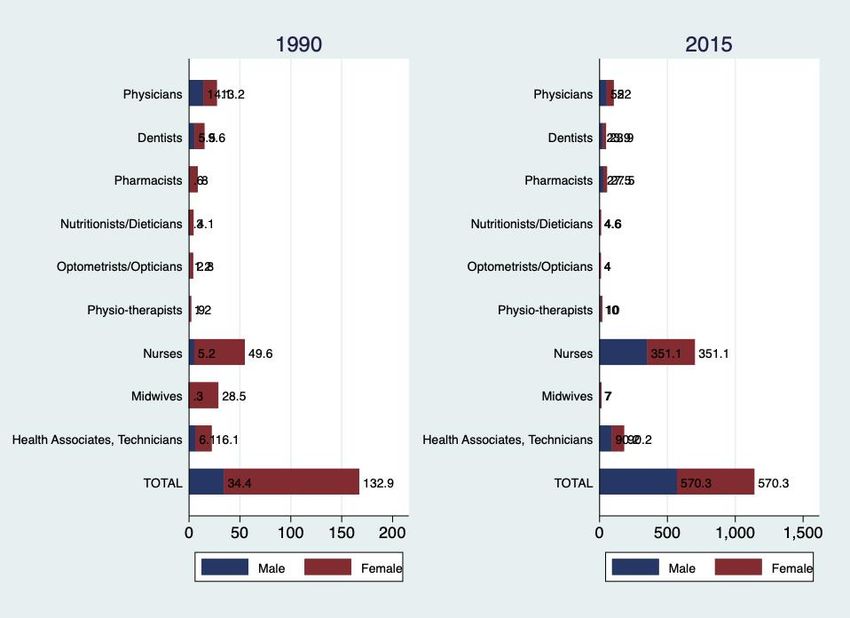
Mahler et al. (2020) also look into the robustness of their forecasts by examining what will
happen to poverty under slightly more optimistic or pessimistic scenarios (either with 1
percentage point lower or higher values than the World Economic Outlook projections (IMF
2020), or increased or decreased Gini inequality by 1% in all countries in 2020). Their
simulation shows that global poverty could range between 8.4% and 8.8%, or in other words,
the number of people pushed into extreme poverty will be roughly between 40 and 60 million.
Since estimates of IFPRI (Vos et al. 2020a; 2020b) on poverty assumed a global GDP (GDP)
slowdown of 1 percent, if we were to assume instead a GDP slowdown of 3 percent consistent
with IMF and new UN projections), we would expect an increase in the number of extremely
poor Filipinos between 810 thousand to 1.8 million, which are roughly consistent with the
results of Mahler et al. (2020).

Throughout all these estimates of poverty, we have yet to determine the impact of the pandemic
to specific groups of people, e.g., women and men. Many studies have suggested that the novel
coronavirus affects especially the elderly. Moreover, across the world, it appears that men are
hit harder by the virus than women. This is particularly true in the Philippines: as of April 7,
men outnumber women 58 to 42 among people who tested positive (Abrigo et al. 2020).
Further, men appear twice more likely to die than women from COVID-19, as among deaths,
70% are among men vs 30% for women. These empirical results appear to be on account of
traits of men that might make them more vulnerable to the pandemic — for example, having
certain medical conditions like asthma, diabetes, hypertension, chronic respiratory diseases,
because of their lifestyles, compared to women.

Further, what we do know is that prior to the onset of the virus, women and men have been
situated differently across occupations. Figure 1 illustrates that as of 2015, 72.6 % of health
professionals (73.3% if we add also other human resources) are women (Abrigo and Ortiz
2019). These figures were much higher two and a half decades prior to 2015, suggesting that
these occupations are moving more toward gender parity though the gap continues to be rather
wide. On the other hand, among workers in Science and Technology (S&T), only a quarter
(25.3%) of workers are women and often working women in the S&T sector drop out of
working in the sector much faster than women (Albert et al. 2020 TBR). In the entire
agriculture and industry sectors, men tend to dominate while in services, women do (David et
al. 2018).

 8
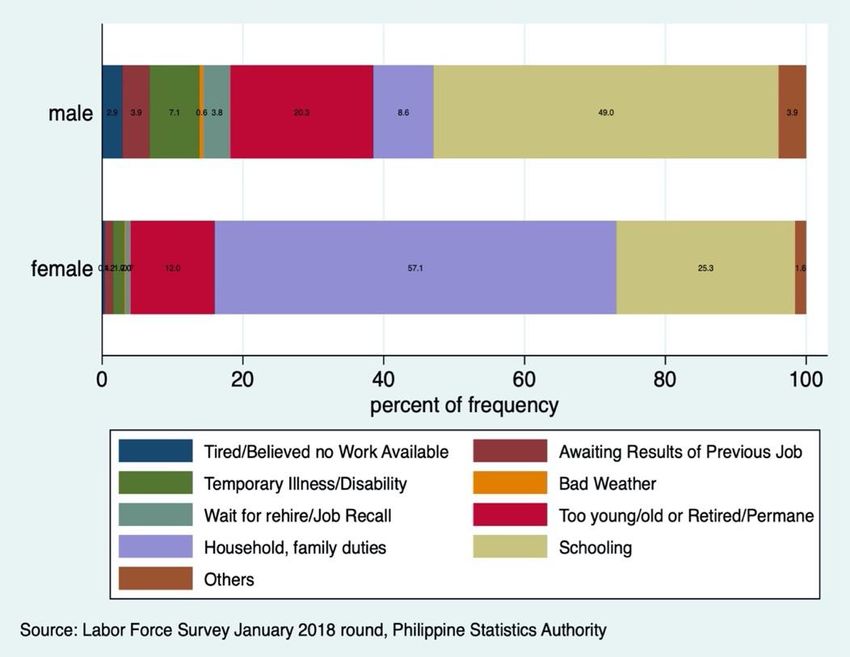
Figure 1. Health Human Resources in the Philippines, by Sex: 1990, 2015

Source: Abrigo & Ortiz (2019)

Further, as regards leadership, the country’s leaders are still dominated by men in both the
public and private sectors (David et al. 2018). As of 2016, the proportion of women in senior
and middle management positions is only about a third (32.7%). Even if more women are
getting to be visible in certain occupations, even in board rooms of the private sector, and even
become chief executives or the president of the country, the number and proportion of women
who have broken such glass ceilings is still far beyond gender parity. Cabinet secretaries have
remained largely male-dominated from 1986 to the present, even during years when we had
female presidents. The downgrade in the performance of the Philippines in the 2020 Gender
Global Gap Report is almost entirely due to the lower female representation in the cabinet,
which declined from 25% in 2017 to 10% in 2019 (WEF 2019).

The starting issue in the workplace is the barrier to even participate in the labor force.
According to data from the January 2018 Labor Force Survey (PSA 2018), the principal reason
given by about three out of five women of working age for being economically inactive is
unpaid care work, whereas for more than half of their men counterparts, “schooling” is the
primary reason for being outside the labor force (Figure 2). Thus, opportunities for women
and men to participate in the economy remain unequal, largely because the disproportionate
share of unpaid care and domestic work they undertake. Further, even when women join the
work force, a much larger share are in vulnerable jobs.

 9
Figure 2. Reasons for Not Joining Labor Market, by Sex: January 2018.

Note: Authors’ calculations.

In response to the pandemic and the vulnerabilities we face, government has adopted a three-
pronged macro policy strategy involving (i) containing the spread of the virus, (ii) providing
social protection to the poor and vulnerable; and (iii) increasing demand to boost economic
activity. Current policies are meant to mitigate demand externalities and financing constraints,
utilizing monetary and fiscal instruments, and social protection to dampen the impact of
adverse shocks to livelihood and the economy (Box 1).

 Box 1. Macro-Policy Responses to COVID-19
 Policy Strategies and Programs
 1. Contain Spread of Virus Detect, isolate-treat-reintegrate (DITR) strategy to fight
 catastrophic impact of COVID-19; P35.7 billion in expanded
 medical resources

 2. Provide Social Government largely providing people relief from sudden shock.
 Protection Local government units (LGUs) providing food packs; National
 government (NG), in cooperation with LGUs, implementing a
 P583.8 B for Social Amelioration Program (SAP) and Small
 Business Wage Subsidy (SBWS) program
 3. Re-booting and Monetary policies (reduced key policy rates and reserve
 boosting Demand requirements) and fiscal policies to soften decline in consumer
 and business spending (including P220.5 B in monetary and fiscal
 incentives)
Note: Authors’ summary

 10
All these macro policies are supported by a COVID-19 war chest amounting to P1.7 trillion—
P58.6 billion in expanded medical resources to fight the disease and ensure frontliners’ safety;
P595.6 billion in emergency support for the poor, low-wage workers, the informal sector, and
other vulnerable groups; P1.1 trillion for monetary and fiscal initiatives, including an economic
stimulus. Theoretically, shocks would yield a v-shaped trajectory on growth, but in the real
world, the coronavirus could produce a prolonged and deep recession and sharp economic
volatility either in a L, U, or W shape.

In the next section, we describe the income distribution in the Philippines, as reflected in the
2018 FIES results, and pay special attention to looking into the gaps across various income
segments in the country. This reflects essentially an update of work by Albert et al. (2018a)
on the middle-class, based on the currently available microdata pertaining to the 2018 FIES.

3. Profile of Poverty and the Middle Class

In this study, the underlying framework for describing poverty (and inequality) is a monetary
approach of the identification and measurement of poverty (and income inequality), that is the
most commonly used approach. This involves essentially views persons in poverty in monetary
terms, as those that belong to families with per capita incomes less than some poverty threshold.
The latter represents the minimum level of income per person deemed adequate for meeting
food and non-food needs. Data on total household income can be gathered by identifying all
possible income sources, e.g., incomes from salaries and wages, interests, dividends and self-
employment. Income inequality, which describes asymmetry in the distribution of income
within society is to be viewed in the context of the gaps in various statistics across various
income groups (as defined by Albert et al. 2018).

Countries have put poverty at the heart of the development agenda. In 2015, 193 member
countries of the United Nations, including the Philippines, committed to achieving the
Sustainable Development Goals (SDGs) by 2030. The agenda on the SDGs is a continuation
and expansion of the Millennium Development Goals framework to put poverty reduction and
related goals at the center of development priorities. The first goal of the SDGs, SDG1: “end
poverty in all its forms everywhere” is essentially about eradicating extreme poverty; it
involves targeting the most vulnerable to poverty, increasing basic economic resources and
social protection services, formulating pro-poor and inclusive policy frameworks, as well as
supporting communities affected by conflict and climate-related disasters. In the Philippines,
medium term national development plans have mainstreamed poverty reduction, and even
incorporated the country’s aspiration to be a predominantly middle class society by 2040,
where no one is poor (NEDA 2015; NEDA 2016). Amid the pandemic, countries have started
to reset their development priorities, and reallocate resources to deal with the pandemic, and
there are dangers that such response to the pandemic could be de-linked from the SDGs. As
earlier pointed out, this study makes use of a largely descriptive examination of available
income data from the 2018 FIES to describe poverty, the middle class and the entire income
distribution. The study also recognizes the likely reduction in incomes brought about by
COVID-19 and the attempt to reduce the contagion. We firstly, however, review some concepts
in the official poverty measurement methodology.
 11
3.1. Official Poverty Measurement System

To develop the proper policy framework and instruments for reducing poverty, countries need
a credible poverty measurement system. Essentially, official poverty measurement systems
involve three steps (UNSD 2005; Albert 2008; Haughton and Khandker 2009):

 • Defining a welfare indicator. Most countries make use of a money-metric based on
 income or consumption. In the Philippines, the PSA uses income per capita. China and
 Malaysia, aside from the Philippines, also use welfare indicators based on income. Most
 developing countries make use of consumption expenditure-based measures rather than
 income-based owing to difficulties in obtaining accurate income data, as reported
 income tends to be biased downward, especially among households relying on farming
 income and self-employment, and on income from housing services or capital gains .

 • Setting a poverty line. The typical scheme in developing countries, including the
 Philippines, for setting poverty lines involves the basic needs approach, which attempts
 to identify the cost of absolute minimum food and non-food requirements for long-term
 well-being. The details for implementing this approach, however, vary a bit across
 countries.

 • Summarizing the poverty data. All NSOs that measure poverty release poverty
 incidence estimates – i.e., the proportion of people (or households) with income per
 capita below the poverty threshold. The PSA also releases the subsistence incidence –
 i.e., the proportion of people (or households) whose incomes per capita do not even
 reach the food component of the poverty line (also known as subsistence threshold)

For its poverty measurement system, the PSA makes use of data on per capita income, i.e., the
total household income divided by the family size, sourced from the triennial FIES. In the FIES,
total household income is the aggregate of incomes from all sources, including employment,
social transfers, home production, informal support, income from rent, and the like. In other
countries, data on aggregate consumption/expenditure consist of adding up expenditures of all
items purchased from market sources and items obtained from other sources (such as gifts and
home-produced items that are consumed by the household) using imputed values at local
market prices.

The FIES has been traditionally designed to yield reliable information at the regional level,
though the design of the 2018 FIES (and subsequent rounds of the FIES) has been changed to
adopt self-weighting schemes, as well as to make use of four times than the previous sample
sizes in order to obtain more precise survey-based statistics at the provincial level. For several
years, the PSA has also released first semester poverty data based on the FIES. Further, the
PSA experimented with a release of poverty statistics sourced from another survey, the Annual
Poverty Indicator Survey (APIS), with the use of many income questions from the FIES
module. But owing to criticisms that income data from APIS and FIES are fundamentally
different (Albert et al. 2015), this practice, including comparing APIS-sourced poverty data
with first semester FIES-sourced poverty, appears to have been discontinued.

 12
Is income or expenditure a better welfare indicator? As pointed out in Albert (2008), poverty
analysts generally view consumption-based measures of poverty as providing a more adequate
picture of wellbeing than those based on income, especially in low- or middle-income
countries. Income typically fluctuates from year to year and changes across one’s lifetime
whereas consumption remains relatively unchanging. Further, consumption/expenditure is
viewed to be more accurately measured than income: survey respondents may be more able as
well as willing to remember what they spent rather than what they earned, especially when
their memories are jogged with more detailed questions. In addition, reported income is likely
to be underreported due to biases from memory recall, the reluctance to reveal accurate income
data for tax purposes or because some of the actual income may be from illegal sources. In
addition, the accuracy of some components of income, especially agricultural income, may be
difficult to defend. On the other hand, the extent of bias in income data is likely to be higher
on the upper part of the income distribution, which is not of particular concern in poverty
analysis. Salaried and fixed income earners can also accurately account for their incomes
(perhaps even better than their expenditures). The direction and extent of bias on expenditure
data, however, is unclear: the poor can have prestige biases, when being asked their
expenditures. Even jogging the memory of respondents with detailed questionnaires has its
limitation: respondents may suffer from information fatigue after long hours of being
interviewed. Reportedly, respondents for the FIES take an average of four to five hours of
interview, with the household visited twice—in July and in January of the following year. This
can seriously erode the quality of survey data (for both expenditure and income). The PSA
should be looking into its entire poverty measurement methodology soonest, given the likely
changes in income and consumption patterns, especially in the wake of COVID-19 and a post-
COVID-19 world.

Some NSOs, including the PSA, are experimenting with the use of a multidimensional poverty
index that puts together various poverty indicators into a composite measure. While there may
be some attraction to the idea, this is not without its complications as one has to develop a
framework for identifying what indicators to consider, what weights to give to the indicators,
and what thresholds to use for each indicator (Albert and Vizmanos 2018c).

When NSOs such as the PSA generate poverty statistics, they also determine national poverty
lines, i.e., the value of the chosen indicator of welfare (i.e, per capita income for the Philippines)
deemed necessary to maintain a minimal standard of well-being. For monetary welfare
indicators that use income or expenditure, the poverty line is the amount needed to purchase a
basket of basic food and non-food goods and services. For non-monetary indicators of welfare,
such as the years of schooling of an adult aged 15 and over, 4 years has been suggested as a
poverty line, and two years for an “extreme” poverty line (UNESCO 2010). The justification
for such thresholds to identify the education poor is that the workforce need basic literacy and
numerical skills for stable occupations, and having less than four years of schooling puts these
people at a severe disadvantage in career mobility (and moreso if they have less than 2 years
of schooling).

 13
When official statistics make use of income or consumption-expenditure indicators in poverty
measurement, monitoring and analysis, the official poverty lines are referred to as “absolute”
poverty lines. That is these poverty lines are essential comparable yardsticks across time whose
changes in nominal values merely reflect price changes, and whose differences in subnational
areas indicate the differences in cost of living across these areas. Most developing countries,
the Philippines included, sets their poverty lines with the cost-of-basic needs (CBN) approach,
a methodology that (a) firstly obtains the food component of the poverty line by a food bundle,
anchored on minimum calorie requirements (typically 2100 Calories per person per day), and
(b) adjusting these food poverty line upward to incorporate non-food needs. In the Philippines,
2,000 calories per person per day is used as the nutrition benchmark. This benchmark is already
quite generous as results of the Food Consumption Survey of the Food and Nutrition Research
Institute (FNRI), suggest that more than 90 percent of Filipinos do not consume as much as
this benchmark in a day. The Philippines also vastly differs in its implementation of the CBN
approach by use of “low-cost” menus for rural and urban areas in each province as an artifice
for estimating the food poverty line, whereas most countries make use of a food basket with
prices based on the costs incurred by a reference population (typically between the second and
fifth deciles of the food consumption distribution). Thus, the reported PhP 7,528 monthly for
a family of 5 for 2018 is actually representing the an average food poverty lines in the entire
country.

Furthermore, the food menus in the Philippines are one-day menus valued with “low cost”
provincial prices at the urban/rural areas in each province. These menus also are meant to meet
the 100% Recommended Dietary Allowance (RDA) adequacies for energy and for protein, as
well as 80% RDA adequacies for other nutrients and vitamins. The FNRI prepared these one
day menus, reportedly validated through extensive consultations with stakeholders. The menus
are also adjusted to account for the availability of food commodities that FNRI deemed cheap
and nutritious. Food items that can be costly are also included in the food menu but only in as
far as these items are the only sources of the nutrient requirements, say, for iron adequacy.

The food menus could be attractive as far as its ability to incorporate other nutrient
requirements besides calories. In addition, since a decade ago, the food menus have been started
off with a national menu (unlike previously where regional menus could vary considerably), to
ensure that relatively comparable food items priced for the food poverty lines across the
country. An alternative approach of using a food bundle has been advocated for use (Albert
and Molano 2009) in estimating the food threshold, and could be worth exploring.

In a few developing countries, a non-food basket is used to value the non-food requirements.
On the other hand, most countries estimate non-food needs indirectly using Engel’s coefficient
– i.e., the food share of those near the food poverty line. In the Philippines, Filipinos at the
bottom of the income distribution spend around 70% for food, thus, the inverse of this food
share – i.e., 1/0.7=1.43 – is used to adjust the food poverty line upward for non-food needs.
Thus the monthly poverty threshold of PhP 10,727, on average, for a family of five per month
in 2018, is an adjustment upward of the food threshold.

 14
For several decades, developing countries have adopted a view of poverty as monetary
deprivation, but ultimately poverty has to resonate with what society’s views. Failrly recently,
a number of netizens expressed surprise about the official poverty line, and mentioned that they
could not survive with the official poverty lines of PhP 10,727-a-month for a family of 5 in
20182. A few netizens have even asked PSA officials and staff to try surviving with such
amounts. This strong reaction in social media may have likely been partly a result of a P10,000-
a month figure that an official of the NEDA reportedly mentioned about a “decent” quality of
life, although this amount was actually meant to explain inflation3. What should be pointed out
to most people is that “survival” means different things to different people: an extremely
wealthy Filipino will not “survive” with P100,000 a month, even if for more than half the
population, this would be a huge amount of money. Al NSOs across the world, attempt to
measure poverty to help describe the extent to which poverty changes, so that decision makers
can appropriately carry out interventions meant to improve the plight of the needy.

Although NSOs such as the PSA have not yet come up with an international standard on
poverty measurement, similar to the national accounting practices, the approaches for counting
the poor across countries are actually quite similar, as per several literature developed by the
World Bank and by the United Nations Statistics Division (Haughton and Khandker 2009;
UNSD 2005). These approaches are based on on estimating the cost of “basic needs,” (and not
how much one needs to survive). However, this idea still causes confusion, as the term “basic”
needs may not be commonly defined. For instance, would we consider internet use as a basic
need? And how exactly should we be costing these “basic needs”?

Those familiar with the food menus of the PSA have also been puzzled why are least-cost
prices used in the menus? Adding to the confusion is that the daily costs incurred by those in
the “middle class”, who tend to be most outspoken in social media, (and even more so those in
the upper income class) do not match the official poverty thresholds on a per person per day
basis. What PSA should be explaining is that the expenditures (and consumption baskets) of
the average Filipinos are very different from those in the low income class. The PSA needs to
develop better communication messages so that people will not equate their spending (and the
prices they pay) with the condition of the poor.

The World Bank has been monitoring poverty globally making use of another set of “absolute”
poverty line. In the Millennium Development Goals period, the World Bank initially used and
international poverty line $1 per person per day in 1991 PPP indices, and subsequently (with
the availability of more recent price data from the International Comparison Program) updated
this poverty threshold to US$1.25 per day in 2005 PPP prices, and recently into $1.9 per day
in 2011 PPP prices. The latter is now meant for monitoring the Sustainable Development Goals.
While the PSA’s official poverty lines are not tied to the $1.9 per day poverty line, if we were
to compare them, the national poverty line would actually be higher. Thus, official income

2
 https://businessmirror.com.ph/2019/04/18/beyond-the-data-what-does-being-poor-in-the-phl-mean/

3
 https://www.rappler.com/thought-leaders/204385-real-score-about-neda-budget-challenge

 15
poverty headcounts are higher than the World Bank estimates of people in poverty for the
Philippines using the $1.9 a day poverty lines (Table 4), though the trends in the two sets of
poverty incidence figures tend to be the same. Note, however, that the $3.2 poverty lines
suggested by the World Bank for use in tracking poverty across lower middle income countries
yields estimates of poverty rates that are higher than the official poverty headcount figures,
thus suggesting the need for PSA to re-examine its poverty line methodology, in the wake of
improved living conditions across time (before the onset of COVID-19), that should lead to
much higher poverty thresholds (and poverty counts) today.

Table 4. Poverty Headcount Rates (in %) in the Philippines using International and
National Poverty Lines: 2010-2015
 Year International Poverty Line National
 $1.90 a day $3.20 a day Poverty Lines
 2015 6.15 26.04 21.6*
 2012 10.51 33.55 25.2
 2009 10.87 34.24 26.3
 2006 14.54 38.42 26.6
 2003 13.16 36.29
 2000 13.89 38.15
Sources: World Bank Povcalnet; PSA
Note: According to PSA (2019c), the official poverty incidence estimate of 21.6 percent in 2015 has been
revised to 23.3 percent to reflect rebased prices from a base year of 2006 to 2012, and to incorporate counts
from the 2015 Census of Population (PopCen).

Whether or not we think that the official poverty lines are unrealistic, what we should ultimately
get bothered with is that around 3 out of every 20 Filipinos (16.6%) are from families with
incomes below PhP 10,727 a month (if the family is a family of 5), and that one in 20 (5.2%)
even are part of families with incomes 30% less than this threshold (around PhP 7,528 a month).
The threshold should thus be viewed as a mere artifice. Nonetheless, it is important for the
PSA to start reviewing its poverty line methodology4 as ultimately poverty metrics, just like
any set of statistics, have to be “credible” to society and ultimately reflect norms.

Finally, as regards summaries on poverty data, the PSA regularly releases the poverty (and
subsistence) thresholds, and the poverty incidence. The latter statistics are the simplest way of
summarizing poverty data. Data users, however, have to realize that it is not enough to compare
poverty rates across areas because the total population also varies across areas. Some areas that
have high poverty incidence actually do not have as much share of total poverty on account of
population size. Similarly, some areas with low poverty incidence may actually have a high
share of total poverty because of population size. More discussions on this issue in the next
sub-section.

It should also be noted that while poverty incidence rates provide a readily understandable
summary of poverty conditions, they also are unable to show the intensity of poverty and

4
 The PSA is planning to review its official poverty methodology, as pointed out in this article.
https://businessmirror.com.ph/2020/02/07/psa-eyes-changes-in-computing-poverty-level/

 16
describe the severity of poverty. Other poverty measures such as the poverty gap and poverty
squared gap are being monitored, respectively, for such purposes. The PSA regularly generates
the poverty gap index, but the extent of explanation of these figures are not adequate to help
data users. The poverty squared gap is even more difficult to interpret; hence, these figures are
used mostly only in academic research reports, and hardly used for practical field work.

3.2. Poverty Profile

As indicated in the previous subsection, various poverty measures can be calculated to
aggregate and summarize poverty data from a household survey on living standards. The most
common descriptive measure of poverty is poverty incidence, also called the poverty rate, or
headcount poverty index, which gives the proportion of the population in poverty.

As of 2018, the estimated poverty rate in the Philippines, based on the 2018 FIES, is 16.8
percent (equivalent to an estimated 17.7 million Filipinos in poverty out of a total of 105.8
million Filipinos in 2018). This is slightly different from these PSA-released figures on
account of the incorporation of a revised urban/rural definition in the 2018 FIES microdata
reflecting information gathered from the 2015 Census of Population (PopCen). In terms of
families/households5, the household poverty incidence is 12.4 percent (corresponding to 2.9
million households in poverty out of a total 23.7 million households). Among the 17.7 million
poor Filipinos, 5.6 million are estimated to be in subsistence or extreme poverty. Furthermore,
around 830 thousand Filipino households are extremely poor in that they have per capita
incomes less than the subsistence threshold.

The distribution of Filipinos and households in the country by poverty status in 2018 is shown
in Table 5. Here, we notice that the Bangsamoro Autonomous Region of Muslim Mindanao
(BARMM) has the highest poverty incidence and share of total poverty in the country, whether
in terms of population or households. Further, the National Capital Region (NCR) or Metro
Manila has the least poverty. Such a portrait of disparities across regions has been unchanged,
although many regions appear to have reduced poverty, though at rather different rates (Albert
et al. 2015).

Table 5. Distribution of Population and Households (in thousands) by Poverty Status and
by Regions in 2018
 Region Population Households
 Poor Total Total Poor Total Total
 Food- Poor Total Non- Food- Poor Total Non-
 poor but Poor poor poor but Poor poor
 not not
 Food- Food-
 Poor Poor
 Ilocos 93 421 514 4,665 5,178 13 74 86 1,142 1,228
 Cagayan Valley 154 432 586 2,994 3,580 26 82 108 750 858

5
 A household is a set of people who reside together, using the same kitchen and cooking utensils. In this report,
we do not differentiate a household from a family.

 17
Region Population Households
 Poor Total Total Poor Total Total
 Food- Poor Total Non- Food- Poor Total Non-
 poor but Poor poor poor but Poor poor
 not not
 Food- Food-
 Poor Poor
 Central Luzon 180 663 842 11,048 11,890 26 112 138 2,532 2,670
 CALABARZON 232 873 1,105 14,314 15,419 36 148 185 3,353 3,537
 MIMAROPA 136 334 470 2,624 3,094 20 55 76 641 717
 Bicol 424 1,195 1,619 4,387 6,006 59 197 256 1,027 1,282
 Western Visayas 331 944 1,275 6,489 7,764 48 162 210 1,555 1,765
 Central Visayas 372 991 1,363 6,382 7,745 59 172 232 1,487 1,718
 Eastern Visayas 463 962 1,425 3,195 4,619 71 174 246 788 1,034
 Zamboanga 465 756 1,222 2,503 3,725 72 135 207 587 793
 Peninsula
 Northern 295 838 1,133 3,759 4,893 43 147 190 887 1,077
 Mindanao
 Davao Region 291 691 982 4,147 5,129 45 125 171 1,041 1,211
 SOCCSKSARGEN 544 806 1,350 3,428 4,777 90 151 241 831 1,071
 National Capital 55 254 309 13,145 13,454 8 37 45 3,014 3,059
 Region (NCR) or
 Metro Manila
 Cordillera 61 155 217 1,559 1,775 10 26 36 367 403
 Administrative
 Region (CAR)
 Bangsamoro 1,207 1,276 2,483 1,531 4,015 164 220 384 330 714
 Autonomous
 Region of
 Muslim
 Mindanao
 (BARMM)
 CARAGA 271 553 824 1,868 2,692 42 98 140 439 578
 Philippines 5,574 12,145 17,719 88,036 105,755 830 2,117 2,947 20,770 23,717
Note: Authors’ calculation from 2018 FIES, PSA and Official Poverty Lines, PSA

As mentioned in the previous subsection, the 2018 FIES has four times the sample size of
previous waves of the FIES, which allows the survey to be used for generating more reliable
estimates of poverty at the provincial level. The poverty maps on poverty incidence and the
magnitude of poor Filipinos show disparities across the country (Figure 3).

 18
Figure 3. Poverty Across Provinces in 2018 in terms of (a) Poverty Incidence (in percent)
and (b) Number of Poor Filipinos (in thousands).

Further, the maps are a bit different in showing where poverty is least and worst since some
provinces having a bigger share of total poverty in the country on account of population sizes.
In consequence, policy makers and poverty data users should take caution in merely deciding
to focus poverty interventions in areas with a high poverty incidence.

Box 2 provides a summary of the best and worst cases of provinces in the country in terms of
poverty incidence and share to total poverty (or equivalently the number of poor Filipinos).
Full data on the distribution of the population and across families are found in the annex tables.
All the provinces identified that have poverty rates of 50 percent or above (including Isabela
City) only account for 10.4 percent of the total poverty in the country. These areas, together,
with those with poverty rates between 30 to 50 percent, can account for about a third (31.6) of
all the poor in the country. In contrast, provinces with more than half a million poor Filipinos
contribute a combined share of nearly a fifth (17.9%) of all poor Filipinos. More than half
(55.3%) of all poor Filipinos reside in these provinces, together with those with between 250
to 500 thousand poor Filipinos. Thus, once again, we point out that poverty data users should
be cautious in focusing solely at poverty incidence, as we may be missing out on populated
areas that have a small poverty incidence, but actually a lot of poor people.

 19
Box 2. Summary of Poverty Conditions across Provinces :
 Poverty High poverty: with incidence of 50% or more in (Isabela City*,) Lanao del Sur,
 Incidence Basilan, and Sulu
 Moderately high poverty : with rates between 30% to 50% in Camarines Norte ,
 Sultan Kudarat, Dinagat Island, Masbate, Northern Samar, Surigao del Norte,
 Zamboanga Sibugay, Davao Oriental, Agusan del Sur, Davao Occidental, Sarangani,
 (Cotabato City*,) Zamboanga del Norte, Maguindanao, Eastern Samar
 Least poverty: with rates of 5% or below in (NCR*,) Pampanga, Laguna, Rizal, La
 Union, Ilocos Norte
 Number of High poverty: with more than half a million poor people in Camarines Sur, Leyte,
 Poor Negros Occidental, Maguindanao, Sulu, Cebu, Lanao del Sur
 People Moderately high poverty: with between 250 to 500 thousand poor in Misamis
 Oriental, Sultan Kudarat, Basilan, Agusan del Sur, Lanao del Norte, Bohol, Isabela,
 Davao de Sur, Albay, South Cotabato, Quezon, Masbate, Batangas, Negros Oriental,
 Pangasinan, Bukidnon, Iloilo, Cotabato, Zamboanga del Sur, Zamboanga del Norte
 Least poverty: with 50 thousand poor or less in Batanes, Siquijor, Guimaras,
 Camiguin, Apayao, Quirino, Kalinga, Ilocos Norte, Ifugao, Biliran, Marinduque,
 Aurora, La Union, Mountain Province, (NCR-4th Dist.*), Dinagat Island, Abra,
 Benguet
Note: Authors’ summary

The head-count index, however, does not indicate how poor the poor are. The Poverty Gap
Index, which is the average over all people, of the gaps between poor people’s income and the
poverty line, expressed as a ratio to the poverty line, shows the average depth of poverty.
However this is not sensitive to the distribution of living standards among the poor. To make
the poverty gap index more sensitive to the distribution of income among the poor, the poverty
gaps of the poorest people can be given a bigger weight when calculating the index. One such
weighted average (that uses the relative gaps as the weights) is the Poverty Severity Index; the
higher the value of this index, the more unequal is the distribution of income among the poor.

Table 6 show that the poverty comparisons across regions, in relation to the poverty incidence,
gap, and squared gap measures, are generally consistent, although not fully. BARMM is, for
instance, consistently the poorest across regions. Zamboanga Peninsula is the second poorest
by poverty incidence and poverty gap in terms of the actual estimates of the indices, but only
seventh and fifth, by share to total poverty incidence and total poverty gap, respectively. Thus,
as was pointed out in the earlier sub-section, policies and practices to reduce poverty should
not focus solely on poverty incidence.

Table 6. Poverty Incidence, Poverty Gap, Poverty Squared Gap (in %) among Filipinos, by
Region: 2018
 Region Index Estimates Share to Total (in %)
 Poverty Poverty Poverty Poverty Poverty Poverty
 Incidence Gap Squared Incidence Gap Squared
 Gap Gap
 Ilocos 9.92 1.76 0.49 2.90 2.22 1.78
 Cagayan Valley 16.37 3.28 0.98 3.31 2.87 2.47
 Central Luzon 7.08 1.33 0.41 4.75 3.86 3.46

 20
Region Index Estimates Share to Total (in %)
 Poverty Poverty Poverty Poverty Poverty Poverty
 Incidence Gap Squared Incidence Gap Squared
 Gap Gap
 CALABARZON 7.17 1.38 0.42 6.24 5.17 4.52
 MIMAROPA 15.19 3.43 1.17 2.65 2.59 2.56
 Bicol Region 26.96 5.65 1.77 9.14 8.27 7.52
 Western Visayas 16.42 3.40 1.09 7.19 6.44 5.96
 Central Visayas 17.60 3.79 1.27 7.69 7.17 6.92
 Eastern Visayas 30.84 7.32 2.53 8.04 8.25 8.25
 Zamboanga Peninsula 32.81 8.41 3.07 6.90 7.64 8.09
 Northern Mindanao 23.16 4.80 1.49 6.40 5.72 5.14
 Davao Region 19.14 4.32 1.46 5.54 5.40 5.29
 SOCCSKSARGEN 28.25 7.79 3.10 7.62 9.08 10.45
 National Capital Region (NCR) 2.29 0.36 0.10 1.74 1.19 0.92
 or Metro Manila
 Cordillera Administrative 12.20 2.71 0.89 1.22 1.17 1.12
 Region (CAR)
 Bangsamoro Autonomous 61.86 18.59 7.33 14.02 18.20 20.79
 Region of Muslim Mindanao
 (BARMM)
 CARAGA 30.62 7.26 2.51 4.65 4.77 4.77
 Philippines 16.76 3.88 1.34 100.00 100.00 100.00
Note: Authors’ calculation from 2018 FIES, PSA and Official Poverty Lines, PSA

3.3. The Middle Class

As pointed out in Albert et al. (2018b), the scope of poverty assessments and social protection
interventions must go beyond profiling poverty, and look into various segments of the income
distribution given the vulnerabilities to future poverty that people face. This is particularly
relevant in the wake of the impact of COVID-19 on incomes of households. The non-poor is a
very big portion of society with a lot of inherent heterogeneity.

For this purpose of examining inequality among the non-poor and in relation to the poor, it can
be helpful to consider the income group typology espoused by Albert et al. (2018a) that
identifies the low-, middle- and high- income classes in the country, especially since the middle
class plays a crucial role in in society (Murphy et al. 1989; Chun et al. 2017; Banerjee & Duflo
2008; Huntington 1991; Kharas 2017). Further, this provides a good way to have a metric to
determine whether the long term aspiration for the country to become a largely middle class
society is being met. (NEDA 2015). Table 7 provides the updated thresholds for the seven
income groups (and three income classes) proposed by Albert et al. (2018a) using the poverty
data available from the PSA for 2018.

 21
You can also read