Public Policy Brief MULTIDIMENSIONAL INEQUALITY AND COVID-19 IN BRAZIL - LUIZA NASSIF-PIRES, LAURA CARVALHO, and EDUARDO RAWET - Levy ...
←
→
Page content transcription
If your browser does not render page correctly, please read the page content below
Levy Economics Institute of Bard College

Public Policy Brief
                                                   No. 153, 2020

MULTIDIMENSIONAL INEQUALITY AND COVID-19
IN BR AZIL
LUIZA NASSIF-PIRES, LAURA CARVALHO, and EDUARDO RAWET
Contents
3 Preface
Dimitri B. Papadimitriou
4 Multidimensional Inequality and COVID-19 in Brazil
Luiza Nassif-Pires, Laura Carvalho, and Eduardo Rawet
18 About the Authors
The Levy Economics Institute of Bard College, founded in 1986, is an autonomous research organization. It is nonpartisan, open to the examina-
tion of diverse points of view, and dedicated to public service.
The Institute is publishing this research with the conviction that it is a constructive and positive contribution to discussions and debates on
relevant policy issues. Neither the Institute’s Board of Governors nor its advisers necessarily endorse any proposal made by the authors.
The Institute believes in the potential for the study of economics to improve the human condition. Through scholarship and research it generates
viable, effective public policy responses to important economic problems that profoundly affect the quality of life in the United States and abroad.
The present research agenda includes such issues as financial instability, poverty, employment, gender, problems associated with the distribution
of income and wealth, and international trade and competitiveness. In all its endeavors, the Institute places heavy emphasis on the values of
personal freedom and justice.
Editor: Michael Stephens
Text Editor: Elizabeth Dunn
The Public Policy Brief Series is a publication of the Levy Economics Institute of Bard College, Blithewood, PO Box 5000,
Annandale-on-Hudson, NY 12504-5000.
For information about the Levy Institute, call 845-758-7700, e-mail info@levy.org, or visit the Levy Institute website at
www.levyinstitute.org.
The Public Policy Brief Series is produced by the Bard Publications Office.
Copyright © 2020 by the Levy Economics Institute. All rights reserved. No part of this publication may be reproduced or transmitted in any
form or by any means, electronic or mechanical, including photocopying, recording, or any information-retrieval system, without permission
in writing from the publisher.
ISSN 1063-5297
ISBN 978-1-936192-69-4
Public Policy Brief, No. 153 2Preface
As major global crises often do, COVID-19 has exposed coun- not explain the observed disparities in death rates in Brazil, for
tries’ political, policy, and socioeconomic fault lines and vulner- instance. For a more comprehensive picture of relevant inequali-
abilities. In a previous public policy brief, Luiza Nassif-Pires led ties, the authors focus on the persistence of unequal access to
a study examining the feedback loops between the pandemic healthcare and variations in the prevalence of comorbidities,
and racial, gender, and income inequalities in the United States both of which contribute to the severity of illness and number
(Public Policy Brief No. 149, “Pandemic of Inequality”). For this of deaths. The authors also reveal that, in terms of the gaps in
current policy brief, Nassif-Pires, Laura Carvalho, and Eduardo observed rates of infection and hospitalization for COVID-19,
Rawet use a similar analytical framework to examine Brazil’s racial inequality appears to have played a more significant role
experience with COVID-19—a country whose high income than income inequality.
inequality and history of slavery predispose it to share similar Nassif-Pires, Carvalho, and Rawet note that Brazil entered
structural weaknesses in the face of the pandemic. the pandemic on the heels of slow GDP growth, high unemploy-
Nassif-Pires, Carvalho, and Rawet note that Brazil is suffer- ment, and rising inequality—along with ongoing implementa-
ing from some of the worst per capita numbers in the world in tion of an austerity program spurred by a new, constitutionally
terms of cases and deaths, and they explore here how yawning enshrined ceiling on the growth of federal expenditure. With the
racial, regional, and class disparities can help account for why COVID-19 emergency, those fiscal restraints were temporarily
COVID-19 has had such a deleterious impact on the Brazilian lifted: Brazil mounted a fiscal response equivalent to 6.5 percent
population. Although they find that fiscal policy has so far been of GDP (in health and nonhealth measures), with almost half
successful at mitigating the impacts of the crisis with respect to of this response dedicated to a cash transfer program, Auxílio
wage inequality, the existence of structural inequalities along Emergencial. The authors find that, for the bottom half of the
racial lines in particular have resulted in the public health burden income distribution, this program raised incomes by more than
of this pandemic being unequally borne. the crisis-induced fall in wages. As a result, poverty was reduced
The authors construct an index to measure the social bases to its lowest level ever recorded and, so far, the impact of the crisis
of vulnerability to the virus, focused mainly on risks driven by in terms of rising income inequality has been neutralized.
living and working conditions such as informal employment or Amidst uncertainty over how long the Auxílio Emergencial
cramped living arrangements. The index reveals significant dis- will be extended, rising bankruptcies among small firms, and
parities in the risk of infection that break down along lines of race, rumblings of a return to an austerity regime, the authors stress
region, income, and education. Moreover, the overlap of racial that the current fiscal measures must be both retained and
inequalities with income or educational inequalities exacerbates enhanced (they recommend more action on credit measures for
these disparities—the authors find this to be especially conspicu- businesses). Moreover, the effects of structural inequalities on
ous with respect to the intersection of race and low educational the country’s infection rates and death count make it clear that
attainment. They note that infection, hospitalization, and death broader policy changes are necessary for addressing other dimen-
rate microdata targeting these intersections of race, gender, and sions of inequality, particularly those rooted in structural racism.
class would help better guide effective public policy.
Nassif-Pires, Carvalho, and Rawet find that the disparate As always, I welcome your comments.
public health impact of the pandemic reflects the inequalities
identified by their vulnerability index, particularly with respect Dimitri B. Papadimitriou, President
to infection rates. Nevertheless, the authors explain that the index September 2020
only reveals part of the story. Social vulnerability alone does
Levy Economics Institute of Bard College 3Introduction fight the coronavirus. In August, the Latin American death toll
Since the 2008 global financial crisis, income and wealth inequal- passed 200,000, while Brazil topped 100,000 deaths, ranking sec-
ities have gained renewed attention in the economic literature ond in the world in absolute number of deaths. If this were not
and wider policy debates. Given the economic and political costs enough, the IMF projects a fall of 9.3 percent in Latin America’s
of the broadly acknowledged rise of income concentration at the GDP in 2020—a number that makes the 4.9 percent contraction
top of the distribution since the 1980s, economists and politi- projected for global GDP look like a mild recession.
cians in the past decade have put forward various interpretations In addition to the ineffectiveness of lockdown measures,
as well as proposals for reducing the gap between the very rich wide structural inequalities, high levels of informality in the
and the rest of the population. However, none of these discus- labor market, and the importance of the services and tourism
sions seem to have prepared our society to battle the devastat- sectors in these economies may help explain these disastrous
ing consequences of inequality during the COVID-19 crisis. results. Moreover, the region was experiencing a period of slow
On the one hand, inequality aggravates the pandemic, as the growth and thus faced high levels of unemployment prior to the
wide gap between the rich and poor—in terms of income, type pandemic. In this context, many of these countries lacked the fis-
of employment, living conditions, access to health, and other cal space to react proportionately: as of May 2020, more than $1
dimensions—has major consequences for the distribution of the trillion had already been obtained as loans from the IMF to fight
death toll within and between countries. On the other hand, the the crisis in Latin America.
pandemic exacerbates inequality by widening this gap through By the beginning of August, countries like Peru, Chile, and
its deep economic and social impacts. Brazil had the fiscal space to spend more than their neighbors
Based on data from 175 countries after five significant but have nonetheless presented some of the highest numbers in
epidemics—SARS (2003), H1N1 (2009), MERS (2012), Ebola the world with respect to deaths per 100,000 people.1 In con-
(2014), and Zika (2016)—a study by Furceri, Loungani, and trast, Uruguay ranked 125th while spending less than 2 percent
Ostry (2020) suggests that these episodes have contributed of GDP to fight the pandemic. While other differences certainly
to raising income inequality by almost 1.5 percent in the five have played a role, Uruguay is known for its relatively low level
subsequent years. This effect may be substantially larger in the of income inequality in the region: the 2018 Gini index for Brazil
COVID-19 pandemic, with health and economic burdens dis- was 53.9 and only 39.7 in Uruguay (World Bank 2018).
proportionately laid on those at the bottom of the distribution. High inequality may contribute to explaining why, since
First, the most vulnerable are more prone to be infected by the mid-June 2020, Brazil has had the second-highest number of
virus, due both to the need to continue working in person and cases in the world, even after spending more than 6 percent of
to inequalities in living conditions. Second, precarious health- GDP in fiscal measures to fight the COVID-19 crisis. Setting
care and the unequal distribution of comorbidities play a role in aside the antiscience discourse of the federal government and
explaining wide disparities in the severity of cases and the num- the overall disastrous approach on the health front, the next sec-
ber of deaths. Third, the loss of income generated by the crisis tion will examine the country’s wide inequalities as a risk factor
seems to disproportionately affect self-employed and informal in the pandemic. The following section will build a preliminary
workers, as well as lower-skilled employees in the services, retail, analysis of the unequally distributed economic and health costs
and construction sectors. of the COVID-19 crisis in Brazil. The final section concludes the
Hence, after an initial period in which high-income coun- policy brief.
tries were the epicenter of the COVID-19 pandemic, develop-
ing countries now account for more than half of global deaths. A Inequality as a Risk Factor for COVID-19: Measuring
study by Murray et al. (2006) suggests that mortality rates during Social Vulnerability in Brazil
the 1918–20 flu pandemic were up to 30 times higher in poor Several dimensions of structural inequalities can be identified as
regions of the world. Simonsen et al. (2013) show that during the potentially increasing the risk of infection and death during the
H1N1 pandemic in 2009, mortality was 20 times higher in South pandemic. First, low-income populations are more exposed to
America than in European countries. In 2020, Latin American contamination. This is due to the difficulty of adhering to quar-
countries are attracting worldwide attention for their inability to antine measures, as they cannot forgo their labor income. For
Public Policy Brief, No. 153 4those who continue to work, the use of public transportation and characteristics were responsible for stark differences in infec-
the high concentration of jobs in the service sector makes social tion, hospitalization, and death rates. As of the end of July 2020,
distancing difficult. Moreover, the exposure to contamination is data from the NYC Department of Health and Mental Hygiene
greater for low-income populations even when they are in quar- showed that Latino and black populations’ infection rates are
antine, as they do not necessarily have access to modern plumb- around 1.6 times higher, with hospitalization and death rates
ing and live in more crowded spaces. around two-times higher than those of the white population.
Second, access to healthcare is not evenly distributed in Furthermore, infection, hospitalization, and death rates are
Brazil. This is due both to regional disparities and to the exis- higher among the poor. According to the Centers for Disease
tence of two healthcare systems: a private and a universal public Control and Prevention (CDC 2020), “inequities in social
system. Although the total number of hospital beds in both net- determinants of health put racial and ethnic minority groups
works is similar, the latter serves the majority of population (71 at increased risk of getting sick and dying from COVID-19.”
percent) and its beds are unequally distributed across regions. Within such inequities, the CDC cites educational, income, and
Third, low-income populations infected with the novel wealth gaps, as well as differences in access to healthcare, job
coronavirus tend to have worse outcomes. Studies have shown occupation, and housing conditions.
that the incidence of comorbidities that are associated with Indeed, studies on previous respiratory infection epidem-
higher rates of hospitalization and deaths, such as diabetes ics (1918–20 flu, H1N1, and SARS) have shown that social
and hypertension, is higher among low-income and racialized inequalities are a determinant for the rate of transmission and
populations (Preston and Taubman 1994; Margolis et al. 1992; severity of these diseases (Cordoba and Aiello 2016; Mamelund
Gaskin, Thorpe, and McGinty 2014; Viacava et al. 2019; Malta 2017; Tricco et al. 2012; Bengtsson 2018; Bucchianeri 2010).
et al. 2019; Leite et al. 2015). Multidimensional poverty is responsible for the fact that those
In this section, we will discuss in detail these three aspects living near the poverty line did not have the means to avoid
of inequalities in Brazil and construct a social vulnerability index infection. Structural racism plays an important role in explain-
that can help shed light on the roots of the unequal observed ing why minorities are also particularly vulnerable to infections.
health outcomes by region, income, and race in Brazil during the They are overrepresented in essential jobs and more likely to
COVID-19 pandemic. be dependent on public transportation. Minorities in big cities
are concentrated in neighborhoods that experience outbreaks,
Inequality and the Risk of Infection and the higher population density and likelihood of sharing
The COVID-19 epidemic spread quickly, releasing a scientific smaller houses with more people therefore increases contagion
race to understand the effects of the virus. Bioscientists and med- within the family. Furthermore, once infected, poor and minor-
ical authorities ascertained that a few factors increased the risk ity populations are more likely to have worse outcomes due to a
of contracting and dying of COVID-19: age, sex, and underly- higher prevalence of comorbidities and more precarious access
ing health conditions. Epidemiologists warned that large social to healthcare (Nassif-Pires et al. 2020).
gatherings, poor hygiene, and closed spaces would lead to more The United States and Brazil share two crucial character-
infections. Social scientists cautioned that structural inequalities istics: high income inequality and a history of slavery. It is thus
increased the risk of minorities and poor populations getting sick expected that race and low income in Brazil would also be risk
and dying from COVID-19. The warnings of medical authori- factors for COVID-19 infection. To investigate, we build an index
ties and epidemiologists were turned into guidelines and poli- to measure individuals’ social vulnerability to the virus using the
cies, but the warnings by social scientists were mostly ignored by National Household Sample Survey (PNAD-Contínua). We con-
authorities and the virus’s arrival into unequal societies uncov- struct binary variables to indicate the risk of infection accord-
ered a challenge. Policies that treated everyone as equals exac- ing to living and working characteristics. The work-related risk
erbated structural inequalities and revealed the discrepancies in factors considered for an individual are: employment in a job
living, working, economic, and health conditions. that has been deemed essential by the federal government, being
Data on the evolution of the virus’s spread by neighbor- informally employed (not having carteira assinada),2 not owning
hood in New York City soon corroborated that socioeconomic a car or a motorcycle, and not having internet access. Regarding
Levy Economics Institute of Bard College 5living conditions, we consider living in a house with more than difficulty in inferring the health impacts of COVID-19 on
three occupants per bedroom or with no plumbing and sewage women of color. Our results for the intersection of sex and race
system to be a risk. We compute the social vulnerability index as shed some light on this discussion and stress the importance of
the sum of risk factors for each individual. taking the unequal health burden of COVID-19 on women of
According to our social vulnerability index, the average color into account.
Brazilian has a score of 1.53, though there are large regional,
racial, gender, and educational discrepancies in the values.
North and Northeast regions, which are the poorest and most
unequal ones,3 have an average social vulnerability index higher
than the national average (2.35 and 1.92, respectively), while
those living in the South, Southeast, and Midwest regions are
less vulnerable than the average Brazilian according to our
index. The value of the social vulnerability index also decreases
with educational attainment, as those who have less than a high
school degree are found to be more vulnerable than the average
Brazilian. For those with a college degree and above, the index is
approximately twice as small (0.98) than for those without any
formal education (1.86).
We now turn our discussion to the intersection between
class and race. It has been established that low-income and racial-
ized populations are at increased risk of being infected and dying
from COVID-19, but structural racism makes it impossible to
separate these factors. Figure 1 presents the mean of the social
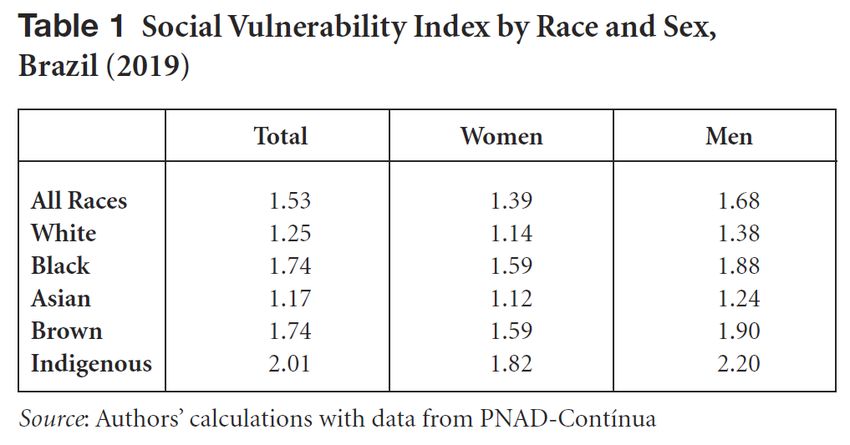
Table 1 presents the averages of the social vulnerability vulnerability index by income percentile with information for
index by race and sex. The Brazilian Institute of Geography two racial groupings: black, brown, and indigenous—which in
and Statistics (IBGE) provides five race classifications: Brancos, the aggregate experience above-average risk—and white, which
Pretos, Amarelos, Pardos, and Indígenas, here translated as are culturally dominant in Brazilian society. Income percentiles
white, black, Asian, brown, and indigenous. Those correspond were calculated from per capita household income reported in
respectively to 46 percent, 9 percent, 1 percent, 44 percent, and the survey.5 The first two interesting aspects to notice are that,
0.4 percent of Brazil’s population. The term Pardo aggregates the except for the fifth decile, the average vulnerability index falls
vast majority of African and native Brazilian descendents.4 steadily with income, and that black, brown, and indigenous
For all racial groups, women are less vulnerable than men. populations are at higher risk than white populations in every
Although the average woman is less vulnerable than the average income percentile. The average Brazilian in the bottom 60 per-
person, this is not true for black, indigenous, and brown women. cent of the income distribution presents a risk above the national
When we look at the index by race, only white and Asian persons average and race seems to be a determining factor. For white
are less vulnerable than average. people, the average vulnerability index falls below the national
Lower infection rates among women, higher rates among average at the fourth decile; black, brown, and indigenous peo-
minorities, and lack of intersectional data on cases poses a ple only escape the above-average risk in the top three deciles.
Public Policy Brief, No. 153 6Another worrying pattern is the fact that the racial gap in for black, brown, and indigenous populations (80 percent and
the vulnerability index is higher at the bottom of the distribution 81 percent, respectively) and for those that did not complete
than at the top. Those at the intersection of race and poverty are middle school (83 percent and 84 percent, respectively).
therefore much more vulnerable to COVID-19. An even more Furthermore, PNS indicates that only 65 percent of
dramatic pattern is observed for the intersection between race Brazilians self-evaluate their health as good or very good; that
and low educational achievement, with whites of all educational proportion in the Southeast region is 11 percentage points higher
groups facing below-average risk, while for black and brown than in the North. The Northern region’s population is also the
people, only those that started or earned a secondary diploma most dependent on the public system (80 percent) and is home
present a social vulnerability index below the national average. to the lowest proportion of those that have been to a doctor in
Our results highlight the importance of recording infec- the last year (61 percent). In fact, 18 percent of those that declare
tion, hospitalization, and death rates not only by race, sex, and having poor or very poor health in the Northern region have
income, but also for the intersection of those groups. The lack of not seen a doctor in the last year. The same discrepancies can be
microdata that would allow researchers to assess how structural observed when we evaluate race and educational attainments,
inequality, racism, and sexism imposes an unequal distribution with black, brown, and indigenous populations and those that
of vulnerabilities across different social groups is an obstacle to did not complete middle school being more dependent on the
the design of effective policy measures. public system and less likely to have been to the doctor in the last
Our social vulnerability index shows that when COVID- year, even if they evaluate their health more poorly on average.
19 started to spread locally in Brazil, racialized and low-income This is further evidence that the SUS fails to deliver equal and
populations were at increased risk of being exposed to the universal healthcare.
virus. The next section provides one additional explanation for Indeed, Rache et al. (2020) estimates that of the 316 health
observing socioeconomic inequalities in the numbers of cases regional units, 14.9 percent of the population that relies on the
and death tolls: previous inequalities in health access and out- public health system lives in one of the 142 units with no inten-
comes can lead to inequalities in the severity of cases. sive care unit (ICU) beds. They also state that in 72 percent of
the health regions the number of ICU beds per 10,000 people is
Inequality and Access to Healthcare below what is adequate for a typical year, without the influence
Brazil had an advantage in dealing with the pandemic: one of of COVID-19. A report by the Brazilian Intensive Care Medicine
the world’s largest universal public healthcare systems. As dic- Association (AMIB 2020) estimates that the national average of
tated by the Brazilian constitution of 1988, health is a universal ICU beds per 10,000 people is 2.2, but it is 4.9 in the private
right and a responsibility of the state. The constitution also states system and 1.4 in the public. To make matters worse, those num-
that healthcare should be equally accessible and that the system bers vary widely by region, with the lowest average number of
should be regionally decentralized. The implementation of the ICU beds per 10,000 people in the public system being in the
Unified Health System (Sistema Único de Saúde or SUS) began North (0.9) and the highest in the Southeast (1.8).
in 1990 and has allowed Brazil to slowly address the nation’s Unequal healthcare access in Brazil had two consequences
health inequities, already exacerbated during the preceding 20 for the pandemic. First, the Brazilian public system was unpre-
years of military dictatorship. Nonetheless, this system still falls pared, and particularly so in the North and Northeast regions,
short of achieving its egalitarian goals.6 to provide services to those infected by the virus. Second, even
Another important aspect of Brazil’s healthcare system is the before the pandemic, many individuals—especially those racial-
coexistence of a large private health network, mostly available to ized and living in poorer regions—had compromised immune
those who can afford health insurance. According to Guimarães systems. This last argument is further scrutinized in the next
(2020), the overall number of beds available in the private subsection.
and public systems are comparable, though numbers from the
National Health Survey (PNS) show that 71 percent of Brazilians
rely on the public healthcare system and 72 percent of Brazilians
do not have private health insurance. Those numbers are higher
Levy Economics Institute of Bard College 7Inequality and Comorbidities factors are not equally distributed among the population. As
According to the World Health Organization (2020), the major- shown in Figure 2, the proportion of people who declared to
ity of people infected by COVID-19 (80 percent) will experience have attended only elementary school and present one or more
mild symptoms. It is consistently observed across countries that risk factors is 60 percent, compared to 32 percent for those who
age and underlying health conditions can explain severe illness, attended high school and 37 percent for those who have started
need of hospitalization, and death (Guan et al. 2020; Instituto a higher degree. This difference is even greater when consider-
Superiore di Sanitá 2020). ing those who have more than one risk factor, with a frequency
A study carried out in the United States among people diag- among those who attended up to middle school 2.5 times higher
nosed with COVID-19 (Chow et al. 2020) shows that the hospi- than among those who attended high school and twice as high
talization rate for those who did not have any underlying health than for those that started a graduate degree.
problem was 7 percent overall and 2 percent in ICUs. These
numbers increase to 30 percent and 15 percent, respectively,
for people with reported comorbidities.7 Furthermore, Gao et
al. (2020) report that the rate of hospitalization in the Chinese
province of Hubei was 1.8 times higher for patients with one
comorbidity and 2.6 times higher for those with two or more
comorbidities.
As studies show, gaps in life expectancy (Preston and
Taubman 1994), prevalence of lower respiratory illness (Margolis
et al. 1992) and diabetes (Gaskin, Thorpe, and McGinty 2014)
are correlated with educational attainment, income, and race.
Brazil does not escape this pattern, with regional and educa-
tional gaps among those diagnosed with diabetes and hyperten-
sion (Viacava et al. 2019; Malta et al. 2019; Leite et al. 2015) and
income gaps associated with cardiovascular disease mortality
rates (Ishitani et al. 2006).
Previous studies for the United States have pointed to the
importance of accounting for the different rates of prevalence of
comorbidities to explain the racial and income gaps in COVID-
19’s observed cases and death toll (Nassif-Pires et al. 2020; Kim When we consider all results presented in this section, it is
and Bostwick 2020; Price-Haywood et al. 2020). To investigate clear that when COVID-19 reached Brazil it found a structur-
this issue in Brazil, we use the 2013 PNS and evaluate the cor- ally unequal country, where certain social groups were more
relation between incidence of risk factors and educational attain- vulnerable to infection, less likely to have access to healthcare,
ment. We consider risk factors to include being over 60 years and more likely to develop severe illness. Finally, the juxtaposi-
of age and diagnosed with diabetes, hypertension, asthma, lung tion of these three layers of vulnerability were more prominent
disease, coronary disease, or chronic kidney disease. The fact for those at the intersection of class and race. Therefore, with-
that the information on diseases is self-reported and requires out a strong policy response to support vulnerable groups, the
a previous diagnosis by a doctor leads to racial, educational, COVID-19 health burden in Brazil will be necessarily higher
and regional biases. To partially correct for this, we restrict our for racialized, poor, and less-educated populations. In the next
sample to individuals who have consulted a doctor within the section we will discuss the economic policies implemented and
last year, which corresponds to 72 percent of our initial sample study the observed health and economic impacts of COVID-19
population.8 in Brazil so far. We then analyze if the policies implemented have
The proportion of our sample who fall into the group con- been successful in mitigating the expected unequal distribution
sidered at-risk for COVID-19 is 42 percent. However, the risk of the health and economic costs of COVID-19.
Public Policy Brief, No. 153 8The Impact of the Pandemic in Brazil: Health, Social, and with the largest corruption investigation in Brazilian history
Economic Effects (known as Lava Jato, or Operation Carwash), which facilitated
the simplistic yet understandable perception among the gen-
Economic and Policy Context eral population that corruption itself was the main cause of the
As opposed to several high-income countries that entered their economic meltdown. From this perspective, it becomes easier
COVID-19 crises following long periods of economic expan- to understand how, in contrast to multiple far-right nationalist
sion and reductions in unemployment rates, Brazil experienced candidacies around the world, Bolsonaro was elected through
a 7 percent fall in GDP in 2015–16 and had since been going the combination of the usual morally conservative discourse and
through the slowest economic recovery in its history. Moreover, an ultra-liberal economic platform—getting rid of a corrupt state
as a result of the combination between a fiscal expansion and in all areas (except public security) was sold as a solution to all of
a slowdown in tax receipts, the electoral year of 2014 brought the country’s problems.10 Paulo Guedes, Bolsonaro’s University
about the first increase in Brazilian public debt relative to GDP of Chicago–educated economic guru, became Brazil’s minister
in the 21st century.9 of finance. With alleged success in the financial industry and
In the years that followed, the rise in public debt was used market fundamentalist discourse—including promises of priva-
to justify the adoption of a fiscal consolidation program focused tizing all public assets to pay off public debt and explicit praise of
on cutting public investment and approving structural reforms the Chilean economic success under Pinochet—Guedes helped
in the pension system and other sources of mandatory expendi- gather support from financial elites.
tures. In 2016, congress passed an amendment to the constitu- The COVID-19 shock came right after another round of
tion that established a ceiling for federal primary expenditures: frustrating GDP numbers released in early March: economic
the budget would only be allowed to expand at the rate of the growth in 2019—the first year of Bolsonaro’s presidency—
previous year’s inflation. In other words, the country was headed slowed to 1.1 percent, far below market expectations from the
toward a substantial reduction in the size of the state, as pub- beginning of the year of around 2.6 percent. The reaction in con-
lic expenditures would not be allowed to keep up with GDP gress to the disappointing economic performance had already
growth. It also attached Brazil’s commitment to austerity to the revealed growing discontent with the ability of the austerity
constitution and restricted future governments’ ability to imple- agenda and the spending ceiling to deliver economic growth. On
ment anticyclical economic policies. March 16, 2020, less than a month after the first case of COVID-
As unemployment almost doubled—from 6.5 million peo- 19 was reported and only a few days before lockdown measures
ple in 2014 to 13.2 million people in 2017—former president were imposed by state governors and mayors around the coun-
Michel Temer approved a labor reform that allowed for more try, Economy Minister Paulo Guedes stated that the Brazilian
flexible work contracts. Not surprisingly, the agenda was unable economy had “its own growth dynamics” and “could perfectly
to deliver the promised surge in investors’ confidence, leading grow 2.5 percent [in 2020]” (CNN Brazil Business 2020). The
to successive frustrations in GDP growth projections since the denial phase did not last long. Less than a week later, President
recovery started in 2017. Even if the economy had continued to Bolsonaro decreed a state of public emergency, allowing gov-
grow at the same pace, Brazil would only have returned to its ernment expenditures during the pandemic to go beyond what
precrisis real GDP level by 2025—more than ten years after the is allowed by fiscal rules (including the spending ceiling). The
2014 peak. To make matters worse, since 2015, income inequal- COVID-19 crisis thus put an end to five years of austerity in
ity grew an average of 50 percent faster than it fell in the 2000s, Brazil: “the one-time star minister is being forced to reconcile
and households were still trying to cope with significant levels his free market ‘Chicago Boy’ identity with the need for massive
of debt and increasingly precarious jobs. Before the COVID-19 government intervention,” reported the Financial Times on April
crisis, Brazil counted 38.4 million informal workers (41.3 per- 28 (Harris and Schipa 2020).
cent of the labor force) and 12.5 million unemployed (11 percent
unemployment rate).
Thus, the election of President Jair Bolsonaro in 2018 hap-
pened in a context of mounting frustration. The crisis coincided
Levy Economics Institute of Bard College 9Policy Responses and the Socioeconomic Impact of COVID-19 of numerous actors in civil society. The program, originally
Brazil has adopted loose, inarticulate, and insufficient lockdown approved for three months and already extended by another
measures, as the president continuously denied scientific evi- six, transferred R$600 (around $110)14 per adult on a monthly
dence and blamed the economic collapse on state governors and basis in the first five months (and will transfer R$300 in the last
mayors who imposed any restrictive measures. On April 11th, four months) to unemployed and informal workers, as well as to
Brazil had officially reported 1,000 deaths while ranking 131st in beneficiaries of the cash transfer program Bolsa Família.15 The
an index11 that classified 178 countries with respect to strictness administrative capacity developed in Brazil for managing Bolsa
of government responses. Família and other social protection programs in the past decades
The same disregard cannot be attributed to the Brazilian helped in the implementation of Auxílio Emergencial. Brazilians
government’s fiscal response. According to the IMF’s “Fiscal who were registered as potential beneficiaries for other social
Monitor Database of Country Fiscal Measures in Response to programs but were not drawing a pension or unemployment
the COVID-19 Pandemic” (IMF 2020), the ten advanced econo- insurance were automatically qualified to receive the emergency
mies12 of the G20 spent, on average, 6.6 percent of GDP (includ- cash relief. Other informal and unemployed workers were able to
ing deferred taxes) on fighting the pandemic. The average health fill out a form through a mobile app released by the public com-
expenditures in these countries were 0.5 percent of GDP, with mercial bank Caixa Econômica Federal to apply for the benefit.
the greater part being destined for income transfers and job By July, more than 60 million people had directly received the
maintenance programs. In the ten developing economies13 of the cash transfer and more than half the population had benefited
G20, the fiscal response only added up to 2.8 percent of GDP on from it.
average, from which the same 0.5 percent of GDP was classified
as health expenditures. In other words, this group of developing
countries has spent three times less in nonhealth areas relative to
the size of their economies (and ten times less if we consider the
absolute dollar value of the response) than the advanced econ-
omies considered above. However, the same database shows a
total of 6.5 percent of GDP in additional spending and foregone
revenues in Brazil (0.9 percent of GDP in the health sector and
5.6 percent of GDP in the nonhealth sector). Brazil has thus
matched the average fiscal response of the group of advanced
economies in the G20 relative to its GDP. Its fiscal response was
smaller than that of the United States, Japan, Germany, and
Australia, but greater than that of Canada, France, Italy, Korea,
Spain, and the United Kingdom. As a consequence, fiscal pro-
jections suggest that the country will run a primary deficit of
more than 8 percent of GDP in 2020 and that public debt will go
beyond 100 percent of GDP in 2026.
Almost half of the total additional expenditures approved
by May 15, 2020 were allocated to the emergency cash relief pro-
gram Auxílio Emergencial, while the job maintenance program,
which guaranteed partial or full payment of unemployment
insurance to workers with reduced or suspended work contracts, According to a special June 2020 National Household
accounted for 22 percent of the total expenditure. Spending more Survey (PNAD-COVID) released by IBGE, cash transfers from
than 2 percent of GDP on Auxílio Emergencial was not a deci- Auxílio Emergencial more than compensated for beneficiaries’
sion made by the executive branch of the government, but rather income losses during the crisis. As observed in Figure 3, the loss
a package pushed by the national congress with the support of labor income for the bottom 50 percent of the distribution
Public Policy Brief, No. 153 10was smaller than the average per capita income gain from the inequalities that made the country so vulnerable to the health,
emergency program. While there are important methodological economic, and social effects of COVID-19.
differences between PNAD-COVID and previously conducted
surveys, data also suggests that the Auxílio Emergencial pro- Social Vulnerability, COVID-19 Infections, and Mortality
gram was responsible for reducing poverty to its lowest historical The number of reported COVID-19 cases and deaths in Brazil
level precisely during what may become the deepest recession clearly reflect the country’s deep racial and regional inequalities.
in world history (Duque 2020). When focusing on black and When the death toll reached 54,488 people, a technical report
brown respondents, the average 17 percent loss in labor income (Medeiros, Cravo, and Tatsch 2020) based on official health sta-
has been fully neutralized by the cash relief program. tistics showed that 61 percent of the dead were black or brown
Hence, the program has so far fully neutralized the pan- (categories that together make up only 54 percent in Brazil’s
demic’s initial impact on income inequality: while the PNAD- population, according to the census). In the Northeast, black
COVID survey suggests that the Gini index for per capita labor and brown people made up 82 percent of total deaths while only
income increased16 from 0.64 to 0.67 during the crisis—repre- accounting for 70 percent of the region’s population. Data from
senting a significant 5 percent rise in inequality—this index falls PNAD-COVID point in the same direction. Among respondents
to 0.56 when adding the per capita value obtained from Auxílio who declared having had at least three COVID-19 symptoms in
Emergencial in the corresponding household. the previous week, 62 percent were black and brown—a pro-
However, as the orignal benefit (approved for three months portion significantly higher than the 55 percent share of black
and then extended for another two) has been reduced by half and brown people in the full sample. For those who had more
as of September and is only approved to last until December, than six symptoms associated with COVID-19, this share goes
these numbers may change quickly. In particular, the substantial up to 66 percent. Finally, considering only those who had to
fiscal response in Brazil was not matched by an adequate expan- be hospitalized for one or more days, 60 percent are black and
sion of credit lines to businesses,17 which seems to be leading brown (this share goes up to 70 percent of those who required
to a mass bankruptcy of small firms. Until the first half of July, a ventilator).
another survey (IBGE 2020b) revealed that 716,000 companies
had closed—99.8 percent of which had fewer than 49 employ-
ees. As the small businesses going bankrupt are concentrated in
sectors in which low-skilled labor predominates (services, retail,
and construction), the crisis may continue to disproportionately
affect jobs and wages at the bottom of the distribution. A labor
market survey released in August by IBGE18 shows that between
April and June 2020, the greatest job losses happened in the food
and housing sector, domestic services, construction, and other
services (a reduction of 26.1 percent, 24.7 percent, 19.4 per-
cent, and 17.5 percent, respectively, relative to the same quarter
in 2019). In the PNAD-COVID survey, the reduction in labor
income of individuals who have at most a middle school educa-
tion was already at 18.5 percent, relative to a 13 percent decrease
for workers with a college degree or more.
As the crisis is expected to be far from over by the end of
2020, the generous but temporary Auxílio Emergencial will most
likely have only postponed the pandemic’s effect on income
inequality in Brazil. An abrupt termination of the program and a
return to austerity measures in 2021 could thus amplify the same
Levy Economics Institute of Bard College 11The evidence reflected in the deep racial inequalities in these facts could help explain why the bottom 50 percent of the
our social vulnerability index, the incidence of comorbidities, distribution seems to have a lower rate of hospitalization than
and access to healthcare may help explain such racial dispari- the 40 percent at the middle of the distribution, which includes
ties in the proportion and severity of COVID-19 infections. In socially vulnerable workers in big cities in the Southern states.
fact, racial inequalities seem to have played a more important Second, Brazil’s deep income inequalities have traditionally been
role in explaining different rates of infection and hospitalization associated with a disproportionate concentration of income at
than income inequalities for most of the population. The share the very top: the top 1 percent of Brazilians in the income distri-
of respondents in each section of the income distribution who bution receive more than one quarter of national income. As a
declared having had at least three COVID-19 symptoms in the consequence, income differences between the top and middle of
previous week corresponds exactly to its share in the total popu- the distribution are much higher than those between the middle
lation, as can be observed in Figure 4. In other words, being at and bottom, contributing to the disparities in the use of ventila-
the bottom 50 percent (or at the top 10 percent) of the income tors appearing at the top. These disparities are even more sig-
distribution in Brazil does not seem to increase (or decrease) the nificant when one takes into account that access to ventilators is
likelihood of infection. When observing the share of hospitaliza- largely concentrated in the private healthcare system, which is
tions and, even more so, the share of respondents who have been only available to the portion of the population that seems to have
put on a ventilator, disparities become apparent at the top of the been the least in need of such access.
income distribution: for the top 10 percent, the proportion of Finally, when it comes to the role of regional inequalities,
individuals who required a ventilator is only 1.6 percent. Figure 5 shows the correlation between our social vulnerability
A few hypotheses could explain this pattern. First, those at index and accumulated cases and deaths per 100,000 people.
the bottom 50 percent of the income distribution in Brazil are The Pearson correlation coefficients are calculated per day since
highly concentrated in rural areas in the country’s North and the number of cases and number of deaths first surpassed 100.
Northeast, which presented a much lower rate of infection than Panel C displays the evolution of the correlation coefficients by
metropolitan areas in the Southeast. Additionally, these are areas day, while panels A and B present scatterplots for the days in
with lower access to hospitals, as previously observed. Both which we observe the strongest correlation between the index
Public Policy Brief, No. 153 12and cases per 100,000 (May 29th) and the strongest correlation major metropolitan areas, the infection rate among this group
between the index and deaths per 100,000 (June 15th). Panels A may have started to fall, reducing this correlation in a third stage
and B show that the social vulnerability index average for each of the pandemic. A study by Gomes et al. (2020) suggests that
Brazilian state positively correlates with the number of COVID- COVID-19 infection rates start to fall after 10 percent to 20 per-
19 cases per 100,000 and COVID-19 deaths per 100,000, respec- cent of the population have been exposed to the virus. A study
tively. In panel A, we can observe that states in the North and carried out in São Paulo (Tess et al. 2020) revealed that between
Northeast regions with a higher social vulnerability index rating 15 percent and 20.9 percent of the population in Brazil’s biggest
also have a high infection rate, even if these states represent a city have already been exposed to the virus.
larger share of rural areas (less affected by the virus); high social
vulnerability in the largest cities in these two regions could help Conclusion
explain this apparent contradiction. Manaus, the capital of the As of August 8, 2020, Brazil has reported 100,000 deaths by
Northern state of Amazonas, appeared to have the fastest con- COVID-19 and may soon have the highest total accumulated
tagion rate and an explosion in mortality in the first months of deaths in the pandemic. If the disastrous response on the health
the pandemic (Orellana et al. 2020). As a consequence, mortal- front by the antiscience federal government were not enough,
ity rates in the state of Amazonas have been four-times higher this brief has demonstrated how structural inequalities played
than the national average and even in remote towns people have an important role in explaining this tragic outcome. First, our
been as likely to get sick as in New York City. Tragically, the virus social vulnerability index, built around several dimensions of
spread along the Amazon River and exacted an especially high inequality (i.e., work, transportation, infrastructure, and liv-
toll on indigenous people (Andreoni, Londoño, and Casado ing conditions) that potentially increase the risk of infection,
2020). Figure 5, panel A therefore suggests that social vulnerabil- is positively associated with the number of COVID-19 cases
ity as measured in this brief had substantial explanatory power across Brazilian states and represents deep racial, income, and
for COVID-19 infection rates. regional inequalities. Second, the country’s stark inequalities in
Examining panels B and C, we notice that the positive cor- access to healthcare due to the duality between the private and
relation between our social vulnerability index and deaths per public systems contribute to explaining why social vulnerability
100,000 is less robust. This is evidence that the factors taken into alone does not account for observed disparities in the number
account in our social vulnerability index explain the vulner- of deaths. Third, the comorbidities associated with more severe
ability to infection well, but that other factors, not taken into cases of COVID-19 are also shown to be unequally distributed,
account in our index, are important for explaining the differ- thus helping explain the observed gap between the top of the
ences in death rates. This corroborates the importance of taking distribution and the rest of the population in terms of ventilator
into consideration the differences in prevalence of comorbidi- use during the pandemic.
ties and access to health when explaining the severity of cases, as When addressing the social and economic effects of
previously discussed. COVID-19, we have shown that the substantial fiscal response
The correlation between our social vulnerability index and pushed by congress—particularly the implementation of the
the number of reported COVID-19 infections and deaths has emergency cash relief program Auxílio Emergencial during the
also changed during the pandemic, as we can observe in panel pandemic—has been able, through a reduction of poverty levels
C. It was relatively low when the country first reached 100 cases to a historical low, to neutralize the initial rise in wage inequality
in mid-March and 100 deaths at the end of March, it increased caused by the crisis. While this short-term response was insuf-
between then and the end of May, and it started to fall in mid- ficient to compensate for the effects of structural inequalities on
June. As the first reported cases have been associated with travel the country’s infection rates and death toll, it has certainly been
abroad, the virus took time to spread from elite circles to more able to prevent additional social and economic costs to the most
vulnerable areas. One possibility is that social vulnerability vulnerable. However, the future of the program is still uncertain
increased its role as an explanatory factor for infection rates as and the sharp increase in public debt during the pandemic has
the pandemic affected the entire population. As a relevant pro- already presented an opportunity for Bolsonaro’s ultraliberal
portion of the socially vulnerable were exposed to the virus in economic team to push for the return of an austerity agenda in
Levy Economics Institute of Bard College 132021 that would be even more severe than the five years of pre- Notes
COVID austerity policies. 1. In the beginning of August 2020, they ranked 5th, 9th, and
A few policy recommendations can be derived from our 11th, respectively.
analysis. In the short run, we find that allocating a sizable por- 2. Labor rights in Brazil are only enforced for employees that
tion of the budget to extending the breadth and length of social are officially registered with a worker booklet signed by the
welfare programs is sufficient to overcome the unequal economic employer (carteira assinada).
impacts of a very deep economic crisis. However, when consid- 3. With average household incomes of R$895 and R$905 and
ering the consequences of the pandemic for public health, our Gini of 0.55 and 0.57, respectively, compared to R$1600 and
results suggest that the problems of multidimensional inequality highest Gini of 0.52 in other regions.
and structural racism are of paramount importance. Deep racial 4. Since races are socially constructed, assigned at birth and
and regional differences need to be addressed through a govern- later on self-declared, ethnic background and skin pigmenta-
ment effort to permanently strengthen social welfare programs tion might not be the determinant factors in someone declaring
and public health, education, and infrastructure systems. themselves Pardo, black, or indigenous. It is important to note
Unfortunately, this does not seem to be the direction in that the term Pardo is subject to contestation and, according to
which Brazil is heading. In light of the evidence that social Carneiro (2000), “it lends itself only to aggregate those who, have
inequalities increase the breadth and length of the pandemic and their ethnic and racial identity shattered by racism, discrimina-
the presence of a deep economic recession, the threat of a return tion and the symbolic burden that blackness contains socially.”
to an economic agenda centered on cutting social expenditures 5. As is well-documented, household surveys tend to underesti-
poses major health and social risks. More generally, pursuing the mate the income at the top of the distribution. This is also true
past decades’ economic framework on a global level will acceler- for Brazil, as made clear by the combination of survey and tax
ate the same tendencies in the labor market and in inequality data in Souza and Medeiros (2017) and Morgan (2017).
that imposed very high social, health, and economic costs dur- 6. Before the 1988 constitution, public healthcare was only avail-
ing the COVID-19 pandemic, paving the way for further trag- able for formal workers and local budgets were proportional to
edies. Our analysis suggests that COVID-19 has exacerbated the contributions by taxpayers (MIS 2012). The SUS inherits many
inequalities that made the pandemic worse, thus requiring an of its regional inequalities.
even more substantial effort by governments to counterbalance 7. Some illnesses have led to higher hospitalization rates: chronic
these tendencies. kidney disease and diabetes had ICU admission rates 11 and 8.5
In this context, low- and middle-income countries with times higher, respectively; chronic pulmonary diseases had 3.4
high levels of inequality require an even more substantial fis- times more hospitalizations and 6.5 times more transfers to the
cal response to neutralize these effects. However, these are also ICU.
the countries that are more susceptible to external restrictions, 8. These proportions are higher for white Brazilians (~74 per-
capital flight, and budget constraints in the era of financial lib- cent), smaller for black and brown (~68 percent), as well as
eralization. The way our globalized world and economic system highest in São Paulo (79 percent) and lowest in Amapá (57 per-
has been shaped in the recent past can therefore be seen as a cent). Moreover, the proportion of those with some university
major comorbidity in compounding the symptoms of the pan- education or more that have been to the doctor in the last year
demic in 2020. Structural changes to the global labor market, is approximately 9 percentage points higher than for the rest of
increasing underemployment in high-income countries, and the population.
economic insecurity elsewhere are likely to widen health ineq- 9. This was a consequence of the sharp fall in oil prices and other
uities in the longer term and leave us even more vulnerable to commodities, and of generous tax cuts created by the govern-
future pandemics. ment in previous years; see Carvalho (2018).
10. For an extensive account of government responses and the
Brazilian economic and political context before the pandemic,
see Carvalho (2020).
Public Policy Brief, No. 153 1411. See Roser et al. (2020). The metrics used to calculate the Carneiro, S. 2000. “Miscigenação” Portal Geledes, August 18.
government stringency index are: school closures, workplace Carvalho, L. 2018. Valsa brasileira: do boom ao caos econômi-
closures, cancellation of public events, restrictions on public co. São Paulo: Editora Todavia SA.
gatherings, closures of public transport, stay-at-home require- ___. 2020. Curto-circuito: o vírus e a volta do Estado. São Pau-
ments, public information campaigns, restrictions on internal lo: Editora Todavia SA.
movements, and international travel controls. CDC (Centers for Disease Control and Prevention). 2020.
12. Australia, Canada, France, Germany, Italy, Japan, Korea, “Health Equity Considerations and Racial and Ethnic Mi-
Spain, United Kingdom, United States. nority Groups.” CDC website. Accessed August 5, 2020.
13. Argentina, Brazil, China, India, Indonesia, Mexico, Russia, Available at: https://www.cdc.gov/coronavirus/2019-
Saudi Arabia, South Africa, and Turkey. ncov/community/health-equity/race-ethnicity.html
14. This value corresponds to approximately 60 percent of the Chow, N., K. Fleming-Dutra, R. Gierke, Ar. Hall, M. Hughes,
Brazilian minimum wage. T. Pilishvili, M. Ritchey, K. Roguski, T. Skoff, and E.
15. Programa Bolsa Família is the largest conditional cash trans- Ussery. 2020. “Preliminary estimates of the prevalence
fer program on the planet, as it reaches out to 13.9 million fami- of selected underlying health conditions among patients
lies in poverty and extreme poverty. The program’s monthly with coronavirus disease 2019—United States, Febru-
benefit reaches up to $38, depending on the initial income and ary 12–March 28.” Morbidity and Mortality Weekly Re-
the number of children or pregnant women in the family. port 69(13): 382–86.
16. In order to calculate the effect of the crisis on the Gini index, CNN Brazil Business. 2020. “O Brasil precisa escolher: din-
we have compared what respondents declared to be the value heiro para a saúde ou para as aéreas, diz Guedes.” CNN
of labor income regularly received and what they claimed to be Brazil, March 14. https://www.cnnbrasil.com.br/busi-
their labor income in June 2020. ness/2020/03/14/se-nos-entregarmos-a-psicologia-do-
17. Pires (2020) reported in June that Brazil’s fiscal credit mea- fracasso-havera-desaceleracao-diz-guedes
sures for businesses only added up to 1.9 percent of GDP, relative Cordoba E., and A. E. Aiello. 2016. “Social Determinants of
to 29.7 percent in Germany, 15.1 percent in the United Kingdom, Influenza Illness and Outbreaks in the United States.”
6.1 percent in the United States, 4.1 percent in Singapore, and 3.8 North Carolina Medical Journal 77(5): 341–45.
percent in India. Coronavírus Brasil. 2020. “Painel Coronavírus.” Accessed on
18. Aggregate results from upcoming PNAD-Contínua. August 15. Available at: https://covid.saude.gov.br/
COVID-19 Surveillance Group. 2020. “Characteristics of
References COVID-19 patients dying in Italy: report based on avail-
Andreoni, M., E. Londoño, and L. Casado. 2020. “Brazil Heal- able data on March 20th, 2020.” Report. Rome: Instituto
th Workers May Have Spread Coronavirus to Indigenous Superiore Di Sanita. Available at: https://www.epicentro.
People.” The New York Times, July 19. iss.it/coronavirus/bollettino/Report-COVID-2019_20_
AMIB (Associação Brasileira de Medicina Intensiva). 2020. marzo_eng.pdf
“AMIB apresenta dados atualizados sobre leitos de UTI Duque, D. 2020. “Uma avaliação do auxílio emergencial parte
no Brasil.” São Paulo: AMIB. Available at: https://www. 1.” Instituto Brasileiro de Economia (IBRE) blog, August 5.
amib.org.br/fileadmin/user_upload/amib/2020/abril/28/ Furceri, D., P. Loungani, and J. Ostry. 2020. “How pandemics
dados_uti_amib.pdf leave the poor even farther behind.” IMFBlog, May 11.
Bengtsson, T., M. Dribe, and B. Eriksson. 2018. “Social Class Gao, Q., Y. Hu, Z. Dai, F. Xiao, J. Wang, and J. Wu. 2020. “The
and Excess Mortality in Sweden During the 1918 Influen- epidemiological characteristics of 2019 novel coronavirus
za Pandemic.” American Journal of Epidemiology 187(12): diseases (COVID-19) in Jingmen, Hubei, China.” Medi-
2568–76. cine 99(23): e20605
Bucchianeri, G. W. 2010. “Is SARS a Poor Man’s Disease? So- Gaskin, D. J., R. J. Thorpe, and E. E. McGinty. 2014. “Dispari-
cioeconomic Status and Risk Factors for SARS Transmis- ties in diabetes: the nexus of race, poverty, and place.”
sion.” Forum for Health Economics Policy 13(2): 1–31. American Journal of Public Health 104(11): 2147–55.
Levy Economics Institute of Bard College 15You can also read