Expanding Social Security Benefits for Financially Vulnerable Populations - A white pAper by center for community chAnge & older women's economic ...
←
→
Page content transcription
If your browser does not render page correctly, please read the page content below

Expanding Social Security
Benefits for Financially
Vulnerable Populations
october 2013

A white paper by center for community change
& Older Women’s Economic Security Task Force
About the Authoring Organizations

The Center for Community Change
The mission of the Center for Community Change (CCC) is to build the power and capacity of
low-income people, especially low-income people of color, to have a significant impact on improving
their communities and the policies and institutions that affect their lives. CCC strengthens, con-
nects, and mobilizes grassroots groups to enhance their leadership, voices, and power. We believe
that vibrant community-based organizations, led by the people most affected by social and economic
injustice, are key to creating social change. Support for the Center’s work and for the development of
this guide was generously provided by the Ford Foundation. The Campaign for Community Change
is the Center’s advocacy arm. Its work on Social Security has been generously supported by The
Atlantic Philanthropies.

Older Women’s Economic Security Task Force
In the fall of 1998, the National Council of Women’s Organizations (NCWO) formed an Older
Women’s Economic Security (OWES) Task Force to address the critical issue of Social Security
reform and to help policy makers understand women’s stake in this crucial issue. The Task Force has
worked with all NCWO members to carry out a public education campaign to reach women across
the country, and to urge them to let their representatives and candidates know their views on Social
Security reform. Task Force members work in coalition (with labor unions, senior groups, youth
advocates, disability rights groups, and civil rights organizations) to ensure the program’s continued
solvency and to improve Social Security for women and other vulnerable people by putting benefit
improvements back on the public agenda. The following organizations are all supporting members
of the OWES Task Force:

9to5                                                 National Council of Jewish Women
American Association of University Women             National Council of Negro Women
Black Women’s Health Imperative                      National Gay and Lesbian Task Force
Business and Professional Women’s Foundation         National Organization for Women (NOW)
The Center for Advancement of Public Policy            Foundation
Dialogue on Diversity                                National Partnership for Women and Families
Clearinghouse on Women’s Issues                      National Women’s Law Center
Feminist Majority                                    Organization of Chinese American Women
Hadassah                                             The U.S. Women’s Chamber of Commerce
Institute for Women’s Policy Research                OWL - The Voice of Midlife and Older Women
Jewish Women International                           Wider Opportunities for Women
MANA National Latina Organization                    Women’s Actions for New Directions
National Alliance for Caregiving                     Women’s Institute for A Secure Retirement
National Association for Female Executives           Women’s Research & Education Institute
National Association of Mothers’ Centers             YWCA
National Committee to Preserve Social Security
   and Medicare
Acknowledgements

CCC would like to thank all of the current and former staff members who worked on this report,
including Theodora Gibbs-Plessl, Conor McGovern, Sheva Diagne, Theron Guzoto, Allegra Baider,
and Steve Savner. CCC would also like to thank Mary Dailey and the entire Retirement Security team
for their valuable feedback and assistance.
     OWES would like to thank Heidi Hartmann, President, Institute for Women’s Policy Research
(IWPR); Jeff Hayes, Study Director, IWPR; Elyse Shaw, Special Assistant to the President, IWPR;
and Amy Wazlawik, National Academy of Social Insurance Summer Intern at IWPR, for their contri-
butions to drafting this white paper. OWES would also like to thank Terry O’Neil, President, Na-
tional Organization for Women (NOW) Foundation, and Jan Erickson, Director of Programs, NOW,
for their timely input.
     OWES and CCC are very appreciative to three experts who reviewed the draft report, Virginia
Reno (National Academy of Social Insurance), Joan Entmacher (National Women’s Law Center), and
Nancy Altman (Social Security Works), for their extremely helpful comments and suggestions.
Table of Contents
Introduction .....................................................................................................................................1
The Importance of Social Security to
Financially Vulnerable Populations......................................................................................3
Women and Social Security.....................................................................................................................3
Our Social Security System: How Does It Work?.............................................................................4
People of Color and Social Security.......................................................................................................6
LGBT and Social Security .......................................................................................................................8
Proposed Improvements..............................................................................................................9
Add a Caregiver Credit............................................................................................................................9
Sara Moore.........................................................................................................................................10
Restore Student Benefits.......................................................................................................................13
Charlcie Jones...................................................................................................................................14
Ensure Benefits Accurately Reflect the True Cost of Living for Seniors ........................................16
Rita Loberger.....................................................................................................................................17
Increase the Special Minimum Benefit ................................................................................................18
Hattie Wilkins.....................................................................................................................................19
Provide Equal Access for LGBT Families .............................................................................................21
Maureen Hennessey..........................................................................................................................21
Paying for Improvements, Helping to Solve Solvency Issues.................................22
Make Sure Everyone Pays a Fair Share of Social Security Contributions..........................................22
Achieve Full Employment and Broadly Shared Prosperity.................................................................23
Enact Comprehensive Immigration Reform.........................................................................................23
Additional Revenue Sources ................................................................................................................24
Conclusion........................................................................................................................................25Introduction
Our Social Security system has been and contin- Security is especially important. Social Security
ues to be vitally important to the economic se- provides nearly two-thirds of retired work-
curity of millions of workers and their families, ers with 50 percent or more of their income.2
with approximately 57 million Americans receiv- Benefits lifted more than 15.3 million men and
ing $67 billion in benefits in July 2013.1 As seen women of retirement age above the poverty line
in Figure 1, nearly 70 percent of these beneficia- in 2012.3
ries are retired workers and their families. Social Social Security’s role in ensuring economic
Security also provides essential life insurance security has become even more important in the
and disability protection, with disabled workers last few years, as many Americans find them-
and their families and the survivors of deceased selves dealing with the aftereffects of an eco-
workers making up the remaining 30 percent of nomic recession that devastated their retirement
beneficiaries. Women and children constitute the savings and the value of their homes. Despite
majority (59 percent) of beneficiaries. this turn of events, some politicians continue
Social Security goes to nearly 95 percent of to advance proposals that would reduce Social
Americans 65 and older and is the bedrock of Security benefits and weaken the program, even
retirement security for all Americans. Our Social as so many families rely on it so heavily. One
Security system is also extremely reliable; since proposal that has gotten significant attention re-
it was created, Social Security has never missed cently is adopting the Chained Consumer Price
a payment. For low-income retirees, Social Index for All Urban Consumers, also known
FIGURE 1: SOCIAL SECURITY BENEFICIARIES, DECEMBER 2012
Payment Status Men, Women, and Children
Survivors
of deceased
workers
11.0% Men
41%
Retired
workers
Disabled & families Children
workers 69.8% 8%
& families
19.2% Women
51%
Source: Social Security Administration. 2013. Beneficiary Data: Number of Social Security Beneficiaries at the End of
December 2012.
center for community change & Older Women's Economic security Task Force 1as the “chained CPI” to calculate annual cost seniors by: 1) increasing benefits across
of living adjustments. The chained CPI would the board; and 2) using a price index that
amount to a painful benefit cut for millions of accounts for seniors’ typical purchases (the
seniors, and be particularly damaging for vulner- Consumer Price Index for the Elderly or
able seniors who are most reliant on Social Secu- CPI-E) for calculating annual cost-of-living
rity. Instead of advancing proposals to cut Social adjustments.
Security benefits, now is the time to talk about ➍ Provide the lowest-wage earners who have
how we can expand benefits and make sure that significant work and caregiving history with
Social Security works even better for everyone, a guaranteed minimum benefit that is at
and specifically for those who need it the most. least 125 percent of the federal poverty line.
Social Security benefits are especially im- ➎ Ensure that married same-sex couples and
portant to populations that experience greater domestic partners (who are committed to
economic insecurity as they age — particularly each other but do not live in states that al-
women, people of color, and same-sex couples. low same-sex marriage) are entitled to the
These populations are often disadvantaged both same family benefits under Social Security
as workers and consumers, which contributes to as married heterosexual couples.
their increased financial vulnerability in retire-
ment. Social Security, from the beginning, has These critical improvements will help to
included features that partially offset the effects ensure that all workers including women, those
of workplace disadvantages. This legacy should in same-sex couples, and low-wage earners will
be built upon by the enactment of the modest have more adequate benefits and retirement
changes proposed in this white paper. security as they age.
This paper outlines the following five key Social Security is extremely popular among
policy changes that would help to build upon Americans, who overwhelmingly favor strength-
our Social Security system and help to make sure ening the program as opposed to cutting it.
that it functions even better for women, same- According to a recent survey, 84 percent of
sex spouses, and low-income people: Americans believe the current benefit levels are
not sufficient, 75 percent think we should raise
➊ Ensure workers’ retirement security is not benefits to provide a better retirement and 82
jeopardized when they must limit their time percent agree that preserving Social Security is
at their paid jobs or experience reduced necessary even if it means increasing taxes for
earnings in order to care for loved ones by all working Americans.4
creating a caregiver credit for periods of Over the past few years there have been
time when a worker, while providing care, several key reports and initiatives calling for the
has no or low earnings. expansion of Social Security benefits. Examples
➋ Provide the opportunity for vulnerable stu- include Plan for a New Future: The Impact of Social
dents, whose deceased, disabled, or retired Security Reform on People of Color, a Report of
parents are no longer able to support them, the Commission to Modernize Social Security;
to complete their education by restoring Breaking the Social Security Glass Ceiling: A Proposal
benefits through age 24 for those in post- to Modernize Women’s Benefits, by the National
secondary education programs. Committee to Preserve Social Security and
➌ Make Social Security benefits more ac- Medicare Foundation, the National Organiza-
curately reflect the actual cost of living for tion for Women Foundation and the Institute
2 expanding social security benefits for financially vulnerable populationsfor Women’s Policy Research; and the National an across the board increase in benefits, providing
Academy of Social Insurance report, Strengthening benefits to same-sex couples and their families,6
Social Security for Vulnerable Groups.5 and enhancing the special minimum benefit.7 The
Several of the policy proposals we are recom- Older Women’s Economic Security Task Force
mending to expand Social Security have already and the Center for Community Change recom-
been introduced during the 112th and the 113th mend that policymakers adopt these reforms in
Congresses. They include caregiver credits, using the 113th Congress.
the CPI-E to calculate cost of living adjustments,
The Importance of Social Security to
Financially Vulnerable Populations
Women and Social Security Women tend to outlive men, meaning they’re
living longer on less. Women who reach age 65
Although Social Security benefits are an impor- live an average of 2.1 years longer than men.12
tant source of retirement income for all older Women also have more chronic health problems
Americans, they are particularly important to old- than men, resulting in larger out-of-pocket health
er women for a number of reasons. Women tend care costs and greater use of long-term care.13
to have limited employment opportunities, lower Long-term care in particular can be very expen-
wages, interrupted work histories, fewer sources sive for women, due to their longevity and the
of retirement income, and longer life expec- fact that such care is often not covered by Medi-
tancy, which result in their experiencing greater care and most other insurance programs.14
economic insecurity during retirement. Women’s Women’s economic security in later life is
participation in the labor force has grown sub- also affected by family structure and marriage/
stantially since the 1950s, yet many women still divorce patterns. Differences between women
earn less and work less over the course of their and men in life expectancy – and the fact that
lives than men.8 As a result, many women receive women tend to marry older men – mean that
lower wage-related Social Security benefits than more women than men will no longer be mar-
men. In 2012, the average annual Social Security ried either by the time they reach retirement
income received by women 65 years and older age or at some time during their retirement
was $11,999, compared with $16,295 for men.9 years. For the same reason women will have
Women not only earn less and receive lower fewer options regarding remarriage than men.
Social Security benefits than men; they are less Marriage and divorce patterns are also chang-
likely to receive benefits from pensions as well, ing – divorce rates have increased over the
due to the occupation or industries they’ve past few decades, and many adults are
worked in, the number of hours worked, the forgoing marriage altogether. In 2010, approxi-
amount of time spent out of the workforce, and mately 27 percent of men aged 65 and older
movement between jobs.10 Even when women do were unmarried (widowed, divorced, separated
have pension income, the amount is smaller than or never married), compared with nearly 57
men’s.11 percent of women in the same age group.15
center for community change & Older Women's Economic security Task Force 3Our Social Security System: How Does It Work?
Workers are generally eligible for Social Security benefits when they have worked under
covered employment and earned 40 quarters of coverage (now also called credits). Social
Security provides monthly benefits to qualified retired and disabled workers, their qualified
family members, and qualified survivors of deceased workers. Workers earn eligibility for
Social Security benefits by contributing to the system through mandatory contributions on
wages and salary income that are matched by employers at an equal rate. These contributions
are known by the acronym “FICA,” for the authorizing legislation, the Federal Insurance
Contributions Act; the current FICA rate is 6.2 percent each for employers and employees, for
Social Security’s old age, survivors, and disability insurance protection. The self-employed pay
the combined worker and employer FICA rate. In 2013, the earnings on which payroll taxes are
paid are limited to $113,700. Earnings above that amount are not subject to FICA.
Retirement Benefits
Retiree worker benefits are calculated based on the 35 highest years of taxable earnings.
The benefit formula replaces a higher percentage of earnings of low earners than of high
earners. For an average worker, one earning about $40,000 a year, benefits replace about 40
percent of earnings. When workers contribute to Social Security, they earn “credits” toward
Social Security benefits. One credit is earned for a specific amount of annual wages. Workers
can earn up to a maximum of four credits per year. In 2013, the value of earnings required to
earn one credit is $1,160, or $4,640 per year at four credits. This amount changes yearly with
average wage changes throughout the economy.
The normal or full retirement age (the age when full benefits are available) is in
the process of increasing in stages from 65 to 67 for workers born in 1938 or later. The full
retirement age is 66 for those born between 1943 and 1954, and 67 for those born in 1960 or
later. The earliest age of eligibility for retiree worker benefits remains 62; benefits are reduced if
taken before the normal retirement age. If taken at age 62, benefits will gradually decrease from
the current level of 80 percent to 70 percent of full benefits as the higher normal retirement age
is fully implemented in 2027. A Delayed Retirement Credit is added to benefits for every month
benefits are delayed, up through age 70, if retirement is postponed beyond the normal age; the
credit increases worker benefits 8 percent per year of delay.
Social Security also provides benefits to certain family members of workers who are
eligible for retirement, disability, or survivor benefits, including spouses and minor children.
Married persons (and eligible divorced spouses) receive the larger of their own retired
worker benefit or 50 percent of their (former) spouse’s retired worker benefit (individuals
eligible for both their own worker benefit and benefits through a spouse are known as “dually
entitled”). In either case the benefit is reduced if taken between age 62 and normal retirement
age. To be eligible for these benefits a divorced person must have been married to a covered
worker for at least ten consecutive years and be currently not married.
Married (or eligible divorced) people who wait until normal retirement age may choose
to accept spousal benefits at that time and delay receiving their own worker benefits until age
70, in order to take full advantage of Delayed Retirement Credits to their own worker benefit.
Widow(er)s (and eligible divorced spouses) are entitled to a survivor benefit equal to
the deceased (ex)spouse’s retired worker benefit (if it is larger than their own retired worker
4 expanding social security benefits for financially vulnerable populationsbenefit). The minimum age for widow(er)s for receiving the survivor benefit is 60, but the
benefit is reduced if taken before the normal age. Widow(er) and surviving divorced spouse
benefits remain payable if remarriage occurs after age 60 (50 if disabled). The spousal and
survivor benefits are more generous to couples with unequal earnings than to those with total
earnings that were more equally distributed between the members of the couple. A lifelong
full-time homemaker receives a spousal benefit and survivor benefit based on the spouse’s
earnings, although s/he paid no contributions to receive these benefits. (It should be noted,
though, that s/he will not be protected against disability since s/he has not contributed.) A
spouse with low lifetime earnings may find that spousal benefits are larger than her or his
own worker benefit, in which case the spousal benefit will pertain, but the contributions paid
while working do not increase one’s benefit over the homemaker’s benefit at all (though they
do provide disability insurance protection). On being widowed, surviving spouses receive the
higher of the couple’s two benefits. The surviving spouse in an equal-earner couple will simply
retain his or her own benefit, and the deceased spouse’s benefit will disappear. The surviving
spouse in a homemaker/single-earner couple keeps two-thirds of the couple’s combined
benefits (equal to 100 percent of what the retired worker received, compared with the 150
percent the couple was receiving together).
Dependent children also receive family benefits when a parent or legal guardian retires.
Disability Benefits
Social Security pays disability benefits to people who cannot work because they have a medi-
cal condition that is expected to last at least one year or result in death. Benefits based on
covered earnings are available for qualified disabled workers below normal retirement age.
To qualify to receive disability benefits, an individual has to meet a strict definition of dis-
ability, as defined by statute and determined by the Social Security Administration, and must
have worked long enough – and recently enough – in jobs covered by Social Security. The
number of work credits needed to qualify for disability benefits depends on the age at which
a worker becomes disabled. Generally, a worker needs 40 credits, 20 of which were earned in
the last 10 years ending with the year the worker became disabled. However, younger workers
may qualify with fewer credits. For example, workers who become disabled at age 50 may
qualify if they have earned 28 credits, with at least 20 of them earned in the 10 years immedi-
ately before becoming disabled.
Certain family members may qualify to receive benefits based on the disabled worker’s
record. Spouses may qualify if they are 62 or older or if they are caring for a child of the
worker’s that is under the age of 16 or disabled. So may unmarried children under the age of
18 (or 19 if still in high school). An unmarried child over the age of 18, who has a disability that
started before age 22, may be eligible to receive benefits on a parent’s earnings record.
Each family member may be eligible for a monthly benefit of up to 50 percent of a
worker’s disability rate. There is a limit, however, to the amount that can be paid to families. In
general, the total amount a worker and her or his family members can receive is about 150 to
180 percent of the worker’s disability benefits.
If disability continues, retired worker benefits begin at the normal age without actuarial
reduction for early retirement.
All benefits are increased annually based on changes in the Consumer Price Index.
center for community change & Older Women's Economic security Task Force 5FIGURE 2: Women's Entitlement Status, 1960-2012
(All women aged 62 and older)
100%
90%
24%
80%
70%
Percentage
60%
57%
27%
Dependents
Only
50%
5%
Dually
En:tled
40%
Workers
Only
30%
39%
49%
20%
10%
0%
1960
1970
1980
1990
2000
2010
2012
Year
Source: Social Security Administration. 2013. Annual Statistical Supplement. Table 5.A14
Note: “Dually entitled” refers to women who are entitled to receive both worker benefits based on their own record and
benefits based on their spouse’s record.
At older ages the gender difference in marital either to increase their own worker benefits or
status is even more marked. In the 75-to-84 as their only means of accessing Social Security
age range, 28.1 percent of men are unmarried benefits.
compared with 62.8 percent of women. At age
85 and older, the difference is even larger - 42.3
percent of men are unmarried compared with
People of Color and Social
82.4 percent for women.16 Security
Women living alone, not surprisingly, have
less income than married couples and their People of color are more likely than whites to
incomes are often not adequate to meet their experience economic insecurity during retire-
needs. Thus, older single women experience ment for a variety of reasons. Differences in
more poverty than older married couples. educational attainment, employment discrimina-
Women who did not marry or whose marriages tion and job segregation, poverty, morbidity, and
were short-lived due to divorce also lack ac- mortality affect earnings and future retirement
cess to spousal benefits, which for the typi- income, and have led to differences in use of
cal married woman today are larger than her Social Security. Survivor and disability benefits
own worker benefits.17 Figure 2 above shows make up nearly half of the benefits received by
changes in the ways women access Social Secu- people of color, while constituting a little more
rity benefits across the past 50 years. Although than a quarter of benefits for whites.18
women have increased their access to Social Differences in employment patterns result
Security through their own work records, the in lower lifetime earnings and/or Social Secu-
majority (51 percent) still use spousal benefits rity benefits for many retired people of color
6 expanding social security benefits for financially vulnerable populationsas well. Women of color are more likely to and Hispanics receiving less than whites from
have worked in low-wage and part-time posi- every source. These disparities leave seniors of
tions, making them more vulnerable to poverty color more reliant on Social Security than white
and more reliant on Social Security because seniors (Figure 4).
they have fewer other sources of retirement Women of color are greatly affected by
income.19 African American, Latino, and Native changes in marriage and divorce patterns that
American men experience higher rates of unem- impact their economic security in retirement.
ployment and lower wages than white and Asian Among women age 55 and older, African Amer-
men.20 Latinos, who make up a large percentage ican women are the least likely to have ever been
of agricultural and household workers, are often married.22 When they do marry, women of color
disadvantaged by decisions that their employers tend to marry men of color, who often have
make, such as inconsistent wage reporting, mis- lower earnings than whites.23 Married African
classifying employees as independent contrac- American women are also more likely to have
tors, underpaying wages and/or paying wages in worked throughout their married years than
cash and not reporting them, all of which lead white women. White and African American
to the underpayment of Social Security contri- women have similar divorce rates, though the
butions and a reduced lifetime earnings record.21 latter are much less likely to remarry and are
As seen in Figure 3, racial disparities in more likely to experience widowhood.24 While
the amount of income received from earnings, African American women (and children) benefit
pensions, and assets are substantial, with Blacks from disability and survivor benefits earned by
FIGURE 3: Sources of Income Upon Retirement by Race,
Ethnicity, and Gender, 2011
$16,000
$14,000
Men
$12,000
$10,000
Women
$8,000
$6,000
$4,000
$2,000
$0
White
Black
Hispanic
White
Black
Hispanic
White
Black
Hispanic
White
Black
Hispanic
Social
Security
Asset
Income
Pensions
Earnings
Source: Fischer, Jocelyn and Jeff Hayes. 2013. “The Importance of Social Security In the Incomes of Older Americans.”
Washington, DC: Institute for Women’s Policy Research.
Note: These data are for Social Security Beneficiairies aged 65 and older.
center for community change & Older Women's Economic security Task Force 7FIGURE 4: Reliance on Social Security for 80% or 100%
of Income, 2011
70%
60%
50%
40%
30%
100%
or
more
80%
20%
10%
0%
Men
Women
Men
Women
Men
Women
White
Black
Hispanic
Source: Fischer, Jocelyn and Jeff Hayes. 2013. “The Importance of Social Security In the Incomes of Older Americans.”
Washington, DC: Institute for Women’s Policy Research.
Note: These data are for Social Security beneficiaries aged 65 and older.
their husbands (and parents), African Ameri- Proposition 8 is unconstitutional, this share rises
can women are less well served by some of the to 30 percent;27 if states that provide similar
family provisions of Social Security because of levels of protection for domestic partnerships
their high rate of singleness and more equal as for opposite sex marriage are counted, four
earnings among couples. in ten Americans (41 percent) live in a state
recognizing the mutual responsibilities for care
LGBT and Social Security and support of families headed by same-sex
and opposite-sex couples.28 Our Social Security
In 2030, according to National Gay and Lesbian system should be expanded to insure all families
Task Force projections, 72 million Americans in the event of the death, injury, or retirement
will be over the age of 65, including between of working spouses.
3.6 and 7.2 million LGBT individuals.25 At the Social Security reform for same-sex couples
same time, more states are recognizing same- becomes all the more necessary when taking
sex marriages. With the addition of Maine, into account that, due to past discrimination in
Maryland, and Washington in November 2012 the workplace, LGBT individuals have a much
and Rhode Island, Delaware, and Minnesota higher risk of poverty than heterosexual peo-
in May 2013, 18 percent of Americans live in ple.29 Typically earning lower lifetime incomes,
states (including the District of Columbia) that more than 80 percent of LGBT households also
recognize same-sex marriage.26 With the recent report raising children,30 suggesting that LGBT
Supreme Court decision holding that California households incur living costs similar to those
8 expanding social security benefits for financially vulnerable populationsof heterosexual households. LGBT women are their parent’s same-sex partner in states where
just as likely as heterosexual women to care for their parents’ marriage is recognized. While
children,31 indicating that expanding coverage of this is an enormous gain for same-sex couples
Social Security survivor, spousal, and death ben- in states where their marriages are recognized,
efits to LGBT families would greatly aid them. same-sex couples who do not live in a state
In June 2013, the United States Supreme that recognizes same-sex marriage may still be
Court held that section three of the Defense ineligible for these benefits. This discrimination
of Marriage Act is unconstitutional. As a result, prevents the spouses and domestic partners of
same-sex spouses who live in a state that legally LGBT individuals who have worked and paid
recognizes their marriage are eligible for Social into the Social Security system during the course
Security survivor and spousal benefits when of their lifetimes from receiving benefits for
their spouse has earned disability and survivor which heterosexual spouses of workers would
insurance protection. Children of same-sex qualify.
couples are now also eligible for benefits from
Proposed Improvements to Our Social Security System
Add a Caregiver Credit term care options such as in-home attendants
or nursing homes.33 In addition to the economic
Caregiving is a fundamental part of family life costs, balancing full-time work and part-time
and a vital service to young children, millions caregiving comes at a health cost: one study
of ill and disabled individuals, and a growing found that of caregivers with less than $30,000
number of elderly Americans. For the estimated in household income, 34 percent report fair or
65.7 million unpaid caregivers for the disabled poor health as compared with 3 percent of care-
and elderly, who spend an average of 4.6 years givers with incomes of $100,000 or more.34
out of the labor market during their peak work- Women in particular are negatively affected
ing years, providing caregiving services often by the economic costs of caregiving. Women
produces significant economic stress.32 The make up the majority (about 66 percent) of the
long-term negative financial impact of that lost people who provide unpaid caregiver services,
time is especially significant for low-income and thus have fewer years on average than men
families and for women, who often take on the in the paid workforce. Combined with the chal-
caregiving role. Most caregivers (61 percent) lenge of persistently lower wages due to sex
provide their services in addition to working in discrimination, this large block of lost income-
paid wage or salary jobs. earning time means significantly lower lifetime
With caregiving consuming an average of earnings and savings overall.35 When not taking
20 hours per week, many families must decide time out of the workforce, female caregivers are
how best to balance paid employment and care- more likely than males to use alternative work
giving responsibilities. This is particularly true arrangements such as taking more flexible or
for low-income families, who often cannot af- part-time jobs, which often entail losing job-
ford the costs of childcare or professional long- related benefits as well as earnings.
center for community change & Older Women's Economic security Task Force 9The formula used to calculate Social Security as their generally lower earnings each year they
benefits (based on the 35 highest earning years) work. In 2012, the average annual Social Security
means that workers who take time out of the income received by women 65 years and older
workforce or reduce their paid work hours to was $11,999, compared with $16,295 for men.36
provide care for someone receive fewer Social As the country’s elderly population contin-
Security benefits upon retirement. If the worker ues to grow and professional care costs continue
has fewer than 35 years of earnings, years of to rise, the need for informal caregiving will
zero earnings are included among the 35 aver- intensify. Currently, 13 percent of the Ameri-
aged years, which brings down the lifetime aver- can population is 65 or older and that share is
age, in turn lowering the benefit amount that will expected to grow to 20 percent (or 72 million
be paid to the worker. Women, who are more people) by the year 2030. Additionally, as life
often caregivers, average only 32 years in the expectancy grows, the number of people age 85
workforce compared with men, who average 42, or older is expected to more than triple from 5.7
and their benefits reflect this difference as well million to 19 million by the year 2050.37
Sara Moore
Sara will be 80 years old next year. She lives in Chicago, Illinois. Sara worked
her whole life, starting out as a waitress in her teens in her hometown of
Petersburg, Illinois. She then went on to work in administration for the Illinois
Humane Society and Onward House for about ten years. After that she worked
at a company that made jukeboxes for three years and then a law firm for
about ten years, and later worked as a Certified Nursing Assistant. Over the
course of her lifetime, Sara took time out of the paid workforce twice to care
for family members. The first time was to stay home with her two children when
they were infants. Later on, after her father had several strokes, she became his primary caretaker and ended
up taking 10 years out of the paid workforce to care for him. While Sara was taking care of her father in the late
1970s and early 1980s, they lived on just $300 a month – her father’s Social Security check.
After her father passed away in 1987, Sara became a paid caregiver with a homecare agency that worked
with AIDS patients. She went on to get a certificate as a Certified Nursing Assistant (CNA). This work was very
rewarding, very challenging, and very low-paid. She worked for several years taking care of AIDS patients, until
the end of her career when she got cancer and could no longer work.
Despite spending over thirty years in the paid workforce, and being the primary unpaid caregiver for her
ailing father and her children, Sara now receives a Social Security benefit that is just $953 dollars a month, or
a meager $11,436 a year, leaving her Social Security benefits below the poverty line for 2013 ($11,490 for a
single individual). Sara was married for seven years, and therefore does not receive a spousal benefit. It is very
hard for Sara to make it on her Social Security benefits, her main source of income. Without support from her
two children and food from the Lakeview Pantry and Catholic Charities, she does not know how she would
make it through. As is, she can rarely buy fresh vegetables and fresh fruit, which she loves; and she never buys
steak or candy bars, which she cannot afford.
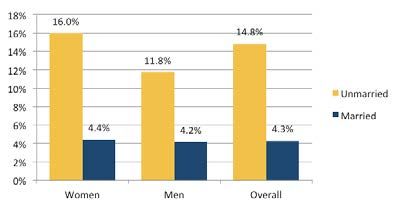
10 expanding social security benefits for financially vulnerable populationsFIGURE 5: Poverty for Women and Men Aged 65
and Older by Marital Status
Source: IWPR analysis of 2012 Current Population Survey Annual Social and Economic Supplement.
Note: Married includes married, spouses absent.
Social Security’s family benefits – those Indeed, in many countries that provide credits
provided to spouses and qualifying children of for caregiving, the primary goal is to improve
retired, disabled, and deceased workers – have benefit adequacy for women and thereby reduce
become more available since first introduced in their poverty rate.39
1939, especially by the addition of benefits for In addition to increasing benefits for
the spouses of disabled workers and for former- women (or men) who provide caregiving to
ly married spouses. Social Security, unlike public children, the disabled, or the elderly outside
pension systems in other OECD countries, marriage, caregiving credits can help equal-earn-
however, does not provide credits for caregiv- ing spouses (who also receive little by way of
ers. Thus, in the United States, unpaid caregivers Social Security’s spousal benefits) receive higher
are compensated in retirement only if they were benefits because of time spent giving care. Such
married at least 10 years or are widowed or cur- help would be available to members of gay and
rently married, which leads to some caregivers lesbian couples as well, whether their relation-
receiving relatively generous benefits while oth- ship is legally recognized or not.
ers receive no compensation for their caregiving Researchers at the Institute for Women’s
labor. 38 Policy Research have noted a wide variety of
Discrepancies in poverty rates between men objectives among countries’ caregiver credit
and women and between married and unmar- programs, including prevention and alleviation
ried individuals, along with changes in marriage/ of poverty, raising women’s employment levels,
divorce rates and family structure, highlight encouraging higher birth rates, and improving
the need for caregiver credits to help close the gender equality, all of which would affect how a
gap in poverty rates and modernize the system. caregiver credit its designed.40
center for community change & Older Women's Economic security Task Force 11TABLE 1: Dollar Amounts for a Proposed New
Caregiving Credit for Social Security
Earnings Value of Caregiving Credited Total Amount Credited
(Earnings + Caregiving Value)
$0 $21,000 $21,000
$5,000 $18,273 $23,273
$10,000 $15,545 $25,545
$21,000 $9,545 $30,545
$35,000 $1,909 $36,909
$38,500 $0 $38,500
FIGURE 6: Illustration of Credit Amounts in Relation
to Earnings and Proposed New Caregiving
Credits for Social Security
$40,000
Total
Amount
$35,000
Credited
(Earnings
+
Caregiving
Value)
$30,000
Caregiving
Value
$25,000
$20,000
Earnings
$15,000
$10,000
Caregiving
Value
$5,000
$0
$0
$5,000
$10,000
$15,000
$20,000
$25,000
$30,000
$35,000
$40,000
Earnings
Source: Hartmann, Heidi and Jeff Hayes. “What a Caregiving Credit Could Look Like.” Institute for Women’s Policy
Research.
Regardless of how a caregiving credit low-income families. Adding a caregiver credit
is designed and implemented, however, it is assigns an economic value to the essential care-
imperative that our society recognizes the value giving services provided by individuals to their
of these services and the difficult trade-offs children, spouses, parents, grandparents, and/
they present, especially for women and for or other family members, while mitigating the
12 expanding social security benefits for financially vulnerable populationslong-term disadvantages that an individual ac- achieving the American Dream. Education pro-
crues because she or he reduces paid work time duces a skilled, productive workforce and an en-
in order to provide care. gaged, participatory democracy. Unfortunately,
What could a caregiving credit look like? It postsecondary educational attainment remains
could provide an earnings credit for every year a faraway dream for many young, low- and
with a child under 6 (available to both parents middle-income Americans, who face the reality
and/or non-married partners or single par- of falling household incomes, rising tuition bills,
ents who live with the child), a disabled family and the prospect of daunting student debt.
member, or a senior in need of care, in which With private and federal financial student aid
a caregiver earns less than a set maximum (for falling in comparison to rising tuition, a fam-
example, $38,500, which is approximately the ily’s income is often the primary determinant of
average worker’s earnings in 2010). A caregiving whether or not a student will be able to go on to
credit could reward work effort so that earners postsecondary education. For students with a par-
have somewhat more money on their records ent or primary provider who is retired, disabled,
than non-earners. In the example shown here, or deceased, the financial barriers to postsecond-
the size of the credit phases out from a maxi- ary education are even greater. Our Social Secu-
mum of $21,000 (a value equal to approximately rity system steps in when a parent dies, becomes
half of average earnings) at $0 earnings to $0 of disabled, or grows old and retires from work. It is
credit at $38,500 in earnings, so that recipients the sensible candidate for distributing benefits to
would receive an earnings credit of $21,000 per such young people, and did so until 1981, when
year if they earned nothing through paid work. the student benefits were terminated, after more
This proposed caregiving credit provides than 15 years of providing effective support to
the most benefits to lower earners and those low-income youth and youth of color.
who do not work at all while caregiving, but In the wake of the Great Recession,
also rewards those who combine earning and postsecondary educational attainment is more
caregiving. Credits such as these, when added important than ever. Those with a high school
to the regular earnings of workers, will serve diploma or less make up a disproportionate per-
to increase the retirement benefits from Social centage of the unemployed population.41 Many
Security of those who have had to reduce their of the jobs available that do not require postsec-
earnings because of providing caregiving. ondary education do not pay a living wage, even
with a full-time schedule. The “college wage
Proposal: Ensure workers’ retirement security is not premium”– or the earnings gap between those
jeopardized when they have to care for loved ones by cre- who have a college degree and those who have
ating a caregiver credit in Social Security for periods of only a high school degree – is far higher today
time when a worker had no or reduced earnings because than it was when students benefits were termi-
of caregiving responsibilities. nated in 1981, and it continues to grow. Be-
tween 1981 and 2007, the earnings gap between
male college graduates and male high school
Restore Student Benefits graduates increased from 22 to 44 percent;
for women, the gap increased from 28 to 49
Higher education increases workers’ opportunity percent.42 In 2012, individuals who held at least
to achieve economic security and social mobil- a bachelor’s degree had median weekly earnings
ity, and is a critical step along the path toward of $1,066, while those who had graduated from
center for community change & Older Women's Economic security Task Force 13Charlcie Jones
Charlcie was born and raised in Nashville, Tennessee. She lived with her
mother, Theodora Etter, who had a passion for cooking and spent her career
as a chef. In 2008, when Charlcie was only 14 years old, her mother tragically
passed away from breast cancer. Charlcie went to live with her father. She
received Survivor Benefits of $1,310 per month, which helped her father to
care for her through her high school years. Since her father was a low-wage
worker, these benefits were essential for taking care of Charlcie and making
sure her needs were met.
Charlcie was a solid high school student. In her senior year, she applied and was accepted to the University of
Tennessee in Knoxville, where she planned to major in pre-law. Unfortunately, when Charlcie graduated from high
school in 2012, her Survivor Benefits ended. Although Charlcie was paying in-state tuition, had financial aid, and
received some scholarships, it was not enough to cover all of the costs associated with college (the University of
Tennessee estimates that the total cost of attendance per year for an in-state student is over $25,000).
Charlcie was determined to go to college, and she attended for one year, but was unable to afford
to continue. She is back at home this semester working for a security company on the night shift. She is
determined to save enough money to return to school next semester. If Charlcie’s survivor benefits had
continued while she attended college, she would still be enrolled in the University of Tennessee today,
pursuing the education needed for her chosen career.
high school but had not gone to college had compared to 40 percent of whites.45 These at-
median weekly earnings of $652, a difference of tainment gaps mean that thousands of bright
49 percent.43 students are being left behind, negatively affect-
The value of a college degree has nearly ing not only their families and futures but also
doubled since 1970, in terms of future earnings, the potential competiveness of the U.S. work-
but the number of students from low-income force overall.
families graduating from college is not keeping Sources of financial aid for low-income
pace. The percentage of low-income college students are dwindling, particularly at public
students graduating by age 24 grew by only 2.1 universities. After adjusting for inflation, a year’s
percentage points between 1970 and 2009, from tuition, room and board in public four-year
6.2 percent to 8.3 percent. Among students institutions has more than doubled since 1979,
from families in the highest income quartile, the reaching about $17,860 in 2012.46 The aver-
graduation rate surged by 42.2 percentage points, age Pell Grant today will only cover 10% of
doubling from 40.2 percent to 82.4 percent.44 the average cost of room, board and tuition at
There is also a clear gap in educational at- private four-year institutions, and 20% of these
tainment by race and socioeconomic status. In costs at public four-year institutions. Thirty
2012, among Americans aged 25 to 29, just 23 years ago, the average Pell Grant would have
percent of African-Americans and 15 percent covered 20% and 40% of these costs, respec-
of Hispanics had a bachelor’s degree or higher, tively .47 The other primary sources of financial
14 expanding social security benefits for financially vulnerable populationsaid are scholarships coming directly from the new graduates before they have even earned
educational institution. These have not kept up their first paycheck after graduation.50
with college costs either, and have shifted away In the past, some of these financial and ac-
from a need-based approach towards a “merit”- cessibility issues were eased by student benefits
based approach that favors students from more from our Social Security system. Children whose
affluent backgrounds. As a result, from 1995 to parents retired, died, or were disabled could
2003 total financial aid to students with family receive benefits until the age of 22, providing
incomes below $20,000 grew only 50 percent, them with financial assistance if they chose to
while total aid to students with family incomes pursue higher or vocational education. In the
over $100,000 increased 277 percent.48 peak year of 1977, nearly 900,000 students were
Because a college degree has become a de receiving these benefits, which went primarily to
facto necessity to enter or remain in the ranks of children of parents with blue-collar jobs, African
the middle class, student loans have become a Americans, and students with lower incomes.51
fact of life for students looking to make up the The 1976 Social Security Administration (SSA)
difference between dwindling aid and skyrocket- survey of the program found that 36 percent of
ing tuitions. Between 2009 and 2012, total stu- the students enrolled in college and 54 percent of
dent debt nearly tripled.49 The average amount those in community college or vocational schools
of student loan debt for the Class of 2011 was reported that they could not afford to stay in
$26,600. This represents a substantial drag on school without their Social Security benefits.
FIGURE 7: Maximum and Average Pell Grant and Average
Cost of Tuition, Room, and Board at Four-Year
Private and Public Institutions, 1979 and 2009
(constant 2009 dollars)
$40,000
$35,636
$35,000
$30,000
$25,000
Private
$20,000
Public
$14,768
$15,213
Maximum
Grant
$15,000
Average
Grant
$10,000
$6,858
$5,394
$5,777
$5,000
$2,784
$2,961
$0
1979
2009
Source: Hertel-Fernandez, A. 2010. “A New Deal for Young Adults: Social Security Benefits for Post-Secondary School
Students.” Washington, DC: National Academy of Social Insurance.
center for community change & Older Women's Economic security Task Force 15Unfortunately, postsecondary student ben- Security Administration (SSA) estimated that if
efits were phased out in 1981 under President benefits were reinstated for students through age
Reagan as part of the Budget Reconciliation 22, it would cost about 0.07 percent of taxable
Act, due to concerns about administrative errors payroll over the 75-year actuarial horizon.53
and the financial solvency of our Social Security Given the positive impact of student
system. benefits, the importance of obtaining a college
Currently, children of a working parent degree in today’s labor market, the increasing
who has died, been disabled, or retired are eligi- cost of higher education, and the decreased
ble to receive Social Security benefits until their availability of student aid, it is imperative that
18th birthday (or 19th if still in high school). vulnerable students have access to any and all
The average monthly benefit for a 17-year-old resources, including Social Security benefits,
beneficiary in 2012 was $852 for children of that can facilitate their access to higher educa-
deceased parents, $410 for children of disabled tion.
parents, and $665 for children of retired work-
ers.52 In recognition of the vital importance and Proposal: Extend Social Security children’s benefits to
rising cost of a college degree, these benefits vulnerable students whose parents have died, become
should be extended through the age of 24 to a disabled or retired in order to enable them to complete
student in postsecondary education. Although their education by restoring benefits through age 24 for
the original program provided benefits through those participating in postsecondary education.
the age of 22, the average age of students
completing their bachelor’s today is 24, so it is Ensure Benefits Accurately Re-
appropriate to extend the age. Age 24 is also
the cutoff for most other federal educational
flect the True Cost of Living for
aid programs. Seniors by Increasing Benefits
The student benefits program was an ef- Across the Board and Making
fective and valuable support for college-aged
Sure the Annual Cost of Living
students whose families were in challenging
circumstances. The two principal reasons cited Adjustment Is Based on Senior
in 1981 for the benefit elimination — adminis- Spending Patterns
trative challenge and a Social Security shortfall
— are much less relevant today. Social Security is the bedrock of financial
In the past, the difficulty of verifying student security for millions of Americans; without it,
enrollment and eligibility for the benefit often nearly half of all seniors would be poor.54 Half
caused overpayment errors. Today, vast improve- of American workers have no retirement plan
ments in electronic student verification through through their employers and, among those with
tools like the Free Application for Federal Stu- 401(k) defined contribution pension plans, the
dent Aid (FAFSA) — which is required for nearly median balance of these accounts is less than
all schools — effectively address such concerns. $30,000.55 As stock market losses and stagnat-
The cost of reinstating student benefits ing wages have made it harder and harder for
would be minimal relative to the economic and workers to save for retirement, Social Security
social value of the benefits. Although we do not has become increasingly important for millions
have a revised cost estimate for providing student of Americans. Yet for many, Social Security
benefits for students through age 24, the Social benefits fall short of what is needed to make
16 expanding social security benefits for financially vulnerable populationsrita loberger
Rita is 72 years old and lives in Tigard, Oregon. She has three children. When
they were young, she took time out of the paid work force to take care of them.
When they were grown up, she went to work at Pinnacle Risk Management
Services for 10 years. Rita originally started working in the filing department,
but injured herself moving large tax file storage boxes. After her injury, she
transferred to the data entry department. Her husband Frank also worked at
Pinnacle and was planning on retiring at age 65; but due to illness, he had to
stop working at age 62. When they both retired, Rita’s monthly check was $588 and Frank’s was $1,239. Starting
in May of 2013, Frank’s health began to significantly deteriorate. He passed away in July of 2013.
Now Rita is receiving a benefit of $1,589, on which she lives. Although she has a small 401(k) which helps
her with expenses, Rita is hardly making ends meet. She lives in a manufactured home park community; and
while she owns her home, she has to pay $700 per month in rent for the lot it sits on.
ends meet. This problem will only worsen as the Increase Benefits Across the Board
value of Social Security benefits slowly dimin- An immediate across-the-board increase would
ishes, as the result of already enacted cuts to help bring benefits up to date, particularly for
Social Security; the replacement rate for lifetime lifetime low-wage earners, women, and other
earnings is expected to drop to 39 percent of vulnerable groups. Based on May 2012 average
median household income for those retiring in benefits, a 5 percent increase would bring annual
the mid-2020s, a steep decline from 50 percent payments up from $14,400 to $15,120. In other
of median household income for those retiring words, the average beneficiary would receive an
in the mid-1990s.56 By 2030, the income replace- additional $55 per month.58 If a $55-per-month
ment rate will fall to 32 percent of previous benefit were paid as a lump sum to everyone,
income, due in part to a legislated increase to 67 this adjustment would raise benefits propor-
years for full benefits.57 tionally more for those at the low end of the
Ensuring that benefits are adequate and income distribution than it would for those at
their value does not erode over time is particu- the high end of the income distribution. This
larly important for low-income seniors, who change would cost about 0.75 percent of taxable
often do not have other sources of retirement payroll over 75 years.59
income and are extremely vulnerable to ending
up in poverty in their old age. Make Sure Benefits Keep Pace with the
In response to increasing reliance on Rising Cost of Living
Social Security benefits in the wake of grow- In order to ensure that Social Security’s benefits
ing retirement insecurity, and the slow erosion do not erode over time, as beneficiaries age and
of the value of current benefits, it is time to: 1) spend savings, the annual cost of living adjust-
increase benefits across the board and 2) use a ment (COLA) must use a consumer price index
more accurate measure to determine the annual that accurately reflects the spending patterns of
cost of living benefit increase, moving forward. older Americans. The current measure of infla-
center for community change & Older Women's Economic security Task Force 17You can also read