The National Asset Scorecard for Communities of Color (NASCC) - Race, Phenotype, and Economic Disparities: Evidence from Los Angeles, California ...
←
→
Page content transcription
If your browser does not render page correctly, please read the page content below
The National Asset Scorecard for
Communities of Color (NASCC)
Race, Phenotype, and Economic Disparities:
Evidence from Los Angeles, California

A Publication of the Samuel DuBois Cook Center
on Social Equity at Duke University
July 2021
ACKNOWLEDGEMENTS
RESEARCH TEAM:
Aaron Colston
Duke University
William “Sandy” Darity
Samuel DuBois Cook Center on Social Equity at Duke University
Lauren Russell
Harvard University
Raffi E. García
Rensselaer Polytechnic Institute and Samuel DuBois Cook Center on Social Equity at Duke University
Jorge Zumaeta
Florida International University

FUNDED BY
Ford Foundation

STUDY PARTICPANTS
The City of Los Angeles citizens who gave their time and shared their knowledge and experiences
to inform this report.
Contents

         Abstract..............................................................................................                      2
         Executive Summary.............................................................................                              3
         1. Introduction.....................................................................................                        5
         2. A Historical Perspective: Race and Ethnicity in Los Angeles..............                                                6
         3. Recent Literature: Skin Tone and Attractiveness...............................                                           8
         4. Methodology: Telephone and Face-to-Face Surveys.........................                                                 9
         5. Analysis: Skin Tone and Attractiveness.............................................                                     17
         6. Decomposition Analysis: Wealth, Earnings, & Health.........................                                            26
         7. Implications and Conclusion.............................................................                               42
         References..........................................................................................                      43
         Appendix............................................................................................                      45

The National Asset Scorecard for Communities of Color (NASCC) Race, Phenotype, and Economic Disparities: Evidence from Los Angeles, California   1
Abstract
This study builds on the “Color of Wealth: Los Angeles” report by studying the
relationship between skin tone, physical attractiveness, and socio-economic
outcomes both within and across racial groups in the city of Los Angeles. We
use novel face-to-face survey data where interviewers use standardized scales to
rate respondents’ physical attractiveness and skin tone in addition to collecting
detailed information on financial and health outcomes. We go further than similar
studies that estimate racial gaps in socio-economic outcomes by studying
racial-ethnic groups (i.e. U.S. blacks, African blacks, Mexicans, Koreans, and
Cambodians) as opposed to only racial groups (i.e. blacks, Hispanics, and
Asians). Our findings show that across African American, Vietnamese, Korean
and Cambodian participants, lighter skin tone correlates with more favorable
economic and social outcomes. The opposite pattern is found within the
Mexican community in which darker-skinned Mexicans appear to have higher
earnings than their lighter-skinned counterparts. This appears to contradict what
has been observed about preferences for lighter skin in both the U.S. and Latin
America. However, it could be explained based on the immigration patterns of
dark-skinned Mexican immigrants who first settled in the Los Angeles area. In
terms of physical
2 The Samuel DuBois Cook Center on Social Equity at Duke UniversityExecutive Summary
➤ he respondents surveyed in the face-to-face
T ➤ escriptive analyses on appearance or
D
interviews are younger than those surveyed by attractiveness rating reveal that 93 percent of the
phone: the median age is on average ten years respondents received a score of “About Average”
lower for each of the ethnic groups covered in both or above – showing a skewed distribution. Also,
surveys. As a result, reported income, net worth, skin tones with 3 or below ratings account for
marriage rates, foreign-born rates, among other approximately 60 percent of the observations
variables, are lower in the face-to-face survey. that received “Attractive” or “Very Attractive”
However, the relative ranks of each of the racial scores – showing a statistically significant
groups—in terms of key financial outcomes— correlation between attractiveness and skin tone.
were similar. The correlation is higher for Whites (-0.41), Other
Hispanics (-0.23), Koreans (-0.20), Mexicans (0.15),
➤ e compare the face-to-face survey subsamples of
W and US Blacks (-0.11). We find no significant
those that consented to have the interviewer take correlation between attractiveness and skin tone for
a picture of their faces with those that did not. We Africans and Cambodians.
use the Heckman two-stage selection model and
find statistically significant selection bias. We show ➤ e analyze skin color, attractiveness, and earnings
W
how to control for self-selection in OLS regression together and find that when we control for both
models to obtain unbiased results. attractiveness and skin tone jointly, attractiveness
is not statistically significant. In contrast, the
➤ escriptive analyses on skin complexion rating show
D coefficient for skin tone rating is significant.
the face-to-face sample is skewed towards lighter However, once we add the race variables as controls
skin tones, skin tones with rates of 3 and 4 account along with other demographic variables, skin tone
for 43 percent of the observations. We find that skin loses its significance. We find that the interaction of
tone and wealth correlation to be positive only for skin tone and attractiveness is significant even when
Other Hispanics and Korean, and it is insignificant controlling for race and different demographics.
for all other groups. The correlation between skin However, its significance goes away if interviewer
tone and earnings is negative and only significant fixed effects are added. Thus, supporting the
when accounting for the entire sample. Within- hypothesis that beauty is in the eyes of the
group correlation between earnings and skin tone is beholder.
not statistically significant.
➤ ur wealth gap decomposition results show
O
➤ LS results show that the significance for skin
O substantial differences in the average wealth
tone disappears when controlling for racial-ethnic (net worth) gap across races. For example, the
groups. However, it shows significance when difference between the average net worth of whites
interviewer fix effects are added in the regression and US Blacks is 0.80 standard deviations, with 44
– which means unobservables at the interviewer (a percent of this gap explained by group differences
proxy employer) level influences the relationship in age, education, and gender; and 66 percent
between earnings and skin tone. unexplained, showing evidence of discrimination.
On the other hand, for Africans and Mexicans, most
➤ egression results indicate that darker skin colors
R
of the gap can be explained by differences in the
are associated with lower earnings for whites and
included covariates. For Africans, the gap is 0.67
African Americans, while that was not necessarily
standard deviations with 99.9 percent explained by
the case for Hispanics or Asians.
group differences in observables. For Mexicans, the
gap is 0.78 standard deviations with 96.8 percent of
the gap explained by differences in observables.
The National Asset Scorecard for Communities of Color (NASCC) Race, Phenotype, and Economic Disparities: Evidence from Los Angeles, California 3➤ he wealth gap decomposition results based
T ➤ he results for the earnings gap decomposition
T
on skin tone differences within groups show no by skin tone within racial-ethnic groups show an
evidence of a skin-tone-driven wealth gap within earnings gap of $11,280 for US blacks, with lighter
racial-ethinic groups. For example, for U.S. Blacks, complexioned US blacks earning more than darker
we find a wealth gap of 0.02 standard deviations, complexioned individuals within the same group.
with lighter complexioned individuals having higher We find that 88 percent of the skin-shade earnings
net worth than darker complexioned individuals. gap is unexplained and statistically significant,
However, the wealth gap is not statistically providing evidence of discrimination or colorism
significant. We find similar results for Koreans and affecting US Blacks. Interestingly, we find that for
Cambodians. Although we observe an opposite Mexicans, Koreans, and Cambodians there is a
pattern with dark-complexioned individuals earning negative differential (-8,540, -$11,060, and -$7,960),
more than their light-complexioned counterparts which means that darker-skinned members of these
for the two Asian groups, the observed wealth gaps racial-ethnic groups earn relatively more than their
of 0.15 and 0.11 standard deviations are statistically lighter-skinned compatriots. However, only the
insignificant. skin-shade earnings gap for Mexicans is statistically
significant and driven mainly by unexplained factors.
➤ he earnings gap decomposition results show
T
substantial racial differences in average earnings for ➤ ur findings for the racial-ethnic group
O
most racial/ethnic groups. The gap in average 2014 decomposition on self-reported health show
earnings between whites and U.S. blacks is $23,631, significant differences in self-reported health only
with only 31 percent of the gap explained by group for Koreans and Cambodians. On average, Koreans
differences in age, education, and gender. For report a health score of 0.50 points higher than
Mexicans, the gap is $25,209 (45 percent of the gap whites, primarily due to unexplained factors. In
explained). For Other Hispanics, the gap is $25,129 comparison, Cambodians report a score 1.01 points
(46 percent of the gap explained). For Koreans, the higher than whites, as a result of both explained (43
gap is $19,237 (4 percent of the gap explained). For percent) and unexplained (57 percent) drivers.
Cambodians, the gap is $24,434 (41 percent of the
gap explained). For African Blacks, the income gap ➤ he results for the health gap decomposition by
T
is $9,611, but it is not statistically significant. When skin tone within racial-ethnic groups show significant
comparing the unexplained part of the income gap, health differences among Mexicans only. On
we see that Koreans face the most considerable average, light-complexioned Mexicans report a
income discrimination of the racial-ethnic groups, health score 0.59 standard deviations higher than
followed by US blacks, Cambodians, and Hispanics. dark-complexioned Mexicans. This effect is driven
Evidence shows no bias against African Blacks that mainly by unexplained factors.
affect their income.
4 The Samuel DuBois Cook Center on Social Equity at Duke University1. Introduction
This report builds on The Color of Wealth in Los origin groups. In addition, Los Angeles presents an
Angeles (De La Cruz-Viesca et al., 2016). It uses the urban context to study wealth both across and within
National Asset Scorecard for Communities of Color racial/ethnic groups. For this study, we compare the
(NASCC) data collected to improve understanding of asset and debt accumulation of white, native black,
the economic well-being of peoples of color in several African black, Mexican, Korean, Cambodian households.
major cities across the United States. The NASCC We also include “Other Hispanic” households that
surveys collect detailed data on assets and debts include respondents with Salvadoran and other
among subpopulations, according to race, ethnicity, and Central and South American ancestry. This allows us to
country of origin. The survey instruments were designed ultimately make comparisons both within and across
primarily to gather information about a respondent’s ethnic/racial groups.
specific assets, liabilities, financial resources, and
personal savings and investment activity at the The focus of this study is threefold: First, we aim to
household level. compare the NASCC phone survey data with the face-
to-face dataset to investigate the robustness of the
The importance of this study is further highlighted not different datasets while making external comparisons
only because Los Angeles, CA is the second-largest city to the American Community Surveys, another national
in the US, after New York City. But also because given its dataset. Second, we aim to highlight the uniqueness
location and industrial hubs, it makes the city a natural of the face-to-face survey data. Notably, we exploit
magnet for commerce and people, making it one of the different variables around skin tone, attractiveness,
the most diverse cities globally – particularly in terms of and highlight the availability of conducting additional
racial and ethnic diversity. As a result, Los Angeles is the studies related to other phenotypes (as shown in the
first metropolitan area in the US for which NASCC has respondents’ pictures). We use this information to shed
conducted both telephone and face-to-face surveys. some light on different research questions to investigate
Unlike the other NASCC instruments, the in-person, the relationship between skin tone and attractiveness on
face-to-face survey also collects information on skin socioeconomic outcomes such as net worth, earnings,
tone, attractiveness, and other phenotypes (by including and self-reported health. Third, we use the face-to-face
pictures of the respondents). survey data to conduct wealth, earnings, and health gap
decompositions across and within racial-ethnic groups
The NASCC surveys collect detailed data on assets (based on skin tones).
and debts among subpopulations, according to race,
ethnicity, and country of origin. For example, in the The rest of this report is structured as follows. First, in
telephone Los Angeles survey instead of examining the Section 2, we begin by providing a historical perspective
extent of aggregate assets among Asians collectively, on demographics changes focusing on race and
the NASCC study examines Chinese, Japanese, ethnicity in the Los Angeles MSA. Section 3 provides a
Korean, Vietnamese, Filipino, and Asian Indian ancestry brief discussion of recent literature on the intersection
groups separately, as well as separating native black of race, ethnicity, skin tone, attractiveness, and
Americans from recent black African or Caribbean socioeconomic outcomes to highlight the contribution
immigrants. Before the NASCC study, little was known of our study. Section 4 offers an overview of the NASCC
about detailed assets and debts of these different Asian methodology, compares both the telephone and the
subgroups. Thus, NASCC’s study design to address face-to-face survey, and corrects for selection in the
ethnic heterogeneity is unprecedented. subsample that agreed to take the pictures. Selection 5
discusses our findings of the analysis on the correlations
With the in-person survey, NASCC sought to replicate between skin tone and attractiveness on wealth and
and extend the previous five-city telephone-based earnings. Section 6 performs and discusses the results
survey with a survey administered via face-to-face for the wealth, earnings, and health gap decompositions
interviews conducted by RTI in Los Angeles because by racial-ethnic group and skin tone. Section 7, the
of its exceptional racial-ethnic diversity. It provides a last section, concludes with discussing some of the
shared context for identifying various ethnic subgroups, implications of our study on racial and skin tone
including blacks, Mexicans, and several Asian national disparities in the Los Angeles metro area.
The National Asset Scorecard for Communities of Color (NASCC) Race, Phenotype, and Economic Disparities: Evidence from Los Angeles, California 52. A Historical Perspective: Race and Ethnicity in Los Angeles
Colorism, prejudice against individuals with darker skin On the other hand, the black population in Los Angeles
tone among people of the same nationality, ethnic, declined by 10 percent from 2000 through 2014, due
or racial group, is prevalent in the US. The African- to different factors including an outmigration of young
American experience is a key witness to this. Those people searching for jobs or educational opportunities
lighter-skinned African-Americans who were largely the somewhere else (Arax, 2004) and retiring away from
product of relations between white masters and their the city in search for lower cost of living (Pfeiffer, 2011).
slaves often received support from masters, thus laying Such decline was accompanied by an increase in black
the groundwork for social and economic success in immigrants from Africa, the Caribbean, and other parts
the aftermath of the Civil War and Emancipation. This of the Americas who, collectively, have sustained small
pattern of success has been found to have endured for population growth of 1 percent since 2000 (“Black
decades, becoming more challenging to observe as the Population in L.A. County Declines,” 2014). According
census removed the designation of “mulatto” after 1930 to the 2013 American Community Survey’s (ACS) five-
(Reece, 2018). A central goal of NASCC is to understand year estimate sample, the three largest black immigrant
how skin tone correlates with different socioeconomic groups in Los Angeles are from Belize (16 percent),
outcomes across and within racial-ethnic groups. To Nigeria (14 percent), and Ethiopia (12 percent) (De La
understand the complexity of colorism in Los Angeles, Cruz-Viesca et al., 2016).
it is essential to understand the city’s demographic
changes in the context of its racial and ethnic history. What has driven Los Angeles to become such a melting
pot? From the beginning, Los Angeles is an odd story
Due to California’s proximity to the Pacific region of racial, ethnic, and national confluence. Making sense
and the U.S.-Mexico border, Los Angeles attracts a of Los Angeles’ racial makeup requires looking into the
sizable immigrant population from Asia, Mexico, and effects different historical conflicts, such as geopolitical
Central America. Consequently, the Los Angeles MSA conflicts and civil wars, have on the inflow and outflow
has the highest concentration of Latinos and Asians of migrants. In the case of Los Angeles, the end of the
in the nation. According to The Color of Wealth in Mexican-American War, with its accompanying annexation
Los Angeles, in 2014, Latinos made up the largest of California as a state in the Union, had a tremendous
proportion of the population (45 percent), followed by influence on the city’s ethnic and racial composition.
whites (30 percent) in the Los Angeles MSA. The share The end of the Mexican-American War opened the Los
of Asian residents was 15 percent, while for blacks was Angeles river basin to occupation by Anglo-Americans
6 percent of the total population. Among the Asian from the Midwestern and Eastern states.
ethnic groups, Chinese (including Taiwanese) made up
4 percent of the total population, followed by Filipinos Before the end of the Mexican-American War, the
(3 percent), Koreans and Vietnamese (each 2 percent), Los Angeles river basin was first occupied by the
and Japanese and Asian Indians (each 1 percent). “pobladores’’ who founded the settlement between
See The Color of Wealth in Los Angeles for a more the San Gabriel mission and the Presidio of Santa
detailed discussion (De La Cruz-Viesca et al., 2016). Barbara by the governor of Alta California were mainly
an “Afro-Mestizo” community, recruited from Sinaloa
During 2000 through 2014, significant demographic and Rosario, Mexico. (One-third of Sinaloa’s residents
changes occurred in terms of the city’s population and its were of African ancestry, and two-thirds of Rosario’s
racial and ethnic composition. For example, while the non- residents were mulattoes.) El Pueblo de Nuestra Señora,
Hispanic white population increased by 13 percent, the Reina de Los Ángeles del Río de Porciúncula (now Los
Mexican population grew by 25 percent, with the overall Angeles) was founded by eight mulattoes, two mestizo,
Hispanic population growing by 17 percent, and the Asian two Blacks, and one Mexican in 1781. Enormous land
population grew by 34 percent. Of the six largest Asian grants were in the hands of Afro-Mexicans in the San
ethnic groups (which include Chinese, Filipino, Korean, Fernando Valley, Topanga Canyon, Eastern San Gabriel
Vietnamese, Japanese, and Asian Indians), Asian Indians Valley, and Similar Valley up until the mid-nineteenth
were the fastest-growing group (60 percent), followed by century. Thus while the Mexican-American war laid the
Vietnamese and Chinese, which both grew at 38 percent groundwork for settlement, from the 1850s - 1880s,
rates (De La Cruz-Viesca et al., 2016). even as the population transferred from a combination
6 The Samuel DuBois Cook Center on Social Equity at Duke Universityof indigenous, mestizo, and white creole Californian The extent to which the wartime era was a boon in
majority population to primarily Anglo, that same fortune for people of color is up for debate. Recall first
settlement was never so great to overtake or erase the and foremost, the internment of Japanese- Americans
roots of the existing population of that time (Deverell & was still incredibly fresh. This makes it difficult to
Sitton, 7; Struthers, 20). interpret the shift in legal privileges in 1952, which
allowed Asian Americans to own land and housing;
In the latter portion of the 19th Century, migrant labor complicating the matter further is that African-Americans
to the West and Los Angeles was primarily Chinese due faced considerable discrimination in the housing market.
to large-scale labor opportunities. The influx of Chinese Thus, while opportunities to earn wages were improved,
migrants was partially thinned by the Exclusion Act of this bore out unevenly in terms of wealth.
1882 but continued through Mexico and Hawaii (not
then a state) to meet the agricultural sector’s demands, The passage of the Hart-Cellar Immigration Act of 1965
which would advance ahead of manufacturing in the was a significant turning point in the immigration history
urban center (Struthers, 18-19). of the US. The act abolished the national origins formula
that had been in place since the 1924 Immigration Act
The turn of the 20th Century was the defining period (Chan, 1991). As a result, the United States and the city
of population growth. From 1890 to 1910, Los Angeles of Los Angeles experienced a surge of immigrants from
went from 50,000 to 319,000 residents. During this Asia, Latin America, Africa, and the Caribbean that
period, we begin to see the kind of diversity of national arrived to fill a range of jobs across different industries.
origin in the demographic profile that mirrors today. In This particularly benefited the Vietnamese and
Los Angeles’ fruit-growing groves and valleys of those Cambodian communities, given the established refugee
decades’ time were Chinese, Japanese, South Asian, programs that followed the end of the Vietnam War and
Filipino, and white workers -- the latter often as convict the passage of the Indochina Migration and Refugee
labor (Struthers, 24). Act of 1975. This prompted large-scale immigration from
Southeast Asia, with most immigrants settling in the
Los Angeles takes on unique historical importance as
Midwest and California (Takaki, 1989; Chan, 1991; Ong,
a space of racial difference within an economic context
Bonacich, and Cheng, 1994).
in the era after World War II. Along with the building
of the freeway infrastructure—a mainstay of urban- The 1970s were also a difficult time for Mexican
suburban Southwestern life—elected officials and city immigrants, who had become the largest population of
planners also formed new sites (like Dodger Stadium, migrants to the U.S. The political situation surrounding
razing to the ground the neighborhood of Boyle Heights the migrant flows had changed rather drastically. The
occupied by Mexican-Americans (predominantly), but Bracero program, which actively encouraged Mexican
also European immigrants; city planners and officials labor to meet seasonal agricultural demand, was
also but sought ways to reduce interracial musical eventually replaced with a militarization policy of the
events so that blacks, Mexicans, Filipinos, and whites border. Signaling this difficulty was the struggle of farm
would not be dancing together on Central Avenue, or to laborers of the 1970s (Garcia, 2012).
curtail white visitors to the Black neighborhoods there.
(Johnson, pp.xvi, 56, 2013) Additionally, political conflicts in Central America in the
1970s and 1980s increased migration to Los Angeles
While in Los Angeles, groups of varying national origins and the United States from El Salvador, Guatemala,
formed distinct cultural boundaries - such that we can Honduras, and Nicaragua (Chinchilla and Hamilton,
call a place “ Chinatown “ or “Little Italy,” the businesses 2004). For example, one of the largest communities
and spaces of association within those boundaries can of Salvadorans in the US resides in Los Angeles. Later
hardly be called “ethnic enclaves.” Those businesses and in the 1990s, immigration from Mexico and Central
spaces became considerable points of economic gain America increased as the signing of the North American
as a function of both support within and from without Free Trade Agreement in 1994 created favorable
those boundaries. Interestingly, municipal leaders of the economic conditions and insourcing of immigrant labor
1920s tried to keep inter-racial contact at a minimum, from Mexico for U.S. firms (Kelly and Massey, 2006).
attempting to police the participation of whites at black
events and the goings -between whites, blacks, and Since the 1970s, federal spending in defense has
Mexican-Americans at their cultural festivities and stores. contributed to the Los Angeles economy. The city
Even as they acquired definition, boundaries were also became a hub for the military-industrial complexes,
porous (Johnson, p.50, 2013). helping create low-skilled assembly and manufacturing
The National Asset Scorecard for Communities of Color (NASCC) Race, Phenotype, and Economic Disparities: Evidence from Los Angeles, California 7firms alongside higher-tech firms linked to electronics This contingency of race appears in debates over what
and media (Pastor, 2001a,b). Given that most of these different cultures seem to favor in terms of skin color
jobs that were generated were of lower quality, it and attractiveness. Often, said cultures or perspectives
attracted low-skilled immigration. The city’s immigrant are influenced by colonialism, immigration, and
population multiplied during this period thanks to a assimilation into a new culture and can have social and
combination of income differentials, social networks, economic implications.
and various state policies (Modares, 2003).
Thus studying colorism within and across racial-ethnic
It is with the above considerations that we can return groups can help shed light on how social preferences for
to the question of colorism. Studies that focus on fair-skinned members of a racial group or the adoption
racial rather than skin tone differences have produced of a particular taste for light-skinned individuals (through
myriad views on disparities within the economy. At Americanization, for example) have a long-lasting
first glance, skin tone has an unclear value-added. negative effect on people with certain skin tones that
Colorism enters into analysis when we recognize that the belong to a specific racial-ethnic group.
category of race is not fixed but is itself liable to shift.
3. Recent Literature: Skin Tone and Attractiveness
Research has shown a robust empirical relationship Similarly, research has shown that attractiveness pays
between skin complexion, attractiveness, labor across different dimensions including in the labor
market outcomes, and health outcomes. Using various market, dating, social interactions, among others
nationally representative datasets, it has been proven (Adam, 1977; Biddle and Hamermesh, 1998; Mobius
that lighter complexioned individuals earn more on and Rosenblat, 2006; Hamermesh and Biddle, 1994;
average (Goldsmith et al., 2006; Goldsmith et al., 2007; Hamermesh, 2011; Scholz and Sicinski, 2015).
Rosenblum et al., 2016; Monk et al., 2021) and are more
likely to be employed in white-collar jobs (Monk, 2014). These studies highlight the role of complexion and
These gaps in outcomes can potentially be explained by attractiveness in the economic and health outcomes
two phenomena: The first is that people with darker skin for racial and ethnic minority groups. While many
tones experience higher rates of discrimination in labor studies have focused on racial gaps in outcomes, these
markets when compared to individuals of the same race studies highlight the importance of studying intra-racial
with a lighter complexion. This is supported by Monk’s inequalities driven by euro-centric ideals of physical
(2015, 2019) finding that reveals a negative relationship appearance, which impact treatment in labor markets
between skin shade and a self-reported measure of and health settings. It is imperative to measure the
the amount of discrimination someone experiences. labor market and health premiums placed on lighter
Second, people with lighter skin tones have higher complexions and attractiveness when considering the
educational attainment rates and other characteristics racial and gender differences in the distribution of skin
that increase productivity in labor markets, which leads complexion and attractiveness. For example, in Monk
to higher wages (Goldsmith et al., 2006; Monk, 2014; (2021), the author reports the distribution of interviewer-
Monk, 2016). This could potentially be explained by rated physical attractiveness for various ethnic and
differential access to education and other productivity- racial groups. The paper finds an equal distribution of
increasing resources from the time of slavery until now. attractiveness for men but differing distributions for
white, black, and Hispanic women. Specifically, the
In addition to the relationship with labor market study shows that black women are, on average, rated
outcomes, research has also shown a relationship less attractive than Hispanic and white women. Given
between skin shade and health outcomes. People the relationship between complexion, attractiveness,
with lighter complexions report higher self-reported and labor market and health outcomes, it is important
mental and physical health measures and lower rates of to investigate these characteristics as key drivers in
depression and hypertension (Monk, 2015). racial-ethnic differences and intra-racial differences in
economic and health outcomes.
8 The Samuel DuBois Cook Center on Social Equity at Duke University4. Methodology: Telephone and Face-to-Face Surveys
This report builds on The Color of Wealth in Los debt-based questions, the NASCC surveys replicated
Angeles (De La Cruz-Viesca et al. 2018). It uses the many questions found on the Multi-City Study of Urban
National Asset Scorecard for Communities of Color Inequality (MCSUI) survey. The MCSUI was a cross-
(NASCC) data collected to improve understanding of section survey of four cities—Atlanta, Boston, Detroit,
the economic well-being of peoples of color in several and Los Angeles—collected from 1991 to 1994 to gather
major cities across the United States. The NASCC socioeconomic data across ethnic and racial groups.
surveys collect detailed data on assets and debts
among subpopulations according to race, ethnicity, The data collected includes key demographic
and country of origin. The survey instruments were characteristics, such as age, sex, educational attainment,
designed primarily to gather information about a household composition, nativity, income, and family
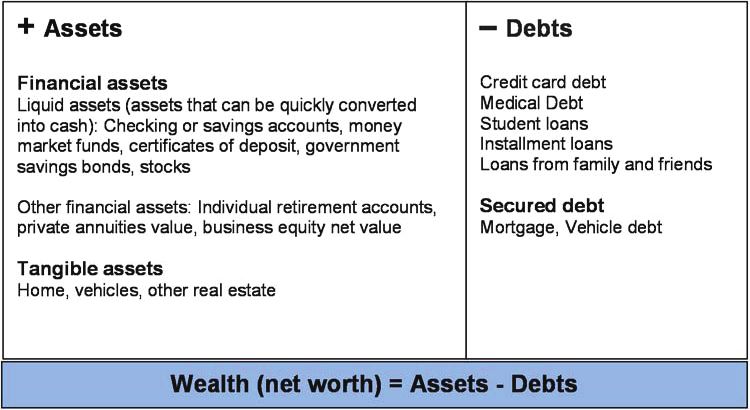
respondent’s specific assets and liabilities - including background. In addition, financial assets (savings and
financial resources, personal savings, and investment checking accounts, money market funds, government
activities - at the household level. Los Angeles is the bonds, stocks, retirement accounts, business equity,
first metropolitan area in the US for which NASCC has and life insurance) and tangible assets (houses, vehicles,
conducted both telephone and face-to-face surveys. and other real estate). Debts included credit card
Unlike the other NASCC instruments, the in-person, debt, student loans, installment loans, medical debt,
face-to-face survey also collects information on skin mortgages, and vehicle debt. We estimate net worth
tone, attractiveness, and other phenotypes (by including by subtracting debts from assets. The data also tracks
pictures of the respondents). information on remittance behavior, the act of sending
assets or other resources abroad, mostly characterized
The NASCC data used in The Color of Wealth in Los to support relatives and friends or for family investments.
Angeles report (De La Cruz-Viesca et al. 2018) was
gathered through a telephone survey conducted in While telephone interviews are effective and resource-
the Los Angeles Metropolitan Statistical Area (MSA) saving, there are several reasons for conducting
-- which includes Los Angeles and Orange counties. in-person interviews. First, face-to-face interviews
The dataset consists of data on several racial-ethnic will enable NASCC researchers to examine the
subgroups: White, US Blacks (or African Americans), phenomenon of colorism (a form of racism that involves
African, Mexican, Other Hispanics, Chinese (including prejudicial responses to an individuals’ skin shade
Taiwanese), Japanese, Korean, Filipino, Vietnamese, or other phenotypic attributes). Well-established
and Asian Indian. While the in-person survey was theoretical and empirical literature in the social sciences
also conducted in Los Angeles MSA, covering similar demonstrates that phenotype and physical appearance
subgroups as in the telephone survey. It added a new relate to various political and socio-economic issues.
subgroup, Cambodian, and excluded Chinese, Filipino, Second, phone interviews, while effective, can result in
Vietnamese, and Asian Indian. under-sampling of specific subgroups – the targeting
strategy will allow us to identify more precisely defined
The asset and debt module of the questionnaire ethnic/racial groups within larger ethnic/racial (for
found in both survey instruments replicate questions example, Asians, Blacks, Latinos, and Whites). Third,
used in the Panel Study of Income Dynamics (PSID), individuals from different cultures might feel better at
the longest-running national longitudinal household providing information in-person on sensitive topics
survey that collects data on employment, income, such as race/ethnicity and detailed questions about
wealth, expenditures, health, marriage, education, household finances.
and numerous other topics. For the non-asset and
The National Asset Scorecard for Communities of Color (NASCC) Race, Phenotype, and Economic Disparities: Evidence from Los Angeles, California 94.1 Comparison of the Phone and the Face-to-Face Surveys
Below we compare both survey instruments. The Panel A in Table 1 shows the replicated descriptive
statistics in the samples used weights based on family statistics from the telephone sample used in The Color
characteristics in the U.S. Census Bureau’s ACS to of Wealth in Los Angeles report. Although 733 interviews
generate results representative of specific ethnic group were conducted, 682 responses provided information for
characteristics in the respondent’s metropolitan area of most, if not all, of the questions. In comparison, Panel B
residence. In The Color of Wealth in Los Angeles report, shows the descriptive for the in-person sample with 512
it was found that overall, the results computed from total responses.
the unweighted NASCC sample are not dissimilar from
those using the weighted NASCC sample, suggesting The telephone sample (Panel A) shows that educational
that the specific ethnic group observations in the attainment rates varied significantly by race and
metropolitan areas covered by the study were fairly ethnicity, with a higher proportion of African black
representative of their populations at large. We also (58.9 percent), Chinese (68.4 percent), Japanese (68.6
incorporate the ACS-based weights in our analysis for percent), Korean (57.1 percent), Filipino (76.7 percent),
consistency but focus on the comparison across the and Asian Indian (79.2 percent) heads of household
samples generated with the different instruments as having a bachelor’s degree or higher compared to
opposed to a comparison to the ACS MSA population – whites (56.9 percent). Only Mexican, other Hispanic,
the latter was studied in detail in The Color of Wealth in U.S. Black, and Vietnamese household heads were
Los Angeles (De La Cruz-Viesca et al. 2018). less likely than Whites to hold a bachelor’s degree or
higher—17.8 percent, 45.7 percent, 44 percent, and 36.5
It is essential to highlight some of the limitations percent, respectively. In comparison, in the in-person
of the NASCC data. First, given the detailed data sample (Panel B), we find that all subgroups have lower
collected on assets and debt types, some variables educational attainment rates than in the telephone
have missing responses, presenting some challenges. sample. Whites have the highest rate at 44.1 percent,
Second, both surveys are cross-sections and not and Other Hispanics the lowest rate at 2.5 percent.
longitudinal panel data providing only a snapshot of the
individual households interviewed. Therefore, historical
comparisons cannot be made since only one year of
data is available. Third, the surveys are not nationally
representative because of their focus on comparisons
within the Los Angeles metropolitan area.
10 The Samuel DuBois Cook Center on Social Equity at Duke UniversityTABLE 1. Table Telephone Survey: Color of Wealth Report
Number Bachelor’s Median Median
Ethnicity/ of Degree or Married Median Foreign Family Household
Variables Observations Higher (%) (%) Age Born (%) Income Wealth
PANEL A: TELEPHONE SURVEY
White 56 56.90% 49.40% 63 10.80% 95,000 355,000
US Black 45 44.00% 28.00% 59 0.80% 53,500 4,000
African Black 23 58.90% 59.20% 54 100.00% 115,000 72,000
Mexican 100 17.80% 45.30% 45 64.20% 50,000 3,500
Other Hispanic 31 45.70% 37.00% 62 75.30% 40,000 42,500
Chinese 75 68.40% 54.20% 53 70.30% 70,000 408,200
Japanese 68 68.60% 48.50% 63 29.90% 75,000 592,000
Korean 77 57.10% 57.90% 57 90.50% 60,000 23,400
Filipino 42 76.70% 52.70% 59 87.60% 80,000 243,000
Vietnamese 124 36.50% 55.20% 51 92.60% 50,000 61,500
Asian Indian 41 79.20% 70.50% 50 96.80% 100,000 460,000
PANEL B: FACE-TO-FACE SURVEY
White 90 44.30% 31.60% 50 21.90% 45,000 129,500
US Black 142 10.20% 15.10% 44 5.40% 15,000 2,500
African Black 24 17.90% 22.20% 48 47.20% 15,000 21,500
Mexican 86 4.10% 24.70% 34 41.80% 25,000 5,000
Other Hispanic 32 2.50% 33.10% 38 44.60% 17,000 600
Korean 71 26.40% 55.50% 55 97.20% 45,000 35,000
Cambodian 65 10.70% 38.60% 51 79.10% 23,000 3,020
In the telephone sample, African Black, Chinese, Korean, approximately younger by ten years or so, with again
Vietnamese, Filipino, and Asian Indian households Mexican households being the youngest and Koreans
were more likely to include married couples than white the oldest.
households (49.4 percent). In contrast, only Korean
homes in the face-to-face sample have a likelihood It is important to note that given that the respondents
of over 50 percent to include married couples at 55.5 surveyed in the face-to-face interviews are younger
percent. US Black households had the lowest likelihood than those surveyed by phone, by an average median
at 15.1 percent. The telephone sample is skewed toward age difference of 10 years for all groups, the reported
those older in the life cycle with the predominant ages education attainment rate, marriage rate, income, and
ranging from 45 to 63 years old -- these are persons who net worth positions are reasonably lower in the face-to-
have had the opportunity to accumulate assets over face survey. However, despite these differences, we find
time. Mexicans tend to be the youngest and whites, and that the subgroup rank order tends to remain reasonably
Japanese the oldest in the telephone sample. While in consistent across both surveys.
the in-person sample, the range was 34-55 years old,
The National Asset Scorecard for Communities of Color (NASCC) Race, Phenotype, and Economic Disparities: Evidence from Los Angeles, California 11The percentage of foreign-born within racial-ethnic foreign-born in the phone sample with over 90 percent
subgroups can help paint a picture regarding for African, Korean, Vietnamese, and Asian India. In
convergence in socioeconomic measures. For example, contrast, White and US Black households have the
the composition of new immigrants relative to US lowest foreign-born percentages, 10.8 percent and 0.8
citizens within a subgroup can distort the average percent, respectably. In the in-person sample, we see
income, education attainment, health, and wealth only Korean with over 90 percent foreign-born at 97.2
factors. This is likely the case for Mexican households, percent. In comparison, the percentage of foreign-born
for whom an increase of new immigrants with lower Whites increases to 21.9 percent. US Blacks have the
education levels than the Mexican American households lowest rate of foreign-born at 5.4 percent in the in-
brings the average down. We see a high percentage of person sample.
TABLE 2. Comparing the Averages of the Two Surveys
Phone Survey Face-to-Face Survey Difference
Variables mean sd mean sd Difference t-stat
Bachelor’s Degree or Higher 0.51 0.50 0.17 0.38 0.36*** (13.95)
Married 0.51 0.50 0.29 0.45 0.23*** (8.11)
Age 53.96 16.40 45.87 16.59 7.47*** (7.79)
Foreign Born 0.66 0.47 0.40 0.49 0.25*** (8.68)
Family Income 85358.38 92072.24 41912.12 58737.87 40269.86*** (8.34)
Household Wealth 387536.14 644474.48 218447.24 860896.77 209829.19*** (3.49)
White 0.08 0.27 0.17 0.38 -0.09*** (-4.72)
US Black 0.07 0.25 0.29 0.45 -0.21*** (-9.62)
African Black 0.03 0.17 0.05 0.21 -0.01 (-1.13)
Mexican 0.15 0.35 0.18 0.38 -0.02 (-1.09)
Other Hispanic 0.05 0.21 0.06 0.24 -0.02 (-1.28)
Korean 0.11 0.32 0.12 0.33 -0.03 (-1.32)
Observations 682 510 1194
Typically, White households have higher incomes than household wealth at $3,500. Whites have the highest
nonwhite groups. However, we find some exceptions in median wealth for the in-person sample at $129,500 and
the NASCC data – African Blacks and Asian Indians tend the only group with mean wealth above $100,000.
to earn more than Whites in the telephone sample. In
the in-person sample, Whites and Korean households In Table 2, we perform some statistical tests to
have the highest median family income. In terms of compare the means of the two surveys. We can confirm
median household wealth, Japanese have the highest statistically that the phone survey includes households
median wealth at $592,000, followed by Asian Indian with higher education attainment rates, married couples,
($460,000), Chinese ($408,000), White ($355,000), and older, foreign-born rates, family income, and household
Filipino ($243,000) in the phone sample. The rest of wealth. In contrast, the face-to-face survey consists of a
the groups have a median household wealth of less higher proportion of White and US Black households.
than $100,000, with Mexican having the lowest median Both surveys are similar in the composition of African
Black, Mexican, Other Hispanic, and Korean.
12 The Samuel DuBois Cook Center on Social Equity at Duke University4.2 Comparing the Face-to-Face Subsamples: Picture vs. No Picture Consent
A unique feature of the in-person survey is that it pictures and those that did not in the in-person sample.
incorporates taking pictures of the respondents. We find that respondents who consented to have their
Researchers find this useful to study questions related photo taken had higher education attainment rates,
to skin tone, attractiveness, and other phenotypes lower family income, and were more likely to be White
on socioeconomic outcomes. Table 3 compares the and Cambodian and less likely to be US Black.
subsamples of those that gave consent to take their
TABLE 3. Comparing the Subsamples: Picture vs. No Picture Consent
No Picture Consent Picture Consent Difference
Variables mean sd mean sd difference t-stat
Bachelor’s Degree
or Higher 0.11 0.31 0.22 0.42 -0.11** (-3.24)
Married 0.3 0.46 0.29 0.45 0.00 -0.07
Age 46.06 15.76 45.71 17.3 -0.15 (-0.10)
Foreign Born 0.41 0.49 0.39 0.49 0.01 -0.15
Family Income 33612.02 47657.54 49076.76 66095.99 -15585.76** (-3.12)
Household Wealth 131646.09 330578.41 271967.08 1060967.63 -151500.33 (-1.85)
White 0.12 0.33 0.22 0.41 -0.10** (-3.14)
US Black 0.37 0.48 0.22 0.41 0.15*** -3.85
African Black 0.07 0.25 0.03 0.17 0.04 -1.95
Mexican 0.17 0.37 0.18 0.39 -0.01 (-0.18)
Other Hispanic 0.08 0.28 0.04 0.21 0.04 -1.8
Korean 0.14 0.34 0.11 0.32 0.03 -0.95
Cambodian 0.05 0.22 0.2 0.4 -0.15*** (-5.30)
Observations 239 271 512
The results in Table 3 highlights the selection issue of Tables 4-5 show the application of the inverse Mills
consenting to take a picture. Hence, to generate useful ratio (also known as the non-selection hazard) to take
inferences about our subsamples, we would need to into account potential selection bias. Heckman (1976)
correct for selection. We can use several methods to proposed a two-step selection correction model
accomplish this, including using the Heckman selection (Heckman, 1976) using the inverse Mills ratio. In the
model and controlling for unobservables such as adding first stage, a probit regression is modeled using the
fixed effects (in our case, interviewer fixed effects). In observed positive outcomes (in our case, a consent
Table 4, we conduct both. to take a picture). In the second stage, the estimated
parameters are used to obtain the inverse Mills ratio,
which is then included as an explanatory variable in the
OLS estimation.
The National Asset Scorecard for Communities of Color (NASCC) Race, Phenotype, and Economic Disparities: Evidence from Los Angeles, California 13Table 4 shows the first step – probit regression results. to take the picture. Column (2) adds the interviewer’s
Column (1) consists of the respondent characteristics perception about the respondent, such as attractiveness,
such as demographics, education, income, wealth, skin tone, friendliness, perception of how well the
among others, as controls. It also includes the respondent understands English, and openness. Again,
respondent’s opinions on the economy, the future the assumption is that the interviewers’ perception
economy, and personal finances. The assumption here matters to the respondent and can influence the
is that these variables can influence the decision to opt respondent’s cooperativeness.
TABLE 4. Heckman Selection Correction – Step 1 for Picture Consent in the Face-to-Face Sample
(1) (2) (3)
Inverse Mills Ratio -0.541***
(0.035)
BA or Higher Degree 0.479** 0.526**
(0.222) (0.256)
Married -0.102 -0.022
(0.179) (0.197)
Age 0.001 0.005
(0.005) (0.006)
Foreign Born -0.475** -0.498**
(0.205) (0.236)
Family Income 0.000 0.000
(0.000) (0.000)
Wealth 0.000 0.000
(0.000) (0.000)
U.S. Black -0.381 -0.899***
(0.259) (0.347)
African -0.420 -0.896*
(0.413) (0.494)
Mexican -0.015 0.022
(0.274) (0.310)
Other Hispanic -0.124 -0.176
(0.349) (0.399)
Korean -0.249 -0.517
(0.292) (0.374)
Cambodian 1.137*** 0.786*
(0.360) (0.421)
Female 0.341** 0.407**
(0.156) (0.170)
Positive View on Economy -0.185 -0.180
(0.172) (0.185)
14 The Samuel DuBois Cook Center on Social Equity at Duke University(1) (2) (3)
Positive View on Next Year 0.150 0.022
(0.161) (0.169)
Positive View on Personal Finances -0.136 -0.257
(0.155) (0.170)
Attractive 0.217
(0.190)
Light Skin -0.662***
(0.233)
Friendly 0.683***
(0.224)
Understands English Well -0.090
(0.293)
Openness 0.885***
(0.233)
Observations 334 334 334
Adjusted R2 0.299
In Step 1 – the probit model shows that BA or higher in our OLS model, as suggested by Heckman (1976).
degree, Cambodian (White are the reference group – Column (1) is the same as column (3) in Table 4. Column
hence, not shown), Female, friendliness, and openness (2) regresses the standard controls on the picture
increase the probability of agreeing to take the picture dummy; it shows consistent signs and significance as
while foreign-born, US Black, African, and light skin the respective column in Table 4. Column (3) adds the
decrease such likelihood. We use column (2) results to inverse Mills ratio and shows the coefficient still negative
calculate the Inverse Mills Ratio and regress this measure and statistically significant. Column (4) is the same as
against the picture consent binary dependent variable column (2) but now with interviewer fixed effects – since
using OLS in column (3). As expected, the coefficient it is possible that unobservable from a researcher’s
for the inverse Mills ratio is negative and statistically point of view as it relates to the interviewer might affect
significant at the 99% level. The interpretation is that the the decision to consent to take the picture such as
selection bias causes respondents not to want to agree the tone of voice of the interviewer, personality, etc.
to take the picture. The group that does is statistically When interviewer fixed effects are included, US Black,
different from those that do not. Cambodian, and Female lose statistical significance
while Korean gains significant. In other words, for US
We use the inverse Mills ratio in our standard OLS Black, Cambodian, Korean, and Female interviewers’
model as one of the independent variables, as shown in characteristics matter in deciding on whether to accept
Table 5. It is important to point out that we exclude both to take a picture.
the respondent and interviewer’s perception variables
The National Asset Scorecard for Communities of Color (NASCC) Race, Phenotype, and Economic Disparities: Evidence from Los Angeles, California 15TABLE 5. Heckman Selection Correction – Step 2 for Picture Consent in the Face-to-Face Sample
(1) (2) (3) (4) (5)
Inverse Mills Ratio -0.541 ***
-0.515 ***
-0.439***
(0.035) (0.053) (0.064)
BA or Higher Degree 0.141** 0.016 0.139* 0.024
(0.070) (0.063) (0.073) (0.068)
Married -0.026 0.010 -0.070 -0.025
(0.060) (0.052) (0.062) (0.055)
Age 0.001 0.000 -0.001 -0.002
(0.002) (0.002) (0.002) (0.002)
Foreign Born -0.160** -0.009 -0.118* 0.014
(0.070) (0.067) (0.067) (0.067)
Family Income 0.000 -0.000 -0.000 -0.000
(0.000) (0.000) (0.000) (0.000)
Wealth 0.000 0.000 0.000 0.000
(0.000) (0.000) (0.000) (0.000)
U.S. Black -0.159* -0.021 0.062 0.166**
(0.091) (0.083) (0.085) (0.081)
African -0.163 0.002 -0.133 -0.023
(0.154) (0.131) (0.163) (0.151)
Mexican -0.024 -0.019 0.011 -0.008
(0.096) (0.083) (0.095) (0.081)
Other Hispanic -0.052 0.003 -0.003 0.034
(0.133) (0.114) (0.111) (0.102)
Korean -0.104 -0.044 -0.260* -0.190
(0.104) (0.093) (0.136) (0.131)
Cambodian 0.311*** 0.033 0.174 0.002
(0.093) (0.087) (0.143) (0.137)
Female 0.107** 0.013 0.059 -0.006
(0.053) (0.048) (0.057) (0.054)
Interviewer FEs No No No Yes Yes
Observations 334 334 334 293 293
Adjusted R2 0.299 0.100 0.273 0.282 0.395
Column (5) adds the inverse Mills ratio to column opportunity to study the phenomenon of race, ethnicity,
(4). It shows that the coefficient for the Inverse Mills and colorism and its implications in one of the major
ratio remains negative and significant when adding cities in the US. For example, given the technological
interviewer fixed effects. Evidence that selection bias advances of the last decade, more and more decisions
is present in the subsample of picture takers. Future and transactions are made by a machine learning
researchers using this data should correct for such algorithm that sometimes amplifies the biases of the real
selection bias, as shown here. world. Understanding the implication of race, ethnicity,
and colorism and their challenges is important for equity
A key takeaway is that both survey samples – the in the US.
telephone and the face-to-face surveys – provide the
16 The Samuel DuBois Cook Center on Social Equity at Duke University4.3 Potential Uses of the Photos in Research
Our results thus far have been informative for the appearance-based and context-based perceptions
direction researchers can plan to take in using the phone of financial outcomes and actual financial outcomes.
survey photos to analyze the effects of appearances on Pictures will be presented to different groups of
financial outcomes. A research idea with great potential students in various predetermined contexts, providing
is to recruit student volunteers to rate and categorize some groups with information on the respondent’s
physical appearance, not only on appearance and skin attributes such as education or marital status, giving
shade but also on dimensions such as “Afrocentricity,” us opportunities to analyze the predictive power and
and have machine learning algorithms do the same effects of contextualized appearances. Data from such an
to identify potential human vs. machine learning bias. experiment could explain why some financial outcomes
In addition to using the photos to rate appearances, are linked to appearances while others are not.
photos will be used to test relationships between
5. Analysis: Skin Tone and Attractiveness
One of the salient features of the face-to-face survey is not have a skin shade rating provided – out of these four
the inclusion of information on skin tone, attractiveness, were US Blacks, one Mexican, and one Other Hispanic.
and other phenotypes (by including pictures of the As seen on the matrix in Table 6, most whites have
respondents). Interviewers were asked to rate the ratings of 1 or 2. In contrast, US Blacks tend to have a
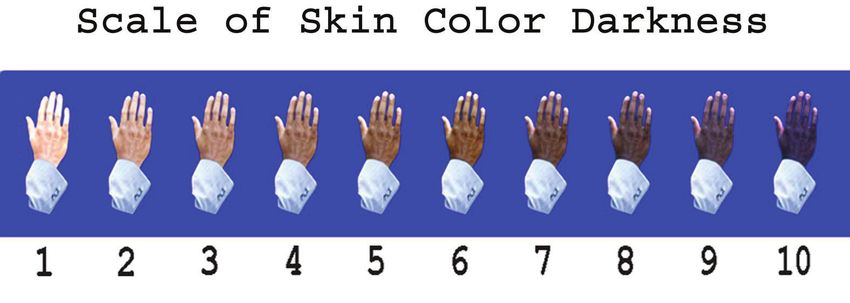
respondent’s skin color on a scale of 1 (lightest) to 10 broader range (2-10 rating), with most US Blacks falling
(darkest), using the spectrum shown in Figure 1. We within the 4-7 skin tone ratings. African Blacks also have
consider skin ratings of 1-3 as “light” skin, a rating of 4-6 a wide range (3-9 rating), with most having ratings of
as fair skin, and 7-10 as “dark” skin. 6-8, while Mexicans tend to fall in the lighter skin tones,
ranging from 1-5, with a 3 rating as the median. This is
Table 6 presents the distribution of skin tone ratings by similar for Other Hispanics.
racial group. From a total of 512 cases, only six cases did
FIGURE 1. Scale of Skin Color Darkness
Interestingly, for Koreans, the median rating is a 4, that the average skin tone rating is 4, which also is the
darker than the median for Mexicans, which goes rating with the highest frequency counts with almost
against some of our ex-ante expectations given some of 25 percent of the cases. It is followed by rating number
the stereotypical images in media outlets. On the other 3; jointly, these two skin tone ratings account for 43.2
hand, Cambodians have a very similar distribution as percent of the cases.
Mexicans and Other Hispanics. In aggregate, we find
The National Asset Scorecard for Communities of Color (NASCC) Race, Phenotype, and Economic Disparities: Evidence from Los Angeles, California 17TABLE 6. Skin Tone Rating
Racial Ethnicity / 1 2 3 4 5 6 7 8 9 10 Total
Skin Tone Rating
White 48 28 11 2 1 0 0 0 0 0 90
US Black 0 1 12 33 34 26 22 7 2 2 139
African 0 0 2 2 1 5 6 5 2 0 23
Mexican 6 15 30 23 12 0 0 0 0 0 86
Other Hispanic 2 9 10 4 4 2 0 0 0 0 31
Korean 6 10 8 45 2 0 0 0 0 0 71
Cambodian 2 14 23 14 13 0 0 0 0 0 66
Total 64 77 96 123 67 33 28 12 4 2 506
Other
White US Black African Mexican Hispanic Korean Cambodian
Mean 1.69 5.34 6.46 3.2 3.11 3.38 3.33
Median 1 5 7 3 3 4 3
N 90 139 23 86 31 71 66
5.1 Skin Tone and Wealth
As found in The Color of Wealth in Los Angeles, wealth relate to our sample. For instance, the within group
differentials across racial-ethnic groups are far more subsamples are smaller – these results are for a total
pronounced than income differentials. We explore of 242 cases for which the natural logarithm of net
the relationship between skin complexion and wealth, wealth values was able to be calculated (compared to
particularly household net wealth, measured as all assets the 512 observations in the full sample). Missing values
minus all debts. Table 7 shows the linear correlations and those with zero or negative net worth values were
between skin tone and the natural logarithm of wealth. dropped when we take the natural log. Also, there is
Note that correlation coefficients are obtained using not enough skin color variation for whites to detect a
a simple OLS model with wealth as the dependent relationship between skin shade and wealth. In addition,
variable and skin tone as the independent variable. the sample size for African immigrants is small, with
Hence, the correlation coefficient measures a linear fit, only three skin tone ratings receiving more than five
and it could be higher than one. The findings show that cases. For African Americans, most were rated as having
the correlation between wealth and skin tone is negative a medium or dark complexion, and the differences in
but statistically insignificant when considering all cases. wealth for them are small. However, it is noteworthy
The coefficient within each racial-ethnic group reveals a that light-skinned African Americans have a much
positive and statistically significant correlation only for higher median wealth than the other groups – but
Other Hispanics and Koreans. For the other groups, we we have a small number of observations (a total of 6).
observe no statistical significance. The sample provides more variance in skin shades for
Mexicans and Cambodians, but we did not find the
There are numerous reasons, both empirical and correlation between wealth and skin shades to
theoretical, why we might not see a correlation between be statistically significant.
wealth and skin tone in our sample. A set of reasons
18 The Samuel DuBois Cook Center on Social Equity at Duke UniversityYou can also read