Identifying Potential Freeway Segments for Dedicated Truck Lanes
←
→
Page content transcription
If your browser does not render page correctly, please read the page content below
Identifying Potential Freeway Segments for Dedicated Truck Lanes

                                Submitted By:

                            Christopher J. Espiritu

                       A Thesis Quality Research Project
           Submitted in Partial Fulfillment of the Requirements for the
              Masters of Science in Transportation Management

                         Mineta Transportation Institute
                           San Jose State University

                                   June 2013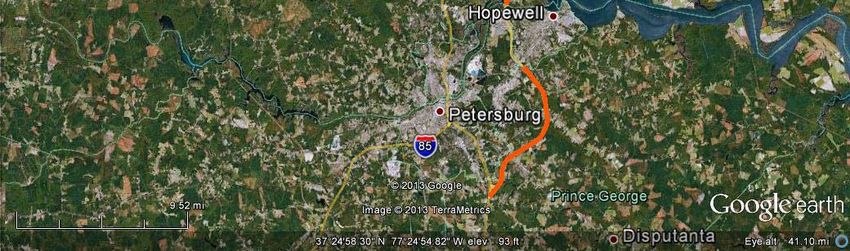
Acknowledgements
My greatest appreciation goes to Dr. Peter Haas and Rod Diridon for guiding me through this
process. A special thank you goes to Dr. Nick Compin and Dr. Amelia Regan for their guidance
and support of this project. My appreciation also goes to the representatives of the Caltrans
Traffic Data Branch, Georgia DOT, Virginia DOT, Washington DOT, Oregon DOT, and NJ DOT;
this project would not be possible without your great work. A special thank you also goes to
Viviann Ferea for all the help and support over the last couple of years.

This is dedicated to my loving family. To my sister (Charity) and my brother‐in‐law (Dave), for
their unfailing support and encouragement. To my beloved Susan, for her support and patience.
And finally, this is dedicated to my mother (Deborah), who I have dearly missed over the last
year and a half since starting this program.

                                                                                        Page 2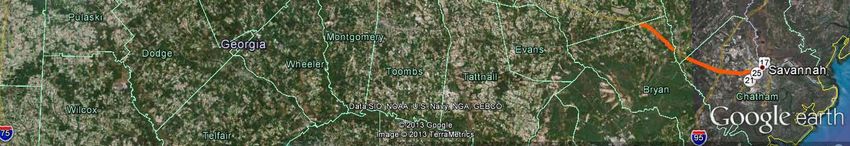
Table of Contents
BACKGROUND ............................................................................................................................................... 5
INTRODUCTION ............................................................................................................................................. 8
RESEARCH FOCUS........................................................................................................................................ 10
LITERATURE REVIEW ................................................................................................................................... 13
RESEARCH DESIGN ...................................................................................................................................... 24
METHODOLOGY .......................................................................................................................................... 30
   Introduction ............................................................................................................................................ 30
   Description of Analytical Metrics ............................................................................................................ 30
       Study Period ........................................................................................................................................ 31
       Traffic Volumes ................................................................................................................................... 31
       Truck Volumes..................................................................................................................................... 32
       Freeway Segment Length.................................................................................................................... 32
       Crash Data Statistics............................................................................................................................ 32
       Goods Movement Network ................................................................................................................ 33
       Other Metrics ...................................................................................................................................... 34
       Summary ............................................................................................................................................. 35
DATA COLLECTION / ANALYSIS ................................................................................................................... 35
FACILITIES ANALYZED .................................................................................................................................. 38
       California ............................................................................................................................................. 38
       Georgia ................................................................................................................................................ 40
       Washington ......................................................................................................................................... 42
       Virginia ................................................................................................................................................ 43
       Oregon ................................................................................................................................................ 44
       New Jersey .......................................................................................................................................... 45
NOTE ON FACILITIES ANALYZED .................................................................................................................. 46
RESEARCH SUMMARY ................................................................................................................................. 48
   Key Findings ............................................................................................................................................ 48
RESEARCH QUESTIONS ‐ EVALUATION ....................................................................................................... 53
RESEARCH OBSERVATIONS ......................................................................................................................... 58
RECOMMENDATIONS AND CONCLUSION................................................................................................... 59
BIBLIOGRAPHY ............................................................................................................................................ 62

                                                                                                                                                        Page 3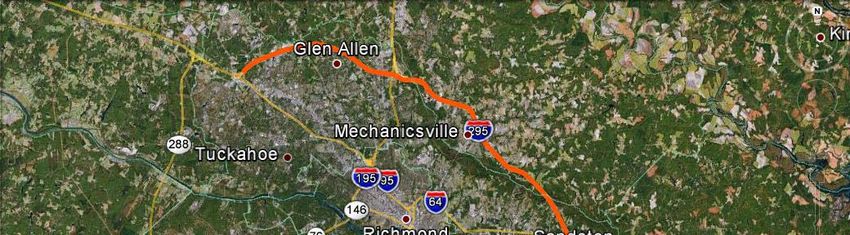
APPENDIX A: SCOPE OF WORK.................................................................................................................... 66
APPENDIX B: FHWA – ANNUAL TRUCK GROWTH (1900‐2010) .................................................................. 68
APPENDIX C: LOCATION OF ROADWAY SEGMENTS ANALYZED.................................................................. 69
List of Figures
Figure 1 – Fatalities in Crashes Involving Large Trucks (2001‐2010)……………………………...……………………….16
Figure 2 – Fatalities in Crashes Involving Large Trucks (2001‐2010)……………………………………………………….20
Figure 3 – Fatalities in Crashes Involving Large Trucks (2001‐2010)……………………………………………………….55
List of Tables
Table 1: Estimated Costs of Commercial Motor Vehicle (CMV) Crashes (2008 Dollars)………………………....17
Table 2: Summary of Research Questions and Required Information………………….….….………………………….28
Table 3: Preliminary List of Identified Data Sources…………………………………………….….….………………………….28
Table 4: Freight Gateways at Selected Jurisdictions……………………………………………..….…………………………….33
Table 5: Data Analysis Matrix……………………………………………………..………………………………………………………….35
Table 6: Selected Facilities and DOT Jurisdictions……………………….………………………………………………………….46
Table 7: California Freeways (SR‐60) ‐ Screening Metrics Analysis………………….…………….……………………….48
Table 8: Georgia Freeways (I‐5) ‐ Screening Metrics Analysis…………………………………..…………………………….48
Table 9: Washington Freeways (I‐20) ‐ Screening Metrics Analysis……………………….…………..…………………..49
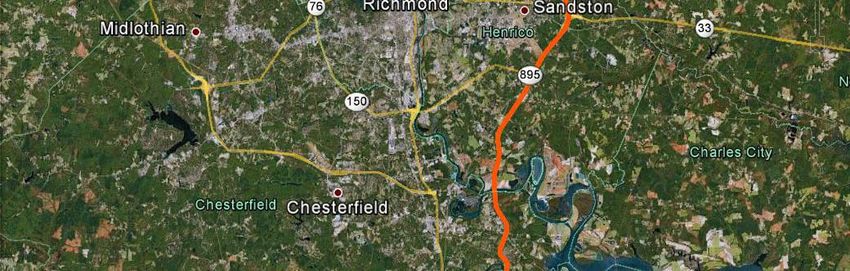
Table 10: Virginia Freeways (I‐95) ‐ Screening Metrics Analysis……………………….…………………………..………..50
Table 11: Oregon Freeways (I‐20) ‐ Screening Metrics Analysis…………………….…………………………………….…50
Table 12: New Jersey Freeways (I‐287) ‐ Screening Metrics Analysis……………………………………………………..51
Table 13: Screening Metrics Used to Identify Dedicated Truck Lane Candidates …………………………………..52
Table 14: SR‐29 (Mercer County) New Jersey – 1997/2011 Incidents and Fatalities…………………………….…54
Table 15: I‐880 (Alameda County) California ……………………………………………….………………………………………..54
Table 16: California Freeways (I‐5) ‐ Screening Metrics Analysis…………………………………………………............55
Page 4
Executive Summary

Many state DOTs and MPOs, in conjunction with the USDOT, and the overall transportation
community are tasked with finding solutions that can help reduce the number of fatal crashes
and incidents on the interstate freeway systems and, at the same time, employ congestion
management techniques that help reduce delay and improve travel on those same freeway
systems.

With an ever‐growing number of non‐commercial vehicles on freeway systems across the
country, DOTs have shifted to employing several congestion management measures and lane
management strategies for automobiles. However, any measures to reduce the impact of
commercial vehicles have not been explored as deeply.               One such measure is the
implementation of dedicated truck lanes on the interstate freeway system. In the last decade,
other efforts to bring truck‐only lanes have been investigated, but lane management strategies
on commercial vehicles have not been implemented as much as automobiles.

This study aims to answer two main questions: 1) what conditions warrant the implementation
of dedicated truck lanes? And 2) are there any candidate facilities located in the Bay Area?
These research questions would help the difficult task establishing a criterion for evaluating
existing facilities and providing a basis for selecting roadway segments for dedicated truck lanes
implementation.

Of the six jurisdictions analyzed, California and Georgia were observed to have the highest level
of usage (in terms of AADT and Truck AADT) for both the SR‐60 (California) and the I‐20
(Georgia) facilities. Additionally, for both of these facilities, the analysis showed contrasting
measures when incident data for both jurisdictions were evaluated. The percentage of truck‐
related/truck‐involved incidents for I‐20 in Georgia was almost twice the amount observed in
California (25 percent to 13 percent). However, AADT for California was approximately 1
million more than Georgia. These observations suggest that the I‐20 facility in Georgia may
benefit from dedicated truck lanes, at a greater degree than the SR‐60 in California.

                                                                                           Page 5
Background

In the 1960s, marked growth in the suburbanization of urban populations and growth in
passenger vehicle usage propelled a dramatic increase in traffic congestion on freeway
facilities. The interstate highway system, built in the 1940s and 1950s, were meant to serve the
movement of goods and raw materials vital to the national economy. Sprawling communities,
in addition to the expansion of freight operations carried out by trucks promulgated the need
for more freeway facilities. The growth of new freeway facilities throughout the country in the
last four decades, a direct response to the demand created by a vast increase in the number of
passenger vehicles (cars) and commercial vehicles (trucks), led to the commute patterns that
define each metropolitan area in the United States today.

With significant increases in the number of vehicle types (cars, trucks, and motorcycles) on the
freeway system, the number of accidents and fatalities involving these vehicles also increased.
On average, fatal crashes involving passenger vehicles were estimated at 39,482 annually since
1975. For fatal crashes involving commercial vehicles, trucks were involved in approximately
5,566 crashes annually since 1975.

Improvements in safety technology for passenger vehicles, such as better braking mechanisms,
airbags, seatbelts, etc., have contributed to a reduction in the number of fatal crashes over the
past few decades. However, commercial vehicle technology has seldom improved over the
years. Data collected and studies on fatal crashes involving commercial vehicles suggest that
the decrease in the number of fatal crashes is mostly due to a reduction in the number of trucks
on the road during an economic decline or recession.1

While it is true that in comparison, the number of fatal incidents involving commercial vehicles
is dwarfed by the number of fatal incidents among passenger vehicles, the impact of these
commercial vehicle accidents affect the community at an economic, social, and at a much more

1
 Ralph Craft, 2010 Large Truck and Bus Crash Data: An Overview, Federal Motor Carrier Safety Administration –
Office of Analysis, Research and Technology, June 2012. “http://www.fmcsa.dot.gov/facts‐
research/media/webinar‐6‐21‐12‐slides.pdf” Accessed February 15, 2013.

                                                                                                         Page 6
cultural level. Trucks, since its boom in the 1960s have incurred very negative social stigmas of
being unsafe due to their large mass, unreasonable blind spots, and poor reaction times.

An example of the cultural hostility that was a byproduct of the poor public perception of trucks
was Senate Bill No. 1491 (S‐1491) in New Jersey. In 2001, S‐1491 made permanent a temporary
ban ordered by the New Jersey Department of Transportation (NJDOT) on heavy truck traffic on
certain portions of State Route 29 (SR‐29). Specifically, the bill prohibited truck and truck‐
trailer combinations that exceeded 26,000 pounds in gross registered vehicle weight, gross
vehicle weight rating, or gross combination weight rating from using both northbound and
southbound travel lanes on SR‐29, from its intersection with Interstate 95 (I‐95) to the northern
terminus at State Route 12 (SR‐12), a length of approximately 26 miles.

This form of vehicle restriction is not uncommon in the United States. Vehicle separation has
been a typical response to the issues brought on by the natural conflicts between passenger
vehicles and commercial vehicles. The earliest example of separating trucks from passenger
cars dates back to the 1960s when the New Jersey Turnpike Authority (NJTA) and the NJDOT
had imposed lane restrictions that did not allow trucks in the left lane of turnpike roadways
that had three or more lanes for each direction. Other states across the country, facing similar
problems of managing conflicts between trucks and passenger vehicles also employ this minor
form of separation. In California, Oregon, and Illinois, trucks are restricted to the right‐most
travel lane to avoid further conflicts with other vehicles on congested roadways.

Even with the implementation of minor truck restrictions, congestion and safety on freeway
systems remain a significant concern for the transportation industry today, as it has been for
the past five decades. However, since 2009, the number of fatal collisions involving large trucks
on the national highway system increased by 9 percent, according to the National Highway
Traffic Safety Administration (NHTSA). In 2010, 80,000 people were injured in crashes involving
large trucks – an increase of 8 percent from 74,000 in 2009.

Many state Departments of Transportation (DOTs) and Metropolitan Planning Organizations
(MPOs), in conjunction with the United States Department of Transportation (USDOT), and the
overall transportation community are tasked with finding solutions that can help reduce the
                                                                                           Page 7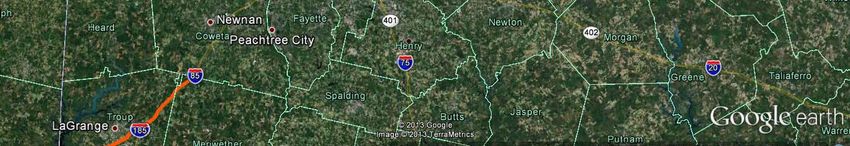
number of fatal crashes and incidents on the interstate freeway systems and, at the same time,
employ congestion management techniques that help reduce delay and improve travel on
those same freeway systems.

This study aims to answer two main questions: 1) what conditions warrant the implementation
of dedicated truck lanes? And 2) are there any candidate facilities located in the Bay Area?
These research questions would help the difficult task establishing a criterion for evaluating
existing facilities and providing a basis for selecting roadway segments for dedicated truck lanes
implementation.

                                        Introduction

With an ever‐growing number of non‐commercial vehicles on freeway systems across the
country, DOTs such as the California Department of Transportation (Caltrans) have shifted to
employing several congestion management measures and lane management strategies i.e.,
high‐occupancy vehicle lanes (HOV), high‐occupancy toll lanes (HOT), congestion‐based toll
pricing, and other restrictions on automobiles. However, any measures to reduce the impact of
commercial vehicles have not been explored as deeply.               One such measure is the
implementation of dedicated truck lanes on the interstate freeway system. In the last decade,
other efforts to bring truck‐only lanes have been investigated, but lane management strategies
on commercial vehicles have not been implemented in California to as great a degree as
automobiles.

Over the past decade, the concept of adding dedicated truck lanes on existing freeways has
been slowly emerging as a viable tool for transportation organizations and governing bodies.
Recent initiatives to include dedicated truck lanes in long‐range planning activities of DOTs have
become important considerations in the task of decreasing the potential conflicts between cars
and trucks on the existing freeway system. Across the country, several states have evaluated
the feasibility of dedicated truck lanes. Some states, such as Oregon and California, have either
a variation of dedicated truck lanes in operation (e.g., truck bypass lanes or truck climbing

                                                                                           Page 8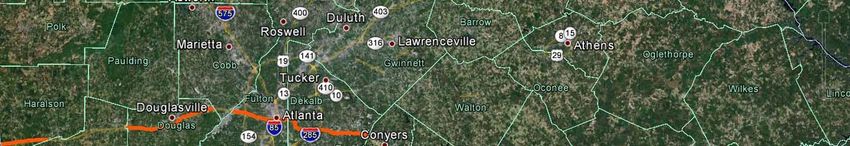
lanes) or employ measures such as imposing lane restrictions that prohibit heavy vehicles from
traveling on certain lanes.

For the most part, studies on exclusive truck lane facilities have focused on separated facilities
without considering changes on gross weight limits, axle load limits or truck sizes. The main
purpose for these studies is to completely separate trucks from passenger vehicles and refrain
from considering longer combination vehicles (LCVs) since these truck‐types are not as
prevalent as single‐unit trucks. Studies on the concept of adding an exclusive truck facility also
assumed that and upgrades (pavement strengthening, etc.) would only be required for the
truck lane, and not in the entire facility. Focusing improvements on the new truck lanes would
significantly reduce the potentially considerable investment costs, and would enable the
proposed truck‐only facility to accrue benefits, such as fewer conflicts with cars, while
enhancing the economic and financial feasibility of the proposed system.

Of particular interest of this research is the applicability of dedicated truck lanes on California
freeways. Trucks have been the predominant mode of freight transportation in California for
the last few decades. According to Caltrans, trucks serve virtually all markets, from long‐
distance interstate commerce to the “last mile” of intermodal goods movement. Trucking is
the essential mode for intrastate, regional, and local goods distribution, including manufactured
goods, resource extraction (e.g., logs, sand and gravel), food and farm‐to‐market products,
containers, machinery and industrial supplies, petroleum products, air cargo ground
transportation, and other goods.

Congestion on the California freeway system affects trucks to a similar degree as automobiles,
however, since the entire state depends heavily on commercial vehicles for goods movement,
measures that improve travel on the California freeways must also include truck travel impacts.
In addition, of the top 250 major freight chokepoints and bottlenecks in the nation, as identified
by the Federal Highway Administration (FHWA) and American Trucking Research Institute
(ATRI) in 2011, 15 were in California – 6 in Los Angeles, 3 in Sacramento, 2 in Oakland, and 1
each in San Bernardino, Corona, San Rafael, and San Diego.

                                                                                            Page 9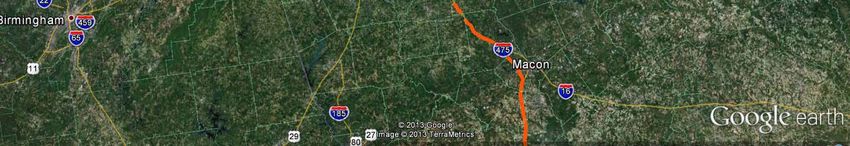
As freeway systems continue to crowd and travel times increase, safety and free flow or even
just less congested travel conditions may not be as easy to achieve without considering other
approaches to managing commercial vehicle travel. Current congestion management strategies
do not incorporate more aggressive truck traffic management, despite the fact that the
California freeway systems are crucial to the west coast in terms of goods movement.

                                      Research Focus

This study will analyze the implications of establishing dedicated truck lanes on existing freeway
facilities. In order to meet this task, a baseline condition would need to be established through
a quantitative evaluation of roadway conditions where dedicated truck lane projects have been
considered in the United States. Comparison of common metrics such as daily traffic volumes,
truck traffic volumes, accident data, length of proposed facility, and existing congestion, the
research study would gain important information about the justification for implementing
dedicated truck lanes or truck restriction projects. The theoretical justification for dedicated
truck lanes and essential “roadmap/blueprint” gained from analysis of existing conditions
would then be applied to a case study which identifies segments of the Bay Area freeway
system that would benefit from the implementation of dedicated truck lane projects.

The purpose of this study is to contribute to the existing knowledge base by providing guidance
on important considerations required for implementing dedicated truck lanes on existing
freeway systems. The overall research goals of this study, as outlined below, seeks to analyze
existing applications of dedicated truck lanes and provide an analytical method for identifying
potential existing conditions and potential benefits in implementing dedicated truck lane
projects.

Research Question # 1:

       What conditions would warrant the implementation of dedicated truck lanes?

       While theoretical applications of dedicated truck lanes have been studied in the past
       few decades, the actual implementation of dedicated truck lane facilities are a relatively

                                                                                          Page 10
new concept. Neither the USDOT nor the state DOTs that are seeking to address
congestion and safety issues between passenger vehicles and trucks do not have a
specific set of conditions that would provide justification for implementing dedicated
truck lanes. This research aims to provide an analysis of existing conditions at selected
jurisdictions that established the need for dedicated truck lanes.
Question 1a:
Does the addition of dedicated truck lanes on a particular freeway segment improve
safety (incidents and fatalities)?
This study aims to analyze available data on existing applications of dedicated truck
lanes and estimate whether there are marked reductions in incidents.
Question 1b:
What possible operational benefits are gained by separating trucks from other
passenger vehicles?
This study would analyze available data on travel time savings a due to any restrictions
imposed on trucks. While there are very few dedicated truck lanes in the United States,
restrictions on truck traffic, such as SR‐29 in New Jersey, would provide an insight on the
operational benefits gained by separating vehicle types on the existing freeway system.
In addition, this study aims to apply the theoretical findings to a case study focused on the Bay
Area freeway system as candidate for the implementation of dedicated truck lanes. While
larger goods movement hubs exist in the Central Valley and Southern California, the Bay Area is
home to five seaports, including the Port of Oakland, which is the fourth busiest container port
in the country and plays an important role in supporting the state’s agricultural sector. There
are also three commercial airports and rail facilities serving the two major freight railroads
operating in the western United States and smaller short haul rail services. Truck‐only lanes
have not been approached in the Bay Area and congestion remains a problem despite
automobile restrictions implemented in the last five years, thus making truck‐only lanes a
possible measure for improving travel and goods movement activities. A secondary research
Page 11question focused on the Bay Area case study would need to be analyzed as follows with the
goal to provide information about how Caltrans can make the best decision to create truck‐only
lanes on the California freeway system.
Research Question # 2:
Can dedicated truck lanes be implemented on the existing Bay Area freeway system?
Dedicated truck lanes can potentially be applied to any jurisdiction seeking alternatives
to congestion management. The research aims to identify segments in the Bay Area
freeway system that would be able to accommodate a new truck‐only facility.
Question 2a:
Which Bay Area freeways warrant the implementation of dedicated truck lanes?
The research study would need to analyze relevant existing characteristics that are
unique to the Bay Area in order to assess where dedicated truck lanes could be
deployed.
Question 2b:
What performance measures does Caltrans need to establish prior to managing the
new facilities?
This study aims to provide a specific set of performance measures in assessing the
success or failure of a dedicated truck lane project. The research would analyze existing
performance measures established for the truck climbing lane on Interstate 15 (I‐15) in
San Bernardino County. Since, there are no existing applications of truck‐only lanes in
California new facilities or modifications to existing freeways need to account for the
changes in travel conditions and thus refine the methods of analyzing performance.
Page 12Literature Review
Over the past fifteen years, various studies have been conducted by State DOTs, the USDOT, as
well as academic institutions, on dedicated truck lanes. While the implementation of dedicated
truck lanes on existing urban facilities have not been common in the United States, the concept
of separating trucks from other vehicles has been an emerging topic of interest for DOTs and
regional transportation agencies, as a potential tool in alleviating congestion on urban freeway
systems. Also, the growing number of fatal collisions between passenger vehicles and large
commercial vehicles has compelled DOTs and regional agencies to analyze the separation of
these vehicle types.
The following sections discuss previously completed studies and relevant academic literature
on applications of separating trucks from passenger vehicles on urban freeway systems in the
United States. Relevant studies on truck‐only lanes as it applied to financing, safety, and the
environment are also discussed. Ad
ditionally, a more specific focus on the implementation of dedicated truck lanes in California is
also analyzed. Finally, a discussion of the key implications for the remainder of the research
study, based on the literature review conducted, is also described in this section.
Existing Applications of Dedicated Truck Lanes
In the United States, the most common application of the dedicated truck lane concept exist
today “through lane restrictions, whereby trucks are restricted from using certain lanes through
urban areas or during certain congested times of the day” (Federal Highway Administration
[FHWA], 2011).
A number of states, including California, have implemented truck lane restrictions in an attempt
to improve safety and mobility on freeways. These restrictions typically prohibit trucks from
traveling in the median lane, potentially increasing passing opportunities and reducing negative
interactions between slow‐moving trucks and other vehicles. However, these lane restrictions
generally restrict trucks to the other, slower, mixed use lanes, rather than assigning lanes
exclusively for truck use.
Page 13Dedicated truck lanes have not been implemented to a greater degree than lane restrictions in
the United States. However, there have been a few states that have implemented the concept
in order to improve roadway operations and alleviate congestion. One of the most successful
applications of dedicated truck lanes is located in New Jersey. The New Jersey Turnpike is a
limited access facility that has successfully improved operations by separating types of vehicle
traffic. A 32‐mile segment of the roadway has been expanded into two separate roadways,
resulting in a dual‐dual facility. Large trucks are limited to the outer roadway but passenger
vehicles may travel on either the inner or the outer roadway. Each of these facilities provides
very limited access and the available access is through independent ramps for the inner and
outer roadways. Using gates, operators can limit access to a particular roadway as needed to
manage demand or in the event of an incident. The result is a roadway that operates efficiently
because turbulence in the traffic flow is minimized. (FHWA, 2008)
Within the last decade, only a handful of other dedicated truck lane facilities have been
constructed in the United States. These facilities include the previously mentioned New Jersey
Turnpike, but also the Clarence Henry Truckway (New Orleans), South Boston Bypass Road, and
the Los Angeles I‐5 truck bypass lanes. These facilities typically restrict use to commercial
vehicles only – including taxis, jitneys, limos, and automobiles with commercial plates. The
results of implementing dedicated truck lanes also typically ranged from reduced demand on
saturated freeway facilities and free flow truck traffic operations on the facilities.
In more recent years, according to Abdelgawad et al, “several studies have been recently
carried out to investigate potential development of [other] exclusive truck facilities, including
studies in Atlanta, the I‐81 in Virginia, SR‐60 and I‐710 in Los Angeles, Florida, and Texas”
(American Society of Civil Engineers [ASCE], 2011).
A comprehensive 2005 study conducted by the Georgia State Road and Tollway Authority
(SRTA) on the feasibility of dedicated truck lanes for the Atlanta region found that truck lanes
(1) reduced vehicle hours traveled with a negligible change in vehicle miles traveled; trucks
traveling through the Atlanta region can save a significant amount of time by using truck lane
facilities; (3) congestion in non‐truck lanes is significantly improved; and (4) respectable
Page 14amounts of revenue can be generated to cover operating and maintenance costs through a
tolling option.
The SRTA study also identified several challenges related to implementing truck lanes in the
Atlanta region. Including, the financial structure attached to the truck lane strategy. The study
surveyed representatives from the trucking industry and recommended that the truck lanes
remain voluntary and commercial vehicles would not be required to use the lanes, especially if
tolls are imposed on such facilities. The level of fees facing commercial vehicle users would
clearly be a critical factor in their overall success. However, the surveyed industry
representatives also recognized the growing problem of freight mobility in the Atlanta region
therefore, the trucking industry can be flexible on a toll strategy to finance dedicated truck
lanes.
The second challenge is associated with the actual placement of truck lanes. The SRTA study
identified that truck lanes can be constructed in the I‐75, I‐85N, and the I‐285 northern and
western sections. SRTA conducted research on other feasibility studies of additional truck only
lanes in these corridors and concluded that the concept is possible. However, this study did not
conduct a more detailed engineering analysis of whether this assumption is indeed reasonable.
The SRTA study concluded that the Atlanta region is in a particularly critical stage now as it
begins to implement a region‐wide managed lane network. Thus, there is urgency behind any
potential change to the region’s concept of managed lanes. This urgency represents a challenge
to the inclusion of truck facilities as a part of the overall managed lanes strategy for the region.
Also, the linkages between HOV, HOT and truck‐only lanes, as they relate to constructability,
needs to be better understood. Thus, these are important considerations for further
development of a managed lane strategy in the Atlanta region.
Financial Perspective
Like many public infrastructure projects, one of the most common barriers to implementation is
the issue of funding for capital construction and operations. According to De Palma, Kilani, and
Lindsey, “dedicated truck lanes tend to cost more per mile than do car lanes, but by
Page 15concentrating heavy vehicles on part of the road infrastructure they allow the remainder to be
built and maintained more cheaply (Journal of Urban Economics, 2008). Financing dedicated
truck lanes remain one of the most significant challenges faced by state and regional
transportation authorities. However, freeway management strategies often focus on the cost to
build and operate the facility, thus other financing strategies have also been explored in recent
years.
Tolls have been analyzed as an appropriate instrument to finance and operate dedicated truck
lanes and also charge for the differential damage to roads caused by different classes of
vehicles, which cannot be recovered through fuel taxes. Tolls on trucks, like those introduced in
Switzerland or in Germany, have been considered for implementation of truck lanes in the US.
Such tolls may also provide an effective incentive for greater efficiency in the transport industry
and for improving the quality of vehicles.
Truck‐only Toll Lanes (TOT) recently became a crucial part of the discussion in implementing
dedicated truck lanes. Although building TOT lanes would require higher construction costs
than adding mixed travel lanes, TOT lanes could generate revenues to cover operating and
maintenance costs, and some portion of capital costs to create self‐financing potential.
However, significant challenges remain as the implementation and enforcement of dedicated
truck lanes may lead to much resistance by the trucking industry.
Relevant research by Zhou, et al, on dedicated truck lanes concluded that, through both one‐
on‐one interviews and survey, there were significant differences in the attitude toward toll
roads by different segments of the trucking industry. Smaller companies (owner–operators)
clearly preferred the non‐toll route, citing the fact that the toll came directly out of their pocket
and it was difficult for them to pass on the cost to their customers. Larger companies were
more likely to carefully weigh the benefits and costs of using the toll route when making their
decision, rather than avoiding toll roads in general. However, respondents from the trucking
industry showed much interest in off‐peak discounts followed by a free trip after a number of
paid trips. (Transportation Research Board, 2009)
Safety Perspective
Page 16Since 1975, the National Highway Traffic Safety Administration (NHTSA) has collected data on
fatal crashes involving motor vehicles on public travel ways. The NHTSA’s Fatality Analysis
Reporting System (FARS) is recognized as the most reliable national crash database, but it
contains information only on fatal crashes. Nonfatal crash statistics are available from 1990
through 2010. According to the NHTSA, fatal crash statistics generally are available from 1975,
the first year of FARS data, through 2010. In some cases, such as for roadway function class or
alcohol involvement, data are available only from 1981 or 1982 through 2010.
A large truck is defined in the FARS as a truck with a gross vehicle weight rating (GVWR) of more
than 10,000 pounds. The NHTSA characterized trucks as a major contributor to the occurrence
and consequences of traffic crashes due to their size, weight, and the amount of travel
commercial vehicles accumulates compared to passenger vehicles (NHTSA, 1998).
NHTSA studies and data regarding fatal crashes between 1975 and 1995 showed that large
trucks accounted for about 3 percent of motor vehicles involved in police‐reported crashes of
all severities, about 8 percent of vehicles in total fatal crashes, and are associated with about 12
percent of the annual total traffic fatality count. Large trucks are also estimated to account for
about 7 percent of the total number of vehicle miles traveled each year within the same period
(NHTSA, 1998).
In 2010, the Federal Motor Carrier Safety Administration
(FMCSA) reported that there were:
• 3,261 large truck fatal crashes
• 3,484 large trucks in fatal crashes
• 3,675 people killed in large truck fatal crashes
In motor vehicle crashes, large trucks represented:
• 8 percent of vehicles in fatal crashes
• 2 percent of vehicles in injury crashes
• 3 percent of vehicles in property‐damage‐only crashes. FIGURE 1 ‐ Fatalities in Crashes Involving
Large Trucks (2001‐2010)
Page 17Another 80,000 people were injured in crashes involving large trucks; 14 percent of those killed,
and 25 percent of those injured, were occupants of large trucks (FMCSA, 2012). Additionally,
large trucks accounted for 10 percent of all vehicle miles traveled and 4 percent of all registered
vehicles in the United States.
Early analysis of FMCSA crash data revealed that from 2007‐2010, the number of large trucks
involved in fatal crashes declined by 25 percent. Figure 1 shows data on fatal crashes involving
large trucks from 2001 through 2010. During the same period, the number of passenger
vehicles involved in fatal crashes also declined by 21 percent. From 2000‐2010, the number of
large trucks involved in fatal crashes decreased from 4,995 to 3,484, a decrease of
approximately 30 percent. The number of large trucks involved in injury crashes decreased
from 101,000 to 58,000, a decrease of approximately 42 percent. The number of large trucks
involved in property damage only crashes decreased from 351,000 to 214,000, a decrease of
approximately 39 percent.
While the number of significant crashes (fatal, injury, property damage) involving trucks
declined between 2007 through 2010, studies conducted by the USDOT estimated that the
costs associated with these incidents and fatalities remain significantly high at over $57 Billion
per year for the same time period (See Table 1). In comparison, costs involving passenger
vehicles was estimated at $334 billion, according to the Bureau of Transportation Statistics.
This presents a significant disparity in the costs associated with commercial vehicles accidents
and costs of passenger vehicle accidents since trucks represent approximately 2‐4 percent of all
vehicles on the existing freeway systems.
Table 1: Estimated Costs of Commercial Motor Vehicle (CMV) Crashes (2008 Dollars)
Year Fatal Crashes Injury Crashes Property Damage Only Crashes Total: All CMV Crashes
2009 $ 23 Billion $ 20 Billion $ 5 Billion $ 48 Billion
2008 $ 29 Billion $ 25 Billion $ 6 Billion $ 60 Billion
2007 $ 32 Billion $ 27 Billion $ 6 Billion $ 65 Billion
Source: USDOT, 2011
Page 18Environmental Perspective
In 2010, studies by the Environmental Protection Agency (EPA) estimated that the largest
sources of transportation greenhouse gases were passenger cars (43 percent), freight trucks (22
percent), light duty trucks, which include sport utility vehicles, pickup trucks, and minivans (19
percent), and commercial aircraft (6 percent). These figures included direct emissions from
fossil fuel combustion, as well as Hydroflourocarbon (HFC) emissions from mobile air
conditioners and refrigerated transport vehicles.
Since 2005, estimated data for passenger vehicles and light trucks showed that average fuel
economy increased, partly due to the retirement of older vehicles and increasing fuel prices.
However, fuel economy for commercial vehicles did not increase during the same period.
Additionally, Vehicle Miles Traveled (VMT) for both passenger and commercial vehicles
increased between 1990 and 2005 which also contributed to the level of Carbon Dioxide (CO2)
emissions from both vehicle types. While passenger vehicles remain a dominant source of
pollution, commercial vehicles still account for a significant portion of total greenhouse gases,
despite passenger vehicles outnumbering commercial vehicles 4 to 1.
Previous studies on dedicated truck lanes have shown that its implementation on congested
roadways can be very helpful in reducing VMT. According to a study by Chu and Meyer,
mandatory TOT lane use strategies reduced VMT on the mixed travel lanes by an estimated 8
percent, while a voluntary TOT lane use strategy resulted in a 6 percent reduction. Both TOT
lane strategies generated less air pollution for the traffic on the mixed travel lanes (Energy
Policy, 2009). It is not a surprise that given the implementation of TOT lanes, the mandatory
TOT lane use option reduced CO2 emissions on the mixed travel lanes by approximately 60
percent, whereas the voluntary TOT lane use option reduced CO2 by 48 percent when
compared to a freeway without TOT options.
Moreover, according to the EPA, these reductions in VMT and CO2 emissions may not be a
significant contribution on the global scale of climate change. However, metropolitan areas
and states that are interested in finding ways of reducing CO2 emissions, strategies that provide
Page 19a more reliable and faster trip for heavy vehicles, through dedicated truck lanes could be one of
the more significant actions that could be taken.
California Goods Movement
California is a major gateway for products entering and leaving the United States and is home
to eleven publicly‐owned ports, in which three ports are known as “megaports.” Two port
locations, the Ports of Los Angeles and Long Beach, make up the largest port complex in the
United States and are important hubs for global export and import activities that are crucial to
the economy of the United States. These two Southern California ports process approximately
25 percent of all container cargo traffic in the United States (Caltrans‐Freight Planning, 2011).
One port in Northern California, the Port of Oakland, is the fourth largest port in the nation and
manages trade from Pacific Rim countries, delivering 99 percent of the goods from ocean
containers passing through Northern California to the rest of the United States (Caltrans‐Freight
Planning, 2011). The remaining eight port facilities are considered “niche” ports (Hueneme,
Humboldt Bay, Redwood City, Richmond, West Sacramento, San Diego, San Francisco, Stockton,
and Benicia); these ports manage exported and imported goods at a much lesser rate and
volume compared to the megaports.
From the most active seaports in the state, the trucking community facilitates the movement of
goods. Trucking serves every community in California and an estimated 78 percent of all
California communities depend exclusively on trucks to move their goods (American
Transportation Research Institute (ATRI), 2012). According to the California Department of
Motor Vehicles (DMV), there were 5,645,836 registered commercial trucks and 2,380,417
commercial trailers in 2011. Studies by Caltrans’ Freight Planning Unit, estimated that in 2010,
trucks transported 88 percent of the total manufactured tonnage in the state or about
3,822,566 tons per day (Caltrans, 2011). Also, trucking’s use of California public roads was
about 24.8 billion miles in 2008. Similarly, with active seaports in each region, the largest
numbers of truck vehicle miles are located in Southern California, the Central Valley, the Bay
Area, and the Border Region.
Dedicated Truck Lanes in California
Page 20With significant transport activities conducted by trucks, it is surprising that the implementation
of dedicated truck lanes on congested freeway systems has taken a similar path as other states.
Similar to other goods movement hubs across the United States, only a few dedicated truck
lane projects have been constructed. Many corridors and freeway segments in California, such
as Northern California and the Bay Area, have not been studied. With the most active goods
movement centers located in Los Angeles, San Diego, and other parts of southern California,
Caltrans has focused the majority of dedicated truck lane projects in those areas of the state.
As of 2012, only a few dedicated truck lane projects have been given serious considered and
constructed (Caltrans, 2012). The following truck‐only facilities are currently in construction or
are in design/study phase under the jurisdiction of Caltrans:
1. SR‐14 to Pico Canyon Road/Lyons Avenue. As shown on Figure 2, the project proposes
to add northbound and southbound truck lanes on I‐5 in Los Angeles County at the State
Route 14 (SR‐14) split. The total length of this dedicated truck lanes are approximately
3.7 miles in both northbound and southbound directions. The project will add a truck
lane to the outside of southbound I‐5 by paving the median area and outside shoulder,
and shifting the mixed‐flow lanes inward. Median retaining walls and two short sections
of outside retaining walls will be built to accommodate this widening. Construction
began in May 2012 and will be completed in 2014.
FIGURE 2 ‐ SR‐14 to Pico Canyon Road/Lyons Avenue
Page 212. Southbound I‐5 in Kern County at the State Route 99 (SR‐99) junction near the
Grapevine. This dedicated truck lane begins on SR‐99 at Kern County postmile L000.629
(I‐5 postmile R015.838) and ends on I‐5 at postmile R015.492. The total length for the
facility is 0.346 miles. The purpose of this project is to place truck merges further
downstream of the automobile traffic merge on I‐5 & SR‐99. Currently, this project is in
the preliminary design phase.
In addition to the abovementioned truck lane facilities, Caltrans has also supported other
studies on dedicated truck lanes on California freeway system including facilities on SR‐60 in
Southern California.
The Southern California Association of Governments (SCAG) conducted the most ambitious
study of implementing dedicated truck lanes in California. In a study released in February 2001,
the SCAG feasibility study report (FSR) analyzed the implementation of dedicated truck lanes on
State Route 60, from I‐710 to I‐15; a distance of approximately 38 miles. The study analyzed
SR‐60 for several characteristics including the number of lanes on existing grade, cross‐sections,
adjacent land use, clearances for both over‐ and undercrossings, and available right‐of‐way.
The study considered three main strategies:
(1) Allowing trucks to share the HOV lanes at limited time periods
(2) Adding truck lanes to the freeway at grade
(3) Adding lanes above the freeway grade.
The FSR recommended combining the two non‐HOV strategies (Strategy 2 & 3), with at‐grade
truck lanes built where feasible, and above‐grade mixed‐flow lanes built where right‐of‐way
acquisition would be difficult. Above‐grade lane sections should be kept to a minimum due to
safety and operational considerations, as well as higher construction costs. Also, trucks would
always operate at grade for safety. These strategies, as SCAG concluded, called for massive
financial resources (estimated at $4.3 Billion USD) to build, thus requiring a more in‐depth
study of other potential freeway segments that would be eligible for the application of
dedicated truck lanes.
Page 22The FSR also provided a metric outlining the conditions for which dedicated truck lanes were
feasible for a congested freeway facility. Dedicated truck lanes were deemed plausible should
these three factors exist: (1) truck volumes exceed 30 percent of the vehicle mix, (2) peak hour
volumes exceed 1,800 vehicles per lane‐hour, and (3) off‐peak volumes exceed 1,200 vehicles
per lane‐hour.
Summary
While there are various research previously completed on the concept of dedicated truck lanes
on congested freeway systems, there are many key areas that still require further research.
Particularly, relevant literature on the topic of dedicated truck lanes did not appear to provide a
clear association between the most effective funding scenarios. While most studies assumed
that funding for truck lane projects were automatically added to the financial commitments of
DOTs, other studies identified more unpopular funding sources such as taxes and imposed fees
on users, such as tolls. Additionally, the concept of tolling as a way to alleviate the financial
burden of initial capital costs, maintenance, and operations is not clear between each research
study reviewed.
Most previous studies on the topic of dedicated truck lanes concluded that there were
potential benefits in terms of congestion and safety due to the implementation of dedicated
truck lanes on congested urban freeways. However, just like the decision to add HOV or HOT
lanes on existing freeway segments, adding dedicated truck lanes would require a specific set of
conditions, such as available ROW on existing travel ways, a consideration of existing
operations, truck volumes, and other relevant travel conditions.
Page 23Research Design
A combination of data analysis (quantitative) and a qualitative assessment of available
information would be employed to answer the research questions and relative sub‐questions
previously discussed. The following section provides an overview of the research design
proposed for this research study.
Research Questions (RQ) Part 1:
RQ # 1: What existing conditions would warrant the implementation of dedicated truck lanes?
RQ # 1a: Does the addition of dedicated truck lanes on a particular freeway segment improve
safety (incidents and fatalities)?
RQ # 1b: What possible operational benefits are gained by separating trucks from other
passenger vehicles?
In order to answer the primary Research Question (RQ # 1) an analysis of existing conditions
must be conducted in order to establish the need for dedicated truck lane projects.
Information from existing studies conducted by various DOTs and MPOs on dedicated truck
lanes and/or lane restriction for trucks would need to be reviewed. As discussed in the
literature review, analyzing these studies, and the independent collection of available data on
specific traffic metrics in each jurisdiction, would help the research establish a baseline of
existing conditions that can identify corridors that would benefit from the implementation of
dedicated truck lane projects. Recent studies by state DOTs on dedicated truck lanes and lane
restriction for trucks on specific corridors would be analyzed and a separate data collection
would be conducted to establish existing conditions measured through the following metrics:
1) Roadway Information:
o Annual Average Daily Traffic (AADT) [all vehicles] –RQ # 1–
(Data Sources: FHWA – Office of Highway Policy Information; State DOTs and US DOT)
o Truck traffic volumes and percentages (Truck AADT) –RQ # 1, 1a–
(Data Sources: FHWA – Office of Highway Policy Information; State DOTs and US DOT)2) Geographic Considerations:
o Length of corridor segments studied for dedicated truck lanes (in miles) –RQ # 1–
(Data Sources: Feasibility Studies and other DOT reports)
o Significance in the goods movement network –RQ # 1–
(Data Sources: FHWA – Freight Management and Operations; US Census Bureau –
Commodity Flow Survey Data)
3) Safety:
o Existing crash data and other incident data involving trucks and passenger
vehicles –RQ#1, 1a, 1b–
(Data Sources: National Highway Traffic Safety Administration [NHTSA]; Federal Motor
Carrier Safety Administration [FMCSA])
4) Existing Facility Usage:
o Vehicle Miles Traveled –RQ#1, 1a, 1b–
(Data Sources: State DOTs, FHWA – HPMS)
Furthermore, to answer research sub‐questions (RQ # 1a and 1b); a different approach to the
analysis of available information would need to be considered. Only a few applications of
dedicated truck lanes exist in the United States today, therefore, available data may not be as
abundant. However, there have been a number of projects that have sought to restrict the
impact of trucks on other vehicles on the roadway.
Analysis of available incident data from several truck restriction cases such as New Jersey
Senate Bill No. 1491 on SR‐29, SCAG estimates from the dedicated truck lanes study on SR‐60 in
California, existing data from the truck climbing lanes project on I‐15 in California, and others.
These studies and cases would be examined to document (if any) changes from existing
conditions have taken effect in the years after implementation of a dedicated truck lane or
truck restriction project.
Page 25This study would analyze project‐related impacts and provide a comparison with existing
conditions, as follows, based upon available data from existing projects and other studies.
1) Safety Data (with Project):
o Crash data and other incident data on corridors where dedicated truck lanes or
truck restrictions were implemented –RQ # 1a–
(Data Sources: NHTSA ‐ Trucks Involved in Fatal Accidents [TIFA]; NJDOT)
2) Operations (with Project):
o Level of Service (LOS) and peak period delay for segments where dedicated truck
lanes or truck restriction projects were implemented. –RQ # 1b–
(Data Sources: State DOTs – Traffic Data Branch)
o Travel time and average speed information for segments where dedicated truck
lanes or truck restriction projects were implemented. –RQ # 1b–
(Data Sources: State DOTs – Traffic Data Branch)
Research Questions (RQ) Part 2:
RQ # 2: Can dedicated truck lanes be implemented on the existing Bay Area freeway system?
RQ # 2a: Which segments of the Bay Area freeways can benefit from dedicated truck lanes?
RQ # 2b: What performance measures does Caltrans need to establish prior to managing the
new facilities?
Based on the initial findings from the literature review, dedicated truck lanes can be applied to
any jurisdiction seeking to bolster congestion management strategies. However, a specific
consideration of local conditions must be analyzed prior to the selection of a potential corridor.
This research would need to analyze segments of the Bay Area freeway system that reflect
existing conditions evaluated under RQ # 1 and determine whether the existing freeway system
would be able to accommodate a new dedicated truck lane facility.
Once conditions specific to the case study have been evaluated, expected findings would be
similar to other dedicated truck lane proposals/studies conducted over the past decade;
Page 26You can also read