World's Best Hospitals 2021 - Methodology - Newsweek
←
→
Page content transcription
If your browser does not render page correctly, please read the page content below

March 3rd, 2021

World’s Best Hospitals 2021 – Methodology
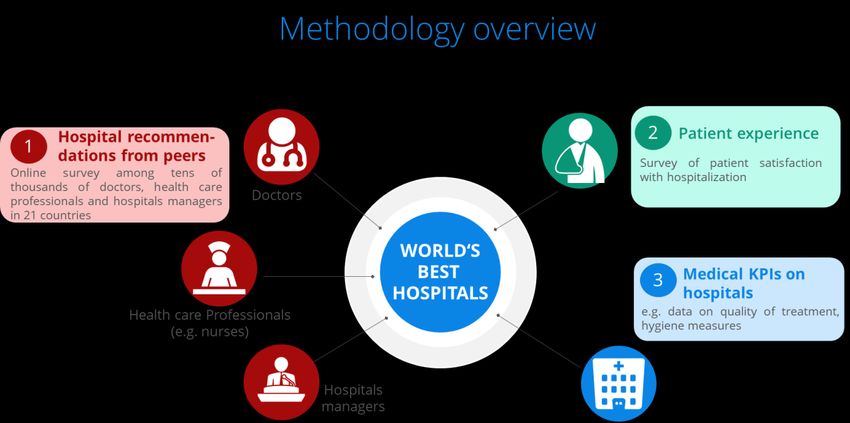
Table of contents
1         Introduction ........................................................................................................................................................ 1
2         Study Design ....................................................................................................................................................... 3
    2.1           New features and changes in the 2021 edition..................................................................................... 3
    2.2           General Methodology ............................................................................................................................... 4
    2.3           Validation by the Expert Board ............................................................................................................... 7
    2.4           Scoring Model ............................................................................................................................................ 8
    2.5           Specialty Hospitals .................................................................................................................................... 9
    2.6           Global Top 200 List ................................................................................................................................. 10
    2.7           Patient Reported Outcome Measurements (PROMs) survey ............................................................ 11
3         Specific Methodology....................................................................................................................................... 11
    3.1           United States of America ....................................................................................................................... 11
    3.2           Germany .................................................................................................................................................. 21
    3.3           Japan ......................................................................................................................................................... 25
    3.4           South Korea ............................................................................................................................................. 26
    3.5           France ....................................................................................................................................................... 27
    3.6           Italy ........................................................................................................................................................... 29
    3.7           United Kingdom ...................................................................................................................................... 31
    3.8           Brazil ......................................................................................................................................................... 32
    3.9           Canada ..................................................................................................................................................... 33
    3.10          Australia ................................................................................................................................................... 36
    3.11          Austria ...................................................................................................................................................... 37
    3.12          The Netherlands...................................................................................................................................... 38
    3.13          Switzerland .............................................................................................................................................. 39
    3.14          Sweden ..................................................................................................................................................... 40
    3.15          Norway ..................................................................................................................................................... 41
    3.16          Israel ......................................................................................................................................................... 42
    3.17          Other Countries....................................................................................................................................... 43
4         Disclaimer ......................................................................................................................................................... 44
Literature .................................................................................................................................................................... 45
1 Introduction
Patients are faced with the critical and difficult decision of choosing the right hospital for
their medical needs, a choice that was often solely determined by word of mouth or the
recommendation of a single physician (e.g. their general practitioner) in the past. Struc-
tural characteristics of a hospital such as its number of beds or number of medical staff
are unreliable indicators for quality of care and therefore not suited as a basis for deci-
sion making. In the last decade, the number of web-based portals, websites and data-
bases that aim to help with this decision by providing data about hospitals have in-
creased, ranging from relatively short and superficial news articles to specific databases
with multiple quality indicators per hospital within a specific country. However, none of
the available resources to date have attempted a methodologically sound international
ranking of hospitals based on a comprehensive score that gives an indication of where
each hospital stands relative to its peers. Most available resources do not even feature
a full overview of the major hospitals in one country, instead focusing on certain special-
ties or diseases, much less a ranking of these hospitals.
The World’s Best Hospitals 2021 ranking is a project which aims to close this gap by rank-
ing the best hospitals across the world. Its vision is to establish the ranking as the best
and most comprehensive resource for global top lists in the hospital sector. A total of 25
countries are featured in the 2021 edition: USA, Germany, Japan, South Korea, France,
Italy, United Kingdom, Spain, Brazil, Canada, India, Australia, Mexico, The Netherlands,
Poland, Austria, Thailand, Switzerland, Sweden, Belgium, Finland, Norway, Denmark, Is-
rael and Singapore. The countries were mainly selected based on standard of living and
life expectancy, population size, number of hospitals and data availability.
The current 2021 edition of the ranking is an extension and update of the annual World’s
Best Hospital ranking which was first published by Newsweek and Statista in March 2019
and featured the top 1,000 hospitals in 11 countries. In the 2021 edition, 25 countries
and 2,000 hospitals are featured in total, marking an important milestone towards the
goal of a global ranking. The number of hospitals awarded in each country varies based
on the number of existing hospitals, average hospital size (commonly approximated by
number of inpatient beds) and data availability in the respective country. The length of
the list varies, with 350 USA-based hospitals included, while Israel and Singapore were
rep-resented with 10 hospitals each.
Hospitals which are not accessible to the public and/or very small were excluded from
the ranking since they were very unlikely to receive enough recommendations to make
the final list and are not comparable to general hospitals in the range of services pro-
vided. The authors of this study used the average number of beds per hospital in each
1country as a guideline to identify very small hospitals, resulting in varying thresholds per
country. For example, the smallest hospital in national ranking for Germany has 160 in-
patient beds, whereas the smallest hospital in the ranking for the United Kingdom has
88 inpatient beds. This approach takes into account the substantial differences in aver-
age hospital sizes across countries and ensures a base level of comparability of national
hospitals.
Every hospital in each country was rated by a score, which is based on three data
sources:
o Recommendations from medical experts (doctors, hospitals managers, health
care professionals)
o Medical KPIs regarding hospitals
o Existing Patient satisfaction data
These Rankings are only comparable for hospitals within the same country because dif-
ferent sources for patient experience and medical KPIs were examined in each country
and given the complexity of the various data sources, it was not possible to harmonize
this data. For the same reason, cross-country comparisons of the raw values of the
scores are also not possible (example: A score of 90 in country A does not necessarily
mean that this hospital is better than a hospital with a score of 87 in country B).
Nevertheless, one aim of this project was to create a Global Top 200 ranking, mainly
based on international recommendations from peers who were not from the same coun-
try that the hospital is located in. To achieve this, the number of international recom-
mendations and the national ranking were combined into a global rank, resulting in a
Global Top 200 list (see chapter 2.6). This list includes a ranking of the 100 best global
hospitals while ranks 101-200 are sorted alphabetically.
The overall aim of this study is to provide the best possible data-based comparison of
hospital reputation and performance across countries.
To this end, the World’s Best Hospitals 2021 ranking is intended to be a resource to help
patients make a more informed and data driven decision when choosing the right hos-
pital for their medical needs, as well as to provide a composite benchmark for hospitals
which is indicative of their relative performance when compared to their national and
international peers.
2Statista and Newsweek are taking the ongoing COVID-19 pandemic very seriously. Over
the last year, hospitals have often been the center of attention and have faced unprece-
dented challenges. Statista and Newsweek have put meticulous efforts into evaluating
individual hospital responses and researching their actions as of January 2021 and iden-
tified critical situations as best possible based on the information available at the time.
Situations where health care systems were strained beyond capacity were considered in
the process of measuring the hospital’s response. A group of international journalists
further helped to identify hospitals that were criticized publicly for their response to the
pandemic. Based on the results of this process several hospitals from different countries
were not eligible for the 2021 ranking. Since this is an ongoing situation as of January
2021, Statista and Newsweek will continue to monitor events related to COVID-19, how-
ever the rankings presented in this project cannot and should not be used to make any
predictions or claims regarding future pandemic responses by individual hospitals.
2 Study Design
The following sections provide an overview of the study design and the underlying meth-
odology used to determine the various rankings. First, the new implemented features
and changes in this year’s edition will be described. Second, the general approach is out-
lined in chapter 2.2, followed by a description of the role of the Global Expert Board and
the approach that was used to both a create specialized hospital list and the Global Top
200 list. These approaches differ from the overall study design and are therefore de-
scribed separately in chapters 2.5 and 2.6. This section is followed by a more in-depth
description of specific rankings in chapter 3.
2.1 New features and changes in the 2021 edition
The following list provides a brief overview of all major changes in this year’s edition
compared to the World’s Best Hospitals 2020 ranking:
o Featuring four new countries - Austria, Belgium, Mexico and Poland: One main
goal of this project is to increase the global coverage each year in order to provide
the reader with the most comprehensive ranking of the World’s Best Hospitals.
The four additional countries were primarily chosen based on data availability
and comparability of health care systems (see chapter 3 – Specific Methodology).
o Introducing a Patient Reported Outcome Measures (PROMs) survey: In 2020,
Newsweek and Statista reached out to Hospitals and conducted a survey about
3the implementation and use of PROMs. (see chapter 2.7 – Patient Reported Out-
come Measures).
o USA only: Included a dimension for infection prevention to award hospitals which
performed above the national average regarding healthcare associated infections
(see chapter 3.1 – United States of America).
2.2 General Methodology
The study design of the 2021 World’s Best Hospital project is based upon three pillars:
Hospital recommendations from peers: The peer recommendations were collected in
two survey waves. First, Newsweek and Statista performed an online survey among tens
of thousands of doctors, health care professionals and hospitals managers in 25 coun-
tries. Over 74,000 medical experts in the 25 surveyed countries were invited to partici-
pate in the online survey.
The data was collected by Newsweek and Statista during an initial survey period from
September to November 2020. The survey was also promoted on newsweek.com. The
distribution of respondents was approximately 86% medical doctors, 7% hospital man-
agers and 7% other healthcare professionals (e.g. nurses). Participants were asked to
recommend hospitals in their own country as well as in other countries. The question-
naire did not suggest a list of recommended hospitals, therefore respondents were free
to suggest any hospital they deemed recommendable (merely aided by an autocomplete
4function for convenience). Self-recommendations were not allowed. Statista performed
plausibility checks on all data to prevent self-nomination.
For the second survey period, Statista asked physicians (general practitioners and spe-
cialists) to classify a set number of hospitals per country (the selected amount per coun-
try was relative to the total number of hospitals in the respective country e.g. 400 out of
ca, 1,500 relevant hospitals in Germany). The list was comprised of the hospitals which
received the highest number of national recommendations in the first wave as well as
the leading hospitals from the previous year’s ranking (both criteria had a huge overlap).
Participants were asked to assign a ranking position to these hospitals (e.g. Top 1, Top 5,
Top 10, Top 20, Top 30, Top 50, Top 100).
Answers were then weighted by a) the type of respondent by profession (with doctors
receiving the highest weight) and b) the confidence respondents had in their vote (0-
100%). Combined, the two survey periods resulted in more than 52,000 individual hos-
pital recommendations.
Finally, the combined data was analyzed and a national, as well as an international, rec-
ommendation score (0-100%) was calculated for every hospital in each country based on
the weighted number of national and international recommendations. The hospital with
the highest number of weighted national recommendations always received a national
recommendation score of 100%. The next best hospitals, in general, received a score
relative to the number of weighted national votes they received, e.g. when hospital A
80
received the most votes with 100, hospital B with 80 votes receives a score of 100 =80%.
In some cases, mostly for smaller countries, where one hospital would accumulate sig-
nificantly more votes than the next best hospitals, the scoring curve was smoothed
slightly to reduce the drop-off in relative scores, e.g. the abovementioned hospital b
would be adjusted around 85% or 90% in the same situation but always less than the
leading hospital. Since the achieved score is only relative to other hospitals within the
same country, this is a mathematically correct approach to grade hospitals by the re-
ceived recommendations. The calculation of the international recommendation score
was the same as with the national score, but the scoring drop-off was smoothed for all
countries to account for the lower average number of international votes (without the
smoothing factor distribution is more skewed).
Patient experience: Publicly available data from existing patient surveys were used to
analyze patient experience. Patient surveys are typically conducted by insurance compa-
nies among patients after their hospitalization Examples of survey topics include:
5o General satisfaction with hospital
o Recommendation of hospital
o Satisfaction with medical care
o Satisfaction with service and organization
As a dimension of perceived quality, patient experience reflects both the quality of care
(from the patient’s perspective) as well as the patient’s satisfaction with the hospital stay
as a whole, including service factors such as friendliness of the staff or quality of food.
Although there is some overlap between medical outcomes and KPIs we consider this a
separate quality dimension as has been established in scientific literature on patient re-
ported outcomes and patient reported experiences in recent years.
An overview of the patient satisfaction data used in each country is provided in chapter
3. Data on patient’ experience from official sources was not available for Austria, Den-
mark, Finland, Norway, Poland, Sweden, Thailand, Belgium, Spain, Mexico, Australia,
Canada, Singapore, India, Brazil, Japan and the United Kingdom. In these countries eval-
uations from Google serve as a substitute but were considered with a lower weight in
the scoring model (see chapter 2.4). Based on the available data, a patient satisfaction
score (0-100%) was calculated for each hospital in each country using the weighted sum
of indicators available in the specific data set.
Medical KPIs: Key performance indicators (KPI) on hospitals from a variety of public
sources were collected for most countries. These KPIs differ greatly between countries.
Some examples for indicators are:
o Data on quality of care for specific treatments
o Data on hygiene measures and patient safety
o Data on staffing, e.g. number of patients per doctors / per nurse
An overview of the KPI data used in each country is provided in chapter 3. The data
sources were identified through an extensive research process in each country and
through consultation with local experts. Some publicly available data sources were ex-
cluded for reasons mostly related to data quality and/or availability, e.g. certain data was
only available for a small number of hospitals in a given country or the number of miss-
ing values in regard to the KPIs was too high to perform a valid analysis. As a result of
this process, Hospital KPIs were not available for Belgium, Denmark, Finland, India, Israel,
The Netherlands, Poland, Spain, Mexico, Singapore and Thailand. For each country with
6available data, a KPI score (0-100%) was calculated based on the characteristics of the
specific dataset.
The national recommendation score, the international recommendation score, the pa-
tient satisfaction score and the KPI score (when available) were used to calculate a pre-
liminary hospital score. This score was presented to the expert board as well as a med-
ical journalist and his network for validation.
2.3 Validation by the Expert Board
The following section outlines the function of the global board of medical experts which
was founded by Statista to support the World’s Best Hospital Project.
The idea behind the board of experts is to create an independent body that is tasked
with the continuous development of the quality and scope of the project. The board of
experts is therefore tasked with providing quality assurance by validating the preliminary
hospital rankings outlined in chapter 2.2(which includes providing feedback on discrep-
ancies in the rankings) as well as providing input on possible improvements and expan-
sions of the current methodology. This includes input regarding new data sources and
improvements to the scoring algorithms as well as the expert’s opinion on the best hos-
pitals in specific medical fields. The members of the board of experts were carefully cho-
sen based on their national and international expertise and decade-long experience in
their respective medical fields as well as their scientific output. Current members of the
board of experts are:
The preliminary rankings were also sent to a medical journalist and his international net-
work of medical journalists and physicians for plausibility checks. These local experts
know the intricacies of the national health care systems and recent events or major
7changes (e.g. in health policy) which might affect the standing of certain hospitals. For
these reasons they are an important part of the quality assurance process. The results
of this process are cross-referenced by Statista and sent to the expert board again for
final validation. Based on this aggregate feedback a quantitative score for expert opinion
is calculated. The national recommendation score is then adjusted by this expert score
to reflect the expert board validation in the rankings.
The expert board also gathers for an annual conference where they have the opportunity
to discuss the status quo as well as new ideas and future improvements to the method-
ology in person.
2.4 Scoring Model
The Scoring model is based on the national recommendation score, the international
recommendation score, the patient satisfaction score and the KPI score and uses differ-
ent weights for the individual components as shown in this overview:
As shown above, recommendations from peers (doctors, hospital managers and
healthcare professionals) account for 55% (50% national recommendations from peers
from the respective country and 5% international recommendations from peers from
other countries) of each hospital‘s score. They are assigned the highest weighting in the
calculation of the score because medical experts are best suited to assess the quality of
a hospital. If patient experience data was not available for a certain country Google Star
Ratings were used to approximate patient satisfaction. Because these are less reliable
8as a data source the weight of patient experience in the Scoring Model was halved to
7.5%1.
For countries where Medical KPIs were not available the weights were re-proportioned
50
accordingly, e.g. the weight of National Recommendations from peers increases from 100
50
to 70 (71%).
The final hospital score is the weighted average of the available scores for each hospital,
adjusted by the expert score (see chapter 2.3). Based on this score and the chosen cut-
off for list length in the given country, hospitals are ranked top to bottom in each country.
The results of this ranking are displayed in the country lists published by Newsweek:
2.5 Specialty Hospitals
The study is aimed at rating the reputation and performance of general hospitals. Due
to the open design of the study, participants could not be restrained from recommend-
ing specialty hospitals. However, these hospitals were not ranked by their performance
in the respective medical fields due to the survey structure used, e.g. there was no rank-
ing among hospitals that specialize in treating cancer because the survey questions did
not specifically ask for recommendations regarding cancer patients.
The same data sources were used for KPIs and patient satisfaction scores of specialized
hospitals as for general hospitals, but the score calculated using the approach described
in 2.4 was removed from the national rankings, resulting in these specialized hospitals
not being a part of the country lists. The underlying reason is that specialized hospitals
1 Patient Experience Data was not available for Austria, Denmark, Finland, Norway, Poland, Sweden, Thai-
land, Belgium, Spain, Mexico, Australia, Canada, Singapore, India, Brazil, Japan and the United Kingdom
9like heart or cancer hospitals differ greatly in their services from general hospitals and
should therefore not be compared in their performance to these hospitals. On the other
hand, since these hospitals did receive a number of peer recommendations and per-
formed well enough in regard to KPIs and Patient Satisfaction Scores to enter the na-
tional rankings in their respective countries (despite usually being smaller and much
more specialized than their general counterparts), the authors of this study decided not
to omit specialized hospitals completely. Instead, these are displayed in a separate list.
This list is sorted alphabetically because, as outlined above, specialties are very hetero-
genous, not only in the treatment/procedures required, but also in the patient popula-
tion, e.g. when comparing patients from heart clinics to patients from psychiatric clinics.
No conclusion should be drawn from the order of the specialized hospitals in this list.
Since only a relatively low number of hospitals per country is represented in this list the
fact that these specialized hospitals were recommended by peers frequently enough to
make the list is a huge distinction compared to other specialized hospitals in the same
medical field in their respective country which did not make the list.
2.6 Global Top 200 List
In addition to the country lists two additional lists were created to identify the Top 200
best hospitals worldwide. These two lists are:
o Top 100 hospitals, sorted by rank
o Top 101 to 200 hospitals, sorted alphabetically
The top 100 hospitals were determined by the number of international recommenda-
tions received in the survey and their national rank. The logic behind this approach is
that hospitals which are ranked higher in the national rankings should not be ranked
lower than their national peers in the international ranking (to ensure internal validity),
e.g. #1 in country A #1 was ranked above #2 in country A on the global list.
Numbers 101 through 200 in the list consist of the next best hospitals in each country.
They are sorted alphabetically and not by rank because the data is too heterogenous
between countries to allow for further cross-country comparison past the top 100.
The global list does not include specialized hospitals for the same reasons they were
separated from the national rankings. Hospitals that were distinguished in this Global
Top 200 List are the very best hospitals in each country and therefore, across the world.
Out of 2000 hospitals included in the 2021 World’s Best Hospital Ranking, this elite group
represents 10% of all hospitals, making this the most prestigious ranking available to
date.
102.7 Patient Reported Outcome Measurements (PROMs) survey
Patient Reported Outcome Measurements (PROMs) are defined as standardized, vali-
dated questionnaires completed by patients to measure their perception of their func-
tional well-being and quality of life.
In recent years, PROMs measurement and the pursuit for patient centered care has be-
come a key topic in health care systems worldwide. Newsweek and Statista understand
the importance of this topic and in cooperation with the expert board, a survey was de-
signed and sent out to hospitals. The purpose of this survey is to determine the status
quo of PROMs implementation in hospital settings. The long-term goal is to establish an
annual questionnaire, that allows for progress measuring and a comparison on an inter-
national level.
In future editions, the evaluation and results of the PROMs survey will play an increasing
role for the international top list and will become an important step to reflect leading
hospitals efforts in this area. In order to highlight hospitals which participated in the first
survey edition, those that reported measuring PROMs are displayed in the correspond-
ing column of the ranking.
3 Specific Methodology
The following section expands on the general methodology outlined in chapter 2 by de-
scribing country specific lists and data sources for each country.
3.1 United States of America
There are currently around 6,090 hospitals in the USA according to the American Hospi-
tal Association (American Hospital Association 2021). The majority of Hospitals (around
5,150) are classified as Community Hospitals, which are defined as all nonfederal, short-
term general, and other specialized hospitals. Hospitals that are not accessible to the
general public, such as prison hospitals or college infirmaries, are excluded. The number
of total staffed beds in all community hospitals in the US is currently 787,995 (American
Hospital Association 2021).
Community hospitals differ in terms of ownership type, with around 2,900 being non-
government not-for-profit community hospitals, around 1,200 being for-profit commu-
nity hospitals and the remaining ca. 1,000 being state and local government community
hospitals. There is also a smaller number of other hospitals such as federal government
11hospitals (around 200) and nonfederal psychiatric hospitals (around 600). Texas and Cal-
ifornia have the highest number of community hospitals with 512 and 359 respectively,
while Delaware and the District of Columbia have the smallest number with 7 and 10.
The hospital KPIs used for the USA ranking are part of the Medicare “Hospital Compare”
dataset published by the Centers for Medicare & Medicaid Services (CMS). This compre-
hensive dataset revolves around an “Overall Hospital Quality Star Rating”, developed by
the Yale New Haven Health Services Corporation – Center for Outcomes Research and
Evaluation (CORE) and is available for over 4,500 hospitals publicly reporting quality in-
formation on the Hospital Compare platform. Each hospital is assigned one to five stars
based on the hospital’s overall performance across a number of quality measures re-
garding common conditions that hospitals treat. Hospitals are only assigned a Star Rat-
ing upon meeting certain data availability thresholds (outlined further below). Since the
start of the public reporting in 2016, between 78.9% and 80.3% of hospitals have received
a Star Rating for each reporting period (YNHHSC/CORE 2021).
Some more complex or specialty procedures are not reflected in the summary rating.
The aim is to generate a comprehensive representation of overall quality that can be
interpreted by patients and consumers, but also to identify performance categories
within the large number of hospitals in the US.
The following section describes the methodology used by CMS to generate the Star Rat-
ing which is useful to understand as a basis for the KPI score used in the World’s Best
Hospital Ranking for the USA. The latest Star Rating available at the time of the ranking
process (January 2021) was used for the scoring model.
In order to define the aforementioned Star Rating, measures that are relevant in the
context of assessing overall hospital quality were identified through stakeholder and ex-
pert feedback. Measures that are only reported by a small number of hospitals or which
were not necessarily indicative of higher quality were excluded, reducing the total num-
ber of included measures from 120+ to 51 in the currently reported Star Rating. The
selected measures were standardized into seven group performance categories which
make up the overall rating:
o Mortality (7)
o Safety of Care (8)
o Readmission (7)
12o Patient experience (10)
o Effectiveness of care (9)
o Timeliness of care (5)
o Efficient use of medical imaging (5)
The KPI score for US hospitals in the World’s Best Hospital 2021 Ranking was calculated
using the latest Star Rating available at the time of the ranking process, which is the Jan-
uary 2020 edition. The data samples for the group performance rankings were collected
from:
Data collection
Mortality
From Through
7/1/2015 6/30/2018
1. Death rate for heart attack patients
7/1/2015 6/30/2018
Death rate for coronary artery bypass graft
2.
(CABG) surgery patients
7/1/2015 6/30/2018
Death rate for chronic obstructive pulmonary
3.
disease (COPD) patients
7/1/2015 6/30/2018
4. Death rate for heart failure patients
7/1/2015 6/30/2018
5. Death rate for pneumonia patients
7/1/2015 6/30/2018
6. Death rate for stroke patients
7/1/2016 6/30/2018
Deaths among patients with serious treatable
7.
complications after surgery
Data collection
Safety of Care
From Through
1/1/2018 12/31/2018
1. Central line-associated bloodstream infections (CLABSI)
1/1/2018 12/31/2018
2. Catheter-associated urinary tract infections (CAUTI)
1/1/2018 12/31/2018
3. Surgical site infections from colon surgery (SSI: Colon)
1/1/2018 12/31/2018
Surgical site infections from abdominal hysterectomy (SSI:
4.
Hysterectomy)
1/1/2018 12/31/2018
Methicillin-resistant Staphylococcus Aureus (MRSA) Blood
5.
Laboratory-identified Events (Bloodstream infections)
131/1/2018 12/31/2018
Clostridium difficile (C.diff.) Laboratory-identified Events
6.
(Intestinal infections)
4/1/2018 3/31/2018
7. Rate of complications for hip/knee replacement patients
7/1/2016 6/30/2018
8. Serious complications
Data collection
Readmission
From Through
7/1/2015 6/30/2018
1. Hospital return days for heart attack patients
7/1/2015 6/30/2018
Rate of unplanned readmission for coronary artery by-
2.
pass graft (CABG) surgery patients
7/1/2015 6/30/2018
Rate of unplanned readmission for chronic obstructive
3.
pulmonary disease (COPD) patients
7/1/2015 6/30/2018
4. Hospital return days for heart failure patients
7/1/2015 6/30/2018
5. Rate of unplanned readmission after hip/knee surgery
7/1/2015 6/30/2018
6. Hospital return days for pneumonia patients
7/1/2017 6/30/2018
Rate of unplanned readmission after discharge from hos-
7.
pital (hospital-wide)
Data collection
Patient experience
From Through
1/1/2018 12/31/2018
Patients who reported that their nurses communicated
1.
well
1/1/2018 12/31/2018
Patients who reported that their doctors communicated
2.
well
1/1/2018 12/31/2018
Patients who reported that they received help as soon as
3.
they wanted
1/1/2018 12/31/2018
Patients who reported that staff explained about medi-
4.
cines before giving it to them
1/1/2018 12/31/2018
Patients who reported that their room and bathroom
5.
were clean
1/1/2018 12/31/2018
Patients who reported that the area around their room
6.
was quiet at night
1/1/2018 12/31/2018
Patients who reported that they were given information
7.
about what to do during their recovery at home
14Data collection
Patient experience
From Through
1/1/2018 12/31/2018
Patients who understood their care when they left the
8.
hospital
1/1/2018 12/31/2018
Patients who gave their hospital a rating on a scale from
9.
0 (lowest) to 10 (highest)
1/1/2018 12/31/2018
Patients who would recommend the hospital to their
10.
friends and family
Data collection
Effectiveness of care
From Through
10/1/2018 3/31/2019
1. Patients assessed and given influenza vaccination
1/1/2017 12/31/2017
Percentage of patients who left the emergency depart-
2.
ment before being seen
1/1/2018 12/30/2018
Percentage of patients who came to the emergency de-
3. partment with stroke symptoms who received brain scan
results within 45 minutes of arrival
1/1/2017 12/31/2017
Percentage of patients receiving appropriate recommen-
4.
dation for follow-up screening colonoscopy
1/1/2017 12/31/2017
Percentage of patients with history of polyps receiving fol-
5.
low-up colonoscopy in the appropriate timeframe
1/1/2018 12/31/2018
Percent of mothers whose deliveries were scheduled too
6. early (1-2 weeks early), when a scheduled delivery was not
medically necessary
1/1/2018 12/31/2018
Percentage of patients who received appropriate care for
7.
severe sepsis and septic shock.
1/1/2018 12/31/2018
Patients who developed a blood clot while in the hospital
8.
who did not get treatment that could have prevented it
1/1/2017 12/31/2017
Percentage of patients receiving appropriate radiation
9.
therapy for cancer that has spread to the bone
15Data collection
Timeliness of Care
From Through
1/1/2018 12/31/2018
1. Average (median) time patients spent in the emergency de-
partment, before they were admitted to the hospital as an
inpatient
1/1/2018 12/31/2018
2. Average (median) time patients spent in the emergency de-
partment, after the doctor decided to admit them as an in-
patient before leaving the emergency department for their
inpatient room
1/1/2018 12/31/2018
3. Average (median) number of minutes before outpatients
with chest pain or possible heart attack who needed spe-
cialized care were transferred to another hospital
1/1/2018 12/31/2018
4. Average (median) number of minutes before outpatients
with chest pain or possible heart attack got an ECG
1/1/2018 12/31/2018
5. Average (median) time patients spent in the emergency de-
partment before leaving from the visit
Data collection
Efficient use of medical imaging
From Through
7/1/2017 6/30/2018
Outpatients with low-back pain who had an MRI without
1. trying recommended treatments first, such as physical
therapy
7/1/2017 6/30/2018
Outpatient CT scans of the abdomen that were “combina-
2.
tion” (double) scans
7/1/2017 6/30/2018
Outpatient CT scans of the chest that were “combination”
3.
(double) scans
7/1/2017 6/30/2018
Outpatients who got cardiac imaging stress tests before
4.
low-risk outpatient surgery
7/1/2017 6/30/2018
Outpatients with brain CT scans who got a sinus CT scan at
5.
the same time
Hospitals may not be able to report data on all measures due to low patient volume, on
average hospitals reported 36 measures with an Interquartile Range of 21 to 50 during
the 2017 reporting period (YNHHSC/CORE 2018).
Based on these measures, group performance categories are created by comparing
the hospital’s group score to the national average group score in the same hospital
16category using confidence intervals for each hospital group score. Group performance
categories were therefore defined by the CMS as follows:
Group performance categories Description
group score with a confidence interval that fell
Above the national average
entirely above the national average
group score with a confidence interval that
Same as the national average
included the national average;
group score with a confidence interval that fell
Below the national average
entirely below the national average
After calculating the group scores for each hospital, the seven performance groups were
combined into a single hospital summary score by using weighted averages. The CMS,
taking into account stakeholder input from a survey that asked professionals to rank
groups for the purpose of the weighting, defined the weights based on the following
criteria:
o Group importance: Outcome groups (Mortality, Safety, Readmission) should be
weighted higher than process groups (Effectiveness and Timeliness of Care). The
weight of the efficient use of medical imaging group should reflect the limited
population receiving these measures.
o Consistency with existing CMS Policies and Priorities: Weights should be con-
sistent with existing weighting schemes of other CMS programs and the CMS
Quality Strategy.
o Stakeholder input: weighting should take into account the priorities of medical
professionals and patients.
The weighting scheme was also vetted by other stakeholders such as the Patient & Pa-
tient Advocate Work Group through a public input period during which feedback was
collected. The final weights used were:
Category Weight
Mortality 22%
Safety of Care 22%
Readmission 22%
Patient Experience 22%
17Effectiveness of Care 4%
Timeliness of Care 4%
Efficient Use of Medical Imaging 4%
Based on this weighting scheme the formula for the calculation of the hospital summary
score is:
∑7d=1 Wd αhd
Hospital Summary Scoreh =
∑7d=1 Wd
In a penultimate step, minimum thresholds were applied to ensure hospitals with low
numbers of certain patient types that were not able to report data on all measures get
excluded from public reporting if the total number of reported measures or groups is
below the threshold. This approach ensures the reliability (minimum reliability level of
0.75) and validity of the rating system. In the current methodology, the minimum num-
ber of measures per group is set at three and the minimum group threshold for a star
rating is three groups (with a minimum of one outcome group).
Lastly, the summary scores were clustered into five categories to assign the final star
ratings. In this classification, a three-star rating is considered average. The classification
into star ratings does not conclude that hospitals with the same star rating have identical
quality, rather the rating reflects the weighted average of the summarized, group-level
quality information for a hospital. Due to this approach, by definition, some hospitals will
be close to the boundaries of the next higher/lower star category. Therefore, to get a
clearer understanding of the quality of each hospital, the different set of measures con-
tributing to its star ranking are considered.
The distribution of the January 2020 Star Ratings is as follows:
Star Rating Number of Hospitals
5 Stars 407 (8.88%)
4 Stars 1138 (24.82%)
3 Stars 1120 (24.42%)
2 Stars 710 (15.48%)
1 Star 228 (4.97%)
18Because the Star Ratings are highly aggregated, the World’s Best Hospital 2021 rankings
for the USA do not merely take the Overall Star Rating into account to calculate the KPI
score. Instead, the weighted group performance scores using the same weights as the
CMS were chosen for the KPI score calculation. This ensures that the approach is com-
parable with the CMS but allows for a more differentiated KPI score than merely using
an overall Star Rating.
The full methodology report for the Hospital Compare Quality Star Rating can be found
at:
https://www.qualitynet.org/inpatient/public-reporting/overall-ratings/resources
Patient Satisfaction
In the US, the Patient Satisfaction Score is based on Medicare HCAHPS data. The Hospital
Consumer Assessment of Healthcare Providers and Systems (HCAHPS) survey is a stand-
ardized survey of hospital patients in the USA regarding their experiences during a re-
cent inpatient hospital stay (HCAHPS 2021). While many hospitals in the US already col-
lected information on patient satisfaction, prior to HCAHPS there was no national stand-
ard for collecting or publicly reporting patients’ perspectives of care information that
would enable valid comparisons to be made across all hospitals. The most recent dataset
available is the October 2020 edition and is based on surveys form patients discharged
in 2019. Based on the collected survey data, the CMS reports eleven HCAHPS Star Ratings
on Hospital Compare: 10 for the publicly reported HCAHPS measures, as well as an
HCAHPS Summary Star Rating. The specific measures are derived from certain items in
the HCAHPS survey as shown below:
HCAHPS Composite Measures Questions
1. Communication with Nurses 1,2,3
2. Communication with Doctors 5,6,7
3. Responsiveness of Hospital Staff 4,11
4. Communication about Medicines 13,14
5. Discharge Information 16,17
6. Care Transition 20,21,22
HCAHPS Individual Items Questions
7. Cleanliness of Hospital Environment 8
198. Quietness of Hospital Environment 9 HCAHPS Global Items Questions 9. Hospital Rating 18 10. Recommend the Hospital 19 Hospitals had to have at least 100 completed HCAHPS surveys over a given four-quarter period in order to receive a Star rating. The HCAHPS Summary Star Rating is the average of the Star Ratings. It is constructed from the Star Ratings from the 6 HCAHPS Composite Measures, a single Star Ratings for the two HCAHPS Individual Items listed above and a single Star Rating for the two HCHAPS Global Items (also listed above). The Star Ratings for the HCHAHPS Individual Items and HCHAPS Global Items are constructed by calculating the average of the Star Rating for the two individual items contained in these composite measures. The resulting 8 Star Ratings are combined into a simple average and rounded using normal rounding rules: HCAHPS Summary Star Rating Rounded Star Rating ≥1.00 and
Infection Prevention

   Hospitals in the US are required to report data about certain infections to the Centers
   for Disease Control and Prevention (CDC). This data includes the following measures:

      o   Catheter Associated Urinary Tract Infections

      o   Central Line Associated Bloodstream Infection

      o   Clostridium Difficile - laboratory-identified events

      o   MRSA Bacteremia - laboratory-identified events

      o   Surgical site infection - Abdominal Hysterectomy

      o   Surgical site infection - Colon Surgery

   For each measure and hospital, a Standardized Infection Ratio is calculated by the CDC
   and compared to the national average, resulting in a value that is either “above national
   average”, “same as national average” or, “below national average”.

   To identify, which of the US hospitals that are featured in the national ranking were per-
   forming “above national average”, measurement data from 01/01/2019 to 12/31/2019
   (most recent data publicly available from CMS by January 2021) was used. A hospital
   needs to meet the following criteria to be awarded with the Best Infection Prevention
   award (US only):

      o   At least 4 of the 6 measures need to be available for the mentioned time period
          of 2019.

      o   None of the available measures equals to the value “below national average”.

      o   At least one available measure equals to the value “above national average”.

   All used data was accessed from and is available at:

   https://data.cms.gov/provider-data/dataset/77hc-ibv8

3.2 Germany
   Germany currently has 1,925 hospitals (Statistisches Bundesamt 2018) which can be clas-
   sified into four groups defined by the type and level of care provided. This classification
   is based on existing health policy regulations:

      o   Basic and standard care hospital

                                                                                            21
o General care hospital
o Maximum/tertiary care hospital
o Specialized hospitals
Basic and standard care hospitals are usually the smallest types of hospitals, providing
only general services or basic surgeries. They usually do not have specialty wards. Be-
cause of these limitations they are mostly not represented in the World’s Best hospital
ranking for Germany.
General care hospitals usually have several specialty wards and even provide maternity
care. They usually do not have highly specialized specialty wards, instead referring their
patients to specialized hospitals or maximum care hospitals if needed.
Maximum care hospitals usually treat the most complex and resource intensive cases.
They are therefore most often equipped with expensive and cutting edge technical and
diagnostic equipment as well as specialized physicians. Many maximum care hospitals
are university hospitals.
Specialized hospitals, while often providing a range of general services, are focused on
certain specialties (e.g. Cardiology) or complex diagnoses (e.g. Cancer). They are repre-
sented in the national ranking for Germany relatively often (compared to other coun-
tries) because the German hospital landscape is still relatively heavy on specialized hos-
pitals which are known for their expertise in certain medical fields. Their number has
been slowly decreasing over the last several years, with a tendency towards centraliza-
tion into larger and more diversified medical centers.
Hospitals in Germany can be differentiated further by ownership type, with 29% of hos-
pitals being under public, 34% under private non-profit and 37% under private for profit
ownership (Statistisches Bundesamt 2018). The average size of a hospital in Germany is
245 inpatient beds, with public hospitals on average being by far the largest and private
hospitals being the smallest on average.
The 2021 edition of the World’s Best Hospital list for Germany ranks the top 220 hospi-
tals, which is the second longest list due to the large amount of recommendations and
the good quality of available KPIs and patient experience data (see below).
German hospitals are required to publish freely available annual quality reports online
since 2005 (originally published bi-annually from 2005 - 2012), therefore data on a large
number of KPI’s for German hospitals is readily available. The quality reports provide in-
depth information about the structure and services of each hospital, such as range of
22diagnoses and number of provided treatments, number of staff, hygiene measures,
number of complications or barrier-free accessibility. The reports not only feature de-
scriptive information but also quality indicators which give an indication of the quality of
the care provided in each hospital. The quality reports of 2019 are the most recent ones
available. Further information about hospital quality reports in Germany is available at:
https://www.g-ba.de/institution/themenschwerpunkte/qualitaetssicherung/quali-
taetsdaten/qualitaetsbericht/
The following KPIs from the quality reports were used for the World’s Best Hospital rank-
ing in Germany because they are most comparable across hospitals and representative
of a hospital’s general performance:
o Medical Staffing: Number of cases per doctor
o Nurse Staffing: Number of cases per nurse
o Patient safety: Number of measures to increase patient safety (e.g. standardized
pre-surgery checklists)
o Hygiene: Number of measures to increase hygiene (e.g. hospital infection sur-
veillance system)
o Quality and complaint management: number of measures to guarantee quality
and manage complaints (e.g. patient surveys, quality management work groups,
structured complaint management systems)
Additionally, quality of care data from Qualitätssicherung mit Routinedaten (QSR)
was used for the ranking. QSR is based on claims data from the large German health
insurer AOK and includes a large number of indicators for a range of surgeries which are
analyzed in regard to quality of care. The eleven publicly reported measures which were
considered in the scoring model are:
o Hip replacement (Osteoarthritis)
o Surgery for a femoral fracture near the hip joint
o Knee replacement (Osteoarthritis)
o Gallbladder removal for gallstones
o Appendectomy
o Therapeutic cardiac catheter (PCI) in patients without a heart attack
23o Surgery for benign prostate enlargement
o Complete prostate removal for prostate cancer
o Closure of inguinal hernia
o Hip replacement (not for fracture or infection)
o Knee replacement (not for fracture or infection)
The data used for the 2021 ranking was published by the AOK in November 2020 and
includes surgeries performed in 2016 to 2018 (with follow up treatment including up
until 2019). Additional information about QSR is available at:
http://www.qualitaetssicherung-mit-routinedaten.de/
Patient Satisfaction
BARMER and AOK, two of Germany’s largest health insurers, are performing a patient
satisfaction survey since 2011 in cooperation with “Weisse Liste”, the leading hospital
quality directory in Germany. The survey is based on the Patients’ Experience Question-
naire (PEQ) which has been validated scientifically. Since 2018, KKH, a medium sized Ger-
man health insurer, has joined the survey. In total, over a million pen&pencil based pa-
tient questionnaires are sent out with a response rate of close to 50%. The survey in-
cludes about 15 questions covers the following areas:
o Recommendation of Hospital
o Satisfaction with medical care
o Satisfaction with nursing care
o Satisfaction with service and organization
Results are calculated for each department and aggregated to a total score per hospital.
Results are reported for hospitals that have at least 75 completed surveys (or at least 50
for a single department). The detailed description of the survey can be found at the
Weisse Liste website:
https://www.weisse-liste.de/de/service/ueber-krankenhaussuche/versichertenbefra-
gung/
243.3 Japan
There are currently 8,300 hospitals in Japan, of which 7,246 are general hospitals. Re-
garding the 47 prefectures in Japan, Tokyo prefecture has the highest number of hospi-
tals with 638 hospitals and Tottori prefectures has the lowest number of hospitals with
43 hospitals. The number of hospital beds in relation to the population is one of the
highest worldwide, with 12.12 hospital beds per 1,000 inhabitants (MHLW 2019).
The KPIs for Japanese hospitals from the diagnosis procedure combination (DPC) are
published by the Ministry of Health, Labour and Welfare in Japan. Diagnosis procedure
combination (DPC) is a Japanese evaluation system for healthcare costs, length of hospi-
tal stays, and the healthcare needs. DPC hospitals are hospitals which meet the defined
criteria. For this project, the KPI score was calculated with the Function Evaluation Coef-
ficient II data. The following data from April 2019 was used which was the most current
data at the time of the ranking process:
o Coefficient of Insurance coverage
o Coefficient of Efficiency
o Coefficient of Complexity
o Coefficient of Coverage
o Coefficient of Emergency
The coefficient of Insurance coverage evaluates whether DPC data was determined
appropriately. The base value of the coefficient is 1, minus and plus points of 0.05 are
possible. For example, the regularly announcing DPC score of hospitals leads to an im-
provement and a decrease in score will occur if more than 2% of the diagnosis in a hos-
pital are uncategorized. The coefficient of efficiency keeps track on patients’ length of
stay. The average length of stay in a hospital is compared with the average length of stay
in all DPC hospitals. The coefficient of complexity measures how many patients with a
complicated diagnosis are treated by the hospital. The variety of categories that the
hospital can diagnose and treat compared to all DPC hospitals are captured by the
weighting factor of coverage. The coefficient of emergency measures the capacity of
the hospitals taking emergency patients. Emergency is defined as the first two days of a
patient’s stay.
All used data was accessed from and is available at:
https://www.mhlw.go.jp
253.4 South Korea
The healthcare system in South Korea has two components, health insurance and med-
ical aid. The national health insurance system provides coverage to all citizens and it is
managed comprehensively in the form of social insurance (Health Insurance Review &
Assessment Service 2020). According to the Ministry of the Interior and Safety, in 2017
the country had 343 large general hospitals, 1,467 long-term care hospitals, and 197
specialized hospitals. Seoul is the region with the most hospitals in South Korea and
Jeju is the region with the fewest. The number of hospital beds in relation to the popu-
lation is one of the highest worldwide, with 13.5 beds per 1,000 inhabitants (Korean
Statistical Information Service 2020).
The medical KPIs used for ranking South Korean hospitals are published by the na-
tional Health Insurance Review & Assessment Service (HIRA). Besides other activities,
HIRA monitors the health care system through on-site investigations of hospitals, qual-
ity assessments, medical claim reviews, etc. Hira provides an open-data platform with
assessments of different quality indicators. For this project, the following indicators
from hospital investigations were used:
o ICU evaluation
o Acute disease evaluation
o Cancer Disease Evaluation
o Drug evaluation
HIRA publishes ratings for each category, based on the results of their evaluation. The
ratings for each indicator are presented on a 5-point scale.
All used data was accessed from and is available at:
https://opendata.hira.or.kr/op/opc/selectOpenDataList.do?sno=0&pub-
lDataTpCd=008&searchCnd=&searchWrd=&pageIndex=1
Patient Satisfaction
The Health Insurance Review and Assessment Service (HIRA) conducts patient experi-
ence evaluations to spread a patient-centered medical culture and to improve the qual-
ity of care experienced by the public. The target institutions are high-level general hos-
pitals and general hospitals with more than 300 beds. For this ranking, survey data
26from 2019 was used. The patients were asked to rate the hospitals for the following cri-
teria:
o Nurse Services
o Physician Services
o Dosing and treatment process
o Hospital environment
o Guarantee of patient rights
o Overall evaluation
The evaluation results are released as a 100-point score for each of the six areas.
All used data was accessed from and is available at:
https://www.hira.or.kr/re/diag/getDiagEvlList.do?pgmid=HIRAA030004000100
3.5 France
According to the OECD, France currently has 3,042 hospitals (OECD 2020). Public institu-
tions account for about 65 percent of hospital capacity and activity. Private for-profit fa-
cilities account for another 25 percent, and private nonprofit facilities make up the re-
mainder (The Commonwealth Fund 2020). To calculate the KPI score for French hospi-
tals, publicly available data from the Haute Autorité de Santé (HAS) was analyzed. HAS is
an independent public authority that contributes to the regulation of the French health
system and assures quality standards in health care measurements. It publishes data
regarding the quality and safety of French hospitals, following a consistent methodology
to guarantee validated and comparable data measures. HAS also measures patient sat-
isfaction and experience, resulting in a comprehensive dataset, allowing for a detailed
comparison of different hospitals.
For the World’s Best Hospitals Ranking, nine different KPIs were used. If available, the
following KPIs were used to calculate an overall score:
o Patient rights
o Patient journey
27You can also read