Research to review and update indicators of climate-related risks and actions in England - Charles Ffoulkes, Ben Hockridge, Harriet Illman, George ...
←
→
Page content transcription
If your browser does not render page correctly, please read the page content below
Adaptation Committee

Research to review and update
indicators of climate-related risks
and actions in England
Charles Ffoulkes, Ben Hockridge, Harriet Illman, George Holmes,
Frances Manning and Lucy Wilson

Final Report
4 June 2021
ADAS GENERAL NOTES
Project No:          1030257
Title:               Research to review and update indicators of climate-related risks and actions in
                     England
Client:              Adaptation Committee of the Committee of the Climate Change
Date:                4 June 2021
Office:              ADAS Oxford, 11D Park House, Milton Park, Abingdon, Oxford, OX14 4RS
Status:              Final Report
Citation:            Ffoulkes, C., Hockridge, B., Illman, H., Holmes, G., Manning, F. and Wilson, L. (2021)
                     Research to review and update indicators of climate-related risks and actions in
                     England. ADAS report to the Committee on Climate Change.

This document has been approved by:

            Lead Author: Charles Ffoulkes

                  Position: Associate Director, ADAS Climate & Sustainability
                      Date: 4 June 2021

    Quality Reviewer: Lucy Wilson

                  Position: Director, ADAS Modelling & Informatics
                      Date: 4 June 2021

  RSK ADAS Ltd (ADAS) has prepared this report for the sole use of the client, showing reasonable skill and care, for the intended purposes
  as stated in the agreement under which this work was completed. The report may not be relied upon by any other party without the
  express agreement of the client and ADAS. No other warranty, expressed or implied, is made as to the professional advice included in
  this report.
  Where any data supplied by the client or from other sources have been used, it has been assumed that the information is correct. No
  responsibility can be accepted by ADAS for inaccuracies in the data supplied by any other party. The conclusions and recommendations
  in this report are based on the assumption that all relevant information has been supplied by those bodies from whom it was requested.
  No part of this report may be copied or duplicated without the express permission of ADAS and the party for whom it was prepared.
  Where field investigations have been carried out, these have been restricted to a level of detail required to achieve the stated objectives
  of the work.
  This work has been undertaken in accordance with the quality management system of RSK ADAS Ltd.
ACKNOWLEDGEMENTS
The ADAS Project Team
Prepared by:                     Charles Ffoulkes, Principal Consultant (Climate Resilience)
                                 Ben Hockridge, Senior Consultant (GIS and Remote Sensing)
                                 Harriet Illman, Senior Consultant (Sustainable Food)
                                 George Holmes, Consultant (GIS and Remote Sensing)
                                 Frances Manning, Consultant (Sustainable Agriculture)
Reviewed by:                     Lucy Wilson, Director, ADAS Modelling & Informatics

The Committee on Climate Change
Project manager:                 Brendan Freeman (Adaptation Committee – Natural Environment lead)
Reviewers:                       Gemma Holmes (Adaptation Committee)
                                 Miriam Kennedy (Adaptation Committee)

Data and information providers
We would like to thank a number of organisations that directly or indirectly contributed data,
information or support for the analysis provided in this study:
Adaptation Committee; Centre for Ecology & Hydrology; English Wine; Environment Agency; Forestry
Commission; HR Wallingford; JBA Trust; Joint Research Committee; Met Office; National Trust;
Ordnance Survey; Rural Payments Agency, Susdrain; and Wine Great Britain.

Report to the Committee on Climate Change
Research to review and update indicators of climate-related risks and actions in England
© ADAS (2021)
CONTENTS
1    INTRODUCTION ............................................................................................................. 1
     1.1 Background ............................................................................................................................1
     1.2 Research purpose .................................................................................................................1
     1.3 Approach .................................................................................................................................2
     1.4 Scope and interpretation of climate ....................................................................................2
2    INDICATORS UPDATED ................................................................................................ 3
     2.1 Rate of development of properties in areas at risk of flooding .......................................3
     2.2 Area of impermeable surfacing in urban areas .................................................................8
     2.3 Area of urban greenspace ..................................................................................................12
     2.4 Wildfire incidents and area burnt.......................................................................................14
     2.5 Area under vine and volume of wine produced ..............................................................18
3    INDICATORS AND EVIDENCE-BASES DEVELOPED ................................................ 21
     3.1 Average field size (grassland and arable) in England ...................................................21
     3.2 Change in total hedgerow length ......................................................................................23
     3.3 Tree losses as a result of extreme weather ....................................................................26
     3.4 Uptake of natural flood management ...............................................................................30
4    REFERENCES .............................................................................................................. 36

Report to the Committee on Climate Change
Research to review and update indicators of climate-related risks and actions in England
© ADAS (2021)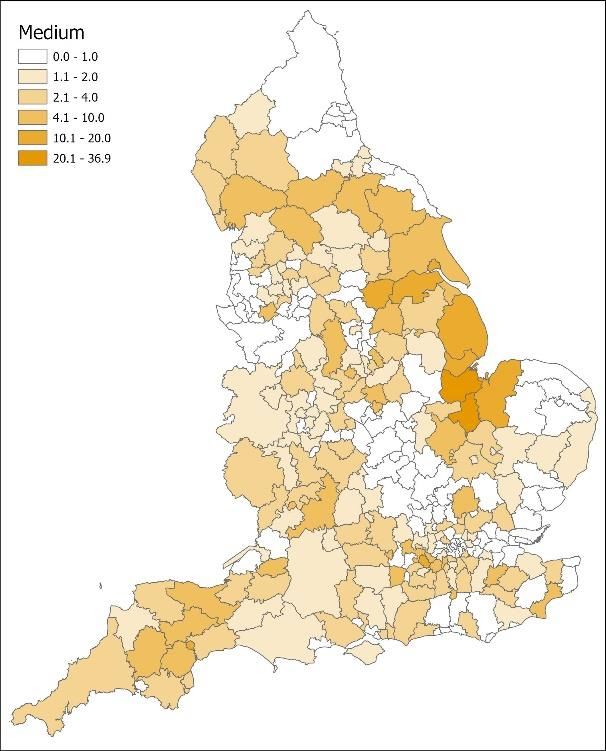
1     INTRODUCTION
1.1   Background
      In order for the Adaptation Committee of the Committee on Climate Change (CCC) to report
      to parliament on progress in adapting to climate change in England, the Adaptation
      Committee uses an evaluation method based on a two-part framework. The first part relates
      to the assessment of analysis of trends in indicators of change that relate to climate change
      risks and adaptation. The second part assesses the extent to which planning for climate
      change is taking place, including whether climate-sensitive plans and policies are adequately
      considering the risks and opportunities from climate change.
      The Adaptation Committee applies this framework across a number of defined ‘adaptation
      priorities’ to understand if there is a plan in place; whether actions are being implemented;
      and effects of actions in managing vulnerability. The Adaptation Committee use a set of
      metrics and indicators to assess and track changes in climate change risks and adaptation,
      whereby observed changes are monitored through time (using key data and information)
      across three core components of adaptation: indicators of risk, indicators of adaptation
      action, and indicators of climate impact.
      There are a number of ‘types’ of indicator the Adaptation Committee use for their
      assessment of adaptation progress in England. These comprise indicators to assess trends in
      risk factors (hazard, vulnerability and exposure), as well as indicators to assess trends in
      adaptation action (input and output), and impacts.
      To enable the Adaptation Committee to comprehensively apply this framework and provide
      up-to-date information in the next report to Parliament in 2021 assessing the government’s
      progress on the second National Adaptation Programme (NAP), a number of metrics and
      indicators that form the basis of this assessment require updating.

1.2   Research purpose
      This research reviews a subset of the Adaptation Committee’s full indicator set. The subset
      of indicators updated in this study were identified by the Adaptation Committee as part of
      the procurement process for this project. ADAS were not involved with the selection of
      indicators chosen to be updated. It is recognised that there may be alternative indicators
      that could also be suitable to demonstrate progress in adaptation, however these were not
      considered within the scope of this project.
      The subset of indicators assessed by ADAS in this project provides supporting evidence to
      inform current understanding of adaptation progress being made in England. It is expected
      that these indicators will be used by the Adaptation Committee, alongside other indicators
      within the full indicator set, to inform the Adaptation Committee’s 2021 report to
      government. The purpose of this research is not to provide a comprehensive or
      representative overview of adaptation progress in England, rather it is intended to provide
      updated indicators (within the context of climate resilience) to inform the Adaptation
      Committee of the current evidence base.

      Report to the Committee on Climate Change                                                  1
      Research to review and update indicators of climate-related risks and actions in England
      © ADAS (2021)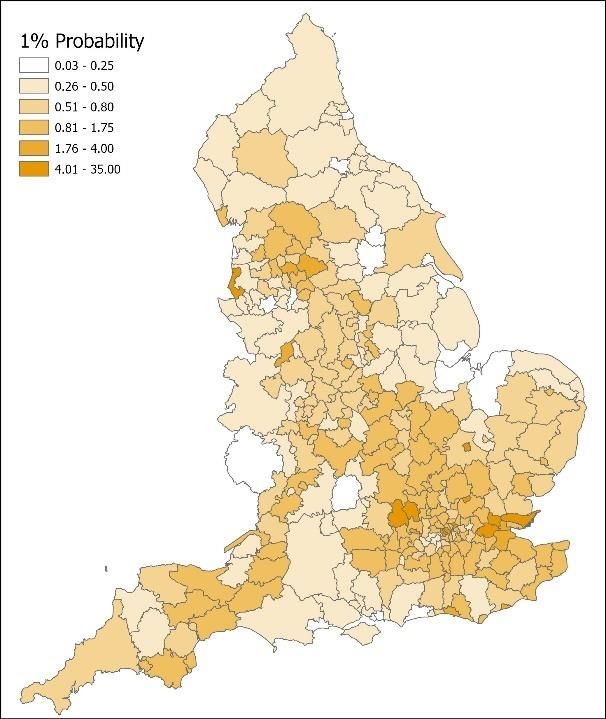
1.3     Approach
        In total, nine indicators of climate-related risk and actions are assessed in this report, which
        may be of relevance to various sectors including the built environment, infrastructure, the
        natural environment (including agriculture, forestry and fisheries), people and health, and
        business. The data and information obtained came through a range of sources through
        consultation with stakeholders and industry representatives, and web-based searches.
        For each indicator, a high-level description is provided and reference to the ‘type of indicator
        it is categorised as under the Adaptation Committee’s assessment.

1.3.1   Updated indicators
        Where robust datasets were available, with suitable metrics to demonstrate change over
        time, indicators have been updated or developed to provide trends and allow interpretation
        of the data for climate resilience. For each updated indicator, we provide detail on the data
        sources and methods used, outline the trends and implications for climate resilience, and
        assess the robustness of the indicator as a measure of assessing climate-related risks and
        actions.

1.3.2   Updated evidence bases
        Where datasets or suitable metrics were not available to update or develop an indicator, the
        evidence base was updated instead. For this, we provide detail on the available information,
        which may include industry insight, ad hoc data, grey literature, maps etc.

1.4     Scope and interpretation of climate
        The project scope was for England only. However, for some indicators and evidence bases,
        disaggregated data was not available. In these instances, the data represented will include
        England, but not be completely attributable at a regional level (e.g. if data is for England and
        Wales, or the United Kingdom).
        In this study we provided analysis of the available data and information. It is noted that some
        indicators are not purely climate driven, may not have a high (or any) sensitivity to climate
        change, and in fact require other drivers. Subsequently, indicators should be interpreted
        with caution and not used in isolation or out of context.

        Report to the Committee on Climate Change                                                     2
        Research to review and update indicators of climate-related risks and actions in England
        © ADAS (2021)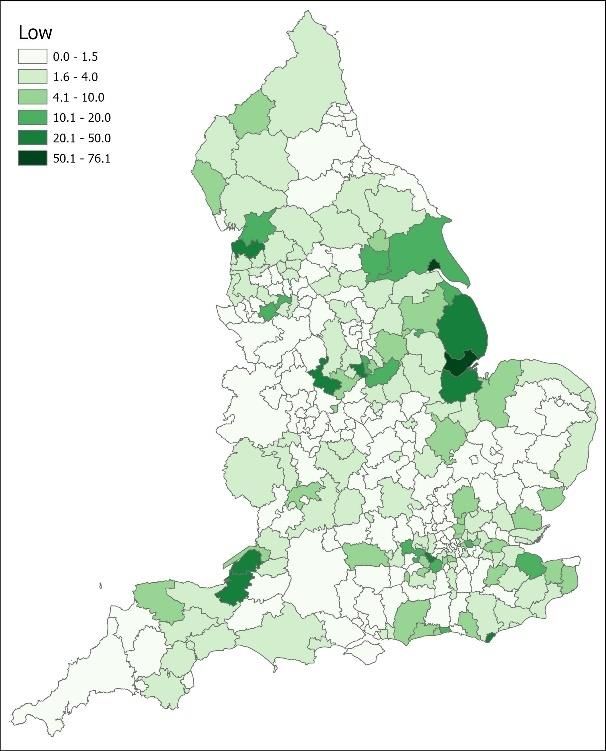
2 INDICATORS UPDATED
The indicators in this section are part of the Adaptation Committee’s indicator set and were
updated with new data and analysis as part of this study.
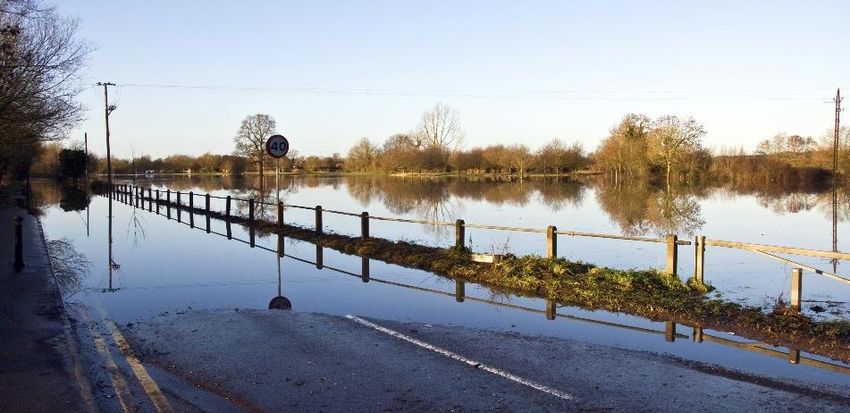
2.1 Rate of development of properties in areas at risk of flooding
Description: Rate of development of residential and non-residential properties in areas at
risk of flooding
Type: Exposure
Time series: 2018 to 2020
Region: England
2.1.1 Introduction
This indicator was last updated by ADAS (2019). The indicator provides an assessment of the
development of residential and non-residential properties that are being carried out within
areas of flood risk to understand changes and trends in exposure and vulnerability of
property to flooding. This update provides new data for 2020.
2.1.2 Data source and method
This method examines the impact of two different sources of flooding on properties,
following on from work previously carried out by HR Wallingford (2015). The ‘Risk of
Flooding from Rivers and Sea’ (RoFRS) and ‘Risk of Flooding from Surface Water’ (RoFSW).
Both these datasets identify areas of High (each year, there is a chance of flooding of greater
than 1 in 30), Medium (each year, there is a chance of flooding of between 1 in 30 and 1 in
100) and Low (each year, there is a chance of flooding of between 1 in 100 and 1 in 1000)
flood risk.
Property data was provided by the latest OS AddressBase layer. This layer provides a
classification code for each property, which provides information on the property type.
Previous studies of properties at risk have classified properties into multi-coloured manual
(MCM) codes: dwelling, retail, offices, warehouses, leisure, public buildings, industry and
miscellaneous. Therefore, in order to maintain consistency with previous studies, the
AddressBase codes were matched to an MCM code: dwelling (MCM_0), retail (MCM_2),
offices (MCM_3), warehouses (MCM_4), leisure (MCM_5), public Buildings (MCM_6),
industry (MCM_8) and miscellaneous (MCM_9). Spatial analysis was then carried out to
identify which (if any) flood risk area each property was within, and the local authority it was
within, enabling summaries by local authority, MCM code and flood risk.
It is recognised that this analysis used different property data to that used previously; with
AddressBase Premium used in ADAS (2019), while this analysis was carried out using
AddressBase Plus. The main difference between the two datasets is the level of content
provided.
• AddressBase Premium provides the most detailed view of an address and its life
cycle for England, Wales and Scotland, including all the information relating to an
address or property from creation to retirement. This level of data requires more
processing than that of other products in the AddressBase product range.
Report to the Committee on Climate Change 3
Research to review and update indicators of climate-related risks and actions in England
© ADAS (2021)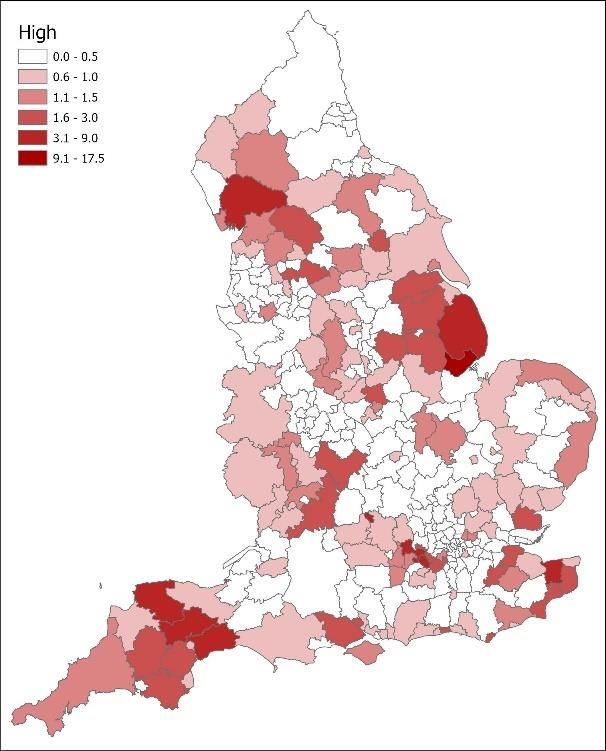
• AddressBase Plus is a more refined and smaller product than AddressBase Premium
and was used to reduce the size of the data that needed to be sent and processed.
AddressBase Plus contains current properties including addresses sourced from
Local Authorities, Ordnance Survey and Royal Mail, all provided with an UPRN
(Unique Property Reference Number) for England, Wales and Scotland.
Consequently, this resulted in differences in the categories of properties included in the
analysis (e.g. AddressBase Premium incudes pre-build and historic addresses, whilst
AddressBase Plus does not). Due to the differences in these datasets, it was therefore not
possible to robustly evaluate an ongoing trend for this report. However, future updates of
this indicator using AddressBase Plus will be comparable.
2.1.3 Trends and implications for climate resilience
2.1.3.1 Risk of flooding from rivers and sea
Changes in the number of properties at risk from flooding is likely to be a combination of
changes to the flood risk extents, and changes in property numbers resulting from the
underlying datasets used (see 2.1.2).
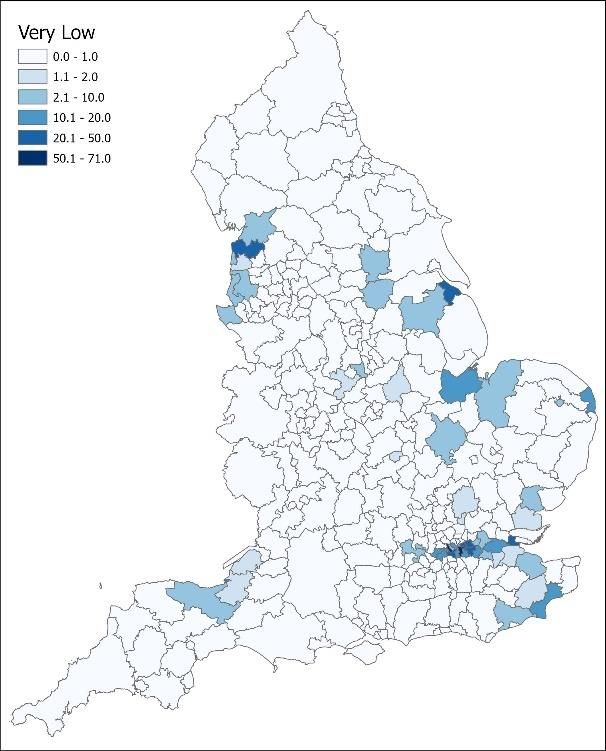
The percentages of the total numbers of properties per local authority that are in high,
medium and low flood risk areas are shown on maps in Figure 1. The total number of
properties in each risk area are reported in Table 1.
Table 1. Number of properties at risk from flooding from rivers and sea for England by property
type. Source: ADAS for the CCC.
High Medium Low Very low
Property type Likelihood Likelihood Likelihood Likelihood Total
of flooding of flooding of flooding of flooding
Dwelling 132,625 472,915 842,798 580,215 2,028,553
Retail 8,446 22,616 33,342 17,773 82,177
Offices 5,674 14,734 20,769 17,767 58,944
Warehouses 9,983 23,583 30,309 11,412 75,287
Leisure 8,867 7,655 13,764 4,991 35,277
Public Buildings 2,284 5,702 8,407 4,172 20,565
Industry 3,034 6,381 5,469 2,224 17,108
Miscellaneous 12,952 17,447 26,410 17,214 74,023
Report to the Committee on Climate Change 4
Research to review and update indicators of climate-related risks and actions in England
© ADAS (2021)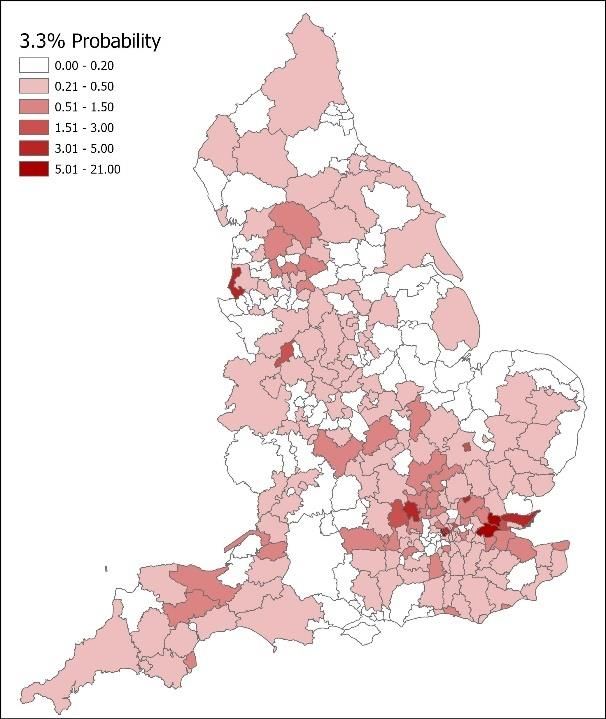
Figure 1. Percentage of properties in each Local Authority at High (a), Medium (b) Low (c) and Very
low (d) risk of flooding from rivers and sea in England. Source: ADAS for the CCC.

Report to the Committee on Climate Change                                                        5
Research to review and update indicators of climate-related risks and actions in England
© ADAS (2021)
2.1.3.2 Risk of flooding from surface water
         As with the analysis for the risk of flooding from rivers and sea, the analysis for the risk of
         flooding from surface water is likely to yield different results to those in previous analysis,
         due to differences in the AddressBase data used, therefore an assessment of trend was not
         undertaken. Table 2 shows the number of properties at risk at each risk level.

         Table 2. Number of properties at risk from flooding from Surface Water for England by property
         type. Source: ADAS for the CCC.

          Property type                3.3% probability            1% probability       0.1% probability          Total
          Dwelling                                116,860                 259,775                   938,122        1,314,757
          Retail                                     4,172                   9,769                   38,113           52,054
          Offices                                    2,110                   5,616                   20,444           28,170
          Warehouses                                 2,518                   5,604                   22,662           30,784
          Leisure                                    1,441                   2,786                    9,527           13,754
          Public Buildings                           2,119                   4,907                   16,365           23,391
          Industry                                   2,335                   4,550                   12,572           19,457
          Miscellaneous                            11,829                   23,589                   66,231          101,649
         Across all of the risk levels, the south-east consistently has a high percentage of properties
         at risk of surface water flooding (Figure 2).

         Flood Map for Planning (Rivers and Sea)
         Analysis was also carried out to calculate the number of properties within the Environment
         Agency ‘Flood Map for Planning’ zones. These results are displayed in Table 3 for each
         property type, as defined by the relevant multi-coloured manual (MCM) reference code. The
         percentage of properties in the planning flood map remained roughly similar to 2018. The
         greatest increase in percentage of properties in flood zones 2 & 3 was in MCM_5 (Leisure)
         and MCM_4 (Warehouses). It is anticipated that this is partly due to differences in the
         underlying dataset (i.e. AddressBase Plus being used instead of AddressBase Premium).
         Most other property types saw a decrease in the percentage of properties inside flood zone
         2 and flood zone 3 between 2018 and 2020.

         Table 3. Percentage of properties in each flood zone (numbers for each zone have been calculated
         individually) for each property type, as defined by the relevant multi-coloured manual reference
         code. Source: ADAS for the CCC.

                                                     Percentage of properties (%)                    Change (2018-2020)

            Property type                                 Zone 3                Zone 2               Zone 3         Zone 2
            Dwelling                                         5.6                  8.0                 -0.1           -0.2
            Retail                                           8.0                 12.5                 -0.5           -0.4
            Offices                                          9.3                 14.6                 -0.2           -0.2
            Warehouses                                     10.9                  16.5                  1.3            2.0
            Leisure                                        14.4                  18.7                  1.4            2.2
            Public Buildings                                 6.8                  9.8                 -0.3           -0.5
            Industry                                         9.7                 13.2                  0.1            0.0
            Miscellaneous                                    9.5                 13.5                 -0.6           -0.6

         Report to the Committee on Climate Change                                                                           6
         Research to review and update indicators of climate-related risks and actions in England
         © ADAS (2021)
Figure 2. Percentage of properties in each Local Authority with a 3.3% (a), 1% (b) and 0.1% (c)
probability of flooding from surface water in England. Source: ADAS for the CCC.
2.1.4 Robustness of indicator
In this analysis, AddressBase classification codes had to be converted to MCM codes; used
in the original analysis by HR Wallingford (2015). This amalgamation into MCM categories
may have some differences to the methods used previously, since details on the MCM
classification used by HR Wallingford was not available.
Furthermore, as previously mentioned, the use of different Addressbase data (Plus rather
than Premium) will lead to some differences in property numbers and the types of properties
included in the analysis. Additional properties are included in the Addressbase Premium
product, which leads to an apparent decrease in most property types for 2020 where the
Addressbase Plus product has been used. Additional analysis could be carried out to re-
Report to the Committee on Climate Change 7
Research to review and update indicators of climate-related risks and actions in England
© ADAS (2021)analyse the 2018 data to match the latest Addressbase (Plus) data. This would allow for a
better comparison between the years to be carried out.
2.2 Area of impermeable surfacing in urban areas
Description: Area of impermeable surfacing in urban areas
Type: Vulnerability
Time Series: 2001 to 2020
Region: England
2.2.1 Introduction
This indicator was last updated by ADAS (2019). The indicator provides the relative
proportions of manmade and natural surfaces in the urban environment, in England,
between 2001 and 2020. This update provides new data and analysis for 2020.
2.2.2 Data source and method
The ‘Topography’ layer of Ordnance Survey’s MasterMap product (the most detailed digital
mapping available nationally) records the surface material of each land parcel as “Natural”,
“Manmade” or “Multiple”. The area categorised as “Manmade” is assumed to be
impermeable. The “Multiple” category represents domestic gardens, which is assumed to
be a mixture of permeable and impermeable surfaces. A methodology was developed by HR
Wallingford (2012) to estimate the impermeable fraction of this category based on urban
creep research under the assumption that estimated urban creep rates could be applied to
these areas to determine the potential likely increase in intra-urban impermeable areas. The
same method has been used for this indicator update.
Data was sourced from HR Wallingford (2012) for 2001, 2008 and 2011 data, and ADAS
(2019) for 2016 and 2018 data. 2020 data is new analysis as part of this project.
To define the urban (built-up) area, up-to-date OS AddressBase Plus data was used to
calculate the property density per 1km grid cell. Two methods were used to define the urban
area:
• Method 1: Uses the method first developed by HR Wallingford (2012) that uses a
property density of >500 properties per 1km cell to identify the urban area. This
method is comparable to previous impermeable calculations dating back to 2001.
• Method 2: Improved to include larger areas of greenspace within cities and towns,
which are not captured in method 1. This improved approach takes account of the
values of the neighbouring cells by taking an average of the central cell and its
surrounding eight cells. This smooths the values, better defines the edge of urban
areas and accounts for city centre greenspace. The original mask using > 500
properties per 1km cell was added to the revised mask to ensure inclusion of smaller
settlements that would be missed by the revised method. This method is
comparable to previous impermeable calculations carried out in 2016 by ADAS
(2017).
The urban creep method (Gill et al., 2008) used the property density to assign a housing class
to each grid cell (Table 4). The impervious fractions of the “Multiple” areas were then
estimated per housing class by adding the annual creep (quantified at differing housing
Report to the Committee on Climate Change 8
Research to review and update indicators of climate-related risks and actions in England
© ADAS (2021)densities by Gill et al. (2008)) to the impervious flat fraction of the 2001 baseline (Table 5)
and then adding this the impervious pitched fraction to get a total impervious fraction.
Table 4. Mean address points per hectare for each housing class. Source: Gill et al. (2008).
Urban classification Mean address points/ ha Class break
High density residential 47.3 37.1
Medium density residential 26.8 20.8
Low density residential 14.8 -
Table 5. Baseline data for surface type percentages of domestic gardens by housing class in 2001.
Source: Gill et al. (2008).
Classification Pervious Impervious pitched Impervious flat
Low density 57.3% 16.3% 26.4%
Medium density 42.7% 29% 28.3%
High density 15.6% 50% 34.4%
2.2.3 Trends and implications for climate resilience
The area of built-up areas covered by impermeable surfaces is outlined for both methods of
urban area calculation.
2.2.3.1 Method 1
The area of impermeable surfaces in urban areas is shown in Table 6 and Figure 3 for the
current analysis (2020), alongside previous updates of this indicator in 2001, 2008 and 2011
(HR Wallingford, 2012), 2016 (ADAS, 2017) and 2018 (ADAS, 2019).
The total impermeable area (manmade and multiple (impermeable)) has increased by
143,000 hectares, from 477,000 hectares in 2001 to 621,000 hectares in 2020. The
impermeable fraction of the total urban area has increased from 37% in 2001 to 45% in 2020.
Since 2018, the total impermeable area has remained consistent at 621,000 hectares. The
manmade area however has increased by 10,000 hectares, whilst the multiple
(impermeable) area has decreased by 10,000 hectares. The impermeable fraction of the
total urban area (1,383,000 hectares in 2020) has remained stable at 45%.
Table 6. Area of built-up urban areas covered by impermeable surfaces as estimated using OS
MasterMap and using assumptions of urban creep (Method 1). Data sourced from HR Wallingford
(2012) for 2001, 2008 and 2011 data and ADAS (2019) for 2016 and 2018 data. 2020 data is new
analysis as part of this project. Source: ADAS for the CCC.
Thousand ha 2001 2008 2011 2016 2018 2020
Manmade 384 398 401 429 451 461
Multiple (impermeable) 94 142 163 160 170 160
Total impermeable area 477 540 565 589 621 621
Total urban area 1,298 1,297 1,296 1,332 1,383 1,383
Impermeable fraction 0.37 0.42 0.44 0.44 0.45 0.45
Report to the Committee on Climate Change 9
Research to review and update indicators of climate-related risks and actions in England
© ADAS (2021)Figure 3. Changes in the proportion of permeable and impermeable surfaces in built-up urban areas
in 2001, 2008, 2011, 2016, 2018 and 2020 (urban areas defined using method 1). Data sourced from
HR Wallingford (2012) for 2001, 2008 and 2011 data and ADAS (2019) for 2016 and 2018 data. 2020
data is new analysis as part of this project. Source: ADAS for the CCC.
2.2.3.2 Method 2
Area of impermeable surfaces is shown for the current analysis (2020) and previous analyses
of this indicator in 2016 (ADAS, 2017) and 2018 (ADAS, 2019). Results are shown in Table 7
and Figure 4.
Table 7. Area of built-up urban areas covered by impermeable surfaces as estimated using OS
MasterMap and using assumptions of urban creep (Method 2). Data sourced from ADAS (2019) for
2016 and 2018 data. 2020 data is new analysis as part of this project. Source: ADAS for the CCC.
Thousand ha 2016 2018 2020
Manmade 498 509 520
Multiple (impermeable) 184 180 170
Total impermeable area 682 689 690
Total urban area 1,772 1,730 1,720
Impermeable fraction 0.38 0.40 0.40
As with the first method (2.2.3.1), the overall impermeable area fraction has remained stable
at 40% of the total urban area. The impermeable fraction is lower in all years compared to
Method 1 due to the inclusion of more urban greenspace.
Report to the Committee on Climate Change 10
Research to review and update indicators of climate-related risks and actions in England
© ADAS (2021)Figure 4. Changes in the proportion of permeable and impermeable surfaces in built-up urban areas
in 2016, 2018 and 2020 (urban areas defined using method 2). Data sourced from ADAS (2019) for
2016 and 2018 data. 2020 data is new analysis as part of this project. Source: ADAS for the CCC.
2.2.4 Robustness of indicator
Ordnance Survey MasterMap is considered to be the definitive source for detailed
geographic data of Great Britain. This indicator is therefore robust in terms of the mapping
used to represent impermeable surfaces; however, an estimate has to be made of the
impermeable fraction of the ‘Multiple’ surface type based on research into urban creep. This
may lead to under- or over-estimation of impermeable area but should be consistent across
years.
Different products in different years have been used to estimate the number of properties,
The Address point data used prior to 2016 was superseded by OS AddressBase. Furthermore,
OS Addressbase Premium was used in 2018 while OS Addressbase Plus was used in this
analysis. The property data is used to identify housing densities which is used to identify
urban areas and density classes. Therefore, changes in the product used impact on these
calculations.
Report to the Committee on Climate Change 11
Research to review and update indicators of climate-related risks and actions in England
© ADAS (2021)2.3 Area of urban greenspace
Description: Area of urban greenspace
Type: Vulnerability
Time Series: 2001 to 2020
Region: England
2.3.1 Introduction
This indicator was last updated by ADAS (2019). The indicator provides the relative
proportions of natural and semi-natural areas (greenspace) within towns and cities in
England between 2001 and 2020. This update provides new data and analysis for 2020.
2.3.2 Data source and method
The method used was equivalent to that used for ‘the area of impermeable surfacing in
urban areas’ (see section 2.2), except that the area of greenspace in urban areas was
estimated from the area of the “Natural” material plus the permeable fraction of “Multiple”.
The ‘Topography’ layer of Ordnance Survey’s MasterMap product (the most detailed digital
mapping available nationally) records the surface material of each land parcel as “Natural”,
“Manmade” or “Multiple”. The area categorised as “Natural” is assumed to be Greenspace.
The “Multiple” category represents domestic gardens, which is assumed to be a mixture of
permeable and impermeable surfaces. A methodology was developed by HR Wallingford
(2012) to estimate the impermeable fraction of this category based on urban creep research
under the assumption that estimated urban creep rates could be applied to these areas to
determine the potential likely increase in intra-urban impermeable areas. The same method
has been used for this indicator update.
See section 2.2 for the full method applied in this analysis.
Data was sourced from HR Wallingford (2012) for 2001, 2008 and 2011 data, and ADAS
(2019) for 2016 and 2018 data. 2020 data is new analysis as part of this project.
2.3.3 Trends and implications for climate resilience
The area of built-up urban areas covered by permeable surfaces (greenspace) is shown for
both methods of urban area calculation.
2.3.3.1 Method 1
The area of permeable surfaces (greenspace) in urban areas is shown in Table 8 for the
current analysis (2020), alongside previous updates of this indicator in 2001, 2008 and 2011
(HR Wallingford, 2012), 2016 (ADAS, 2017) and 2018 (ADAS, 2019).
The total permeable area (natural and multiple (permeable)) has decreased by 58,000
hectares, from 821,000 hectares in 2001 to 763,000 hectares in 2020. The permeable
fraction of the total urban area has decreased from 63% in 2001 to 55% in 2020.
Since 2018, the permeable fraction of the total urban area (1,383,000 hectares in 2020) has
remained stable at 55%.
Report to the Committee on Climate Change 12
Research to review and update indicators of climate-related risks and actions in England
© ADAS (2021)Table 8. Area of built-up areas covered by permeable surfaces (greenspace) as estimated using OS
MasterMap and using assumptions of urban creep (Method 1). Data sourced from HR Wallingford
(2012) for 2001, 2008 and 2011 data and ADAS (2019) for 2016 and 2018 data. 2020 data is new
analysis as part of this project. Source: ADAS for the CCC.
Thousand ha 2001 2008 2011 2016 2018 2020
Natural 581 559 554 558 583 574
Multiple (permeable) 240 198 178 185 179 189
Total permeable area 821 757 732 743 762 763
Total urban area 1,298 1,297 1,296 1,332 1,383 1,383
Permeable fraction 0.63 0.58 0.56 0.56 0.55 0.55
See Figure 3 for a graph showing the percentage split between permeable and impermeable
surfaces in the built-up urban area using Method 1.
2.3.3.2 Method 2
The area of permeable surfaces (greenspace) is shown for the current analysis (2020) and
previous analyses of this indicator in 2016 (ADAS, 2017) and 2018 (ADAS, 2019). Results are
shown in Table 9.
As with the first method, the overall permeable area fraction has remained stable, at 60% of
the total urban area. The impermeable fraction is higher in all years compared to Method 1
due to the inclusion of more urban greenspace.
Table 9. Area of built-up areas covered by permeable surfaces (greenspace) as estimated using OS
MasterMap and using assumptions of urban creep (Method 2). Data sourced from ADAS (2019) for
2016 and 2018 data. 2020 data is new analysis as part of this project. Source: ADAS for the CCC.
Thousand ha 2016 2018 2020
Natural 899 849 828
Multiple (permeable) 191 192 202
Total permeable area 1090 1041 1030
Total urban area 1772 1730 1720
Permeable fraction 0.62 0.60 0.60
See Figure 4 for a graph showing the percentage split between permeable and impermeable
surfaces in the built-up urban area using Method 2.
2.3.4 Robustness of indicator
Ordnance Survey MasterMap is considered to be the definitive source for detailed
geographic data of Great Britain. This indicator is therefore robust in terms of the mapping
used to represent permeable surfaces; however, an estimate has to be made of the
permeable fraction of the ‘Multiple’ surface type based on research into urban creep. This
may lead to under- or over-estimation of the permeable area but should be consistent across
years.
Different products in different years have been used to estimate the number of properties,
The Address point data used prior to 2016 was superseded by OS AddressBase. Furthermore,
OS Addressbase Premium was used in 2018 while OS Addressbase Plus was used in this
analysis. The property data is used to identify housing densities which is used to identify
Report to the Committee on Climate Change 13
Research to review and update indicators of climate-related risks and actions in England
© ADAS (2021)urban areas and density classes. Therefore, changes in the product used impact on these
calculations.
2.4 Wildfire incidents and area burnt
Description: Number of wildfire incidents and total area burnt
Type: Realised impact
Time Series: 2009-10 to 2016-17; and 2015 to 2019
Region: England, and the UK
2.4.1 Introduction
This indicator was last updated by ADAS (2019). The indicator provides an assessment of the
number of wildfire incidents and the total area burnt by land cover class from two different
datasets:
• The Forestry Commission dataset covering wildfires in England, between 2009-10
and 2016-17. This update does not provide new data for this series.
• The European Forest Fire Information System dataset covering wildfires in the UK.
This update provides new data for 2015 to 2019.
2.4.2 Data source and method
Forestry Commission dataset
The Forestry Commission published a report in 2019 (Forestry Commission, 2019), which
was used to extract key statistics on wildfires in the natural environment (see ADAS, 2019).
New data was not available within the timeframes of this project due to unforeseen
circumstances in the Forestry Commission. Instead, a summary of the previous analysis is
provided.
The Joint Research Centre
The European Forest Fire Information System (EFFIS) consists of a modular web geographic
information system that provides near real-time and historical information on forest fires
and forest fire regimes in the European, Middle Eastern and North African regions. Data was
sourced from the annual reports produced by the Joint Research Centre (JRC) based on EFFIS
information and supplemented by qualitative information submitted by representatives
from the four devolved UK countries, for the years 2015 (San-Miguel-Ayanz et al., 2016),
2016 (San-Miguel-Ayanz et al., 2017), 2017 (San-Miguel-Ayanz et al., 2018), 2018 (San-
Miguel-Ayanz et al., 2019) and 2019 (San-Miguel-Ayanz et al., 2020).
The Rapid Damage Assessment module of EFFIS provides reliable and harmonized estimates
of the areas affected by forest fires during the fire season. EFFIS Rapid Damage Assessment
is based on the analysis of the Moderate Resolution Imaging Spectroradiometer (MODIS)
satellite imagery. The methodology and the spatial resolution of the satellite sensor data
used for this purpose allows the mapping of all fires of about 30 ha or larger. Statistics on
the burnt area by land cover type use data from the European CORINE Land Cover (CLC) 2016
database, which is overlaid with the burnt mapped burned areas (San-Miguel-Ayanz et al.,
2020).
Data for this analysis was extracted on the number of wildfires greater than 30 hectares, and
the area burnt, from the annual reports.
Report to the Committee on Climate Change 14
Research to review and update indicators of climate-related risks and actions in England
© ADAS (2021)2.4.3 Trends and implications for climate resilience
2.4.3.1 Statistics for England (Forestry Commission)
The majority of wildfire incidents that occurred in England between 2009-10 and 2016-17
were associated with improved grassland (34%), arable (25%) and broadleaved woodland
(19%); averaged for the whole period (ADAS, 2019). In terms of the area burnt (hectares) by
land cover class between 2009-10 and 2016-17 (averaged across the whole period), the
largest area lost was associated with mountain heath and bog (48%), improved grassland
(18%), arable (11%) and semi-natural grassland (11%), shown in Figure 5. However, it is
noted that there is considerable variation year-to-year. For example, the area burnt of
mountain heath and bog ranged from 4% of the total area in 2009-10 to 82% in 2011-12.
Total Area Burnt in Wildfires by Land Cover Class
16,000
14,000
Number of Hectares
12,000
10,000
8,000
6,000
4,000
2,000
0
2009-10 2010-11 2011-12 2012-13 2013-14 2014-15 2015-16 2016-17
Financial Year
Broadleaved Woodland Conifer Woodland Other Woodland
Arable Improved Grassland Semi-Natural Grassland
Mountain, Heath & Bog Other non-woodland
Figure 5. Area burnt in wildfire incidents, recorded each year by the Fire and Rescue Services, split
by land cover class. Data sourced from the Forestry Commission (2019) report on wildfire statistics.
Source: ADAS, 2019.
Research by ADAS (2019) showed that both the number of wildfire incidents and the total
area burnt were notably lower between 2012-13 to 2016-17, compared with the three years
prior to this (2009-10 to 2011-12). No new data for England was available from the Forestry
Commission for the period 2017-18 to 2019-20, due to delays in the dataset being produced
because of the coronavirus pandemic.
2.4.3.2 Statistics for the UK (The Joint Research Centre)
Statistics from the Joint Research Centre show that the number of wildfires (larger than 30
hectares in size) have increased over the last few years, from less than 20 in 2015, 2016, and
2017, increasing to 79 in 2018 and 137 in 2019, shown in Figure 6. The relatively low number
of wildfire incidents observed in the UK between 2015 and 2016 concur with analyses of
Forestry Commission data for England during the same period (see ADAS, 2019).
Report to the Committee on Climate Change 15
Research to review and update indicators of climate-related risks and actions in England
© ADAS (2021)Wildfires: Number of wildfires (>30 ha) in the UK
160
Number of wildfires (>30 hectares)
140
120
100
80
60
40
20
0
2015 2016 2017 2018 2019
Year
Figure 6. The number of wildfires larger than 30 hectares in size in the UK between 2015 and 2019.
Data sourced from the Joint Research Centre (San-Miguel-Ayanz et al., 2016; 2017; 2018; 2019;
2020). Source: ADAS for the CCC.
In terms of the area burnt by wildfires, this has increased significantly in the last few years,
from around 2,000 ha in 2015 and 2016, increasing to 5,000 ha in 2017, 18,000 ha in 2018
and 29,000 ha in 2019, shown in Figure 7. The relatively small burnt area observed in the UK
between 2015 and 2016 concurs with analysis of Forestry Commission data for England in
the same period (see Figure 5 and ADAS, 2019).
Wildfires: Area Burnt (ha) in the UK
35,000
30,000
Hectares Burnt
25,000
20,000
15,000
10,000
5,000
0
2015 2016 2017 2018 2019
Year
Forest/Other Wooded Land Other Natural Land Agriculture
Artificial Surfaces Other Land Cover
Figure 7. The area burnt (hectares) by wildfires larger than 30 hectares in size in the UK between
2015 and 2019. Data sourced from the Joint Research Centre (San-Miguel-Ayanz et al., 2016; 2017;
2018; 2019; 2020). Source: ADAS for the CCC.
The majority of the area burnt each year was classified as ‘other natural land’, with this land
cover type accounting for between 94.7% and 96.7% of the total burnt area in each of the
five years. The land cover categories are based on CORINE Land Cover 3.2, which is very
Report to the Committee on Climate Change 16
Research to review and update indicators of climate-related risks and actions in England
© ADAS (2021)broad and includes different land cover types for different countries. In the UK, the other
natural land category largely includes fires on natural grassland, and moors and heathland,
defined as:
• Natural grassland; grasslands under no or moderate human influence. Low
productivity grasslands. Often situated in areas of rough, uneven ground, steep
slopes; frequently including rocky areas or patches of other (semi-)natural
vegetation.
• Moors and heathland; vegetation with low and closed cover, dominated by bushes,
shrubs, dwarf shrubs and herbaceous plants, forming a climax stage of
development. Including for example, wet heath distributed on humid or semi-peaty
soils (peat depth < 30 cm); and dwarf-shrub covered areas with 30 ha) occur in natural habitats,
rather than agriculture, artificial surfaces or other land cover types.
2.4.4 Robustness of indicator
Forestry Commission dataset
The data used within the FC report was sourced from the Home Office’s online Incident
Recording System. Fire and Rescue Services provide records about wildfires (and other)
incidents on the Incident Recording System. This includes a wildfire element of the Incident
Recording System that provides a record of the nature of incidents requiring a response by
the Fire and Rescue Services, in line with the UK Vegetation Fire Standard. The FC report is
deemed to be robust with a consistent methodology applied to calculate the number of
wildfire incidents, and area burned, each financial year. It is not known when the FC will
publish its next report on wildfires.
Joint Research Centre dataset
The Joint Research Centre note that, due to the significant processing periods for fire
statistics, it is not possible to gain access to Incident Recording System data for Great Britain,
gathered from Fire and Rescue Services. The data is therefore based on qualitative
information submitted by representatives from the four developed UK Countries (San-
Miguel-Ayanz et al., 2020).
The Joint Research Centre analysis; based on EFFIS data and qualitative information, is
considered to be less robust than the analysis conducted by the Forestry Commission (2019);
which did have access to and used data sourced from the Home Office’s online Incident
Recording System. However, in the absence of the Forestry Commission data, the Joint
Research Centre analysis provides a comparable indication (between years) of the number
of large wildfires (i.e. >30 hectares) and area burnt in the UK each fire season.
Report to the Committee on Climate Change 17
Research to review and update indicators of climate-related risks and actions in England
© ADAS (2021)2.5 Area under vine and volume of wine produced
Description: Area of vines planted, and the volume of wine produced in England and Wales
Type: Realising Opportunity
Time Series: 1989 to 2020
Region: England and Wales
2.5.1 Introduction
This indicator was last updated by ADAS (2019). The indicator provides an assessment of the
area of vines planted and volume of wine produced, in England and Wales, between 1989
and 2020. This update provides new data for 2019 and 2020.
2.5.2 Data source and method
Data on the area under vine and volume of wine produced for this analysis was sourced from
English Wine, for the period 1994 to 2020. These datasets are predominantly based on
values supplied by the Wine Standards Branch of the Food Standards Agency (FSA). The Wine
Standards Branch produce the official record of vintage production for DEFRA, based on
annual harvest and production declarations provided to the FSA from commercial vineyards.
The exception is data on the area under vine for 2019 and 2020, which is based on industry
expert estimations due to Wine Standards Branch not collecting this data in these years.
However, these estimated values are considered to be the accepted industry figures and are
used in industry publications in the absence of Wine Standards Branch data, for example,
the Wines of Great Britain 2020 Industry Report (WineGB, 2020). Data for 1989-93 has not
been included in this analysis due to the Wine Standards Branch figures including hectares
from hobby vineyards and abandoned vineyards. Wine Standards Branch data for 1994
onwards includes the commercial area only and therefore provides a more consistent and
representative time series. The commercial area is split between hectares in production and
hectares not in production.
2.5.3 Trends and implications for climate resilience
Area of vines planted
The total commercial area under vine in England and Wales has more than doubled in the
last decade from 1,384 hectares in 2011, to an estimated 3,380 hectares in 2020, shown in
Figure 8. These values are for commercial vineyards only and exclude 'hobby vineyards' and
'abandoned vineyards, which in 2020 accounted for an estimated additional 66 hectares and
54 hectares respectively.
Approximately 81% (2,738 hectares) of the total commercial area under vine in 2020 was in
active production. Of the 19% of the planted area not in production, the majority is
attributed to newly planted crops that have not yet been fully established, and thus not
growing high quality fruit in the quantities required for active harvesting.
There is no indication in the datasets as to whether this increase in area is being driven by
improving climatic conditions for the vines, or whether there are other economic reasons
for the increase in area. However, it anticipated that the climate is becoming more suitable
for vine production and thus allowing the opportunity to be capitalised upon by growers
interested in wine production.
Report to the Committee on Climate Change 18
Research to review and update indicators of climate-related risks and actions in England
© ADAS (2021)Area under vine in England and Wales
4,000
Total commercial area under vine (Ha) 3,500
3,000
2,500
2,000
1,500
1,000
500
0
2017
2019
1994
1995
1996
1997
1998
1999
2000
2001
2002
2003
2004
2005
2006
2007
2008
2009
2010
2011
2012
2013
2014
2015
2016
2018
2020
Year
Ha. In production Ha. Not in production
Figure 8. Total commercial area (hectares) under vine each year, excluding 'hobby vineyards' or
'abandoned vineyards', split between area in production (green), and not in production (blue), for
England and Wales from 1994 to 2020. Data sourced from English Wine, based on data supplied by
the Wine Standards Branch of the Food Standards Agency for the period 1994-2018 and industry
estimations for 2019-2020. Source: ADAS for the CCC.
Volume of wine produced
The total volume of wine produced each year (i.e. number of 75cl bottles produced) is highly
variable depending on the weather conditions experienced during the growing season.
Figure 9 shows how the volume of wine produced has changed year on year.
Volume of wine produced
16.0
75cl bottles produced (million)
14.0
12.0
10.0
8.0
6.0
4.0
2.0
0.0
2018
2020
1994
1995
1996
1997
1998
1999
2000
2001
2002
2003
2004
2005
2006
2007
2008
2009
2010
2011
2012
2013
2014
2015
2016
2017
2019
Year
Volume of wine produced
Figure 9. Wine production (millions of 75cl bottles produced) in the UK from 1994 to 2020. Data
sourced from English Wine, based on data supplied by the Wine Standards Branch of the Food
Standards Agency. Source: ADAS for the CCC.
Report to the Committee on Climate Change 19
Research to review and update indicators of climate-related risks and actions in England
© ADAS (2021)It is evident that, despite the area in active production typically increasing year on year since
2004 (Figure 8), the volume of wine produced (Figure 9) has been much more variable, with
large peaks and troughs.
Years with particularly poor production volumes include 2012 and 2016. The 2012 growing
season was considered to be particularly poor with extremely unfavourable growing
conditions that included the wettest June since 1988, the coldest summer since 1988 and
the dullest summer since 1987 with just 403 hours of sunshine across the UK (Met Office,
2012). The 2016 growing season also exhibited poor conditions, due to a combination of cool
conditions during the summer, followed by a lack of moisture in the later part of the growing
season; to swell the grapes (Skelton, 2016). Climate projections suggest that the UK will
experience hotter, drier summers in the future (Met Office, 2019). As a result, the irrigation
of some crops during periods of low precipitation may become an increasingly significant
adaptation practice. However, water scarcity and competing demand for water resources
will limit the extent to which this is possible. The UK’s second Climate Change Risk
Assessment (CCRA2) (CCC, 2017; Defra, 2017) recognises that water restrictions will have
potential consequences for agricultural businesses, particularly those specialising in crops
that are (or become) dependent on supplementary irrigation (CCC, 2019).
The 2018 growing season was exceptional with high quality grapes and favourable weather
conditions, associated with a prolonged spell of hot weather, followed by a period with very
little rain, enabling the grapes to fully ripen on the vine (Skelton, 2019). The 2019 and 2020
growing seasons were also very good with high volumes of production. The 2020 growing
season exhibited a warmer and drier than average spring that led to an early budburst, whilst
a warmer than average August brought ripening on quickly, resulting in one of the earliest
harvests in modern times (Skelton, 2020).
2.5.4 Robustness of indicator
The data sourced from English Wine, originally supplied by the Wine Standards Branch of
the FSA is considered to be fairly robust and consistent over the time series, providing a good
indicator for the total area of commercial vineyards (both in and out of production), as well
as robust estimations of the volume of wine produced. WineGB also hold a dataset, based
on Wine Standards Branch data. Whilst there are some minor inconsistencies between the
English Wine dataset and WineGB dataset, the majority of values match and any differences
are considered to be materially insignificant to the larger trends shown. There is some
uncertainty around the 2019 and 2020 figures for the area under vine from English Wine due
to the Wine Standards Branch not collecting this data in these years. However, the accepted
industry estimations used in the absence of this data are considered to be representative of
the current area planted.
The original source of the Wine Standards Branch data comes from annual declarations on
a survey, completed by commercial vineyard growers. It is anticipated that the Wine
Standards Branch and/or English Wine or WineGB will continue to collect this data year-on-
year, allowing for future updates of the indicator.
Report to the Committee on Climate Change 20
Research to review and update indicators of climate-related risks and actions in England
© ADAS (2021)3 INDICATORS AND EVIDENCE-BASES DEVELOPED
The indicators and evidence-bases in this section are new to the Adaptation Committee’s
indicator set and were designed and developed as part of this study.
3.1 Average field size (grassland and arable) in England
Description: Changes in the average field size (grassland and arable) in England.
Type: Exposure
Time Series: 2015
Region: England
3.1.1 Introduction
The mean size of agricultural fields in a landscape is a major driver of diversity and
abundance of farmland biodiversity taxa including plants, arthropods, and vertebrates.
Agricultural intensification in Europe from the 1930s–1940s onward has been associated
with the removal of field margins, including grass strips, hedgerows and ditches, in order to
create larger fields (Kirchweger and Kantelhardt, 2020).
For farmers, benefits have included decreased working time in the field and fuel expenses
when fields are larger (e.g. due to economies of scale), whilst the uptake of larger machinery
and subsidies favouring larger farms have provided incentives to manage land in larger units
However, the loss of field margins has resulted in the loss of important farmland habitats for
biodiversity, with a lower diversity of plant and animal farmland species reported where
cropland has been aggregated into larger fields (Kirchweger and Kantelhardt, 2020).
Across Europe, field sizes are still increasing, facilitated by increasing farm sizes and land
consolidation (Kirchweger and Kantelhardt, 2020). It is not clear if this trend is also prevalent
in the UK.
This indicator provides an assessment of average field size in England in 2015.
3.1.2 Data source and method
The analysis used the UK Centre for Ecology and Hydrology (CEH) Land Cover Map for 2015
dataset, LCM2015 (CEH, 2017).
LCM2015 is a parcel-based land cover map for the UK, created by classifying satellite data
into 21 land cover classes. This data was used to estimate field sizes in England. The ‘Arable
and horticulture’ and ‘Improved Grassland’ land cover classes were selected from the
dataset and the areas of these parcels were averaged to provide an estimate of average field
size across England.
3.1.3 Trends and implications for climate resilience
Analysis of the LCM2015 dataset provided an estimation of the average field size in England,
outlined in Table 10.
Report to the Committee on Climate Change 21
Research to review and update indicators of climate-related risks and actions in England
© ADAS (2021)Table 10. Average field size (ha) in England by land cover type (arable and horticulture, and
improved grassland) using the CEH (2017) LCM2015 dataset. Source: ADAS for the CCC.
Land Cover Type Average field size
(ha) in 2015
Arable and horticulture 6.34
Improved Grassland 2.57
Average of both land cover types 3.74
The results show that the average field size for arable and horticultural land is more than
double the average field size for improved grassland, illustrated in Figure 10.
Figure 10. Average field size (ha) in England by land cover type (arable and horticulture, and
improved grassland) using the CEH (2017) LCM2015 dataset. Source: ADAS for the CCC.
Due to only one point of reference in the time series, it was not possible to assess whether
the average field size has changed over time. However, this analysis will provide a baseline
to compare against future analyses of this indicator.
3.1.4 Robustness of indicator
The land parcels in LCM2015 were derived by generalising national cartography and are
designed to represent discrete real-world units of land such as fields, parks, urban areas,
woodlands, lakes and so forth. The land cover classes selected (‘Arable and horticulture’ and
‘Improved Grassland’) are a best representation of land that is most likely to cover current
agricultural land parcels. Other land cover classes may also include agricultural land parcels
(such as ‘Neutral Grassland’, ‘Calcareous Grassland’, ‘Acid Grassland’) but it is difficult to
know whether these are still under current agricultural land management or instead under
other land management (e.g. parks, nature conservation, nature reserves etc.).
It is expected that this indicator can be updated in the future to provide an assessment of
changes in average field size at specific time points. For example, whilst not available within
the timeframes of this study, additional CEH Land Cover Map datasets (CEH, n.d.) could
provide a second reference point in the time series. Future updates to the Land Cover Map
would provide subsequent reference points.
Report to the Committee on Climate Change 22
Research to review and update indicators of climate-related risks and actions in England
© ADAS (2021)3.2 Change in total hedgerow length
Description: Length of hedgerows in England
Type: Exposure
Time Series: 1984 to 2007
Region: GB and England
3.2.1 Introduction
Hedgerows are an important landscape feature which deliver numerous biodiversity
benefits by providing food and shelter for a range of birds, insects and mammals. Hedgerows
also facilitate movement through the landscape by providing respite for organisms such as
flying insects (Wolton, 2012). Additionally, there are over 100 priority species associated
with hedgerows, and although few of them are wholly dependent on these, the
deterioration or loss of hedgerows would result in a significant decrease of their populations
(Wolton, 2012). In 2006, it was estimated that only 22% of the UK’s hedgerows were in a
favourable state (Defra, 2007).
Most hedges were originally planted to enclose livestock or define boundaries, with many
hedgerows considered a historical interest in their own right (Hedgelink, n.d.). Hedgerows
provide wider environmental benefits and regulatory services such as increasing water
quality and regulation, increasing air quality, reducing flood risk, reducing soil erosion,
maintaining climate regulation through carbon sequestration, and promoting pollination
and pest control by providing habitat for pollinators and predators of crop pests. By acting
as a physical barrier at a field edge, hedgerows are able to reduce the amount of fertilisers,
pesticides and sediment, which may be included in surface water run-off, from reaching
watercourses. They can also contribute to managing the flow of water run-off, which can
support in reducing peak flows and the risk of flooding across the catchment (Wolton, 2012).
‘Managed’ hedgerows provide the greatest value, both to farmers and wildlife, however, if
these are neglected the value can greatly reduce or become negligible (Countryside Survey,
2007). Similarly, where hedgerows are lost, the benefits associated with the hedgerows are
lost alongside this, which can have negative impacts for biodiversity and regulatory services,
and also result in an increase in carbon emissions.
This indicator provides an assessment of the change in hedgerow length in England and
Great Britain, between 1984 and 2007. In addition, comment is made around more recent
estimates.
3.2.2 Data source and method
Data used within this analysis was sourced from the Countryside Survey. Grants associated
with hedgerows are included within Countryside Stewardship agreements (Defra, 2020).
This includes grants for laying hedges, hedge coppicing, hedge gapping up, and hedgerow
trees. Data for the years 1984, 1990, 1998 and 2007 were available for direct download;
however, differences in linear feature classification prevent direct analysis of this data. The
supporting report for the 2007 data (Countryside Survey, 2007) collated the timeseries on
hedges across these four years in a comparable format. It is this data, cited within the 2007
report, that has been used for this analysis. Unfortunately, this data has not been collected
since 2007 within this particular data collection programme.
Report to the Committee on Climate Change 23
Research to review and update indicators of climate-related risks and actions in England
© ADAS (2021)You can also read


