A new role for forests and the forest sector in the EU post-2020 climate targets
←
→
Page content transcription
If your browser does not render page correctly, please read the page content below

FROM SCIENCE TO POLICY 2

A new role for forests and
the forest sector in the EU
 post-2020 climate targets

 Gert-Jan Nabuurs, Philippe Delacote, David Ellison, Marc Hanewinkel,
Marcus Lindner, Martin Nesbit, Markku Ollikainen and Annalisa Savaresi
From Science to Policy 2

         Contents
         Summary..................................................................................................................................................... 3
         1. Purpose and background: time for a fresh look at forest sinks............................................................ 5
         2. Forests and the forest sector in international and EU climate policy....................................................6
                  International climate policy.............................................................................................................. 6
                  EU climate policy.............................................................................................................................. 8
         3. Climate change mitigation: a systems understanding.......................................................................... 9
         4. The role of EU forests in the current EU greenhouse gas balance..................................................... 11
                  More knowledge about EU forests is available.............................................................................. 11
                  Current significance of EU forests.................................................................................................. 11
                  Variety across EU Member States creates opportunities.............................................................. 12
                  Opportunities for Climate Smart Forestry...................................................................................... 13
                  The future of the sink in European forests..................................................................................... 15
                  How could Climate Smart Forestry strengthen the sink?.............................................................. 17
         5. Towards a new role for EU forests and the forest sector in the climate regime................................. 19
                  The EU policy framework on LULUCF post-2020.......................................................................... 19
         6. Inclusion of EU forests and the EU forest sector in post-2020 targets via Climate Smart Forestry......22
                  Climate Smart Forestry examples: incentives based on synergies ................................................ 24
         7. Policy implications................................................................................................................................ 25
         Glossary.................................................................................................................................................... 27
         Recommended reading............................................................................................................................ 29
         Authors..................................................................................................................................................... 30

         ISSN 2343-1229 (print)
         ISSN 2343-1237 (online)

         ISBN 978-952-5980-20-2 (print)
         ISBN 978-952-5980-21-9 (online)

         Editor in chief: Lauri Hetemäki
         Managing editors: Rach Colling, Minna Korhonen
         Layout: Grano Oy / Jouni Halonen
         Printing: Grano Oy

         Disclaimer: The views expressed in this publication are those
         of the authors and do not necessarily represent those of the
         European Forest Institute.

         Recommended citation: Gert-Jan Nabuurs, Philippe Delacote,
         David Ellison, Marc Hanewinkel, Marcus Lindner, Martin
         Nesbit, Markku Ollikainen and Annalisa Savaresi. 2015.
         A new role for forests and the forest sector in the EU
         post-2020 climate targets. From Science to Policy 2.
         European Forest Institute. https://doi.org/10.36333/fs02

2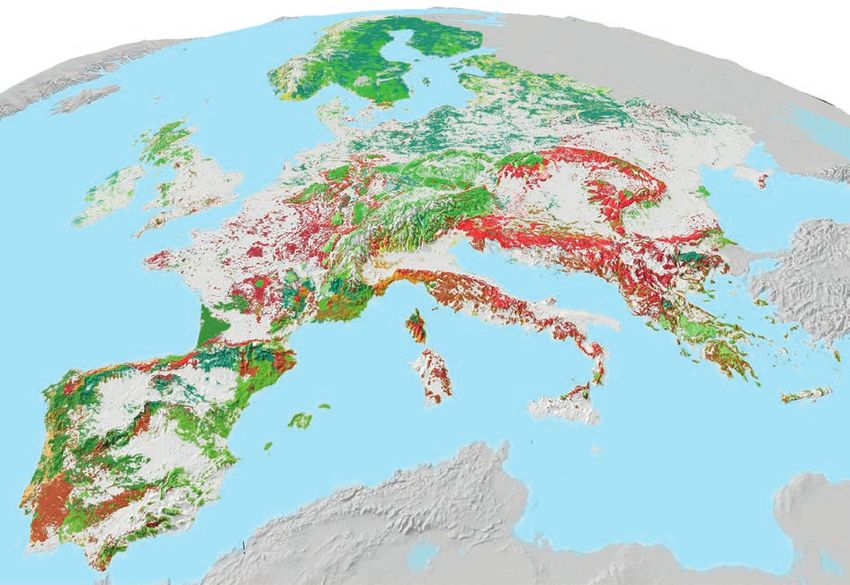
A new role for forests and the forest sector in the EU post-2020 climate targets

                                               summary

E    U forests and the forest sector play a significant
     role in the EU greenhouse gas balance. These for-
ests and their products reduce emissions, enhance
                                                               Policy implications

                                                               • The potential for EU forests to contribute to cli-
sinks, store carbon and provide a continuous stream              mate change mitigation and adaptation is current-
of ecosystem services, including wood products, en-              ly not used in an optimal way and is not incentiv-
ergy and biodiversity conservation. In all their variety,        ised under EU policies. Looking ahead, however,
it is estimated that EU forests and the forest sector            there is great scope to enhance the role of EU for-
currently produce an overall climate mitigation im-              ests in tackling climate change. If adequately incen-
pact that amounts to about 13% of the total EU emis-             tivised, Member States could achieve a combined
sions. This includes both the action of forests and              additional effect of as much as 400 Mt CO2/y by
harvested wood products as a carbon sink and car-                2030 on top of the existing sink and substitution.
bon stock, and the substitution effect of forest prod-           With the existing sink and substitution this comes
ucts for fossil-based raw materials and products.                to an equivalent of about 22% of the current EU
   Over the past two decades, the mitigation poten-              CO2 emissions.
tial of forests and the forest sector has been progres-
sively included in the international climate regime.           • Given recent developments in the policy arena, the
Existing rules are rather complicated and provide                EU should decide an overall EU-wide target for re-
limited incentives for mitigation in the forest sec-             movals in the forest sector. This target could grad-
tor in developed countries. But as the Parties to the            ually be raised well beyond the current sink. The
Kyoto Protocol negotiate a new climate agreement                 target would not only be geared towards increas-
to be adopted in Paris in December 2015, a new bot-              ing the forest sink, but also in ways that increase
tom-up approach to emission reduction commit-                    the GDP contribution of the forest sector and con-
ments has emerged. This has opened the door to                   tribute sustainably to EU energy security.
new approaches to using the forest sector’s mitiga-
tion potential in developed countries. Better use of           • The timetable for achieving targets should be
this potential could also provide a host of additional           longer than 2030, with an initial learning and im-
benefits, including revenue-generation and biodiver-             plementation phase. This would allow for possi-
sity conservation.                                               ble adjustment and an examination of how car-
   The EU has already decided that emissions and                 bon policy in forests impacts, in particular, on
removals from Land Use, Land Use Change and                      land allocation between forestry and agriculture.
Forestry (LULUCF) are to be included in its 2030 cli-            Gradually, full land-based accounting with a ‘net’
mate policy framework, with a decision on exactly                approach could be incorporated in the overall ac-
how to do so expected in 2016. This study aims to                counting, avoiding loopholes between the energy
support EU policy-makers in answering this complex               and LULUCF sectors.
question by:
• Determining whether and how to use forests’                  • The EU should decide how to share the effort of
   sinks and substitution effects as a means to meet             meeting the EU-wide target across the EU Member
   the EU’s post-2020 targets, without decreasing the            States. The optimal approach would be to pursue
   overall level of ambition,                                    cost-efficiency, possibly based on considerations
• Identifying new principles and measures to reap                of fairness and GDP. If this new forestry LULUCF
   the potential of the forest sector to contribute to           pillar is set up separately from the existing Effort
   climate change mitigation in the EU, in synergy               Sharing Decision (ESD), then it would need to be
   with other regional priorities in the land use sector.        recognised that limited additional incentives would

                                                                                                                                   3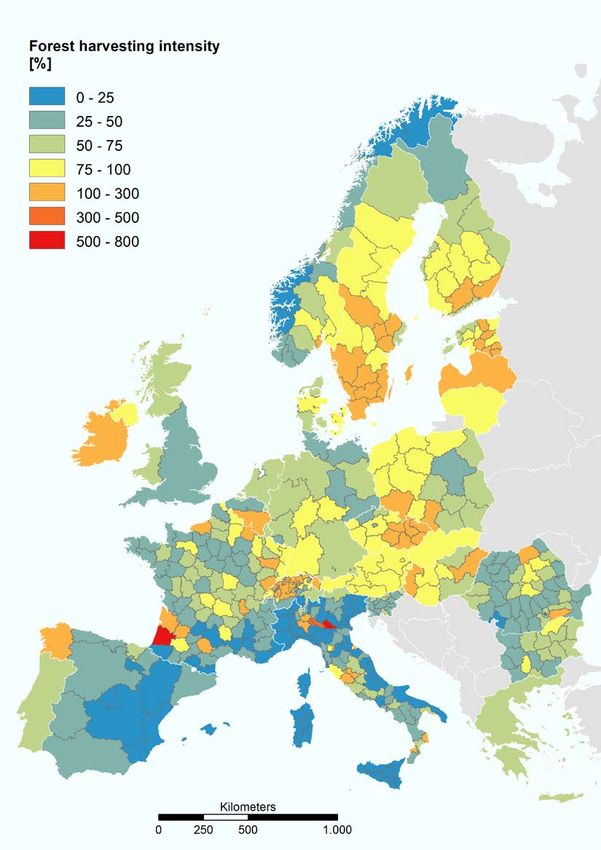
From Science to Policy 2

           be created for Member States unless the separate       • Climate targets can be mainstreamed through
           pillar is linked to a country’s own (larger) target.     Climate Smart Forestry. Sustainable adaptation
             Linking a forestry pillar to the ESD could po-         and mitigation of climate change should be main-
           tentially weaken incentives for mitigation action        streamed in forestry policy and forest manage-
           in the ESD sectors. If forestry targets form part        ment in Europe, with specific attention paid to
           of or are linked to the ESD, the total emissions         regional circumstances, opportunities and chal-
           permitted under the ESD should be reduced by             lenges. A wide variety of policy measures tailored
           an amount that reflects the new availability of the      to these regional circumstances can be imple-
           cost-effective mitigation potential in the forestry      mented, to provide incentives to better reap the
           sector.                                                  climate mitigation potential of the EU forest sec-
                                                                    tor. As much as possible, these measures should
         • EU and national policies relevant to forestry            be in synergy with other policy targets for the EU
           should be reviewed with respect to their climate         forest sector, such as developing the bioeconomy
           impacts. EU policies like the Common Agricultural        and preserving biodiversity. Some of these meas-
           Policy, the Renewable Energy Directive and Forest        ures could be interpreted as introducing elements
           Strategy all have climate impacts. These impacts         from the carbon pricing principle.
           need to be revisited and analysed in light of cli-
           mate policy targets, and the shifts in policies pro-   The climate problem is important and urgent enough
           posed in order to improve the synergies with cli-      to require every sector to make its contribution. No
           mate mitigation potential.                             sector can solve the problem on its own or within a
                                                                  short time frame. Quick fixes should not be expected
                                                                  from any sector. With the right incentives and invest-
                                                                  ments, however, a significant contribution can be ex-
                                                                  pected from EU forests, forestry and the forest-based
                                                                  industries.

4
A new role for forests and the forest sector in the EU post-2020 climate targets

1. Purpose and background: time for a fresh look at
   forest sinks

There is no doubt that forests across the world play          use the forest sector in tackling climate change.
an important role in the global climate. Their role           Developing countries have increasingly taken up
in acting as CO2 sinks and CO2 reservoirs and in              commitments to reduce emissions in the forest sec-
providing a source of products and renewable ener-            tor. More generally, several Parties support the adop-
gy is recognised in the international climate change          tion of a more comprehensive approach to emis-
regime. The different roles played by forests and             sions from land use in international climate policy
land uses in the northern hemisphere (where for-              after 2020.
ests largely act as CO2 sinks) and the southern hem-             These developments justify taking a fresh look at
isphere (where emissions associated with deforest-            the forest sector’s contribution to tackling climate
ation tend to be concentrated) justified the 1997             change. The EU has already decided that emissions
Kyoto Protocol’s approach to forest emissions and             and removals from Land Use, Land Use Change
sinks.                                                        and Forestry (LULUCF) are to be included in its
   Parties to the Kyoto Protocol committed to reduc-          2030 climate policy framework, with a decision on
ing greenhouse gas emissions, setting reduction               exactly how to do so expected in 2016. This study
targets for a group of developed countries for the pe-        aims to support EU policy-makers in answering this
riods 2008–2012 and 2013–2020. Developed coun-                complex question by:
tries were allowed to achieve these targets with land
use related activities only to a limited extent. The          • Determining whether and how to use forests’
reason for this limitation was that land sinks were             sinks and substitution effects as a means to meet
perceived to be unstable and mostly determined by               the EU’s post-2020 targets, without decreasing
past activities, and therefore would accrue mitiga-             the overall level of ambition,
tion that would have occurred anyway. There was,              • Identifying new principles and measures to reap
furthermore, the widespread conviction that the                 the potential of the forest sector to contribute to
land use sector was difficult to regulate and that it           climate change mitigation in the EU, in synergy
would achieve little in the way of emission reduc-              with other regional priorities in the land use sec-
tions.                                                          tor.
   This state of affairs has changed greatly in recent
years. As the Parties to the climate regime negotiate         Ultimately, this study aims to identify a fair and sim-
a new climate agreement to be adopted in Paris in             ple, long term strategy for European forests that is
December 2015, a new bottom-up approach to miti-              beneficial to the climate, creates incentives specif-
gation commitments has emerged. This has opened               ic to the circumstances of each Member State and
the way to greater flexibility for Parties to use forest      guarantees the fulfilment of other forest functions,
activities to mitigate climate change. New data has           including raw material provision, biodiversity pro-
also enabled scientists to understand how to better           tection and recreation.

                                                                                                                                  5
From Science to Policy 2
2. Forests and the forest sector in international and
EU climate policy
International climate policy It is voluntary for cropland management, grazing
land management, re-vegetation and wetland drain-
When the Kyoto Protocol was adopted in 1997, the age and rewetting. Emissions of non-CO2 gases (e.g.
emission targets set for developed countries recog- methane and nitrous oxide) from agricultural prac-
nised the role of the land use sector to some degree. tices (e.g. burning of crop residues, fertiliser appli-
The 2000 IPCC Special Report on LULUCF esti- cation, rice cultivation and livestock) must be ac-
mated that removals in the land use sector were po- counted under ‘Agriculture’. Emissions from energy
tentially very high, in the range of 1–2.5 Gt C/y, or up use in support of agriculture and the forest indus-
to 30% of global emissions from the burning of fos- try are accounted in the energy sector. Emissions
sil fuels. However the report also cautioned about from bioenergy are accounted in the LULUCF sec-
complexities in the land use sector, including: var- tor, at the time of harvest of the wood. To avoid dou-
iations amongst countries’ potential; the challenge ble counting, the burning of wood is accounted as
of accounting for emissions and removals; and the zero emissions.
permanence of sinks. The IPCC therefore warned Therefore, the land use sector has, over time,
in 2007 that forest-based mitigation activities would been progressively included in a more comprehen-
need to avoid negative impacts associated with com- sive fashion in developed countries’ reporting obli-
petition between land uses. gations under the Kyoto Protocol.
These complexities led Parties to the climate re- In contrast, developing countries can only contrib-
gime to adopt a rather cautious approach to meeting ute to emission reductions in the land use sector on
emission targets under the Kyoto Protocol through a voluntary basis, through the Clean Development
LULUCF activities. Instead, it was considered prefer- Mechanism (CDM) – limited to afforestation and
able to concentrate on emissions from other sectors reforestation project-based activities – and REDD+.
and to limit the possibility of using forest manage- This encompasses avoided deforestation and forest
ment activities to meet developed countries’ targets. degradation as well as the sustainable management
Currently, the rules concerning measurement of forests and the enhancement of carbon stocks.
and emission reduction obligations differ in the Developing countries still have looser reporting ob-
frequency and level of detail required from devel- ligations, both in terms of frequency and detail. The
oped and developing countries. While the possibili- adoption of rules on REDD+ has nevertheless un-
ty to use LULUCF activities to meet developed coun- doubtedly marked a significant step towards great-
tries’ targets was capped in the Kyoto Protocol’s first er incorporation of the land use sector in develop-
commitment period (2008–2012), this approach ing countries’ reporting obligations, and possibly in
was discarded for the second commitment period their emission reduction commitments post-2020.
(2013–2020). Yet, the approach to emissions from land use in
Instead, developed countries were asked to iden- the climate regime remains divided. This was his-
tify a Forest Management Reference Level (FMRL). torically motivated both by political controversies
The FMRL is a value of average annual net emis- and scientific uncertainty, resulting in a complex
sions and removals from forest management, set of rules that do not provide incentives to miti-
against which the net emissions and removals re- gate climate change in the land use sector in a ho-
ported for forest management during the second mogenous way. Most importantly, this piecemeal
commitment period will be compared for account- approach to land use changes in combination with
ing purposes. Only an additional sink above this subsidies on bioenergy has already engendered per-
FMRL may be accounted, up to an agreed maxi- verse outcomes. For example, targets concerning
mum level. the production of renewable energy in the EU have
Accounting is mandatory for some activities, led to the import of wood pellets, with arguably no
namely emissions and removals from afforestation, short-term climate benefits and the distortion of
reforestation, deforestation and forest management. competition in raw material markets.
66,000
5,500
EU Emission
Reduction
5,000 Commitment
20% by 2020 34% And what
by is the
4,500 Potential additional 2020? potential
EU effort after 2013 by 2030,
4,000 Durban LULUCF with
Commitment forests
included?
3,500
3,000
2,500
2,000 Key:
MtCO2 equivalent
EU recorded historic emissions
1,500 Recorded forest sink
Accountable removals under
1,000 Commitment Period 1 FM cap
Net EU emissions if forest sink is
included
500
Commitment Period 2 target
The EU emissions 2030 target in the
0 Durban LULUCF EU’s Climate and Energy Package
Commitment Net EU emissions if LULUCF
-500 included
Forest Management Durban caps
could add more? The extra potential the forest sink
Reference Level
-1,000 could add
1990 1995 2000 2005 2010 2015 2020 2025 2030
Figure 1. Development of the EU’s net emissions 1990–2014 and projected emission reduction commitment until 2030 when forests are included (Based on Ellison et al. 2014).
7
A new role for forests and the forest sector in the EU post-2020 climate targetsFrom Science to Policy 2
In the lead up to the Paris climate change confer- on the robustness with which changes could be at-
ence, where a new post-2020 climate agreement is tributed to human activity and partly on the risk that
expected to be adopted, numerous Parties and ob- the inclusion, particularly of ‘unearned’ mitigation
servers have advocated for a reformed and more from sinks, could significantly weaken incentives
unitary approach to emissions and removals from for emission reductions in other sectors. The EU’s
land use. Parties have also adopted a much more position was that although concerns about the accu-
bottom-up approach to their commitments post- racy of reporting and the accuracy of attribution to
2020: each one provides nationally determined human activities could in theory be dealt with by a
pledges for reduced emissions in its Intended rigorous approach to reporting, this did not answer
Nationally Determined Contribution (INDCs). This concerns about the permanence of mitigation, or
opens the door for greater flexibility on how emis- the displacement of effort from other sectors.
sions from land use and the forest sector may be Second, at the EU level, the inclusion of LULUCF
used to achieve Parties’ commitments. removals in targets was feared to lead to unfair ad-
vantages, due to the uneven distribution of LULUCF
EU climate policy abatement potential across EU Member States
(see section 4). The inclusion of LULUCF remov-
The EU decided not to rely on removals from als would also have entailed factoring in the role of
LULUCF activities to reach its targets under the forest sector in the so-called ‘burden-sharing’ ar-
the Kyoto Protocol for the period up to 2020. rangement which establishes how the overall EU-
Approximately 45% of the EU’s emissions are cov- level reduction commitment is shared among all
ered by the EU Emissions Trading System (ETS), Member States until 2020.
encompassing more than 11,000 large installations Removals from the forest sector were not only ex-
in power generation and manufacturing industries cluded from the scope of eligible activities to meet EU
across Member States. Emissions from sectors not targets. The EU also decided that credits from forest
included in the EU ETS are addressed in the Effort projects in developing countries could not be traded
Sharing Decision (ESD). The ESD establishes bind- with those generated in the EU ETS. While in princi-
ing annual greenhouse gas emission targets for ple it was possible to allow the trading of credits gen-
Member States for the period 2013–2020. These tar- erated from afforestation and reforestation projects
gets concern emissions from most sectors not in- under the Clean Development Mechanism, there was
cluded in the ETS, such as transport (except aviation a concern that such credits would be relatively cheap
and international maritime shipping), buildings, and undermine price signals in the EU ETS.
non-CO2 agriculture and waste. In contrast to sectors Now with negotiations on a new international cli-
in the EU ETS, which are regulated at EU level, it mate agreement and the new bottom-up approach
is the responsibility of Member States to define and to Parties’ emission reduction commitments, the
implement national policies and measures to lim- EU is in the process of considering how to meet its
it emissions from the sectors covered by the ESD. targets for the 2020–2030 period (see section 5).
At present, CO2 emissions and removals from This opens new opportunities to explore the poten-
LULUCF are included neither under the EU ETS tial of forests and the forest sector to contribute to
nor in the ESD. There are two reasons for this ex- climate change mitigation in the EU. As illustrated
clusion. in Figure 1, the current and future role of LULUCF
First, at the global level, the EU was sceptical in the EU is large, and through management meas-
about using LULUCF sinks to meet targets for de- ures, it can potentially be much larger. With the in-
veloped countries under the Kyoto Protocol. This clusion of LULUCF and appropriate incentives, an
scepticism was based partly on concerns about the overall EU reduction target of -50% by 2030 could
accuracy of reporting on emissions and sinks, partly be feasible.
8A new role for forests and the forest sector in the EU post-2020 climate targets
3. Climate change mitigation: a systems understanding
Forests impact net greenhouse gas (GHG) balances increasing sequestration and through substitution
in two ways. First, they retrieve carbon dioxide from effects, via appropriate policies and measures. It
the atmosphere and sequester carbon in biomass, is interesting and important to note that, although
thus acting as a carbon sink. Subsequently part of both effects represent potential contributions to cli-
this carbon is transferred into soils through litter- mate change mitigation, they have different implica-
fall, or through harvesting into a variety of products. tions in terms of forest management and harvesting.
Forest management tools such as improved silvi- While the sequestration effect is maximised in the
culture, afforestation, reforestation and reduced de- short term by a lower intensity of forest harvesting,
forestation increase net carbon sequestration in for- enhanced use of the substitution effect implies an
ests. In addition, carbon sequestration in long-lived intensification of forest harvesting. In larger areas
wood products, wood structural frames for instance, of forests, both mitigation options do not necessari-
delays carbon release into the atmosphere (seques- ly conflict with each other, as it is possible to balance
tration lever in Figure 2). carbon stocks in the forest biomass and (over larg-
Second, fuelwood and bioenergy (e.g. pyrolysis er areas) simultaneously use the biomass for wood
oil and second generation biodiesel) can substitute products and fossil fuel and material substitution.
fossil fuels, and timber products can substitute oth- At the regional and national level, it is possible and
er more energy- and emissions-intensive materials. meaningful to combine both mitigation options.
Emissions linked to wood product consumption are The evaluation of forest-based climate change
generally lower than those created by the consump- mitigation effects therefore requires careful consid-
tion of non-wood substitute products. Wood prod- eration of scale and system boundaries. When emis-
uct consumption (substituting for products coming sions are compared at the forest stand level, it is al-
from other materials for building, insulation, pack- ways beneficial to protect the stand and to maximise
ing, furniture, etc.) consequently may enable a re- the carbon sink in the growing forest biomass. Any
duction in fossil energy emissions (substitution le- harvest activity leads to partial emissions of the
ver in Figure 2). Moreover, wood products can store CO2 that has been accumulated in the forest bio-
carbon for decades or even centuries. mass, and only a variable fraction of the carbon pool
Forests and the use of forest products can there- can be used to substitute fossil fuels or alternative
fore contribute to climate change mitigation by materials. Increased harvest removals to generate
Atmosphere
Photosynthesis
Heterotrophic
Deforestation
Autotrophic
respiration
respiration
Combustion
Combustion
Oxidation
Oxidation
Bioenergy
Competition
Wood Fossil fuels
products and
harvest Other
residues wood Non-wood products
Litters products
Wood in forest
Sequestration lever Substitution lever
Figure 2. Simplified diagram of carbon stocks in reservoirs and flows between the atmosphere, biosphere and
fossil reservoir. The two mitigation levers are depicted here.
9From Science to Policy 2
bioenergy create a carbon debt that can take decades Equally important as scale effects are proper con-
or even centuries to be compensated by new carbon siderations of system boundaries. If the system
sequestration in forest regeneration. boundary is limited to forest ecosystems, changes
When comparing alternative resource manage- in carbon storage in wood products are not account-
ment options at a regional level, any immediate loss ed for. More importantly, it is crucial to include oth-
of carbon from a harvest tends to disappear, because er fuels and materials and their associated green-
at a regional level you tend to find all the different house gas emissions, because if the use of forests is
forest age-classes simultaneously, and the carbon limited to maximising carbon in the forest biomass,
removal of the harvested forest stands is compen- fewer wood products can be harvested and conse-
sated by the carbon sequestration of the remain- quently there will be an increasing demand to sub-
ing growing stands. While time lags are dampened stitute wood products with fossil fuels and more en-
at the regional level, it is still possible that certain ergy-intensive materials.
management interventions which result in long- Energy substitution based on the use of harvest
term increases in carbon sequestration are associ- residues results in larger climate change mitigation
ated with short-term net carbon release – for exam- than the direct application of stemwood for energy
ple in the case of salvage cutting of stands damaged purposes, because the residues would decompose
by disturbances. relatively fast if they were left in the forest. However,
Due to the dynamic nature of forest growth cycles, aspects such as cost efficiency, biodiversity issues,
forest carbon sinks and sources are not stable. In soil carbon and nutrient balances also need to be
the EU, the forest carbon sink has been increasing considered when extracting residues.
over many decades, mostly because areas and incre- The conversion efficiency of woody biomass into
ments have increased and harvesting has remained energy products has to be taken into account as well.
rather stable. Over the same time period, there has For example, using wood in a modern Combined
also been an increase in the area of forest reserves Heat and Power plant may have a higher efficiency
where forest management is not allowed. when compared to producing transport fuels from it.
10A new role for forests and the forest sector in the EU post-2020 climate targets
4. The role of EU forests in the current EU greenhouse
gas balance
More knowledge about EU forests Current significance of EU forests
is available
Forests in EU Member States cover about 159 mil-
The information base on emissions and removals lion ha, equal to 37% of the total EU land area. Since
from the forest sector has increased enormously 1990 this area has increased by 7%. On a global
over the last two decades due to technological and scale, EU forests are exceptional, as they are pre-
institutional developments. It is now possible to dominantly (85%) managed and available for wood
gather better quality data at an ever more detailed supply. This makes the EU one of the main world
level. International and national efforts to gath- producers of roundwood with 442 million m3 in
er this data, integrate it in international statistics 2014. On the other hand, some 3 million ha of EU
and develop LULUCF reporting, have been huge. forests are presently ‘without active intervention’.
This has led to great advancements in the under- Approximately 75% of the annual increment is
standing of the forest sector’s contribution to cli- harvested, resulting in annual additions to the car-
mate change mitigation. Forest management refer- bon sink in EU forests of around 435 Mt CO2/y for
ence levels for greenhouse gas reporting have been the years 1990 to 2012. This represented almost
set up in a comparable way with large-scale scenar- 10% of total EU emissions in 2012. When the sec-
io growth models for Europe, such as the European tor’s impact on the sink via harvested wood products
Forest Information Scenario Model (EFISCEN) and (HWP) is also taken into account, this adds another
the Global Forest Model (G4M), as well as the na- 44 Mt CO2 i.e. about an additional 1% of total emis-
tional modelling of carbon budgets. Monitoring and sions, or 10% of the amount of sink in the forests.
reporting has improved and is now supported by The material substitution effect of the production of
new methods such as airborne remote sensing and durable wood products can be estimated to help to
terrestrial measurement sources, such as National avoid some 2% (or 90 Mt CO2/y) of EU greenhouse
Forest Inventories (NFIs), which are now available gas emissions. Therefore, EU forests and the forest
for many Member States. Repeated NFIs deliver a sector are estimated to produce an overall climate
basis for forest growth in the EU and therefore the mitigation of about 13% of the total EU emissions.
dynamics of the potential forest sink. These devel- In addition, biomass (which is woody to a large ex-
opments in technology will still make big steps for- tent) provides 6% of the 2013 EU consumption of
ward in the coming decades. energy.
Modelling approaches have also been extended to The EU forest carbon sink has been continuous-
quantify major disturbances at the national and the ly increasing over the last four to five decades un-
EU level. This has reduced uncertainty concerning til recently when the first signs of saturation have
the threat of potential greenhouse gas sources from been observed. This is due to a decreasing rate of in-
forests. In terms of data accuracy, certainty and the crement, intensified land use and increased losses
permanence of measurements, the LULUCF sector from natural disturbances such as storm, fire, pest
of the EU is currently not worse in data certainty and diseases. Until now, natural disturbances have
than most other sectors. In other sectors, uncertain- played a relatively small role in the EU, with annual-
ty over the effectiveness of measures still exists: for ly 6% of the area affected, for example, by grazing,
example, achieved fuel efficiency in the transport but not destroyed. In the worst storm year observed
sector can within a few years be fully nullified again to date, 1999, only 1% of the total growing stock of
by increased kilometres driven, or the effectiveness EU forests was affected and even that was used to a
of measures in the energy sector can also be coun- large extent. However, the regional and periodic im-
teracted by low oil prices. pacts of disturbances can be large.
11From Science to Policy 2
If historical harvesting levels are maintained, we Variety across EU Member States
might expect the harvested wood products carbon creates opportunities
pool to grow for at least the next couple of decades.
With improved incentives and structural changes – The EU is characterised by great variety in region-
for example with the increased use of wood construc- al climate, forest resources, the forest sector and its
tion and declining paper consumption – it may be importance for the national economy (see Figure 3).
possible to move well beyond the saturation points Member States vary in how they deal with their for-
currently envisioned. Growing demand for wood est resource and the associated resource demands
products could reduce sinks in the forest while en- and uses. Based on current data, Figure 3 illustrates
hancing carbon sinks in harvested wood products. In a positive correlation between the contribution of
the long term, this may also lead to increased forest the forest sector to national GDP and the CO2 sink.
area and higher increments of the rejuvenated for- This runs contrary to the common assumption that
ests. It would also create larger substitution effects. these functions of the forest are mutually exclusive.
Managing EU forests and the forest sector for cli- Forest ecosystems in the EU are very diverse,
mate change mitigation is therefore a many-sided spanning three major biogeographic zones (bore-
endeavour, with substantial regional variation in op- al, temperate and Mediterranean), with different
tions. species (Figure 4), growth rates and contrasting
90
Biomass sink as reported to UNFCCC (2000 –2006)
80
70 FR
60
DE
Mt CO2/y
50 SE
40 PL
RO FI
30 IT
ES
20 LV
AT
UK
BG
10 SI CZ
PT
SK
LU BE NL
0 IE
0 5,000 10,000 15,000 20,000 25,000
Contribution to GDP (M Euro/y)
Figure 3. Correlation of national GDP and the CO2 sink in the 28 EU Member States’ forests and forest sectors
for the period 2000–2006. Ball size indicates the area of forest available for wood supply (FAWS). The graph
suggests a positive correlation between strengthening the contribution of forests to GDP and the relative size
of the CO2 sink given the current structures. Eastern European countries tend to be relatively high in the scatter
of balls, i.e. having a higher sink per Euro unit of GDP than the average in the EU countries. Western European
countries, apart from France, tend to be more closely distributed along the diagonal. Large net importers tend
to be more at the GDP side of scatter. Note that some small countries fall away behind larger balls.
12A new role for forests and the forest sector in the EU post-2020 climate targets
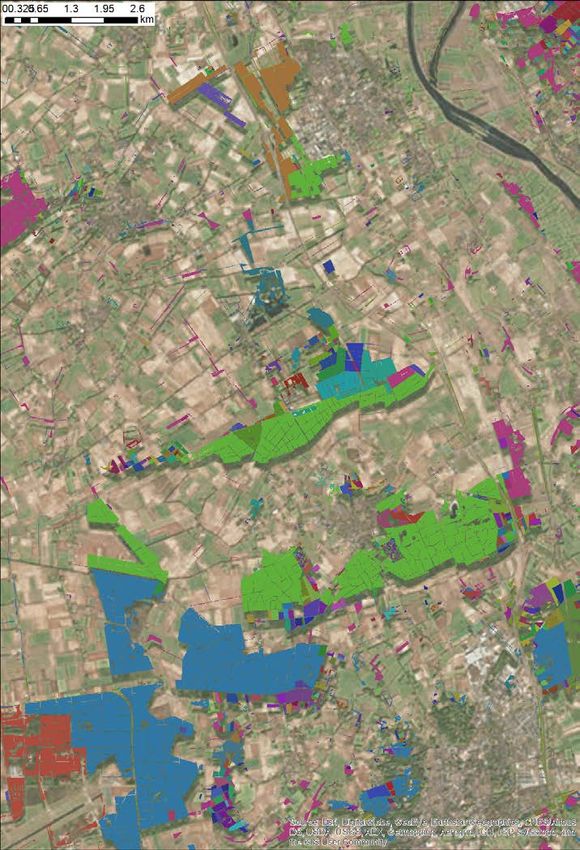
Figure 4. Tree species map of European forests showing one form of variety across Europe (Brus et al. 2011).
This and other varieties are an opportunity to use the many different ways that the Member States’ forest sec-
tors can contribute to climate change mitigation.
management traditions. Management regimes typ- not primarily managed for timber production, but
ically include, for example, clear-cut harvesting in rather for non-timber forest products or agroforest-
the Nordic countries, plantation forestry in some ry. Illegal logging and non-sustainable use of for-
parts of southern Europe, and close-to-nature silvi- est resource is a problem in some eastern European
culture and forests without active management in a countries, especially after restitution of former state-
number of central European locations. About 50% owned forests. Fragmented property ownership (see
of forests in the EU are privately owned, with frag- Figure 6) in small holdings and a lack of infrastruc-
mentation in several countries leading to a large ture are factors that constrain the current manage-
number of small ownerships (see Figure 6) and a ment and use of some regional forest resources.
total of about 16 million private forest owners. The Forests in regions with low accessibility or already
resulting variation in growth potential and in forest high biodiversity values may be better suited for set-
utilisation rates in the various value chains creates a ting up reserves and storing large stocks of carbon.
wide range of options for climate change mitigation
across the EU Member States.
It is important to note that national averages may Opportunities for Climate Smart
disguise large regional differences. France, for ex- Forestry
ample, has areas with intensive wood production,
but also areas with traditional coppice systems that The examples above of variation in EU Member
mainly produce non-commercial fuelwood. Some State forest sectors illustrate how they can contrib-
areas where forests are hardly managed at all, like ute in different ways to climate change mitigation.
Spain, Portugal and the UK, also have contrasting The fact that the EU Member States have very differ-
conditions for plantation forests and other wood- ent mitigation potentials in the forest sector should
lands, where the former act as a productive source not prevent us from taking advantage of the opportu-
of wood and the latter mainly as a carbon sink. nities for using EU policy to enhance forestry’s role
In southern Europe, large areas of forests are in mitigation. There is a wide range of mitigation
13From Science to Policy 2
Bioenergy and carbon sinks: trade-offs or not?
Increasing demand for forest biomass for bioenergy creates a challenge in forest policy discussions in
the EU. For example, it has been argued that it could result in a reduced forest sink and mitigation po-
tential. However, as indicated in section 3, the conclusions on this issue also depend on the system
boundaries and the timescale used for assessment. The current scientific literature provides very differ-
ent views on this issue.
Figure 5 can be interpreted as showing that contrary to common expectations, the data as such does
not necessarily indicate a trade-off between bioenergy, wood product production and the biomass sink
in forests. Countries with significant amounts of woody biomass-based energy production (Germany,
Sweden) exhibit both large sinks in forest biomass and the largest felling amounts: wood energy pro-
duction is primarily based on domestic and not imported woody biomass. A large share of bioenergy is
produced from by-products, harvest residues and low-quality thinning wood. These quantities are also
directly related to the magnitude of fellings. Interestingly, the felling/increment or forest utilisation ra-
tios (see Figure 7) are close to the European average in most countries with large forest sectors; i.e.
these countries simultaneously use their forests for wood and bioenergy production, and successfully
manage to maintain their carbon sinks.
While there may be marginal trade-offs in some countries between the rate of increase in the carbon
sink and the rate of forest utilisation, the rate of fossil fuel substitution and increases in the harvested
wood products carbon pool may either partially or fully compensate for these.
120,000
DE
100,000
Fellings volume (1000 m3/y)
80,000 SE
FI
60,000
PL
40,000 FR
AT
20,000 CZ RO
UK IT
HR SK BG
NL SI
0
0 20 40 60 80 100
Sink (Mt CO2/y)
Figure 5. The 28 EU Member States’ forest sectors in the intersection of CO2 forest sink, wood products
production (fellings), and woody biomass bioenergy production (size of the ball). Data from FOREST
EUROPE. Note that some small countries fall away behind larger balls.
14A new role for forests and the forest sector in the EU post-2020 climate targets
Figure 6. Forest ownership fragmenta-
tion is an important challenge for pol-
icy makers when trying to implement
climate mitigation measures in forests
in Europe. The average holding size for
the EU is 2.7 ha. In this cadastral data
picture, fragmented forest ownership is
expressed by a unique colour per forest
owner in a rural area in Atlantic Europe.
Even though there are many owners,
only a few of them own by far the larg-
est share. The chances of successful and
cost-efficient implementation of climate
mitigation measures in forests are much
higher with owners of larger properties
than with owners of small properties.
The total forest area shown is approxi-
mately 2,300 ha (Cadastral data).
potential across Member States in nearly all sec- well as possible. A ‘one-size-fits all’ policy is un-
tors in the EU economy, for example, in terms of likely to achieve this. In addition, different polices
opportunities for decarbonising energy supply. This impacting on the forest sector, such as rural poli-
has not prevented the EU from adopting targets re- cies, industrial policies, energy policies and biodi-
lated to renewable energy generation, for exam- versity policies, should be set in such a way that
ple. There is no reason why the forest sector could the synergies with climate mitigation targets are
not be treated in the same way, with the establish- achieved as far as possible.
ment of a policy framework that enables Member
States to use their diverse potential to contribute to The future of the sink in European
climate change mitigation. In addition, the Forest forests
Management Reference Level is very different from
country to country, based on past historical growth The future of forests in the EU and their ability to
and on future forest use potential. This presumably mitigate climate change by forming a sustainable
places countries on a somewhat equal footing. sink is subject to a variety of uncertainties. In re-
‘Climate Smart Forestry’ is an approach that cent decades, increments (i.e. volume growth) have
mainstreams climate mitigation by using forests been significantly larger than fellings in most of
and the forest sector and related policies in a way the EU countries (see Figure 7). Whether this trend
that utilises the different regional characteristics will continue will strongly depend on the impact of
and circumstances of the EU Member States as changes in temperature and precipitation due to
15From Science to Policy 2
Figure 7. Regional variation of
forest harvest intensity (in %
of volume increment) in the
EU and EFTA, showing the av-
erage for 2000–2010 (Levers
et al. 2014). This is another
type of variation that provides
different opportunities for
climate smart forestry. Note
that colours per region may
slightly vary from year to year.
The highest harvesting inten-
sities are found in southern
and eastern parts of Finland
and Sweden, the Baltic coun-
tries, Ireland and the mountain
ranges of central and eastern
Europe. The extremely high
harvesting levels in southwest
France are due to a series of
extreme storm events.
climate change, and on the variety of forest manage- to forecast. It is subject to many uncertainties and
ment impacts and intensities, as well as on policies depends, for example, on how forest bioenergy is
adopted in the EU (see Figure 8). viewed in the post-2020 EU climate policy or how
Uncertainty is linked to the projected increase in and to what extent the ongoing structural chang-
extreme events, either as abiotic disturbances (fire, es in global forest products markets (e.g. declining
storm) or as periods of extreme drought that will production for some products in the EU) and round-
affect growth and therefore carbon sequestration. wood markets (new capacity increasingly based on
As a general trend, longer vegetation periods and southern hemisphere plantation forests) and new
higher temperatures are expected to enhance forest forest-based bioeconomy products (e.g. chemicals,
growth especially in northern parts of the EU, while textiles and biofuels) are going to impact on the de-
in southern and continental EU countries, the lack mand.
of precipitation and increasing risk of drought may What the net impact of woody biomass demand
lead to growth reductions and changes in tree spe- on EU forests and forest management will be re-
cies composition. mains to be seen. Likewise, how much more addi-
Wood demand from the forest and bioeconomy tional demand can be biophysically, ecologically and
sectors in the different regions of the EU is difficult socio-economically supplied to new biorefineries
16A new role for forests and the forest sector in the EU post-2020 climate targets
Figure 8. EU climate and energy policies do influence forest management. Much discussed are possible CO2
leakages related to the imports of woody biomass from, for example, the USA because the USA has not ratified
the Kyoto Protocol. Here, the Enviva pellet mill in Ahoskie, NC, USA is shown, which produces pellets partly for
the EU market. The production (and definitely the exports) is stimulated by the EU Renewable Energy Directive.
On the left, the raw materials can be seen: low-quality logs as well as sawdust and chips. Solid biomass criteria
are being discussed to assure sustainable sourcing and low carbon debt. Pellet production in southeastern
USA has sharply increased in the past five years, but is still relatively small with some 7 million tonnes in 2014.
The pellet market is a new commodity that allows mobilisation of woody material and its transport over long
distances.
and bioenergy plants, and whether traditional for- • A study on farmland in the EU revealed that poten-
est industries will maintain or change their current tially 12–17 Mha of farmland could be abandoned
consumption patterns, remains uncertain. by2030. If this area were afforested, it could pro-
All these developments, including EU climate vide an additional sink of almost 70 Mt CO2 /y
policy, will affect the future carbon sinks in forests and an additional wood production of 100 Mm3
and harvested wood products. The net balance of per year, i.e. almost 25% more than currently pro-
these changes is difficult to predict. Indeed, there duced.
is an urgent need to make new assessments of the • EU domestic woody biomass/residues/low-qual-
impacts of the ongoing changes, and create scenar- ity thinning wood could probably cover 3–5% of
ios for possible future policy impacts, on the de- total EU energy needs– an avoidance of another
mand and supply of forest-based biomass in the 180 Mt CO2.
EU.
Naturally, these numbers should be regarded as in-
How could Climate Smart Forestry dicative, since they are subject to many uncertain-
strengthen the sink? ties (see above). Yet, they help to point to the still un-
used potential of the EU forests and forest sector to
• Forest resource projections with alternative man- contribute more to climate mitigation.
agement and policy assumptions indicate that Within this quantitative total estimate, a large vari-
forest carbon storage in EU forests could con- ety of potential solutions to enhance carbon seques-
tinue to increase from 2010 to 2030 by around tration and substitution in EU forests and the forest
20%, providing additional sequestration of up to sector are represented. Optimal solutions are in any
170 Mt CO2 /y by 2050. case regionally specific and are most likely to work
17From Science to Policy 2
when they find synergies with other issues locally Further synergies can also be found by the mitiga-
at stake. This is the core of Climate Smart Forestry, tion of the projected disturbance risks from fire or
which seeks to find ways in which the regional char- storms, but also by the enhanced implementation
acteristics of EU Member States can be best har- of forest reserves and halting forest degradation.
nessed for climate mitigation, while at the same These could have large additional regional potential
time targeting other important objectives (wood pro- for the forest sector to contribute to climate mitiga-
duction, biodiversity, minimising disturbances, etc.). tion. An example of synergies with regional devel-
For example, counteracting the loss of carbon opment can be found in central European regions
from drained peat soils, or enhanced CO2 seques- where outgrown coppice is only used for non-com-
tration by using improved tree genetic resources mercial fuelwood and burned in local stoves at low
(through tree breeding), or the selection of species energy efficiency.
and provenances more resilient to climatic change Other opportunities exist outside forests to en-
are regionally specific measures. Tree species that hance sinks in harvested wood products: for exam-
are better adapted to climate change are likely to ple, through the increased use of wood in the con-
yield a more even flow of woody raw materials in struction sector or by developing strategies for the
comparison to species that are more vulnerable to cascading use of wood with energy conversion only
disturbances. following after multiple cycles of material use of the
woody biomass.
18A new role for forests and the forest sector in the EU post-2020 climate targets
5. Towards a new role for EU forests and the forest
sector in the climate regime
Emissions and removals from LULUCF will be in- The EU has already discarded the option of in-
cluded in the EU’s 2030 climate policy framework. cluding LULUCF emissions in the EU Emissions
But how this will be done has yet to be decided. Two Trading System (ETS). Inclusion in the ETS would
key questions for policy discussion are presently on in fact require land holdings to be subject to rules,
the table: monitoring and reporting comparable to those of
• What would be the most appropriate policy frame- emissions from installations covered by the ETS.
work for stimulating additional emission reduc- The Intergovernmental Panel on Climate Change
tions in the forest sector in the EU? (IPCC) guidance for monitoring LULUCF, howev-
• What principles and policy instruments should be er, is designed for national inventory systems and is
used to enhance the role of European forests in not applicable to monitoring at the farm/land hold-
climate change mitigation? ing level. The European Commission has therefore
preferred to discard the inclusion of credits generat-
The EU policy framework on ed by LULUCF activities in the ETS. This decision is
LULUCF post-2020 based on considerations related to the impracticality
of developing a new monitoring system on all types
Existing rules under the Kyoto Protocol limit the ex- of land and the impossibility of guaranteeing the
tent to which credits from forest management can compatibility and consistency of holding level esti-
be used to compensate debits from other activities mates with those of national data as well as the pro-
pre-2020 (see section 2). In 2013, the EU adopted ac- jected monitoring and administrative costs of the
counting rules and action plans on greenhouse gas system. This seems like a reasonable conclusion, al-
emissions and removals resulting from LULUCF though there have been examples where forest sec-
activities for the first time. This was a preliminary tor credits have been included in ETS systems, such
step towards the inclusion of LULUCF in the EU’s as in New Zealand.
emission reduction commitments post-2020.
Lessons learned: New Zealand
New Zealand integrated the forestry sector in its national climate policy in 2007. New Zealand adopt-
ed a strategy in which two schemes co-exist. First, the Permanent Forest Sink Initiative (PFSI) imposes
limitations on clearance and clear-fell harvesting as well as a requirement for 99-year maintenance of
forest cover. Second, the New Zealand Emissions Trading Scheme (NZ ETS) focuses exclusively on car-
bon, with almost no consideration of co-benefits (here mainly environmental ones). Forest owners may
voluntarily choose either scheme for forests planted after 1989.
As of 2011, the number of participants in NZ ETS has increased from the original 35 in 2007 to 1847,
and 25 times more hectares of forest are involved. The PFSI is not compensated by a higher price for
carbon credits. Nonetheless, it is interesting to observe that outside the national market, PFSI credits
carry a potential price premium (up to 25%) because they are considered ‘greener’.
In general, this illustrates that a scheme at forest holding level can exist (although small) and that two
possible schemes can co-exist, even though one of the schemes is more demanding in terms of co- ben-
efit management. For example, Denmark specifically bought PFSI credits for its Kyoto compliance and
not NZ ETS because they did not like their attributes, specifically, non-permanence.
19From Science to Policy 2
Having discarded the option of including LULUCF • Developing specific LULUCF rules,
in the EU ETS, EU policy makers are currently fo- • Including LULUCF in the Effort Sharing Decision
cusing on three main options for including emis- (ESD),
sions and removals from LULUCF in the EU cli- • Developing a separate EU land sector pillar.
mate change mitigation framework post-2020:
Option 1 — ‘Status quo’
This option would continue the treatment of LULUCF emissions separate from non-CO2 emissions
from agriculture, which are already included in the Effort Sharing Decision.
However, this would not necessarily imply a ‘no–action’ scenario.
The major perceived disadvantage of this option is that LULUCF and agriculture emissions would
continue to be addressed by different policy tools, potentially reducing policy coherence, cost-effi-
ciency and rendering the design of incentives for action more complex.
Option 2 — Effort Sharing Decision
This option would include all LULUCF activities under the Effort Sharing Decision, potentially allow-
ing the tradability of units between sectors and enhancing cost-efficiency.
Relative to option 1, the challenge is that trading would increase complexity and raise methodolog-
ical issues, including concerns related to environmental integrity and technical questions (e.g. how
to reconcile the fact that the Effort Sharing Decision is based on annual compliance cycles, whereas
LULUCF removals and emissions are measured based on longer reporting time lags).
However, trading would provide more flexibility to Member States on where best to achieve their
targets.
Option 3 — Land sector pillar
This option would create a new pillar in EU climate policy, including both LULUCF and non-CO2
emissions. This could be done with or without the adoption of mitigation targets.
The advantage of this option is that it provides a policy framework which reflects the land sector’s
particularities (e.g. permanence, long time-cycles and high natural inter-annual variability).
Relative to option 2, it would lack the potential flexibility of creating tradeable units between sec-
tors within the Effort Sharing Decision.
Figure 9. Options for the inclusion of emissions and removals from LULUCF in the EU’s post-2020 climate
change mitigation framework, as identified by the European Commission in SWD (2014).
Option 1, ‘status quo’, would continue the present Option 2, Effort Sharing Decision, would include
division between LULUCF emissions and non-CO2 LULUCF activities among those eligible to achieve
emissions from agriculture. However, it would leave the targets of Member States under the ESD. If flex-
open the option to adopt targets or other measures ibility is allowed, rendering emissions and remov-
to facilitate emission reductions within the con- als from LULUCF interchangeable with those from
straints identified by the recently adopted EU ac- other sectors included in the ESD could be a signif-
counting rules, and by any new rules concerning icant challenge. The European Council has already
accounting which may be adopted under a Paris decided that Member State targets for the non-ETS
Agreement and/or the Kyoto Protocol post-2020. sectors will be calculated on the basis of relative
20A new role for forests and the forest sector in the EU post-2020 climate targets
GDP per capita in a fair way. This criterion, howev- A key question would be how targets for any com-
er, does not necessarily take into account the very di- bined land sector pillar would be set.
verse capacity of EU Member States to achieve miti- National circumstances need to be carefully con-
gation in the forest sector (see section 4). As forests sidered in all the options, to avoid creating ‘unfair’
provide many other ecosystem services, this type of advantages for some Member States in achieving
inclusion would require strong safeguards guaran- their targets. From the perspective of the forest sec-
teeing that mitigation efforts are not made at the ex- tor, the main difference between these options is the
pense of reducing those services. Member States’ flexibility in trading credits between
Option 3, land sector pillar, would have the ad- sectors and in achieving any targets that may be set.
vantage of creating a tailored approach to the spe- Currently, however, there is no indication that any
cificities of the LULUCF sector, although it would targets will be adopted.
require the merging of forestry net emissions with Adopting either Option 2 or Option 3 would in-
those from farmland, as well as non CO2 emissions volve merging LULUCF emissions with non CO2
from agriculture. This option would not per se cre- emissions from agriculture, which are presently reg-
ate additional incentives to increase removals or re- ulated as part of the Effort Sharing Decision. These
duce emissions, unless specific LULUCF targets emissions would continue to be accounted for sepa-
are adopted. These targets, however, would be kept rately in inventory terms, but would be part of a sin-
separate from those in the Effort Sharing Decision. gle pool of emissions for compliance purposes.
21You can also read