State Climate Office of North Carolina - NC State Climate Office
←
→
Page content transcription
If your browser does not render page correctly, please read the page content below

2 0 1 7 -2 0 1 8
      A N N U A L REPO RT

State Climate Office of North Carolina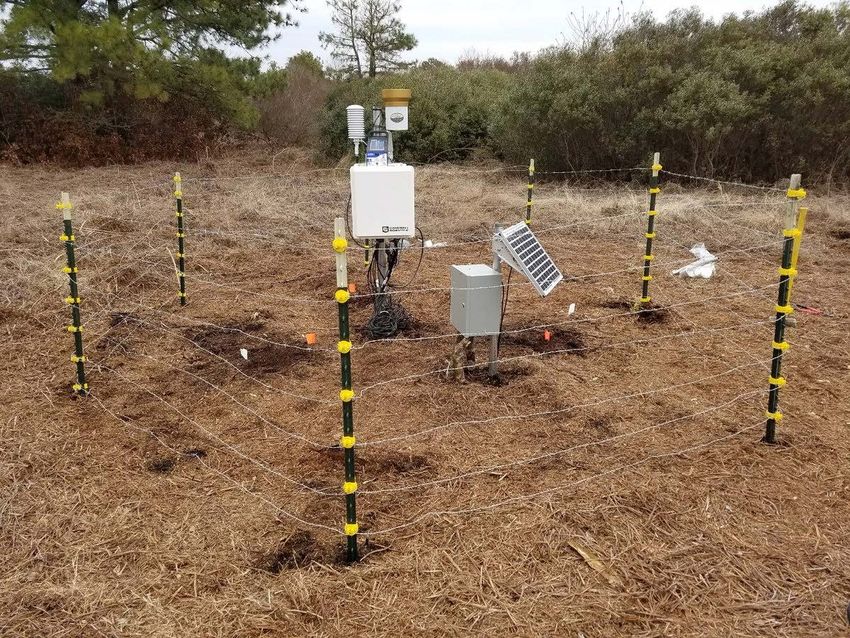
St at e Clim at e O f f ice o f N o r t h Car o lin a

                                        May 2017 - April 2018 Annual Report
    The State Climate Office of North Carolina (SCONC) serves as the primary scientific extension resource for
    weather and climate science focused on North Carolina. Founded in 1976 and chartered as a Public Service
    Center by the UNC Board of Governors in 1998, SCONC focuses on service to public and private sectors of
                   North Carolina through climate science extension, research, and education.

                                                                  Staff
                                                Dr. Aaron Sims            Ms. Heather Aldridge
                  Interim Director / Acting State Climatologist           Interim Associate Director / Assistant State Climatologist

                                             Ms. Ashley Hiatt             Mr. Sean Heuser
                                        Applied Meteorologist             ECONet Manager

                                           Mr. John McGuire               Ms. Rebecca Ward
                            Applied Meteorologist & Developer             Extension Climatologist

                                          Mr. Nathan Parker               Mr. Corey Davis
                                SystemsProgrammer / Analyst               Applied Climatologist

                                         Ms. Darrian Bertrand             Ms. Colleen Karl
                                         Applied Climatologist            Outreach Specialist

                                               Ms. Aurelia Baca           Mr. Joe Taylor
                                                  Climatologist           Instrumentation Technician

                                                             Students
                                                            Ms. Veronica Fall
                                                           Research Assistant

                                               Ms. Kelley DePolt, Undergraduate Assistant
                                               Mr. Alex Mitchell , Undergraduate Assistant
                                             Mr. Andrew Henderson, Undergraduate Assistant
                                              Mr. Karl Schneider, Undergraduate Assistant
                                              Ms. Lexia Williams, Undergraduate Assistant

St at e Climat e Office of Nort h Carolina              Phone: (919) 515-3056
College of Sciences                                     Fax: (919) 515-1441
1005 Capability Drive                                   E-mail: sco@climate.ncsu.edu
Centennial Campus Box 7236                              Web: climate.ncsu.edu
Raleigh, NC 27695-7236                                  Twitter: @NCSCO

                                                                                                                                       2
Execu t iv e Su m m ar y ................................................................             4

           M issio n .........................................................................................   7

           H igh ligh t s f r o m t h e Past Year .............................................                  8

 Table     Ex t en sio n .................................................................................... 10

   of      A p p lied Resear ch ..................................................................... 32

Contents   Ed u cat io n an d O u t r each ....................................................... 43

           A p p en d ices ................................................................................. 52

              A : C lim at e In f o r m at io n Ser v ices .................................... 52

              B : Im p act St at em en t ........................................................... 56

                                                                                                                     3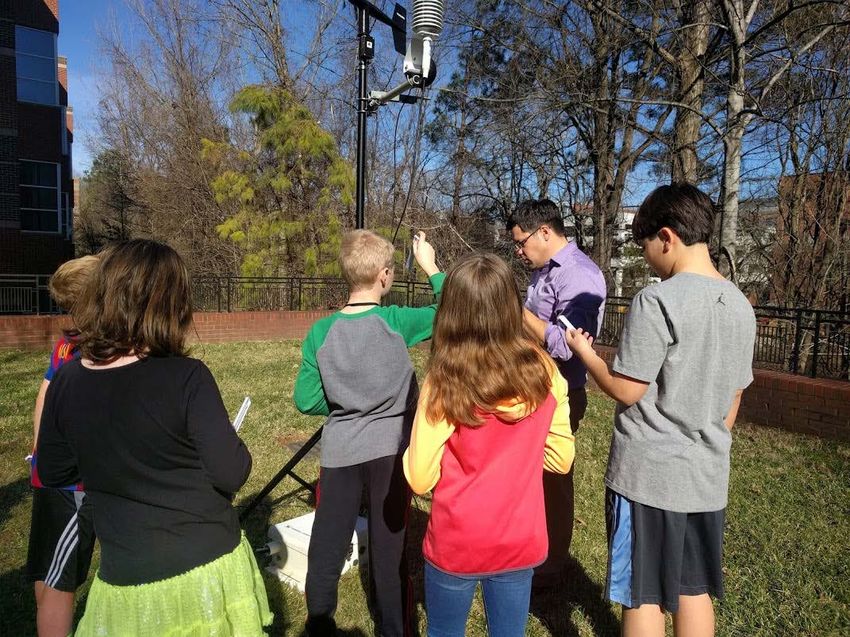
publicat ions authored by SCONC      DATA AND WEB
                                       staff and students. SCONC
                                                                            SERVICES
                                       continues to provide enhanced
                                                                            More than 1.2 million visits to the
                                       climate services via contracts and
                                                                            SCONC website last year. Since
                                       grants with 8 contract and grant
                                                                            2009, web traffic has increased
   Execut ive                          proposals submitted (6 funded; 2
                                       pending).
                                                                            483%. Over half of all webpage
                                                                            visits were to online educational
   Summary                             ENVIRONMENTAL                        content created by SCONC staff
                                       MONITORING                           and students.

                                       Data provided by the NC              Users submitted 5 million data
                                       Environment and Climate              queries through the SCONC online
                                       Observing Network (ECONet)           data retrieval system ? an increase
                                       enhance our public service mission   of nearly 50% compared to the
                                       and support agricultural research    previous year (3.4 million).
HIGHLIGHTS                             and operations, Cooperative          Nearly 3 million data queries were
The State Climate Office of North      Extension, and educational           made through the SCONC
Carolina (SCONC) employed 12           outreach.                            web-services application
scientists and staff, 1 graduate
                                       Over half a billion observations     programming interface, which is an
students, and 5 undergraduate
                                       were recorded at NC ECONet           advanced, customizable data
students during the past year.
                                       stations, which are maintained and   retrieval service.
In addition to daily climate service   operated by SCONC.                   SCONC provides access to 85
activities, 15 collaborative
                                       SCONC scientists made 158            terabytes of gridded data for
research and applied projects
                                       ECONet site visits to perform        partners and end users, and
were funded and included effort
                                       routine or emergency                 averages over 6 terabytes of
across many sectors including
                                       maintenance, covering 21,464         internal climate data transfarers,
health, agriculture, and
                                       vehicle miles, with 272 sensors      with about 2.2 billion data records
transportation.
                                       serviced or replaced.                selected, updated, or inserted each
These projects and collaborations                                           month.
yielded 6 peer-reviewed

                                                                                                            4
RESEARCH AND                          on improving climate and health        Weather Intelligence Portal, a
EXTENSION                             information related to heat stress.    real-time monitoring tool for
                                                                             weather and fire risk information.
PARTNERSHIPS                          For over a decade, the SCONC has
The SCONC, through a partnership      partnered with NC Department of        The SCONC was part of a team of
with NCSU Plant Pathology that is     Transportation (NCDOT) to              scientists, led by RTI International,
now in its 14th year, provides        provide an operational rainfall        that participated in the Defense
routine advisories for two peanut     alert system to meet their water       Coastal/Estuarine Research
foliar diseases.                      quality permitting and storm water     Program (DCERP). This program
                                      control requirements. This effort      conducted monitoring and
The SCONC has been been an            has been estimated to save more        research to understand coastal and
integral member of the NC             than 113,000 work hours each           estuarine ecosystems within the
Drought Management Advisory           year. During the past year, this       context of a military training
Council for over two decades. This    partnership has been extended to       environment. This six-year project
interagency coordination and          help NCDOT identify high-risk          concluded during the past year.
information exchange body is          areas susceptible to extreme
tasked with assessing conditions                                             SCONC scientists serve as the
                                      precipitation events.
and issuing drought advisories for                                           climate focal point on the Spatial
the state of North Carolina.                                                 Analytic Framework for Advanced
Through its efforts on the Council,                                          Risk Information Systems
SCONC participates in weekly                                                 (SAFARIS) project, which is a
drought monitoring conference                                                collaboration with colleagues at
calls and provides public                                                    NCSU?s Center for Integrated Pest
presentations and media                                                      Management (CIPM) and USDA
interviews on North Carolina                                                 Animal and Plant Health
moisture conditions.                                                         Inspection Service (APHIS)
                                                                             working to estimate global risk to
The SCONC contributed to                                                     trade of agricultural products.
engagement activities of the
Carolinas Integrated Sciences and                                            For over 12 years, the SCONC has
Assessments, a NOAA Research                                                 partnered with the North Carolina
Integrated Sciences and                                                      Division of Water Resources
Assessments, to improve drought                                              (DWR) to provide weather and
monitoring and advance the                                                   water data to DWR for their Water
science related to fire and                                                  Resources Information, Storage,
smoldering risk in organic soils.     Through a USDA cooperative             Analysis and Retrieval System
                                      agreement, the SCONC provides          (WRISARS).
UNC-Chapel Hill and NCSU have
                                      technical, scientific, and extension
partnered together on the NOAA
                                      expertise for the USDA Southeast
Southeast Regional Climate
                                      Regional Climate Hub extending
Center (SERCC) since 2007. As
                                      climate science to support
part of this collaboration, the
                                      informed decision making on
SCONC develops and maintains
                                      southeastern US forests,
the technological infrastructure,
                                      rangelands, and croplands. As part
web services, and online climate
                                      of this agreement the SCONC has
tools for SERCC. This year the
                                      modernized and expanded the Fire
SCONC and SERCC have worked

                                                                                                             5
OUTREACH AND                         evolving drought conditions,         students and the broader
EDUCATION                            snowfall and winter weather, and     community to introduce weather
                                     seasonal outlooks.                   and climate concepts through
The SCONC regularly leads and
                                                                          precipitation data collection.
attends educational outreach         The SCONC is continuing to host a
events across the state of North     STEM program, funded by the
Carolina. In 2017-18, staff and      Burroughs Wellcome Fund, for         Studentscompare temperature
                                                                          measurementsfrom hand-held
students participated in 14          rising 7th-grade students in rural
                                                                          thermometersto those recorded by
outreach events, 4 of which were     northeastern NC. Through this        research-grade sensorson SCONC's
large, public events including NC    program, the SCONC is engaging       mini tower.
State College of Science?s Eclipse
Day and the 2018 Farm Animal
Days.
More than 20 presentations on
North Carolina?s climate, weather,
and ongoing SCONC research
projects were given to community
groups, professional groups,
conference attendees, and visiting
scientists or professionals.
Staff and students wrote 25 posts
for the SCONC Climate Blog,
receiving 40,740 total views.
In the past year, the SCONC gave
more than a dozed media
interviews on events such as

                                                                                                        6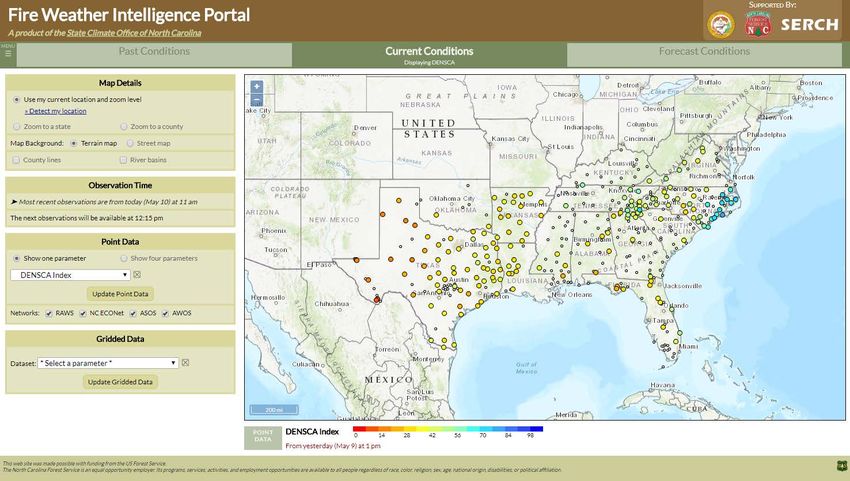
Mission
                          Asapproved by the UNC Board of Governors, October 8, 1998
 The mission of SCONC as a Public Service Center is to define, predict and disseminate information about the
climatic and environmental factors that impact the people of North Carolina. SCONC has defined the following
               objectives as the primary focal points of service to the people of North Carolina:

                                                EXTENSION
 -    Provide the most accurate climate information to the citizens of North Carolina.
 -    Assist North Carolina state agencies in climate-environment interaction issues and related applications.
 -    Establish, operate, and maintain an extensive meteorological network across North Carolina and archive
      and disseminate this data to the public in a timely fashion.
 -    Assist other extension scientists by integrating climate information into applications such as agricultural
      and environmental models.
 -    Increase public awareness of variations in North Carolina?s climate and environment.

                                                RESEARCH
 -    Study North Carolina's climate and its interaction with the environment.
 -    Investigate the effects of climatic variations on agriculture, air pollution, and natural resources and
      develop forecasts that assist in resource management.

                                                EDUCATION
 -    Interact with K-12, community college teachers and students, and with other community organizations
      on different aspects of North Carolina?s climate and environment.

                                                                                                                7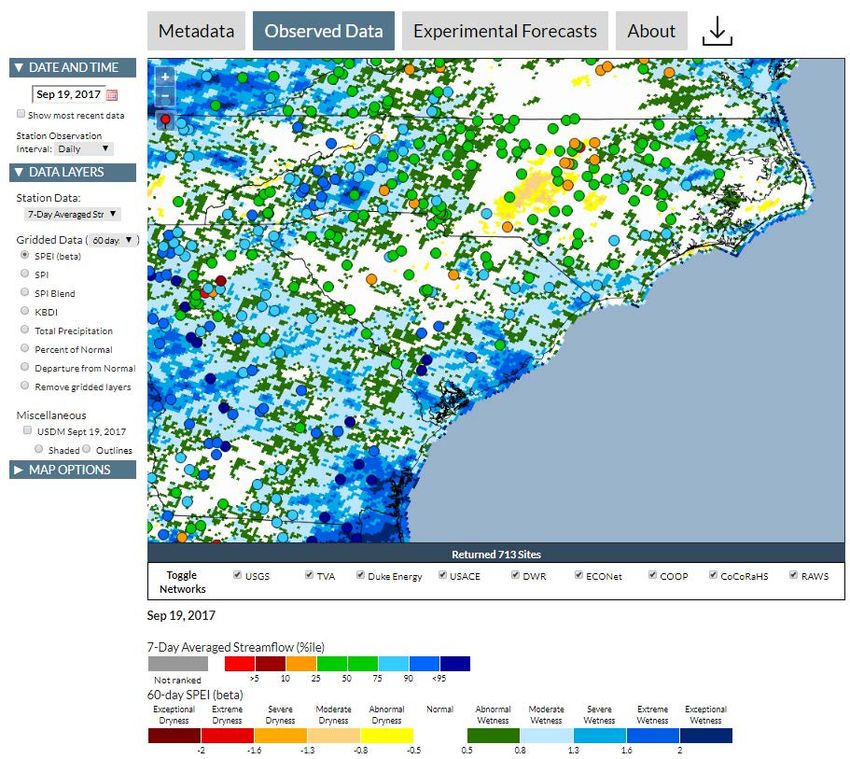
scheme and updated fonts. Menus
              NEW WEBSITE LAUNCHED
                                                       were restructured and simplified to
              In late 2017, SCONC launched a
                                                       feature the most-viewed content,
              new website designed improve the
                                                       such as climate education materials,
              accessibility of climate information.
                                                       data request and retrieval options,
Highlight s   The new website was built as part of
              several user-engagement and
                                                       and web services including maps
                                                       and tools. A new map and graphing
from Last     feedback sessions to inform the
              design, functionality, and usability.
                                                       tool was added to the homepage,

   Year       Because the ways in which users
              access the website has evolved,
                                                       allowing visitors to quickly view a
                                                       snapshot of current conditions
                                                       across the state and download
              SCONC used a responsive design to
                                                       recent data measured by SCONC?s
              improve the experience and
                                                       ECONet. Every staff and student
              accessibility for users with various
                                                       had the opportunity to participate
              sized screens, including
                                                       in this enormous undertaking.
              smartphones. The new website
              features a lighter, modern color

                                                      The map pictured above isfrom the new
                                                      SCONC homepage, where near-real-time
                                                      conditionsfrom the NC Environment and
                                                      Climate ObservingNetwork (ECONet)
                                                      are displayed. Userscan toggle between
                                                      several parametersto the left of the map,
                                                      or view more parametersby clicking
                                                      "View Full Map." Finally, clickingthe
                                                      "Recent Observations" button beneath
                                                      the map showsa time seriesof
                                                      information for the station closest to the
                                                      user'slocation.

                                                                                           8
FIVE-YEAR REVIEW                     North Carolina as well as state       worked as an undergraduate
                                     agencies, and continued               research assistant at SCONC
SCONC completed its five-year
                                     facilitation of cross-disciplinary    before graduating from NC State in
review process of the Center in
                                     development of applications           2013 with a B.S. in Meteorology
January 2018. Over the past five
                                     influenced and driven by              and Marine Science. He recently
fiscal years (2013 ? 2017), SCONC
                                     climate-environment interactions.     received his M.S. in Soil Science
developed decision support
                                     SCONC also plans to continue to                               with a
systems and information portals
                                     serve as a climate science focal                              certificate
for multiple sectors including
                                     point for regional and federal                                in GIS.
forestry, fire weather, and water
                                     partners, and contribute to                                   During his
resources. Services provided to
                                     multi-state environmental needs.                              graduate
stakeholders include pest and
                                                                                                   studies, he
disease alerts and forecast          NEW TEAM MEMBERS
                                                                                                   used
services for agricultural resource   SCONC welcomed two new
                                                                           lightweight cameras mounted on
management. SCONC has also           members to our staff over the last
                                                                           small unmanned aircraft to detect
sustained engagement and service     year.
                                                                           nitrogen levels in wheat and corn.
to the public health community in
                                     Darrian Bertrand is an Applied        He is now providing maintenance
North Carolina.
                                     Climatologist joining us from         and data quality control for the
SCONC has a 41-year history of       Oklahoma. She received a B.S. in      ECONet. He has worked on a
serving the citizens of North        Meteorology with minors in            statistical model to forecast soil
Carolina. Over this period, the      mathematics and GIS, and an M.S.      moisture and is currently working
demand for weather and climate       in Geography from the University      on developing a multi-level soil
information and services has         of Oklahoma. During her graduate      temperature model for use in data
grown exponentially, and             studies, she                          quality control routines.
subsequently, the program has        used
expanded to meet this demand,        statistically
both in personnel capacity and       downscaled
technology development. Its core     climate
mission (applied research,           projections
extension, and education focused     to analyze
on climate-environment               the future frequency of heavy
interactions), identified by the     rainfall and severe drought events
UNC Board of Governors in 1998,      in the south-central US. Other
laid out a roadmap that has          studies she has completed include
contributed to the development       a climatology of prescribed burn
and success of the Center over the   days in the south-central US and a
past 20 years. SCONC continues to    visual drought scale. She is
have substantial growth potential    currently working on products for
as climate science evolves and       the Fire Weather Intelligence
end-user requests increase in        Portal and assessing wet bulb
complexity.                          globe temperature in relation to
Future efforts of the SCONC          heat-related illness.
include ongoing service as the       Joseph Taylor is an Instrument
resource for weather and climate     Technician who rejoined SCONC
information for the citizens of      during the last year. He previously

                                                                                                         9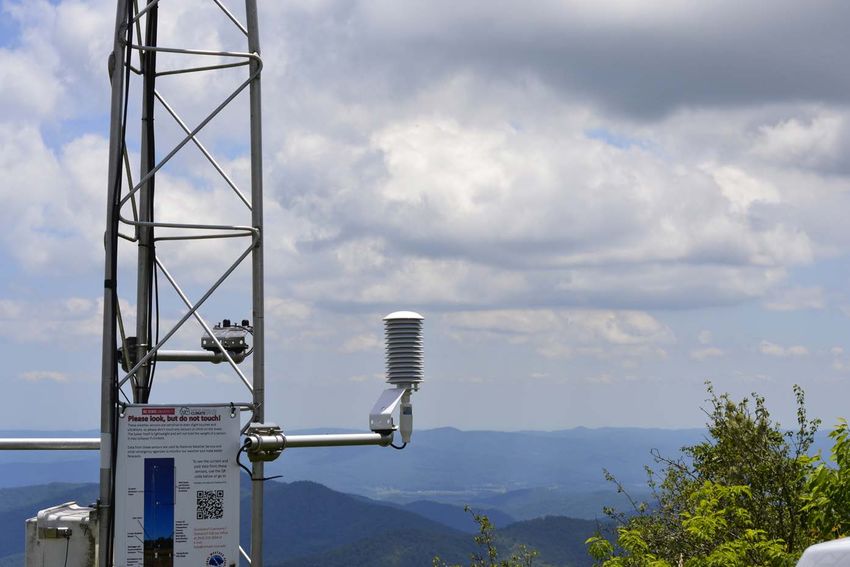
Providingclimate servicesthrough direct contact, online databasesand
            analysistools, environmental monitoring, and routine climate summariesis
            part of SCONC?score mission of extension. SCONC partnersclosely with
            scientistsin agriculture, natural resources, public health, water resource
            management, and other sectorsto develop and deliver custom productsand
            tailored climate services. SCONC also supportsregional climate services
            acrossthe southeast in partnership with the NOAA Southeast Regional
            Climate Center and USDA Southeast Regional Climate Hub.

 Climate
Extension   Contents

 Services   H igh ligh t s ............................................................................................. 11

            Clim at e an d In f o r m at io n Ser v ices .............................................. 12

            Clim at e D at a A ccess an d M an agem en t ................................... 15

            N C Clim at e an d O b ser v in g N et w o r k (EC O N et ) ................... 17

            Clim at e Su p p o r t f o r A gr icu lt u r e ................................................. 19

            Clim at e Su p p o r t f o r To o ls an d D ecisio n A p p licat io n s ......... 23

            Clim at e Su p p o r t f o r W at er Reso u r ces ...................................... 26

            N O A A So u t h east Regio n al C lim at e C en t er ........................... 27

            Clim at e Su p p o r t f o r C o o p er at iv e Ex t en sio n .......................... 30

                                                                                                                      10
CLIMATE
SERVICE
HIGHLIGHTS
1.2 million web visits
19% increase in direct requests for services
5.0 million data queries via CRONOS
website
2.9 million API queries to climate database
6 t erabyt es of internal database transfers
Over 2.2 billion climate data records
selected, updated, or inserted each month
21,464 vehicle miles that supported 179
visit s to ECONet weather stations
99.54% of ECONet dat a passed automated
and manual quality control
11Climat e and Informat ion
Services
CLIMATE SERVICES users to ensure responsive and new website design that
reliable climate information consolidated and streamlined
SCONC provides many climate
services. The SCONC website is many products and services,
services to clients and partners.
often the first point of contact with making them easier to access and
Climate services is a broad
clients who need climate more intuitive to use. The overall
concept, but fundamentally
information. Effort continues to bounce rate, or percentage of
involves interaction between a
focus on developing web products visitors who leave a site after
client or stakeholder who needs
and tools based on weather and visiting only one page, decreased
climate information and SCONC
climate data to provide dynamic by 3.77%. Of the total number of
scientists who are experts in
products and services. visits, 957,228 (88.6%) were from
climate data and climate science.
new visitors, a decrease from
Many users are not sure what data WEB SERVICES USAGE
1,412,498 in the previous year.
or information is best for their Last year, the SCONC website
Despite this one-year dip in the
needs, and often need guidance on received 1,210,849 visits (graphic
number of visitors, overall web
how to properly use and interpret below), a decrease of nearly 30%
traffic has increased by 591.5%
climate information. SCONC staff over the previous year (1,726,994).
since 2008-09.
and students interact directly with This decrease resulted from the
Pictured left are Google Analyticsfor
the SCONC'swebsite visitsover the
report period.
12MOST VISITS ON A - 17% for Mount Mitchell (e.g., bookmarks, direct
SINGLE DAY ECONet (MITC) (1.3% of all URL)
page views) - 0.5% of website visits came
13,563 on October 24, 2017. The - 5.5% for Grandfather Mtn. from social media
SCONC's K-12 Education page on ECONet (GRANDFATHR) - 4.2% of website visits came
Climate Change Causes had 59.9% - 3.0% for Lake Wheeler
from non-search engine
of daily traffic on this day (8,118 ECONet (LAKE)
referring sites such as news
visits) - 2.4% for Bald Head Island
ECONet (BALD) articles
STATION MOBILE - 1.6% for Sassafras Mountain
VISITS BY LOCATION
WEBSITE ECONet (SASS)
- 1.4% for Bear Wallow Where are website visitorsfrom?
At each of our ECONet stations, a
Mountain ECONet (BEAR) US State Visits (58.3%)
sign is posted with a QR code and
- 1.3% for Goldsboro
website address that link to a page - 23.4% of all visits came
showing the station?s current ECONet (GOLD)
from North Carolina
weather data. This page is designed
for mobile devices so users visiting (165,022)
our stations can view the latest - Among other states, the
conditions on their smartphones. most visits were from CA
Airport weather stations are also (9.5%), TX (5.4%), FL (5.2%),
included on the mobile site,
NY (4.9%), GA (3.6%), and
allowing users to also view recent
conditions at these locations. The VA (3.1%)
Station Mobile Websites received - 19 states had 10,000+
7,183 total page views for the visits
period; the most frequent visits by - 1,000+ visits from every
station are:
state but WY
- 19.6% for Sassafras
Global Visits (41.7%)
Mountain (SASS)
- 18.2% for Frying Pan - Most visits were from India
Mountain (FRYI) (10.9%), Philippines (4.3%),
- 14.8% for Mount Jefferson UK (4.1%), Canada (3.9%),
JEFF) and Australia (2.7%)
- 5.8% for Bahama (BAHA) - Overall, 1,000+ visits from
- 5.7% for Clayton (CLAY) 53 countries and 100+
visits from 136 countries
CONTENT HIGHLIGHTS
What were visitorslookingat?
WEB TRAFFIC SUMMARY
60% of all page views on the
How are visitorsgettingto the SCONC
SCONC website were K-12 website?
Education Content,followed by
- 79.9% of website visits
12.3% for Aspects of NC Climate.
came from a search engine
7.7% of all page views were data
(e.g., Google)
requests. Data requests visits by
- 15.3% of website visits
station (7.4% of all page views)
came from direct sources
13USMap depictingthe states
from which clientshave
requested data in the past year.
The majority of data requests
came from clientsin North
Carolina.
LOCATIONS OF CLIENTS REQUESTING DATA
Most clients requesting data were from North Carolina (78.9%) while 12.1% of clients did not specify their
location when submitting a request. The remaining requests were put in by clients from 16 other states
averaging 1 to 4 requests each. The previous year had roughly the same distribution in client locations.
DATA REQUESTS FOR SERVICES
The past year saw a 19% increase in direct requests from clients via email and phone, as well as a 10% increase in
time spent directly responding to requests for services from clients compared to the previous year. As with most
years, a large percentage of time was devoted to supporting educational requests (68%), while remaining effort
went largely to support government (15%) and private industry (11%). Formal personal interest requests
accounted for 6% of effort. A detailed breakdown of request-driven climate services is provided in Appendix A.
DATA REQUEST FORM STATISTICS
The data request form retrieved 1,404 unique sessions (or page views, pictured in the time series below) from
May 1, 2017 through April 30, 2018. The average user spent roughly 2 minutes and 7 seconds on the page, while
the page itself had a bounce rate of 48.5%, which suggests just over 50% of the users who visit the page fill out
the request form. These numbers were slightly higher than for the previous year, in which fewer data requests
were submitted overall.
The graph above showsdaily submissionsto the data request form over the annual reportingperiod. A weekly signal is
evident, with few to no request submitted over the weekends.
14Climat e Dat a Access and
Management
WEATHER DATA
VISUALIZATION
An updated mapping interface has
been developed as part of the new
website. This tool provides a large
full-screen map with updated
graphics and navigation abilities.
Weather parameters from multiple
networks measuring hourly and
daily data are available through
this mapping interface, and both
past and current conditions can be
Hourly air temperaturesare displayed from multiple networksacrossNC and
displayed. In addition to
surroundingregions. Additional weather parametersand layscan be selected from
point-based observations, overlays the menuson the left.
of radar, satellite imagery, and mobile site allowing users to also types, and formula calculations.
watches and warnings are view recent conditions at these For the client side, a query builder
available through a variety of locations. interface is being developed to
geospatial layers. allow API clients easier access to
In addition, a new Application
data streams.
DATA ACCESS Program Interface (API) is in beta
As part of SCONC?s new website testing, adding many important The API incorporates parameter
launch, data accessibility for and user-requested features such metadata such as units, sensor
mobile devices has been improved. as data aggregation, variable information, and date of first
Nearly 40% of all web site traffic calculation, and unit conversion to observation of each variable at a
now comes from moble devices. the existing API?s functionality. given station. This information will
This is a substantial increase from This new API will enhance data allow the API to generate a best
less than 15% five years ago. Most accessibility for advanced users estimate where data is unavailable
tools and website content were and automated applications. or missing based on other
converted to a responsive layout to Future features planned for the observed parameters or using
accommodate screens of various API include a nearest station gridded data such as analyses or
sizes, allowing these resources to lookup and an option for forecasts as a surrogate. The API is
be functional on smartphones and "best-estimate" data. being written to use a variety of
tablets. The Station Mobile universal output formats, such as
API work over the past year
Website is also a mobile-friendly JavaScript Object Notation (JSON)
improved both the server-side and
way for visitors at ECONet and comma separated values
client-side usability. On the server
stations to directly retrieve the (CSV), which will allow the output
side, the focus has been on
latest weather conditions at a to be easily incorporated into
updating and adding new data
given station. Airport weather various programming languages
sources and linking variables to
stations are also included on the such as PHP, Python and Perl.
different data tables, network
15DATA USAGE
Users submitted 5.0 million data queries through the CRONOS website interface ? an increase of 47%
compared to last year. More than 2.9 million additional queries were requested through the web services API.
Along with those point data retrieval options, SCONC provides access to 85 terabytes of gridded data to
partners and end users. Network and data support for CRONOS users has shown a significant increase in the
amount of internal data ingest, management, and transfer. Each SCONC database averages more than 6
terabytes of internal climate data transferred each month with about 2.2 billion data records selected, updated,
or inserted each month.
DATA MANAGEMENT
New database modernization efforts are ongoing. New storage engines have been deployed on SCONC?s
back-end database infrastructure. These upgrades will allow for improved transaction monitoring as well as faster
backup and recovery protocols. As demand for large gridded datasets continue to increase, SCONC is working to
seamlessly integrate multiple workflows and enhance data accessibility.
Changesover Past Year: Performance Statisticsover Past Year:
- Continued migration into a virtualized services - Web Services Uptime - 99.962%
environment - Average Database (DB) Availability Uptime
- Added additional off-site systems for (across all DB servers) - 99.922%
redundancy and backup - Primary Database Availability Uptime - 99.98%
- Added more versatile iSCSI storage - Storage Uptime - 99.968%
- Computational Uptime - 99.973%
Computing Environment Statistics over Past Year:
- Total Processing Core - 413 Cores
- Total Memory Available - 1.87 TB
- Total Storage Allotment - 257.28 TB
- Average Daily Write Network Throughout -
7.02 TB
Schematic of SCONC
Computing
Infrastructure.
16NC Environment and Climat e
Observing Net work (ECONet )
The SCONC operatesand maintainsan extensive monitoringnetwork, the Environment and Climate ObservingNetwork
(ECONet) that provideshigh-quality, real-time observationsthat support state, local, and federal agencies. Base fundingfor
the ECONet isprovided by the NC Agricultural Research Service, which supportsthe maintenance of sensorsat agriculture
research stations. Additional support isprovided by the National Mesonet Program and individual local partners. The
ECONet usesresearch-grade sensorsto deliver unique, comprehensive observations, such assolar radiation, soil temperature,
and soil moisture, to sectorsthat are sensitive to weather and climate information .
STATION MAINTENANCE Even wildlife can't
get enough of our
Each station was visited multiple
weather towers!
times for routine maintenance over Two tree frogswere
the past year. These visits help found hangingout
keep the stations operating by our solar
efficiently and providing high radiation sensors
duringone routine
quality data. In total, 158 sit e visit s
maintenance visit to
were made to perform routine or our Goldsboro, NC,
emergency maintenance covering station.
21,464 vehicle miles ? a 12% serviced and 5 soil moisture College of
decrease in sit e visit s and a 15% sensors replaced Agriculture and Life Sciences. This
decrease in vehicle miles from the - 23 integrated probes station was the first in our network
previous year. Proactive station (measuring wind, to have a black globe thermometer
maintenance has helped optimize temperature, humidity, installed to better understand heat
network operations, increase pressure, and precipitation) stress among humans and
efficiency, and reduce maintenance serviced and 5 probes livestock.
costs. Sensor maintenance replaced
activities of the past year included: - 3 data loggers replaced and
- 44 wind monitors serviced re-calibrated
and 4 wind monitors - 10 temperature/relative
replaced humidity sensors serviced
- 31 all-season precipitation and 11 sensors replaced
gauge sensors serviced and - 6 black globe
11 sensors replaced thermometers installed
- 54 radiation sensors
serviced for calibration NEW STATION INSTALL
- 19 leaf wetness sensors
On February 1, 2018, the 41st
serviced and 28 leaf
station in our network was
wetness sensors replaced
installed and activated in Bahama,
- 29 soil temperature
NC, at the Butner Beef Cattle
sensors serviced and 5 soil
Laboratory. This station is
temperature sensors
sponsored by the NC Agriculture
installed or replaced Staff workingon installation at SCONC's
Research Service and the NC State Bahama, NC, station.
- 13 soil moisture sensors
17NEW SENSOR national gateway for dissemination
QUALITY ASSURANCE &
DEPLOYMENT to operational and research groups.
QUALITY CONTROL
In addition, monthly reports
Over the course of the reporting QAQC routines are run twice per summarizing the network?s
year, two new sensors were hour and help scientists spot availability are provided to MADIS.
installed at a few locations to help erroneous values and failing As a courtesy, alerts were sent to
monitor temperature. Black globe sensors across the ECONet. Over MADIS if data became unavailable
thermometers have been installed the past year, ECONet data passed for an extended period.
at six of our ECONet stations to automated and manual quality
help calculate Wet Bulb Globe As part of the National Mesonet
control routines 99.5% of t he t ime,
Temperature (WBGT), which can Program, all ECONet stations have
while only 0.2% of all dat a failed all
quantify heat stress. For the been upgraded to transmit data to
QC checks.
2018/19 reporting year, SCONC the State Climate Office every five
Most of the QC checks were minutes. The data are then relayed
plans to install more of these
enhanced this year to account for to our partners at MADIS. Over the
thermometers throughout the
new sensor deployments. Ongoing past year, ECONet data availability
network.
QC development is focusing on (defined as observations being
The second new sensor is an inter-sensor comparisons ? received within one hour of the
infrared thermometer used to especially between soil original observation time) is 97.9%,
monitor skin temperature, or the temperature probes and which is an increase of 1.7% from
temperature at the ground surface. temperature/humidity probes. A the previous year.
This sensor was tested at our Lake new inter-sensor comparison was
Wheeler Road site during winter implemented this year that models
2018 to monitor ground soil temperatures at multiple
temperatures during wintry depths and compares those values
weather events. While this sensor with observations. Inter-sensor
is still considered experimental, it tests are currently being developed
could be deployed at more stations for our co-located
next winter to better monitor temperature/humidity sensors and
ground temperatures. wind speed sensors.
Undergraduate students continue
to assist scientists with the daily
examination of ECONet data using
the QC interface. This manual
QAQC has led to improved data
quality and earlier detection of
sensor failures.
NATIONAL MESONET
PROGRAM
As part of the National Mesonet
Program, ECONet observational
Thisblack globe thermometer was data files are sent to the NOAA Snow lingerson the ground at the
installed at the Rocky Mount ECONet Meteorological Assimilation Data Wallace, NC, ECONet tower.
tower on March 3, 2018.
Ingest System (MADIS), which is a
18Analysis from past years suggests alerts sent to 406 unique phone
these advisories can save 2-3 numbers or email addresses.
fungicide applications per year, During the year, 47 new alert sites
with a value to growers of at least were added to bring the total
$1 t o 3 million per year. number of active sites to 428 as of
Climat e CUCURBIT DOWNY
May 15, 2018.
Support for MILDEW FORECASTS
LATE BLIGHT FOR
POTATOES AND
Agricult ure In an ongoing collaboration with
NCSU Plant Pathology, SCONC
TOMATOES
In collaboration with Dr. Jean
provides operational, national
Ristaino (NCSU Plant Pathology),
Integrated Pest Management
SCONC continues to provide
(IPM) forecasts for downy mildew
technology support and website
affecting cucurbits (cucumbers,
administration for monitoring and
melons, squash, etc).
PEANUT DISEASE alerts of late blight affecting
tomatoes and potatoes. This year,
ADVISORIES
the group worked with
This is the 14th year of SCONC?s Christopher Parker in the NCSU
partnership with Dr. Barbara Shew Masters of Geospatial Information
(NCSU Plant Pathology) to provide Science and Technology (MGIST)
routine advisories for two peanut program?s Capstone Experience to
foliar diseases: peanut leaf spot develop an interactive story map
and peanut sclerotinia. that highlights seven years of
From June through September, confirmed alerts across the
daily email alerts are sent for country.
review by Dr. Shew, who then Over the past year, there were 76
passes along guidance to her confirmed reports of late blight,
constituents across eastern NC which is an increase from 52
and southeastern VA. during the previous year. These
reports triggered 7,749 alerts sent
out to 370 unique phone numbers
This includes providing weather or email addresses. In addition, 35
information, technology support, new alert sites were added for a
and dispersion forecast guidance. total of 498 active sites as of May
SCONC continues to work with 15, 2018.
partners in NCSU Plant Pathology
to maintain the website and
forecasting tools.
There were 220 confirmed reports
of Cucurbit Downy Mildew (CDM)
this year, an increase from 163
reports during the previous year.
Example map output showinglocations
with elevated risk for Cucurbit Downy These reports triggered 23,512
Mildew outbreaks.
19THRIPS EXPOSURE FARM WATER NEEDS TOOL been developed to help users
GUIDANCE FOR COTTON understand what the tool is, how it
In a collaboration with Dr. Garry
works, and how to interpret the
GROWERS Grabow in the NCSU Department
output.
In collaboration with Dr. George of Biological and Agricultural
Kennedy and Thomas Chappell in Engineering, the Farm Water
the NCSU Entomology Needs Tool is a planning resource
Department, SCONC has to determine how much water
developed a Cotton Thrips from irrigation is needed to satisfy
Infestation Predictor tool for use crop water demand in addition to
by cotton growers and extension rainfall. The tool has been designed
agents in North Carolina and the to provide estimates of required
southeast US. farm pond storage and monthly
estimates of rainfall, runoff, and
Gridded temperature estimates
crop demand for users in North
from the Parameter?Elevation
Carolina. Several different gridded
PINEMAP
Regressions on Independent Pine Integrated Network: Education,
meteorological datasets were
Slopes Model (PRISM) were used Mitigation, and Adaptation Project
evaluated against raw
in conjunction with thrips dispersal
observations to determine which The USDA-funded PINEMAP
models developed by project
inputs were most accurate for project ended in February 2017
partners to develop risk estimates
North Carolina and should be used after six years of effort from a
for cotton growers. A series of
in the tool. team of more than 40 primary
dynamic infographics were
developed to convey these risk investigators at 13 institutions
estimates to users, with the ability across the southeast US, including
to save searches and download NC State University and the
content. SCONC. PINEMAP researchers
studied Loblolly pine genetics,
This website went live on April 1, management, and climate
2017, was used throughout the sensitivities, among other topics.
spring 2017 planting season, and SCONC provided the climate
received minor updates in winter science expertise and developed
2018. The tool has been positively Once a user has provided their the project?s key deliverable, the
received by growers across the input data, such as location, crop, PINEMAP Decision Support
southeast US and has been shared and planting date, the tool System (DSS,
extensively through the NC provides the user with an http://www.pinemapdss.org),
Cooperative Extension Cotton estimated farm pond storage which highlights future
portal. capacity or a notice that the crop climate-based risks and
water demand cannot be met from opportunities for foresters.
rainfall and irrigation in a typical
Since the end of the project, the
year. In addition, users are
USDA Southeast Regional Climate
provided several graphs that show
Hub (SERCH) has provided support
average rainfall and runoff as well
for the exploration and creation of
as how runoff and crop demand
new tools in the PINEMAP DSS. In
progresses throughout the year.
March 2018, a webinar was
Several instructional videos have
conducted by SCONC and SERCH
20for Cooperative Extension agents Sciences Geoscience Education collaborations or proposal
and southern foresters. This and Geocognition Laboratory, four discussions including the following
included a brief demonstration of publications related to the topics: 1) a climate-based risk
the DSS and a productive feedback PINEMAP DSS are in preparation assessment of non-native fish
session that highlighted several for the following peer-reviewed populations in Florida and the
key information needs, including journals: Weather, Climate, and broader southeast US, 2) potential
guidance on fire risk and pest risk. Society (two of the four), the shifts in the lightning-ignited fire
Work on creating such grids based Bulletin of the American season in the southeast US, 3) a
on future climate projections and Meteorological Society, and the study on the relationship between
historical climate data is ongoing, Journal of Usability Studies. climate and the production
with a tool showing the average dynamics of Brazil nut trees, 4) a
Over the past year, engagement
number of dry days in the spring climate-based decision support
has continued with PINEMAP
fire season expected to be system for New Zealand, and 5) a
project partners as well as external
completed and integrated into the climate-based decision support
project partners via presentations
DSS in summer 2018. system for a target audience of
and requests for weather and
wildlife and fisheries.
In collaboration with NCSU?s climate data. In addition,
Marine, Earth, and Atmospheric PINEMAP has led to several
Image: The_Gut, under CC2.0 license.
Support for USDA 1. Information Development and
ENVIRONMENTAL Applied Support for Extension:
MODELING Southeast Regional
Climate Hub Three applied climate documents
SCONC continues to produce were completed for forestry
routine experimental numerical Through a cooperative agreement
extension agents as well as forest
weather and dispersion forecast with USDA, SCONC is providing
and land managers:
guidance. These forecasts are technical, scientific, and extension
distributed to multiple agencies, expertise for the Southeast - A white paper on
including the National Weather Regional Climate Hub (SERCH). ?Southeast Drought
Service. Model output is included SERCH is focused on the extension Impacts and Forest
in SCONC?s Fire Weather Portal of climate science to support needs Management?,
and provides inputs to a series of and informed decision making on - A factsheet for USDA
agricultural products. Additionally, working lands in the southeast US, Forest Service Region 8 on
SCONC provides numerical including forests, rangelands, and ?Drought Impacts in the
guidance for cucurbit disease croplands. Southern Region?, and
forecasts and efforts with smoke - A paper on system drivers
Last year, SCONC provided
management. and stressors for the East
scientific and technical support to
Texas National Forests and
complete three primary tasks
Grassland Assessment.
described in this section.
21In addition, a review was effects on forest ecosystems, 3. Fire Weather Email Alerts:
performed on Chapter 3 of the agriculture, rangelands, and
SERCH is developing email alerts
Global Forest Expert Panels livestock with an emphasis on
that notify subscribers about
(GFEP) assessment on Forests and options for adapting management
wildfire risk and prescribed
Water, which highlights drivers strategies and planning processes.
burning suitability. The alerts are
and their pressures. Lastly, a With a target audience of land
calculated using the Keetch-Byram
webinar on ?Climate managers, foresters, extension
Drought Index (KBDI) and are
Considerations When Developing agents, and farmers, TACCIMO
being developed in coordination
Updated Seed Zones?was allows users to search, sort, and
with SCONC?s Fire Weather
presented in April 2017 as part of filter text quotations and figures
Intelligence Portal. Early user
the Eastern Seed Zone Forum's that are related to their areas of
engagement with the Southern
online lecture and discussion interest. To remain relevant and
Regional Forestry Extension group
hours. effectively inform land managers
was conducted to inform the
of the potential impacts of climate
2. Template for Assessing Climate subscription parameters. Technical
change on their natural resources,
Change Impactsand Management development is wrapping up and
the literature database that drives
Options(TACCIMO): user testing and rollout are
TACCIMO is being updated with
expected in the near future.
TACCIMO is a web-based tool findings from the most recent
containing peer-reviewed peer-reviewed research.
literature on climate change
22Climat e Support for Tools and
Decision Applicat ions
DROUGHT MONITORING & RESPONSE
SCONC is a member of the NC Drought Management Advisory Council
(NC DMAC), participating in weekly drought monitoring conference calls
and providing public presentations on drought in North Carolina. During
the weekly calls, SCONC provides information on recent precipitation
placed in a historical context, the current level of dryness as indicated by
drought indices generated by SCONC, and on-the-ground information
provided by citizen scientists as part of the CoCoRaHS Condition
Monitoring program. SCONC has facilitated easier decision making
among the NC DMAC by developing the capacity to draw drought
category boundaries on web-based map displays, which is frequently
used to communicate the council?s consensus to US Drought Monitor
authors. Through monthly climate summaries and blog posts, interviews
for print and broadcast news media, and presentations to community and SCONC scientistsparticipated in the NC
DMAC'sannual 2018 in-person meeting.
professional groups, SCONC provides frequent updates on drought
conditions and impacts, information about the climate drivers of drought,
and the NC DMAC monitoring process.
HIGH-RESOLUTION DROUGHT INDICES
SCONC continues to generate and publicly
provide several drought indices: the Standardized
Precipitation Index (SPI), the Standardized
Precipitation Evapotranspiration Index (SPEI), the
Keetch Byram Drought Index (KBDI), and percent
of normal precipitation. These indices are updated
daily using high-resolution data from the National
Weather Service and the PRISM Climate Group.
During the past year, SCONC continued to serve
these indices through tools on its websites geared
for monitoring drought and surface water
conditions, as well as provide grids and
supplemental information to researchers from
academia, state, and federal government. Grids
are used in weekly drought assessments in North
Carolina as part of the NC Drought Management
Gridded drought index (SPEI )indicatingdry conditionsin the
Advisory Council?s activities and across the US as
southwestern piedmont of NC duringSpringof 2016.
input into the US Drought Monitor. A manuscript
describing the SPEI?s calculation and evaluation for monitoring agricultural and hydrological drought is in
23FIRE WEATHER INTELLIGENCE PORTAL In addition, a SCONC undergraduate student has
explored various methods of estimating solar
In 2017, the Fire Weather Intelligence Portal ? a
radiation from the cloud cover observations available
real-time monitoring tool initially developed for the
at airport-based weather stations due to upcoming
NC Forest Service beginning in 2011 ? was expanded
changes to the National Fire Danger Rating System.
for states and users all across the southeast US with
These changes will require the availability of
funding from the USDA Southeast Regional Climate
station-based solar radiation data to calculate fire risk
Hub. Data from 13 states from Virginia through Texas
parameters. Comparisons between modeled and
is now available in the Portal, and the tool received a
observed solar radiation values at nearby stations in
back-end update to make data load more quickly and
North Carolina have highlighted the strengths and
to look and function more smoothly on mobile devices.
limitations of the existing estimation techniques.
The launch of the expanded Portal was announced via Further comparisons have been performed for Florida
a First Friday All Climate Change Talks webinar, a and Oklahoma in order to evaluate these estimates in
presentation and demonstration at the Association for the broader southeast US region.
Fire Ecology?s International Fire Ecology and
In an effort to provide better region-wide forecast
guidance, SCONC has also been generating several
gridded smoke and fire products based on the office?s
WRF model:
- Burning Category is based on ventilation rates,
and many southeastern states use this index
for prescribed burning guidance, with values of
1 indicating conditions are unsuitable for
burning and values of 5, which includes the
highest ventilation rates, often more suited for
burning.
- The Pasquill-Turner stability class uses surface
wind speed, solar radiation, and cloud cover to
Image credit: NC Forest Service assess atmospheric turbulence and, therefore,
Management Congress, and a webinar hosted by the the stability of the atmosphere. This index
Southern Fire Exchange and conducted by SCONC includes seven categories ranging from
and the Montgomery Community College Prescribed extremely unstable (A) to extremely stable (G).
Fire Training Center. - The Lavdas Atmospheric Dispersion Index,
based on mixing height and the Pasquill-Turner
As users across the region explored the Portal, it
stability class, assesses burning conditions
received an 28% increase in page views, from 33,802
based on how well the atmosphere will
last year to 43,183 this year. In the past year, this tool
transport smoke and particles. The index
received a total of 6,875 unique visitors ? a 14%
ranges from 0 to 100, where midrange values
increase from the previous year.
indicate good smoke dispersion and the ability
The NC Forest Service and SERCH have provided to control fires.
ongoing support for additional development and - LVORI estimates the likelihood of low visibility
engagement with the Fire Weather Intelligence Portal. due to smoke and is based on relative humidity
This has included the addition of new datasets such as and the atmospheric dispersion index. For this
US Drought Monitor boundaries and the DENSCA index, the number 1 represents the lowest
Index that can help inform fire monitoring and likelihood of low visibility while a 10 is the
management decisions. highest category.
24These gridded products will soon be tested and added
to the Fire Weather Intelligence Portal to provide
more useful tools to the southeastern fire community.
Calculated DENSCA Index ? a parameter that combinesseveral existingweather and fire danger indicesto
provide a single-number estimate of fire risk ? for the southeast US.
PRECIPITATION MONITORING
AND ALERTS
The NC Department of Transportation
(NCDOT) continues to support SCONC to
provide radar-based precipitation alerts
and monitoring tools for storm water
management. During the year, users
created 669 individual alert sites and 533
projects for monitoring rainfall. Overall,
there are 2,659 active alert sites for 1,901
projects as of May 15th, 2018. The NCDOT
user-base continues to grow as demands
for services increase. Over the past year,
185 new NCDOT user accounts were
created, compared to 166 requests for
new accounts in the previous year. Gridded precipitation acrossNorth Carolina, Heavier amountsin the
western piedmont and alongthe coast are indicated by warm colors,
25UNIFIED WATER DATA PROJECT
SCONC scientists are working with the NC Department of Environmental
Quality (DEQ) Division of Water Resources (DWR) to unify data from several
Climat e disparate DEQ datasets that are used to measure and determine the water
quality across North Carolina. These data will be combined with
Support for SCONC-housed water quantity and weather data in a web-based application
programming interface (API) service. This API will give DEQ/DWR staff and
Wat er stakeholders greater accessibility to weather and water data (both quantity
and quality), helping to meet regulatory, planning, and stakeholder needs.
Resources During the second year of the project, six in-person meetings were conducted
to learn about various water quality datasets (such as lakes and wetlands
data collected by DWR) and how they are used by basin planners and other
groups within DEQ and DWR.
INTEGRATED WATER PORTAL
SCONC continues to provide support for
the Integrated Water Portal (IWP). This
tool brings together water data from
several different agencies into a
map-driven data exploration and
visualization tool that allows users to
quickly explore regional and local water
conditions. The IWP incorporates current
and historical station-based water and
precipitation data with high-resolution
gridded products, such as precipitation
estimates from the National Weather
Service and drought indices produced by
SCONC. In 2017-2018, the IWP was
migrated to the new SCONC website and
updates were made to the back end to
increase longevity as well as make the
page?s style more consistent with SCONC?s
new website.
26NOAA Sout heast Regional
Climat e Cent er
UNC-Chapel Hill and NCSU were awarded the NOAA Southeast Regional Climate Center (SERCC) in
2007. Aspart of thispartnership, SCONC developsand maintainsthe SERCC?sweb servicesand online
climate tools. Additionally, SCONC supportsand maintainsthe Applied Climate Information System (ACIS),
which servesasthe climate database for all six NOAA Regional Climate Centers. Collaboratorsat UNC-CH
include CharlesKonrad, William Schmitz, Jordan McLeod, and Ashley Ward.
relationships between hospital (HHVT). The HHVT displays the
SERCC WEB TRAFFIC
emergency department (ED) expected number of hospital ED
The SERCC website received admissions data and local climate admissions per capita per 100,000
133,588 visits, a decrease of conditions with plans to help per degree day (as a percent
16.8% over the previous year improve early warning for public departure from the baseline)
(160,535). The largest number of health officials. Currently, this tool based on the observed and
visits in a single day was 1,618 on allows users to search for forecast heat indices, as well as on
January 7th, 2018. emergency department records models that were derived from
- 93.6% of all visits came based on primary and secondary relationships between past
from the United States diagnostics codes, dates and years admissions associated with heat
- Top 10 states by visits: FL of interest, and locations. Users illnesses across North Carolina. In
(16.3%), NC (14.6%), GA can also pull corresponding daily addition, shaded thresholds give
(9.8%), VA (4.6%), SC weather records (temperature, users a general idea of just how
(4.4%), TX (4.2%), CA maximum heat index, 18 UTC/1 severe the number of heat-related
(3.8%), NY (3.5%), AL pm EDT heat index, wind chill, hospital admissions is expected to
(2.6%), and PA (2.5%) precipitation, and antecedent be based on those heat indices.
weather periods), and generate
Website visits by source: While the previous year?s efforts
?reference periods?for ED
focused on embedding the HHVT
- 71.8%: Search engines admissions to help determine
within the Convergence of
(e.g., Google) when excess morbidity rates
Climate-Health Vulnerabilities
- 18.9%: Direct sources (e.g., occur. After initial data retrieval,
website
bookmarks, direct URL) the results can be aggregated over
(http://convergence.unc.edu),
- 7.7%: Non-search engine different temporal and spatial
efforts over this past year have
referral sites (e.g., articles) scales, and narrowed down by
moved toward the development of
- 1.5%: Social Media demographics, from which
an Early Warning System (EWS).
summary tables with basic counts
This EWS will ultimately utilize the
CLIMATE AND PUBLIC and per capita rates can be
underlying HHVT models to send
HEALTH generated.
alerts via text message or email
Effort over the past year focused Research stemming from the when the heat index is forecast to
on general maintenance of the Climate-Health Toolkit eventually reach or exceed a user?s specified
Climate-Health Toolkit, which led to the development of the vulnerability level.
allows researchers to explore the Heat-Health Vulnerability Tool
27In addition to the HHVT, a new black globe thermometer or risk categories will be shown on
tool is being developed for recent calculated with climate data. For the time series. Furthermore, the
and forecasted wet bulb globe this publicly accessible tool, tool will display the WBGT in the
temperature (WBGT). WBGT is gridded data was used to calculate sun and shade.
another measure of heat stress on hourly WBGT across North
The next steps of this tool include
the human body that is based on Carolina for three days into the
an expansion to the southeast US
natural wet bulb temperature past and future using methodology
and a spatial component in which
(evaporative potential), ambient air from the NWS in Tulsa, OK. The
maps of WBGT across the
(dry bulb temperature), and black prototype of this tool will include
southeast will be available to view.
globe temperature (radiant heat). an hourly time series of WBGT for
In addition, the WBGT values will
Unlike heat index, which only uses a user-defined location (latitude
be validated with black globe
temperature and relative humidity and longitude). With this
thermometer measurements from
to assess conditions in the shade, information, anyone can identify
ECONet sites across North
WBGT takes temperature, relative their potential for heat stress
Carolina in order to assess the
humidity, wind speed, and solar when preparing for outdoor
validity of the gridded WBGT
radiation into account in order to activities. Similar to the HHVT,
computations.
assess how the outdoor conditions shaded thresholds of the WBGT
in direct sunlight
will affect the
human body.
WBGT is directly
applicable to
numerous
situations and
populations, such
as outdoor
sporting events,
yard work, those
with outdoor jobs,
and military
personnel. This
value can be
measured with a
The Heat-Health
Vulnerability Tool is
accessible from the
Convergence website:
convergence.unc.edu.
28CLIMATE Weather Channel use Climate that location?s 30-year normal
Perspectives for communicating temperature throughout the
PERSPECTIVES
recent weather to a public entire year.
The Climate Perspectives tool audience. Additionally, state
accounts for 10.5% of all web offices such as SCONC often cite
traffic on the SERCC website., the Climate Perspectives tool in
including nearly 62% of traffic on monthly or seasonal climate
the most visited day. Weekly US summaries such as those in the
Drought Monitor authors and Climate Blog.
contributors from across the
country routinely use Climate Over the past year, a new feature
Perspectives in drought was developed called ?Similar Day
assessments. Nationally, local of Year?. This gives the user a
National Weather Service offices seasonal perspective for a given
and other groups such as the location, comparing the recent
Capital Weather Gang and The temperatures of a given period to
Screen capture showingClimate Perspective'sSimilar Day of Year (DOY) feature.
29website design in which current posts and CES news articles.
observations were placed on the
In January 2017, SCONC was
homepage and links to data
invited by NCCES to participate
retrieval resources were
in the Bertie County Partnership
Climate displayed more prominently.
Discussion in Greenville, NC. This
Support for Only about one-third of
respondents said they had
meeting brought together
scientists from NCSU and East
Cooperative received any weather and Carolina University, extension
Extension climate training, so they
requested instruction on basic
agents from NCCES and USDA,
and participants from the Town
topics such as soil moisture and of Windsor to discuss recurring
monitoring. Short videos were flooding in the town since
generally preferred as a Hurricane Floyd in 1999. SCONC
communication medium, so provided background on these
SCONC produced three videos heavy rain events and historical
EXTENSION ADVISORY about Soil Physical frequency, and a key action item
COMMITTEE Characteristics, Soil Moisture in that emerged was creating a
SCONC established a formal North Carolina, and and Soil more dense network of
collaboration with the North Moisture Measurements and precipitation observations in
Carolina Cooperative Extension Monitoring. These videos were Bertie County. This led SCONC to
Service (NCCES) over the past shared with the NCCES advisory connect NCCES with the RAIN
two years. As part of this committee to receive feedback Across the River program,
engagement effort, an advisory and will be finalized, published, funded by the Burroughs
committee was established to and shared publicly and with Wellcome Fund, to recruit
help steer interactions and extension agents in 2018. student CoCoRaHS observers in
priorities between SCONC and the county.
NCCES. In spring 2017, a
ONGOING AND NEW SCONC also continued to engage
web-based survey was filled out
PARTNERSHIPS
with NCSU researchers and
by 137 extension agents. This In 2017-18, SCONC continued to extension faculty on projects
served as a needs assessment provide several ongoing services with implications for NCCES and
that identified two key priorities: as part of engagement activities growers across the state. These
with NCCES: include providing weather inputs
While roughly half of
An RSS feed of recent posts from and an online framework for
respondents indicated that they
had used the SCONC website, NCSCO?s Climate Blog was peanut disease advisories, which
many suggested that it was developed in April 2014 and have been offered for the past
difficult to locate weather data continues to be shared on 14 years. SCONC has also
NCCES?s Extension Integrated partnered with Dr. Gina
and tools on the site. This
feedback informed key layout Pest Management website Fernandez (NCSU Horticulture)
changes to the new NCSCO alongside other external blog on projects to explore improved
30You can also read