Rising Temperatures, Worsening Ozone Pollution - Climate Change and Your health - Natural ...
←
→
Page content transcription
If your browser does not render page correctly, please read the page content below
Climate Change
        and Your Health

  Rising Temperatures,
Worsening Ozone Pollution
© June 2011
Union of Concerned Scientists
All rights reserved

The Union of Concerned Scientists is a nonprofit
partnership of scientists and citizens combining rigorous
scientific analysis, innovative policy development,
and effective citizen advocacy to achieve practical
environmental solutions. Established in 1969, we seek
to ensure that all people have clean air, energy, and
transportation, as well as food that is produced in a safe
and sustainable manner. We strive for a future that is
free from the threats of global warming and nuclear
war, and a planet that supports a rich diversity of life.
Sound science guides our efforts to secure changes in
government policy, corporate practices, and consumer
choices that will protect and improve the health of our
environment globally, nationally, and in communities
throughout the United States. In short, UCS seeks a
great change in humanity’s stewardship of the earth.

Photos: (top to bottom) © iStockphoto.com/Chris Rogers,
© iStockphoto.com/Catherine Yeulet, © iStockphoto.com/Brandon Clark,
© iStockphoto.com/Mike Clarke, © iStockphoto.com/amriphoto

Cover photos: (top, L to R) © Associated Press/Matt Slocum, © iStockphoto.com,
© JupiterImages; (bottom, L to R) © iStockphoto.com/Sandra L. Nicol, © iStockphoto.com/
Rebecca Grabill, © Thinkstock/John Howard

Climate Change
                                                                     and Your Health

                                                            CONTENTS

AUTHORS                                                     2   Executive Summary
Elizabeth Martin Perera is a public health expert
                                                            4   Introduction
with the Union of Concerned Scientists Climate &
Energy Program                                              5   Ozone Pollution and Climate Change—
Todd Sanford is a climate scientist with the Union 		           An Unhealthful Mix
of Concerned Scientists Climate & Energy Program
                                                            10 A Closer Look at Our Methods
CONTRIBUTORS                                                   and Assumptions
The analysis and production was conducted by a
large, interdisciplinary team within UCS including
                                                            12 Ozone Is Bad for Your Health
Climate Economist Rachel Cleetus, Climate & Energy          14 Analyzing the Impact of Climate
Outreach Director Nancy Cole, Climate Scientist and
                                                               Change on Ozone Pollution
Assistant Director of Climate Research and Analysis
Brenda Ekwurzel, Executive Director Kathleen Rest, 		       15 Health and Economic Impacts of
and Climate & Energy Legislative Director Lexi Shultz.         the Climate Penalty on Ozone Pollution
The report also benefited from internal reviews by
Kate Cell, Alden Meyer, and Suzanne Shaw.                   20 Where Do We Go from Here?

A c k no w l e d g m ent S                                  22 Endnotes
This report was made possible through the generous          24 References
support of Barr Foundation, The Energy Foundation,
and The Grantham Foundation for the Protection of
the Environment.

Dallas Burtraw (Resources for the Future), Katharine
Hayhoe (Texas Tech University and ATMOS Research
and Consulting), Kim Knowlton (Natural Resources
Defense Council and Columbia University), Jerome
Paulson (Children’s National Medical Center and George
Washington University), and Amanda Staudt (National
Wildlife Federation) provided valuable reviews of our
analysis, and Sarav Arunachalam (University of North
Carolina–Chapel Hill) reviewed the BenMAP modeling
methodology.

Organization affiliations are for identification purposes
only. The opinions expressed in this report are the sole
responsibility of the authors.
2 U n i o n o f C o n ce r n e d S c i e n t i sts
Executive Summary
M
illions of Americans suffer
© iStockphoto.com/Kim Gunkel
from the harmful effects of ground-level
ozone pollution, which exacerbates lung
diseases such as asthma and can cause
breathing difficulties even in healthy individuals. The
result is more time spent in hospital emergency rooms,
as well as additional sick days and even premature
deaths. These health impacts not only involve suffer-
ing; they are also costly, constituting a significant drag
on the U.S. economy. While power plants and cars are
among the main sources of ozone-forming pollutants
(the chemical precursors to ozone), ozone’s forma-
tion is dependent on temperature, among other condi-
tions. As a result, climate change has the potential to
increase ozone pollution—and its health and economic
burdens—across large parts of the country both now
and in the future.
This report from the Union of Concerned Scientists
combines projections of future climate-induced tempera-
ture increases with findings on the relationship between
ozone concentrations and temperature to illustrate
a potential “climate penalty on ozone.”1 This penalty
demonstrates how higher temperatures could increase
ozone pollution above current levels, assuming that emis-
sions of ozone-precursor pollutants remain constant.
We analyzed this climate penalty’s health conse-
quences expected in 2020 and 2050, including increases
in respiratory symptoms, hospital visits for the young
and old, lost school days, and premature mortality, for
most of the continental United States. We also projected
the economic costs of these health impacts in 2020.
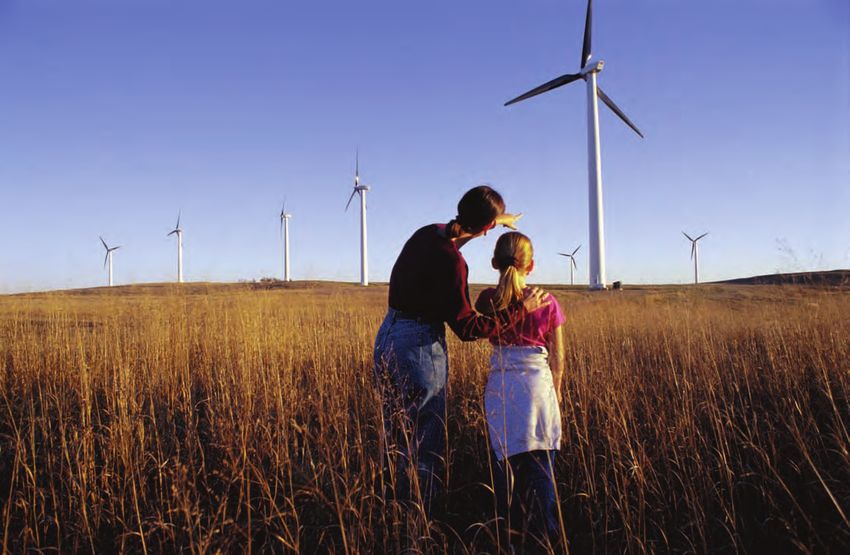
The quality of life for America’s children and their families is Key findings include:2
adversely affected when ozone pollution increases. Children who • Just nine years from now, in 2020, we estimate
miss school because they are experiencing or recovering from an that the continental United States could pay an
asthma attack may not only fall behind in their studies but also get
less exercise and lose time with friends (because they cannot play average of $5.4 billion (2008$) in health impact
outside when ozone levels are high). And for every child who goes costs associated with the climate penalty on ozone.
to the doctor or stays home from school, there is probably a • Higher ground-level ozone concentrations due to
worried parent who is stressed and missing work.
rising temperatures in 2020 could lead to an average
of 2.8 million more occurrences of acute respiratory
symptoms such as asthma attacks, shortness of
breath, coughing, wheezing, and chest tightness.
In 2050, that could rise to an average of 11.8 mil-
lion additional occurrences.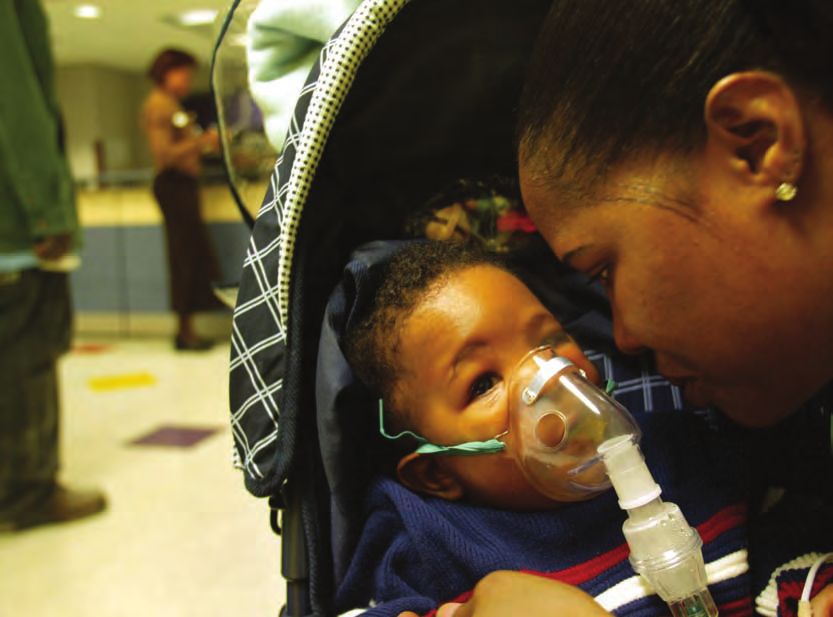
C l i m ate C h a n g e a n d Yo u r He a lt h                           3

• The climate penalty on ozone could lead to an average                                           penalty on ozone. California may experience the
  of 944,000 more missed school days in 2020. In                                                  greatest health impacts, with an estimated average of
  2050, that could rise to an average of 4.1 million                                              $729 million in 2020 alone.
  additional missed school days.
• Higher ozone concentrations due to rising temper-                                               The findings of this report illustrate yet another reason
  atures could lead to an average of 3,700 more seniors                                       why we must take action to address climate change
  and 1,400 more infants hospitalized for respiratory-                                        without delay—and why our inaction to date will lead
  related problems in 2020. In 2050, that could rise                                          directly to real costs within this decade. To make our
  to 24,000 more seniors and 5,700 more infants                                               air cleaner, the U.S. Environmental Protection Agency
  hospitalized.                                                                               (EPA) must strengthen its current standards for ozone
• Many states and counties that are already struggling                                        and ozone-forming pollutants that come from power
  to control ozone pollution will have to work even                                           plants, industry, and vehicles. But in the face of a
  harder to maintain healthy air quality in a warming                                         rapidly warming world, these efforts alone will not be
  climate.                                                                                    sufficient—we also need new strategies to reduce the
•	California and states in the Midwest and the Mid-                                           pollution that causes climate change.
  Atlantic could be hit especially hard by the climate

               Climate change has the potential to increase ozone
          pollution—and its health and economic burdens—across
             large parts of the country both now and in the future.
                                                          © iStockphoto.com/Sandra L. Nicol

                                                                                                                                                              © iStockphoto.com/Lisa F. Young
4   U n i o n o f C o n ce r n e d S c i e n t i sts

               Introduction

               M
                                 illions of Americans suffer                             Here’s the connection: warmer temperatures affect
                                 from the harmful effects of ground-level            ground-level ozone. Ground-level ozone is formed
                                 ozone pollution—be they children                    when a complex set of chemical reactions is triggered
                                 too sick to go to school, high school               by heat and sunlight3 (Figure 1). That’s why we hear
               football players not allowed to practice outdoors in                  warnings of “bad air days” due to ozone pollution most
               the summer, 65-year-olds with lung disease unable to                  often during the summer and on cloud-free days. Hot-
               take a walk in the park, or farmers at risk when they                 ter temperatures in a changing climate mean that ozone
               harvest their fields. Not only does ozone pollution cause             concentrations are likely to rise over most of the United
               a number of serious breathing problems, and therefore                 States (Jacob and Winner 2009 and references therein),
               a great deal of suffering, it also is damaging in mone-               possibly offsetting some of the gains we have made
               tary terms. Whether tallying up the dollars lost to                   in driving down the pollutants that form ozone (Wu
               sick days or the high costs of emergency room visits,                 et al. 2008).
               ozone pollution is expensive.                                             This report explores how such a phenomenon may
                  And now health professionals have an additional                    occur in many regions of the United States. We model
               ozone pollution concern: climate change. Temperatures                 the potential health consequences and costs in 2020 that
               in the United States have already risen more than two                 would be associated with a climate-induced increase
               degrees Fahrenheit (°F) (1.1 degrees Celsius) over the                in ozone pollution. We also model the health impacts
               past century, largely because of an excess of heat-                   that could occur in 2050.4 Our results show that as
               trapping gases, especially carbon dioxide, in the                     we continue to work to reduce ozone pollution and
               atmosphere. Temperatures are likely to keep rising,                   its health effects in the future, we cannot ignore the
               certainly throughout the next few decades and likely                  consequences of ever-increasing temperatures.
               much longer (Karl, Melillo, and Peterson 2009).

               Figure 1. Illustration of Ground-Level Ozone Formation

                                                                                                                     “Bad” ozone can be
                                                                                        VO            NO             distinguished from
                                                                  VOC                        C           x           “good” ozone, which is
                                                                               NOx                                   present at high altitudes
                                                                                                                     in the atmosphere and
                                                       VOC                                                           beneficial because it
                                                                                                     VO

                                            NOx                                             NO                       protects the earth from
                                                                                                        C

                                                                                                                     excessive ultraviolet
                                                                                                 x
                                           OZONE
                                                                                                                     radiation. But bad, or
                                                                                                                     ground-level, ozone—
                                                                                                                     the primary component
                                                                                                                     of smog—is harmful to
                                                                                        C

                   NOx + VOC + Heat & Sunlight = Ozone                                                               health. Human activities
                                                                                     VO

                   Ground-level or “bad” ozone is not emitted directly                                               such as driving cars and
                   into the air, but is created by chemical reactions                                                generating electricity

                                                                            NO
                                                                                 x                                   are major sources of
                   between NOx and VOCs in the presence
                                                                                                                     the ingredients that
                   of heat and sunlight.                                                                             form smog.5
                                                                                                  Emissions from
                                                                                industrial facilities and electric
                                                                             utilities, motor vehicles, gasoline,
                                                                        and chemical solvents are some of the
                                                                 major sources of oxides of nitrogen (NOx) and
                                                                          volatile organic compounds (VOCs).

               Source: Adapted from EPA 2010.
C l i m ate C h a n g e a n d Yo u r He a lt h   5

Ozone Pollution and Climate
Change—An Unhealthful Mix

W
                hen weather forecasters                          heat and sunlight. Some of the major human-made
                warn about poor air quality or “bad air          sources of these precursor emissions are power plants,
                days” and report an associated color             vehicles, and industrial processes.
                to indicate healthy or unhealthy air                Reductions in NOx and VOCs—the primary ingre-
(Figure 2), they are usually referring to the level of           dients in ozone formation—decrease ozone pollution.
smog—a hazardous mixture of air pollutants that affect           Thanks in large part to the Clean Air Act, the U.S.
the health and quality of life of children and adults alike.     Environmental Protection Agency (EPA) reports that
                                                                 a 48 percent decrease nationally in estimated NOx emis-
The Role of Ozone Precursor Pollutants                           sions and a 57 percent decrease in VOC emissions
Ground-level ozone—the primary component of                      occurred between 1980 and 2009. Average ozone levels
smog—is formed when oxides of nitrogen (NOx) and                 have also declined steadily, dropping 30 percent in
volatile organic compounds (VOCs), which are “pre-               this same time period (EPA 2011a). The EPA estimates
cursor emissions,” chemically react in the presence of           that emissions of NOx will continue to decline and

Figure 2. Air Quality Index Warning System
                                                                                                           The Air Quality Index
  Air Quality Index         Health Impacts                                                                 (AQI) is a simple color-
                                                                                                           coded warning system
                                                                                                           that alerts the public
  Good                      No health impacts are expected when air quality
                                                                                                           when air pollutants
  (0–50)                    is in this range.                                                              reach unhealthy levels
                                                                                                           in a local area. Yellow,
  Moderate                  Unusually sensitive people should consider limiting                            for example, means
  (51–100)                  prolonged outdoor exertion.                                                    “moderate” air quality
                                                                                                           conditions and red means
                                                                                                           “unhealthy” conditions.
  Unhealthy for             The following groups should limit prolonged outdoor exertion:
                                                                                                           An AQI value of 100
  Sensitive Groups               • People with lung disease, such as asthma                                usually corresponds to the
  (101–150)                      • Children and older adults                                               current ozone standard
                                 • People who are active outdoors                                          established by the EPA—
                                                                                                           so as the standard changes,
                                                                                                           the ozone concentration
  Unhealthy                 The following groups should avoid prolonged outdoor exertion:                  corresponding to an AQI
  (151–200)                      • People with lung disease, such as asthma                                of 100 will change. Air
                                                                                                           quality may be reported
                                 • Children and older adults
                                                                                                           in a newspaper’s weather
                                 • People who are active outdoors                                          section or on radio or
                            Everyone else should limit prolonged outdoor exertion.                         television, particularly
                                                                                                           when conditions are
                                                                                                           problematic. (See the
  Very Unhealthy            The following groups should avoid all outdoor exertion:
                                                                                                           EPA’s AIRNow website
  (201–300)                      • People with lung disease, such as asthma                                [www.airnow.gov] for
                                 • Children and older adults                                               daily ozone forecasts
                                 • People who are active outdoors                                          and real-time ozone
                                                                                                           conditions.)
                            Everyone else should limit outdoor exertion.
Source: Adapted from EPA 2011.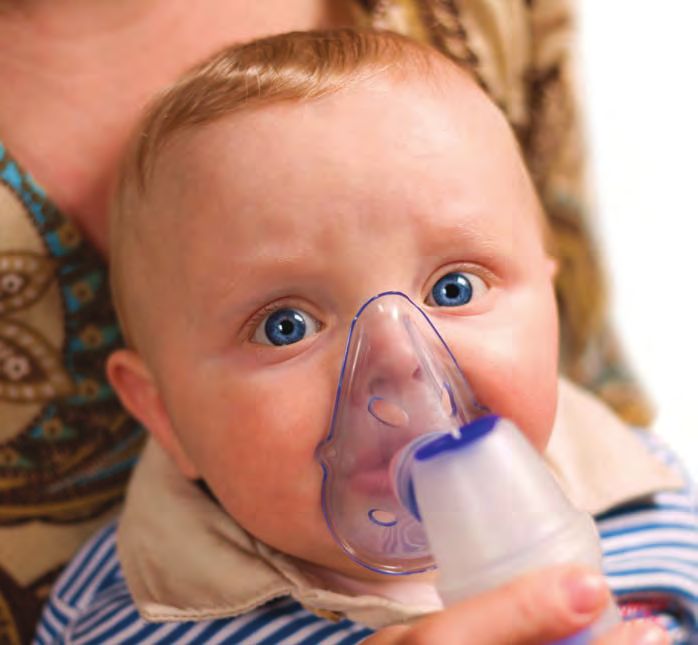
6   U n i o n o f C o n ce r n e d S c i e n t i sts

                         322 state counties across the country (out of the 675 counties
                 monitored) do not meet the current standard for safe levels of ozone,
              including counties with many of the nation’s largest cities. Nearly half of
                  Americans live in areas with “unhealthful” levels of ozone pollution.

               could decrease by 26 percent between 2010 and                trations must not show a trend of exceeding 75 ppb
               2020, depending on implementation of reduction               (averaged over 8 hours) over a three-year period.7
               standards. Reductions in VOC emissions are expected             However, the unanimous recommendation of
               to essentially level off, declining only 3 percent between   an independent scientific advisory panel convened in
               2010 and 2020 (EPA 2011b).                                   2008 to advise the EPA concluded that the ozone stan-
                                                                            dard should be strengthened to a range of 60 to 70 ppb
               The Importance of Ozone Standards                            (Henderson 2008) to protect the health of children,
               Further declines in these emissions depend on the EPA’s      older adults, outdoor workers, and people with asthma
               pollution standards becoming stronger in the future          and other lung diseases.8 The current World Health
               and on the continued success of emissions reduction          Organization recommendation, for example, is even
               efforts—by the EPA, the states, and others.6 National        stronger—at 50 ppb.9
               averages, however, mask significant local and regional          The EPA is currently revising its standard in response
               “hot spots” of ozone pollution, especially in urban areas.   to court challenges that the agency take into account
               Cities such as Los Angeles, Baltimore, Washington,           the latest scientific information on the health impacts
               DC, Chicago, Boston, Dallas, and Philadelphia are            of ozone; it is expected that a new rule will be proposed
               among those that have been designated “out of com-           in July 2011.10
               pliance” with (that is, in non-attainment of ) the EPA’s        Meanwhile, 322 counties (out of the 675 counties
               current ozone standards.                                     monitored) in many states across the country do not
                   The EPA sets standards for permissible levels of         meet the current standard for safe levels of ozone, as
               ground-level ozone pollution in terms of its concentra-      represented in Figure 3. Because these counties include
               tion in outdoor air, reported in the units of parts          many of the nation’s largest cities, nearly half of Amer-
               per billion (ppb). The current EPA ozone standard,           icans (48.2 percent) live in areas with “unhealthful”
               set in 2008, mandates that summertime ozone concen-          levels of ozone pollution (ALA 2011).11

      Figure 3. States with Counties that Violate the Current EPA Ozone Standard

                                                                                                          The shaded states
                                                                                                          contain counties that
                                                                                                          violate the current ozone
                                                                                                          standard of 75 parts per
                                                                                                          billion set by the EPA in
                                                                                                          2008—a standard that
                                                                                                          is already recognized
                                                                                                          as too weak to protect
                                                                                                          our health. In a warmer
                                                                                                          world, more counties
                                                                                                          in additional states
                                                                                                          could fail to meet the
                                                                                                          standard, unless they
                                                                                                          substantially reduce
             Source: Based on EPA 2010.                                                                   emissions of NOx and
                                                                                                          VOCs (the chemical
                                                                                                          precursors to ozone).
C l i m ate C h a n g e a n d Yo u r He a lt h   7

Figure 4. Ozone Pollution Worsens as Daily Temperatures Increase

                                                                                                               These two graphs show
                                                                                                               a strong positive correlation
                            240                                                                                between temperature
                                       New York City, NY
Daily Maximum Ozone (ppb)

                                                                                                               (horizontal axis) and ozone
                            210                                                                                levels (vertical axis) in New
                                                                                                               York City and Nashua, NH.
                            180                                                                                Based on observed data
                                                                                                               from New York City for May
                            150                                                                                to October (“smog season,”
                                                                                                               averaging period not
                            120                                                                                specified) for the years
                                                                                                               1988 to 1990, and observed
                             90                                                                                data (using a one-hour
                                                                                                               average) from Nashua, NH,
                             60                                                                                for the years 2005 to 2010,
                                                                                                               both scatter plots show that
                             30                                                                                the higher the temperature,
                                                                                                               the higher the ozone level,
                              0                                                                                regardless of a city’s size.
                                  32      50        59       68      77        86           95           104   Climate change is projected
                                                    Daily Maximum Temperature (˚F)                             to bring higher average
                                                                                                               temperatures over this
                                                                                                               century, which could
                                                                                                               increase the occurrence
                            100                                                                                of elevated ozone
                                                                                                               concentrations.
                                       Nashua, NH
Daily Maximum Ozone (ppb)

                            80

                            60

                            40

                            20

                             0
                                  40       50        60        70         80           90          100
                                                    Daily Maximum Temperature (˚F)

Sources: NAST 2001 (NYC); New Hampshire Department of Environmental Services 2011.

Higher Temperatures Could Make Ozone                                              Ozone pollution tends to be most severe in urban
Pollution Worse                                                                areas, where vehicular and industrial emissions cluster
The strong positive relationship between high tem-                             and where the temperatures are often higher than
peratures and ozone formation is well established                              in surrounding suburbs. However, unhealthful ozone
(Jacob and Winner 2009). This relationship has been                            levels can also be found in suburban and rural areas
shown both in large cities such as New York City and                           downwind of cities (Logan 1989). Also, precursor emis-
in smaller cities such as Nashua, NH (Figure 4). In                            sions from power plants are often carried hundreds
addition to enabling the basic chemical reactions that                         of miles over large areas of the country. For example,
create ground-level ozone, high temperatures often                             some pollution from power plants in the Midwest
create stagnant air conditions that cause ozone pollu-                         may be transported by prevailing winds to the eastern
tion to settle over an area and remain for a longer time,                      United States. In addition to harming health, ozone
which in turn increases the potential for human expo-                          pollution in rural areas negatively affects agriculture
sure to harmful ozone concentrations (Leibensperger                            and vegetation, such as by decreasing soybean yields
et al. 2008).                                                                  (Fishman et al. 2010).
8   U n i o n o f C o n ce r n e d S c i e n t i sts

Figure 5. Present-Day and Projected Temperature Increases
for the United States*
Present day (1993–2008)                                               Near term (2010–2029)                        Projected temperature
                                                                                                                   increases for the United
                                                                                                                   States are based on a
                                                                                                                   combination of global
                                                                                                                   climate models. In less than
                                                                                                                   10 years, largely because
                                                   ~2000                                                 ~2020
                                                                                                                   of the energy choices the
                                                                                                                   world has already made,
                                                                                                                   much of the country is likely
                                                                                                                   to see temperature increases
                                                                                                                   of an additional 1 to 2ºF
                                                                                                                   by 2020—on average about
                                                                                                                   half the increase we have
                                                                                                                   experienced in the last
                                                                                                                   century. However, the
                                                                                                                   emissions choices made
                                                                                                                   today can still make a
                                                                                                                   difference in how much
                                                                                                                   warming we expect to
                                                                                                                   see in future decades,
Mid-century (lower-emissions scenario)                                Mid-century (higher-emissions scenario)      as demonstrated by the
                                                                                                                   difference between the
                                                                                                                   lower- and higher-emissions
                                                                                                                   scenarios at mid-century
                                                                                                                   (2040–2049) and the end of
                                                                                                                   the century (2080–2099).12
                                                   ~2050
                                                                                                         ~2050

End of century (lower-emissions scenario)                             End of century (higher-emissions scenario)

                                                 ~2090
                                                                                                          ~2090

                                                                                     (°F)
                              1    2    3    4     5     6   7    8     9   10 >10

*All present-day and projected temperature changes are in ºF and in reference to a 1961–1979 baseline.
Source: Adapted from Karl, Melillo, and Peterson 2009.
C l i m ate C h a n g e a n d Yo u r He a lt h 9
While recent research shows that current ozone standards need to
be stronger to protect health, higher temperatures in a warmer world
will make the job of maintaining healthy air ever more difficult.
Given the strong dependence of ozone formation What this means is that climate change is likely to
on temperature, a changing climate can make ozone complicate the challenge of reducing ozone pollution.
pollution worse. As temperatures increase in a warmer Although emissions of ozone-forming pollutants are
world, days that are conducive to ozone formation are currently declining, temperature increases associated
likely to be more frequent (see the technical appendix with climate change are likely to work against this
online). Temperatures in the United States have already trend. As a result, even to maintain today’s ozone levels
increased more than 2°F over the past century because may require a greater reduction in precursor emis-
of human-caused emissions of carbon dioxide and other sions. Also, there could be a positive-feedback effect;
heat-trapping gases. The amount of warming we will because increasing temperatures would correspond to
see later this century depends heavily on the amount greater electricity demand for air conditioning during
of heat-trapping gases we emit today. If the world’s hot summer months, emissions of ozone-forming pol-
emissions rise at the current pace, parts of the United lutants from fossil-fuel power plants would probably
States are projected to warm another 7 to 11°F (3.9 to increase further. States and counties trying to control
6.1°C) by the end of the century (Karl, Melillo, and ozone pollution and its accompanying health problems
Peterson 2009). Even if emissions of all heat-trapping thus face a challenging situation: while recent research
gases were to stop immediately, warming would still be shows that current ozone standards need to be stronger
“locked in” for years afterward because carbon dioxide to protect health, higher temperatures in a warmer
resides in the atmosphere a very long time. As such, world will make the job of maintaining healthy air ever
temperatures will remain elevated for at least the next more difficult.
decade and possibly longer (Armour and Roe 2011;
Gillett et al. 2011; Solomon et al. 2009).
Poor air quality puts
large numbers of people
at risk for respiratory
ailments such as asthma,
chronic bronchitis, and
emphysema. Today, one
in four children in Harlem
suffers from asthma
(Nicholas et al. 2005). On
days with poor air quality,
which could increase in
a warmer world, both
children and adults
are more likely to have
difficulty breathing, and
people with asthma may
require a visit to the
emergency room.
© James Estrin/New York Times/Redux10 U n i o n o f C o n ce r n e d S c i e n t i sts
A Closer Look at Our Methods and Assumptions
F our key steps are involved in this report’s analyses
of a) the effect that a warmer world could have
on ozone pollution and b) the associated health and
economic impacts across much of the United States
(more detail on all of these steps can be found in the
technical appendix online):
1. Deriving a Climate Penalty Factor for the
United States
We surveyed the published studies to pick a “climate
penalty factor,” reviewing both measured data and model
projections pertinent to the relationship between tem-
© iStockphoto.com
perature and ozone (Bloomer et al. 2009; Jacob and
Winner 2008 [and references therein]; Steiner et al. 2006;
Taha 2001). Selection of the climate penalty factor was
weighted toward a study based on more than two A bad air day in Los Angeles, CA.
decades of observed data from nearly half of the conti-
nental United States (Bloomer et al. 2009). The terms We also did not factor into our analysis the fact that
“climate penalty factor” and “climate change penalty,” some areas of the country (such as California, the
specifically mentioned in some of these published Midwest, and the Northeast) could see higher average
studies, were used to describe the increase in ground- climate penalty factors, which would mean even greater
level ozone associated with a given increase in tempera- effects on the health impacts in these places than we
ture and also the additional reductions in precursor report. Finally, we did our modeling using average
emissions needed to meet a desired ozone level due increases in ozone levels, but in some regions climate
to the effects of climate change (Bloomer et al. 2009; change is expected to increase the number of ozone-
Wu et al. 2008). caused “bad air days” as well as to increase the number
A key simplifying assumption was the choice of a of peak pollution episodes more drastically than the
single climate penalty factor—of 1.2 ppb/°F—to apply average levels (Wu et al. 2008; Bell et al. 2004). This could
equally across most of the nation. The current state even further increase the associated health effects
of research shows that there is regional variation in beyond what the climate penalty indicates.
climate penalty factors—for example, some studies of
the Los Angeles Basin show that its urban areas could 2. Estimating Temperature Changes in 2020
experience penalty factors greater than 4 ppb/°F (Taha and 2050
2001). More research is needed to develop robust We used future projections of temperature for two
regional climate penalty factors that would yield more different climate scenarios—a lower-emissions and a
accurate national numbers. For certain areas, other higher-emissions scenario, based on information adapted
associated climate consequences (such as changes in from the U.S. Global Change Research Program (Karl,
vegetation emissions and ventilation processes) could Melillo, and Peterson 2009)—to determine the most
offset the climate penalty (EPA 2009; Wu et al. 2008). likely range for U.S. average temperature increases in
Currently, studies are inconclusive as to whether ozone the years 2020 and 2050. The projections for tempera-
will increase with climate change in the Southeast ture change in the USGCRP report are specified in rela-
and coastal Northwest in particular. Therefore we have tion to a 1961 to 1979 baseline, and we scaled them to
excluded eight states from our analysis (Florida, Georgia, show changes in temperature relative to the present
South Carolina, Alabama, Mississippi, Louisiana, Oregon, (Figure 5).17
and Washington).C l i m ate C h a n g e a n d Yo u r He a lt h 11
The increases in U.S. average temperatures expected future. Also note that BenMAP is not able to directly
in the two decades centered around 2020 are roughly model air quality; we used monitored air quality data
1 to 2°F higher than what they are today. The higher- for 2007 that is embedded in the model, and we imposed
emissions scenario leads to a likely increase of 3 to the climate penalty on top of those measurements.
5.5°F for the two decades centered around 2050, while A major simplifying assumption we made in our
a lower-emissions scenario leads to an increase of 2 to analysis was to hold emissions of ozone precursors
4°F over the same period. (such as NOx and VOCs) constant at 2007 levels and
only vary the climate-induced ozone penalty. This
3. Determining the Climate Penalty on Ozone followed the convention in the published studies and
To derive the climate penalty on ozone (projected allowed us to isolate the impact of the climate penalty
future increases in ozone concentrations), we simply from other factors affecting ozone pollution. EPA data
multiplied the likely temperature projections from the show that, in fact, U.S. emissions of NOx and anthro-
USGCRP report by the climate penalty factor to deter- pogenic VOCs have been declining over time, driven
mine what levels of increased ground-level ozone by provisions of the Clean Air Act, among other fac-
could be estimated to occur in the years 2020 and tors.20 These trends are expected to continue, but
2050 (Table 1). These calculated values ranged from their relative magnitude depends on the success of
increases in ground-level ozone of 1 to 2 ppb in 2020 to EPA regulations.
2 to 7 ppb in 2050. These values reflected the range in More details on the BenMAP model and how we
temperatures associated with different future climate used it can be found in the technical appendix online.
scenarios, but they did not account for the ranges of
climate penalties found in published studies.
4. Running the BenMAP Model
We analyzed the human health impacts of these increases
in ground-level ozone due to the climate penalty for
the years 2020 and 2050, utilizing the EPA’s BenMAP
model; we used the upper and lower ends of the indi-
cated ranges. The model applies information from
published epidemiological studies and population
projections to estimate the health effects at national,
regional, state, and county levels. For our analysis, we
focused on national and state data for five categories
© JupiterImages
of impacts: premature mortality, respiratory-related
hospital admissions for infants and seniors, asthma-re-
lated emergency room visits, occurrences of acute re- This report focuses on national and state data for
spiratory symptoms (minor restricted-activities days), five categories of health impacts: premature mortality,
respiratory-related hospital admissions for infants
and lost school days. The model cannot accurately
and seniors, asthma-related emergency room visits,
project cost estimates in 2050 because it does not in- occurrences of acute respiratory symptoms, and
clude an income adjustment factor that far out into the lost school days.
While we must limit our heat-trapping emissions in order to lower mid-
century temperature increases, temperatures will likely continue to rise for
the next decade or two. Therefore, the best near-term option for protecting
health is to significantly lower the pollutants that form ground-level ozone.12 U n i o n o f C o n ce r n e d S c i e n t i sts
Ozone Is Bad for Your Health
G
round-level ozone, the primary the doctor’s office and hospital emer-
component of smog, irritates gency room and lead to more lost work
© iStockphoto.com/Chris Rogers
the lungs’ mucous membranes and school days (Ito, De Leon, and
and other tissues, thereby compro- Lippman 2005).
mising a person’s ability to breathe
(Figure 6). Exposure to an increase in Bearing the Brunt of Ozone
ozone concentrations18 on the order of Pollution
10 ppb—beyond an already elevated Ozone is one of the most widespread
background level—is associated with and dangerous air pollutants. Nearly 37
increased hospital admissions for pneu- million children aged 18 and under and Infants and children are particularly
monia, asthma, allergic rhinitis, and more than 17.4 million adults aged 65 vulnerable to air pollution because
other respiratory diseases, as well as and over live in counties with unhealth- their lungs are still growing and devel-
with premature death. By exacerbating ful ozone levels (ALA 2011). While ozone oping (Committee on Environmental
respiratory problems, higher ozone is bad for nearly everyone, some groups Health 2004). When children’s small air-
pollution levels send more people to are more susceptible than others. ways are irritated or swollen, it’s simply
harder and more painful for them to
breathe (Thurston et al.1997). They also
Figure 6. How Ozone Affects the Human Body have rapid breathing rates, which in-
creases their exposure to inhaled ozone.
Parents with young athletes need to
Burning eyes, throat;
Headache irritated mucous be especially aware of bad air days. Ac-
membranes cording to one study, children playing
three or more team sports in communi-
Shortness of breath, ties with high daytime ozone concen-
wheezing, coughing trations were approximately three times
more likely to develop asthma than
children playing no sports (McConnell
Asthma attacks, chest et al. 2002).
pain when inhaling,
increased risk of
respiratory diseases
Pulmonary
© iStockphoto.com/Catherine Yeulet
inflammation
Source: Adapted
from Schoof 2010.
Adults aged 65 years or older are
People who do not suffer from lung conditions often fail to appreciate
what they feel like, how dangerous they are, and why the quality of at excess risk of ozone-related hospi-
life for the sufferer can be compromised. This is what breathing ozone talization or death (Delfino, Murphy-
can feel like if you have a lung condition: you may find it difficult to
Moulton, and Becklake 1998). As the
breathe deeply and vigorously; you may be short of breath and be in
pain when taking a deep breath; you may cough, wheeze, and have large demographic bulge of the “baby
a chronically sore or scratchy throat; and your asthma attacks may boomers”—estimated at 79 million
become more frequent. Inside your body, repeated ozone exposures
may inflame and damage your lung lining and make the lungs more
Americans—moves into this age cate-
susceptible to infection. gory over the next two to three decades,C l i m ate C h a n g e a n d Yo u r He a lt h 13
air-pollution-related health effects can active outdoor workers—lifeguards, in for health and lost productivity related
be expected to substantially increase this case—had greater obstruction in to asthma are estimated to top $20 bil-
(Haaga 2002). their airways when ozone levels were lion every year (NIH 2009).
high (Thaller 2008). Chronic lung disease. Conditions
such as chronic obstructive pulmonary
disease (COPD)—a long-lasting obstruc-
tion of the airways—can be exacerbat-
© iStockphoto.com/Brandon Clark
ed by even small increases in elevated
ozone levels (e.g., an increment of 10 ppb),
© iStockphoto.com/amriphoto
with a corresponding effect on public
health and health care costs (ALA
2007). COPD includes emphysema,
which reduces the ability of the lungs
to expel air. A person with emphysema
Given their limited access to health-
may feel shortness of breath during ex-
care resources, low-income and some Healthy people also exhibit a small ertion and, as the disease progresses,
minority groups tend to suffer greater but significant decrease in lung func- even while at rest. COPD also includes
impacts when exposed to ozone pol- tion following a prolonged exposure to chronic bronchitis, which is an inflam-
lution. Socioeconomic status is an im- ozone levels as low as 60 ppb during mation of the bronchial tubes that
portant determinant of differences in mild exercise (Kim et al. 2010). bring air into the lungs; the condition
asthma prevalence and severity among
makes breathing difficult and causes
ethnic minorities in the United States The Health Conditions Affected chest congestion and a bad cough.
(Forno and Celedon 2009).19 The large
by Ozone Pollution These respiratory diseases are preva-
majority of children in this country Many Americans who live with chronic lent in the United States. Nearly 4.8 mil-
without any health insurance coverage respiratory and other diseases are af- lion people with chronic bronchitis and
live in families that fall below the pov- fected by ozone pollution, sometimes nearly 2.3 million with emphysema live
erty line. Further, very young children, fatally. For example: in counties with unhealthful ozone
poor children, and children from Span- Asthma. Ozone pollution does not levels (ALA 2011).
ish-speaking families appear to be at cause asthma, but it exacerbates the Premature death. Because of its
particularly high risk for inadequate condition’s effects by causing the pa- serious effects on human health, ozone
asthma therapy—e.g., the use of inhal- tient’s lung tissues and airways to be- is also associated with premature
ers (Halterman et al. 2000). come red, swollen, and constricted deaths, particularly among vulnerable
(Cody et al. 1992). At present some 3.2 populations and even more particular-
million children and more than 9.5 mil- ly among those with respiratory and
lion adults with asthma live in parts of heart problems. As with chronic lung
the United States with very high ozone disease exacerbations, even a small in-
© iStockphoto.com/Mike Clarke
levels in 2011 (ALA 2011). The preva- crease in the previous week’s average
lence of asthma has been increasing ozone level has substantial effects on
since the early 1980s across all age and death rates. One study, which used
racial groups and both genders (Pleis et data from 95 large U.S. urban commu-
al. 2009). Asthma is the third-ranking nities to estimate a national average of
cause of hospitalization among chil- mortality associated with short-term
Outdoor workers such as lifeguards, dren under 15 (DeFrances, Cullen, and exposure to elevated ozone levels,
police officers, construction workers, Kozak 2007). Asthmatic children using showed that a small (10 ppb) increase
and farmers are likewise susceptible. inhalers are vulnerable even to very in ozone pollution was associated with
One study found that farmers who low levels of ozone—exposure to levels a 0.52 percent increase in deaths per
spend most of the day outside when of 50 ppb (33 percent less than the cur- day. This study found that an estimated
ozone levels are high suffer reduced rent “safe” level) has been associated 3,700 deaths annually could be attrib-
lung function that persists for a couple with increased shortness of breath and uted to this small increase in daily
of days (Brauer and Brook 1997). An- the need for rescue medication (Gent, ozone levels (Bell et al. 2004).
other study found that healthy and Triche, and Holford 2003). Expenditures14 U n i o n o f C o n ce r n e d S c i e n t i sts
Analyzing the Impact of Climate
Change on Ozone Pollution
O
zone pollution is projected climate alone; ozone precursor emissions were held
to get worse with future warming. But how constant at 2007 levels.
much worse might it be in a world of We then used published projections of temperature
increasing temperatures? And what would for two different climate scenarios (a lower-emissions
be the implications for the health of our families and and a higher-emissions scenario) to determine a likely
our pocketbooks? This report seeks to address these range for increases in temperature in the United States
questions by drawing on well-established scientific for the years 2020 and 2050. We combined the climate
literature as well as by conducting a new modeling penalty factor with the temperature projections to
analysis of health impacts and related costs. determine a range for the potential changes in ozone
concentration levels—a range called the “climate pen-
Our Approach alty on ozone”—for the two climate scenarios in both
This report takes a multidisciplinary approach in evalu- 2020 and 2050.13
ating the potentially serious consequences of climate Finally, we put those increases in ozone concentra-
change for ozone pollution and human health in 2020 tion into a health model (the Environmental Benefits
and 2050. We first surveyed published studies on the Mapping model, or BenMAP14) that estimates changes
relationship between climate (with a specific focus on in health impacts that arise from changes in ozone
temperature) and ground-level ozone. From this effort, pollution. The model can estimate these impacts in
we chose a single published number that represented terms of incidence (such as the occurrences of acute
the change in ozone pollution per degree rise in tem- respiratory symptoms or the number of hospital admis-
perature (measured in ppb/°F)—a number generally sions), as well as in terms of associated costs. (See the
referred to as the “climate penalty factor” (Bloomer box “A Closer Look at Our Methods and Assumptions”
2009). This value, which was consistent both with for more detailed information.)
observational and model studies for a range of nation- Table 1 summarizes how we arrived at the projected
ally averaged estimates (see the technical appendix increases in ozone pollution that were then used in our
online), represented changes in ozone pollution from modeling analysis.
Table 1. Projected Increase in Ozone Concentration Caused by Climate-Induced
Temperature Change in 2020 and 2050
Projected Climate Projected
Emissions Scenario Increase in Penalty Factor Increase in Ozone
Temperature (°F) (ppb/°F) (ppb)
2020 Emissions Scenario15 1–2 1.2 1–2 in 2020
2050 Higher-Emissions Scenario16 3–5.5 1.2 4–7 in 2050
2050 Lower-Emissions Scenario 2–4 1.2 2–5 in 2050
By multiplying the projected temperature-increase range by the climate penalty factor, we get the range for the
projected increases in ozone in 2020 and 2050. For 2050, the temperature increase is highly dependent on whether
global warming emissions continue to be released at their current rate or are reduced.C l i m ate C h a n g e a n d Yo u r He a lt h 15
Health and Economic Impacts of the
Climate Penalty on Ozone Pollution
W
e present the overall Georgia, South Carolina, Alabama, Mississippi, Loui-
health impacts of the climate penalty siana, Oregon, and Washington, the climate penalty
on ozone for 40 states and the District may be absent, inconclusive, or a benefit rather than a
of Columbia (hereafter referred to as penalty (see the box “A Closer Look at Our Methods
“the US-40”) for 2020 and 2050. We also present these and Assumptions”).
health impacts in terms of economic costs for the
US-40 for 2020. In addition, we present the 10 worst- The US-40 Climate Penalty and Health
affected states in 2020 in terms of health and economic When it comes to our quality of life, the health of
impacts. In each case, our results represent an additional our children, and the productivity of our economy,
impact above what would have occurred without the even small amounts of ozone can add up to real con-
climate penalty on ozone. sequences. The results presented in this report show that
Our results are derived from a 1 ppb and a 2 ppb the climate penalty on ozone increases all five health
ozone increase in 2020 and a 2 ppb and a 7 ppb ozone types of impacts examined—occurrences of acute re-
increase in 2050 (Table 1). We note that we are already spiratory symptoms, asthma-related emergency room
feeling the impacts of a climate penalty on ozone pol- visits, hospital admissions for seniors and infants, lost
lution because of past climate change. Moreover, our school days, and premature deaths—both for 2020
results are not cumulative—they represent impacts in and 2050.21 Millions of people will be affected by these
the specific year 2020 or 2050. Climate penalties impacts (Tables 2 and 3).
will likely cause increasing ozone pollution, and asso- The increases in health impacts in 2050 are substan-
ciated illnesses and costs, in the intervening years. tially larger than 2020 for two reasons: 1) the climate
We modeled the US-40, and not all 50 states, for penalty grows with increasing temperatures, and 2)
two reasons. First, the BenMAP model does not include an expanding and aging population puts more people
Alaska and Hawaii. Second, for the eight states of Florida, at risk for adverse health effects.
Table 2. Health Impacts from the Climate Penalty on Ozone in the US-40 in 2020*
Lower Case (1 ppb) Higher Case (2 ppb)
Category of Health Impact Low Central High Low Central High
Occurrences of Acute Respiratory Symptoms 719,220 1,414,770 2,109,440 1,437,480 2,825,850 4,210,690
Emergency Room Visits, Asthma-Related22 1 600 1,100 1 1,200 2,190
Seniors Admitted to Hospital, 180 1,840 4,560 350 3,680 9,080
Respiratory-Related
Infants Admitted to Hospital, 370 710 1,050 740 1,420 2,090
Respiratory-Related
Lost School Days 211,030 471,530 668,590 422,060 943,560 1,337,160
Premature Deaths 100 260 470 200 510 930
* Numbers are rounded to the nearest 10, except where less than 10. The low and high values represent the 5th and 95th percentiles of the distribution curve. The central value
represents the point in the distribution curve with the most likely occurrence. The EPA reports data from the BenMAP model in terms of this most likely or central value, and
often includes the 5th and 95th percentiles.16 U n i o n o f C o n ce r n e d S c i e n t i sts
2050 under the higher-emissions scenario, instances
of acute respiratory symptoms escalate to an average
of 11.8 million.
Seniors and infants are particularly susceptible to
being hospitalized for respiratory distress when they
are exposed to high levels of ozone, which can also
put increased stress on their caregivers and families. In
2020, an average of 3,700 seniors may be hospitalized
under the higher ozone scenario; in 2050, this number
is likely to climb to an average of 24,000 hospitaliza-
tions for seniors. The number of infants likely to be
hospitalized averages 1,400 in 2020 and 5,700 in 2050.
In 2020, American children are most likely to miss
© iStockphoto.com/Eliza Snow
an average of 944,000 school days linked to increased
ozone pollution from the climate penalty. In the
year 2050, that number may be as high as 5.8 million
additional school days lost.
The US-40 Climate Penalty and Costs
Parents, coaches, and athletes should all be made aware of a recent
study that found that children in communities with high ozone Climate change has already begun to exact economic
levels who were involved in three or more outdoor sports at the costs, and they are likely to get bigger both in the near and
varsity level were three times more likely to develop asthma longer terms. This report highlights one such potential
compared with children playing no sports (McConnell et al 2002).
cost of our inaction to reduce global warming emissions.
Impacts such as increased occurrences of acute respira-
If temperatures continue on their current upward tory symptoms and premature deaths not only impose
trajectory, in 2020—just nine years from now— a physical burden, but also take an economic toll. In
Americans could contend with an average of 2.8 million 2020 alone, a climate penalty on ozone pollution could
more occurrences of acute respiratory symptoms such cost the U.S. public an average of $2.7 billion (1 ppb)
as serious breathing problems, shortness of breath, to $5.4 billion (2 ppb), as shown in Table 4.23 For
coughing, wheezing, and chest tightness, possibly comparison, U.S. federal funding for public health
leading to restricted activity for the people affected. In emergency preparedness for events such as natural
Table 3. Health Impacts from the Climate Penalty on Ozone in the US-40 in 2050*
Lower Case (2 ppb) Higher Case (7 ppb)
Category of Health Impact Low Central High Low Central High
Occurrences of Acute
1,729,580 3,400,090 5,066,330 6,033,100 11,822,430 17,560,240
Respiratory Symptoms
Emergency Room Visits,
1 1,480 2,710 2 5,190 9,430
Asthma-Related
Seniors Admitted to Hospital,
660 6,850 16,910 2,300 23,940 58,280
Respiratory-Related
Infants Admitted to Hospital,
870 1,660 2,440 3,010 5,680 8,290
Respiratory-Related
Lost School Days 528,390 1,181,260 1,674,030 1,849,190 4,145,280 5,858,590
Premature Deaths 290 750 1,360 1,000 2,610 4,740
* Numbers are rounded to the nearest 10, except where less than 10. The low and high values represent the 5th and 95th percentiles of the distribution curve. The central value
represents the point in the distribution curve with the most likely occurrence. The EPA reports data from the BenMAP model in terms of this most likely or central value, and
often includes the 5th and 95th percentiles.C l i m ate C h a n g e a n d Yo u r He a lt h 17
disasters, pandemics, and acts of bioterrorism was about
$1.2 billion in 2010 (Levi et al. 2010).
These potential health costs are estimated here
only for the single year of 2020. We cannot present
costs for 2050 because the model did not include pro-
jections for income growth past 2024. However, it is
clear that without action to check climate change, the
climate penalty could accumulate year after year and
worsen over time. In addition, the larger projected
population would mean more people affected; with
Seniors and infants are
particularly susceptible to being
hospitalized for respiratory
distress when they are exposed
to high levels of ozone, which
can also put increased stress on
their caregivers and families.
rising income levels and health care costs, these impacts
© Thinkstock/Daniel Dziubiski
would likely be more expensive.24
Although we do not present the economic costs of The 10 Hardest-Hit States
the five health categories broken out individually here, The health impacts of the climate penalty on ozone will
most of the cost projections are driven by increased be felt across large areas of the country, but some states
premature mortality (see the technical appendix on- and regions are likely to be worse off than others. The
line). However, all of the health effects described in our greatest consequences are expected for the Midwest,
analysis place a burden on the U.S. economy and health the Mid-Atlantic, and California—all locations with
care system. These costs include, for example, the medi- large numbers of residents living in urban areas. Other
cal expenses of a hospital stay caused by respiratory areas that could face serious impacts include those with
illness and the loss of income for a sick patient unable the highest number of vulnerable populations such as
to work. As another example, the value of lost school children and seniors, and those areas with high NOx
days is derived from the income lost by a parent who and VOC emissions from vehicles and power plants.
has to stay home with his or her sick child. Further- Given the limited categories of health and cost ad-
more, ours is not a comprehensive accounting of all dressed above, our results most likely underestimate
the costs associated with the health impacts of ozone the consequences for those regions of the country (such
pollution. For example, we did not address the costs as portions of California) that are projected to see a
associated with pain and suffering. higher climate penalty on ozone than the national
Table 4. Health Costs from the Climate Penalty on Ozone in the US-40 in 2020*
Low Central High
Total Costs for a 1 ppb Increase
$443,592,290 $2,712,237,590 $6,864,137,670
in Ozone Concentration
Total Costs for a 2 ppb Increase
$886,805,720 $5,423,277,380 $13,724,094,610
in Ozone Concentration
* Expressed in 2008$. Numbers are rounded to the nearest 10.18 U n i o n o f C o n ce r n e d S c i e n t i sts
average. By contrast, some limited areas of the country,
such as pockets of the Southeast and Northwest, could
see no climate penalty or even a small decrease in ozone
concentrations, although the scientific literature on this
is inconclusive.
In Table 5, states are ranked according to their
estimated number of increased occurrences of acute
respiratory symptoms associated with the climate
penalty. The results correspond to the higher ozone
level in 2020. Health impacts are likely to be greatest
in areas with larger exposed populations, so states
with large populations or large urban areas are projected
to be the most affected.
As shown in Table 6, the 10 states with the highest
projected additional health costs from all health impact
© iStockphoto.com/Don Bayley
categories are usually those states with the largest pro-
jected populations. Thus California faces the largest
costs. However, this trend does not always hold true.
Pennsylvania, for example, has fewer projected residents
than are projected for Illinois, yet the state is expected
to experience higher costs, probably because of demo-
All the health effects described in this report place a burden
graphic factors such as a large number of seniors. Such
on the U.S. economy and health care system. These costs include,
for example, the medical expenses of a hospital stay caused by additional costs come on top of an already substantial
respiratory illness and the loss of income for a sick patient unable burden. California, for example, is already struggling
to work, or the income lost by a parent who stays home with a with poor air quality in many counties and the chal-
sick child.
lenges of being out of compliance with the existing
air pollution standards (Kleeman et al. 2010).
Table 5. State Rankings: Occurrences of Acute Respiratory Symptoms Associated
with a Climate Penalty of 2 ppb in 2020*
Rank State Population Low Central High
1 California 42,206,743 225,210 442,720 659,680
2 Texas 28,634,896 147,140 289,250 431,000
3 New York 19,576,920 108,150 212,600 316,790
4 Illinois 13,236,720 73,110 143,720 214,160
5 Pennsylvania 12,787,354 67,660 133,010 198,190
6 Ohio 11,644,058 62,530 122,920 183,150
7 Michigan 10,695,993 56,470 111,020 165,420
8 North Carolina 10,709,289 52,350 102,920 153,360
9 New Jersey 9,461,635 51,030 100,320 149,480
10 Virginia 8,917,395 47,250 92,890 138,420
* Occurrences are rounded to the nearest 10. Population projections are courtesy of U.S. Census 2010 and are not rounded.
The results for the other 30 states and the District of Columbia can be found in the technical appendix online.C l i m ate C h a n g e a n d Yo u r He a lt h 19
Table 6. State Rankings: Health Care Costs Associated with a Climate Penalty of 2 ppb in 2020*
Rank State Population Low Central High
1 California 42,206,743 $122,327,850 $729,189,390 $1,833,793,410
2 Texas 28,634,896 $79,533,660 $466,321,840 $1,168,692,990
3 New York 19,576,920 $64,435,580 $391,568,950 $989,410,430
4 Pennsylvania 12,787,354 $51,854,220 $331,680,220 $849,044,420
5 Illinois 13,236,720 $43,131,710 $272,348,970 $688,944,830
6 Ohio 11,644,058 $44,397,880 $270,632,840 $688,928,900
7 Michigan 10,695,993 $37,111,390 $230,322,580 $584,559,100
8 North Carolina 10,709,289 $33,827,120 $208,603,060 $528,660,190
9 New Jersey 9,461,635 $32,958,790 $203,089,680 $515,592,450
10 Virginia 8,917,395 $29,436,950 $177,950,320 $449,390,850
* Costs are rounded to the nearest 10. Population projections are courtesy of U.S. Census 2010 and are not rounded.
The results for the other 30 states and the District of Columbia can be found in the technical appendix online.
© Jeff Turner
Lifeguards at Galveston, TX, beaches provided evidence of the impact of short-term exposure to ozone pollution:
researchers found that many lifeguards had greater obstruction in their airways when ozone levels were high.
Thanks to this research, Galveston beachgoers are now warned, by an “environmental alert” flag, of air and
weather conditions that could pose a health threat (Thaller 2008).20 U n i o n o f C o n ce r n e d S c i e n t i sts
Where Do We Go from Here?
M
any states are already As states come to grips with this challenge they
struggling with meeting ozone stan- will need tailored information about how their regional
dards, as evidenced by the fact that air quality will be affected by future climate change.
over 48 percent of Americans currently Further research efforts could include better deter-
live in areas with unhealthful ozone levels (ALA 2011: mination of a) climate penalties for individual regions
Figure 2). In a warming world, even greater numbers of the United States and b) future trends in local
of states could face the health and economic conse- precursor emissions.
quences of failing to meet these minimally protective We do not have much time to deal with this chal-
ozone standards. At the very least, the climate-change- lenge. It is already too late to prevent the increase in
induced increase in ozone pollution imposes an temperatures driven by climate change over the next
additional challenge for the states that currently have decade—and perhaps over the next several decades—
areas with unsafe ozone levels: they must work harder given the long residence time of carbon dioxide in the
to reduce ozone-forming pollutants simply to maintain atmosphere. Consequently, the climate penalty for
their current—and often unhealthful—ozone levels. 2020 will also be very difficult to avoid, and the harm
© CorbisC l i m ate C h a n g e a n d Yo u r He a lt h 21
The good news is that both ozone pollution and climate change
are fundamentally caused in large part by the same activities:
human beings burning fossil fuels to generate electricity and run
their vehicles. We can address both ozone pollution and climate
change by investing in more fuel-efficient cars, reducing miles
driven, and using more renewable energy sources—such as
wind, solar, and geothermal—to generate electricity.
to our health and economy associated with this penalty change by implementing practical policies and programs
will undermine some of the gains made in reducing and changing individual behaviors. For example, we
ozone-precursor emissions. The EPA’s most recent can reduce both ozone-precursor and carbon emissions
report detailing the benefits and costs of the Clean Air from power plants, refineries, and vehicles by:
Act shows that it is projected to avoid an estimated • Investing in more fuel-efficient cars and reducing
7,100 premature deaths associated with ozone pollu- miles driven
tion in 2020 (EPA 2011b). But a warmer climate • Developing fuels that are less carbon-intensive
may erode the current ozone-reduction benefits of the • Providing good public transit and other com-
Clean Air Act between 3 percent (1 ppb) and 7 percent muting and travel alternatives
(2 ppb) in 2020.25 Although we did not model it, we • Increasing energy efficiency at industrial and
believe that the best option in the near term is to sig- commercial facilities
nificantly lower the precursor pollutants that form • Developing and retrofitting homes and buildings
ground-level ozone so that the health impacts do not to be more efficient
escalate further. • Using more renewable energy resources—such
In the 2050 time frame, we can do better: we have as wind, solar, and geothermal—to generate
the choice to significantly lower our heat-trapping emis- electricity
sions from current levels and also make deep cuts • Ensuring that ozone- and carbon-reduction
in emissions of precursor pollutants. By reducing standards are strong enough to be truly protec-
both kinds of emissions, we can significantly lower the tive of public health
2050 health impacts due to ozone pollution. • Working collaboratively with global partners to
In addition to bad air quality, climate change poses reduce carbon emissions from other countries.
other threats to the health and well-being of Ameri-
cans. This report addresses just one public health threat The United States has the knowledge and the tech-
associated with climate change, but there are numer- nology to reduce unhealthful pollution while also
ous others, including heat waves, elevated allergen levels, potentially saving billions of dollars. The choices we
more occurrences of waterborne diseases, changing dis- make today about the way we live, the energy we use,
ease vectors, and degraded water quality. and the pollution we release will make a difference for
The good news is that both ozone pollution and the health and well-being of ourselves, our children,
climate change are fundamentally caused in large part and our descendants long into the future. The benefits
by the same activities: human beings burning fossil of cleaning up pollution sources will be a win for
fuels to generate electricity and run their vehicles. There- climate, a win for air quality, a win for public health,
fore we can address both ozone pollution and climate and a win for the economy.You can also read