Toronto Hydro-Electric System Public Infrastructure Engineering Vulnerability Assessment Pilot Case Study - PIEVC
←
→
Page content transcription
If your browser does not render page correctly, please read the page content below

Planning,         Clean Air Partnership, in partnership with
                                               Toronto Hydro-Electric System
                             Environment and   Engineers Canada
                             Resources

Toronto Hydro-Electric System Public
Infrastructure Engineering Vulnerability
Assessment Pilot Case Study
Electrical Distribution Infrastructure
Final Report

60263582

                   st
September 21 , 2012

AECOM All rights reserved.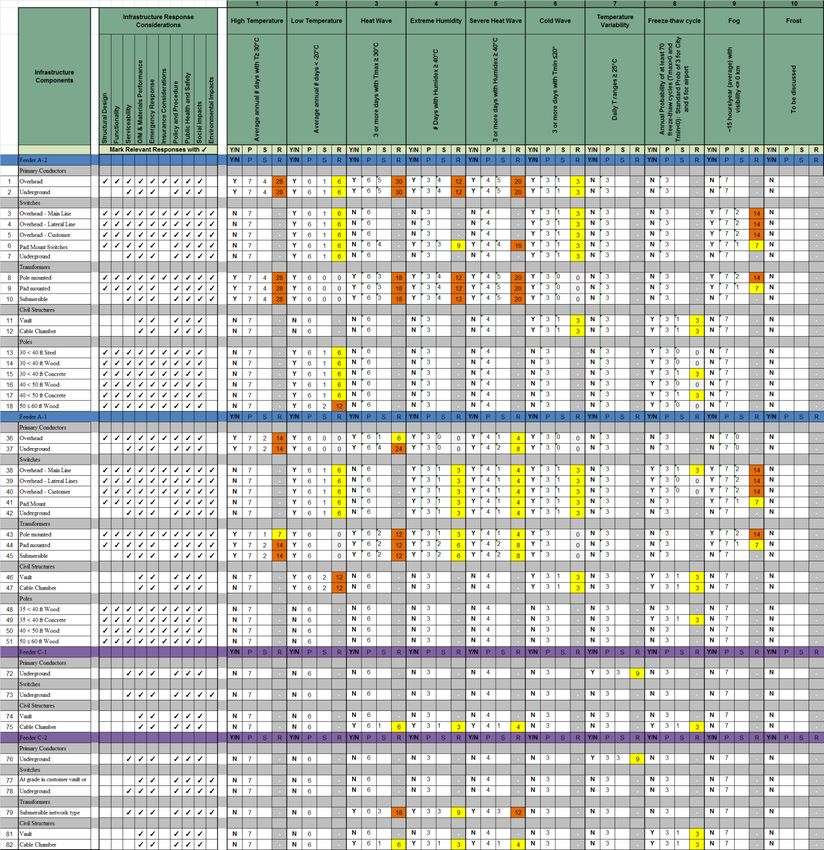
AECOM                                                        Toronto Hydro-Electric System PIEVC Pilot Case Study

Acknowledgements
AECOM would like to acknowledge the funding contributions of Natural Resources Canada and Engineers
Canada which made this project possible. The Toronto region’s WeatherWise Partnership is also acknowledged
for its work on bringing the issue of climate related threats on electrical infrastructure to the forefront, and for its
efforts in bringing about this study. AECOM would like to thank the Clean Air Partnership and Engineers Canada
for the opportunity to undertake this study.

AECOM would also like to acknowledge Toronto Hydro-Electric System staff for their time and effort in gathering
the necessary inputs and providing insight into the characteristics and functionality of their equipment. Without
their valuable contributions, this study could not have proceeded.

Interim Report, rev. 3 – July 2012                                                                                         ii
AECOM                                                                                      Toronto Hydro-Electric System PIEVC Pilot Case Study

Table of Contents

Acknowledgements ..................................................................................................................ii
1             Introduction ..................................................................................................................1
              1.1           Project Background .................................................................................................................. 1
              1.2           Project Scope and Objective .................................................................................................... 1
              1.3           Project Team .............................................................................................................................. 2
2             Infrastructure ...............................................................................................................4
              2.1           Feeder Systems ......................................................................................................................... 4
              2.1.1         Area A Station Feeders............................................................................................................................ 4
              2.1.2         Area B Station Feeders............................................................................................................................ 5
              2.1.3         Area C Station Feeders............................................................................................................................ 6
              2.2           Components............................................................................................................................... 9
              2.2.1         Primary Conductors ................................................................................................................................ 9
              2.2.2         Switches ................................................................................................................................................. 10
              2.2.3         Transformers .......................................................................................................................................... 11
              2.2.4         Network Units ......................................................................................................................................... 11
              2.2.5         Vaults ...................................................................................................................................................... 12
              2.2.6         Poles ....................................................................................................................................................... 13
              2.3           Time Horizon ............................................................................................................................ 14
              2.4           Jurisdictional Considerations ................................................................................................ 15
              2.5           Other Potential Changes that May Affect Infrastructure ..................................................... 16
              2.6           Data Sufficiency ...................................................................................................................... 16
3             Climate Analysis ........................................................................................................ 17
              3.1           Climate Parameters and Thresholds ..................................................................................... 17
              3.2           Standardized Probability Scoring .......................................................................................... 18
              3.3           Data Sufficiency ...................................................................................................................... 19
4             Risk Assessment ....................................................................................................... 20
              4.1           Preparation for the Risk Assessment Workshop ................................................................ 20
              4.1.1         Risk Assessment Methodology ............................................................................................................ 20
              4.1.2         Relevant Infrastructure Performance Responses ............................................................................... 21
              4.1.3         Yes/No Weather – Infrastructure Interaction Screening ..................................................................... 21
              4.2           Risk Assessment Workshop .................................................................................................. 21
              4.3           Assessment Results ............................................................................................................... 22
              4.3.1         General.................................................................................................................................................... 22

Interim Report, rev. 3 – July 2012                                                                                                                                                        iii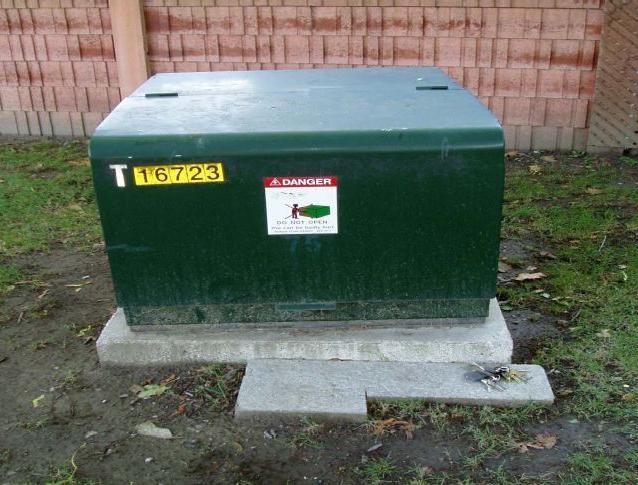
AECOM                                                                                      Toronto Hydro-Electric System PIEVC Pilot Case Study

              4.3.2          Low Risk ................................................................................................................................................. 23
              4.3.3          Medium Risk ........................................................................................................................................... 25
              4.3.4          High Risk ................................................................................................................................................ 26
              4.3.5          Special Cases – High Severity, Low Probability Events ..................................................................... 26
              4.3.6          Special Cases - Low Severity, High Probability Events...................................................................... 26

5             Preliminary Conclusions ........................................................................................... 29
              5.1            Findings and Limitations ........................................................................................................ 29
              5.2            Additional Work ....................................................................................................................... 30

List of Tables
Table 1.1 Project Team Members .............................................................................................................................. 2
Table 2.1 Feeder Loading and Performance Characteristics ..................................................................................... 7
Table 2.2 Useful Design Life .................................................................................................................................... 14
Table 2.3 Asset Date of Installation .......................................................................................................................... 15
Table 3.1 Climate Events and Thresholds for Pilot Case Study .............................................................................. 17
Table 3.2 Protocol Probability Scoring Scale ........................................................................................................... 19
Table 4.1 Protocol Severity Scoring Scale with Electrical Distribution Examples .................................................... 20
Table 4.2 Reference Risk Tolerance Thresholds ..................................................................................................... 20
Table 4.3 Organizations and Experience Present at the Workshop ........................................................................ 22
Table 4.4 Summary Current Weather Related Risks to Electrical Distribution Infrastructure .................................. 28

List of Figures

Figure 2.1 Schematic of Area A Feeders A-1, A-2 and A-3 ....................................................................................... 5
Figure 2.2 Schematic of Area B Feeders B-1 and B-2 ............................................................................................... 6
Figure 2.3 Schematic of Area C Feeders C-1 and C-2 .............................................................................................. 7
Figure 2.4 Underground Cables ................................................................................................................................. 9
Figure 2.5 Switches .................................................................................................................................................. 10
Figure 2.6 Transformers ........................................................................................................................................... 11
Figure 2.7 Network Unit ............................................................................................................................................ 12
Figure 2.8 Vaults ....................................................................................................................................................... 12
Figure 2.9 Poles........................................................................................................................................................ 13

Interim Report, rev. 3 – July 2012                                                                                                                                                      iv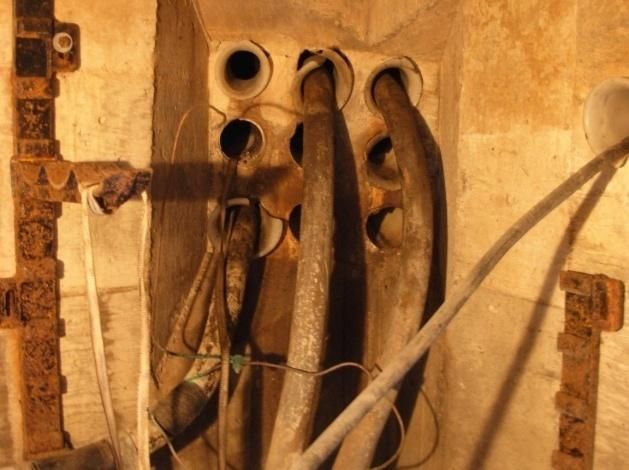
AECOM                                                Toronto Hydro-Electric System PIEVC Pilot Case Study

List of Appendices
Appendix A Detailed Breakdown of Infrastructure Components
Appendix B Current Climate Analysis
Appendix C May 11 Workshop Presentations
Appendix D Risk Assessment Matrices

Interim Report, rev. 3 – July 2012                                                                          v
AECOM Toronto Hydro-Electric System PIEVC Pilot Case Study 1 Introduction 1.1 Project Background The Public Infrastructure Engineering Vulnerability Committee (PIEVC) Engineering Protocol (the Protocol) is a structured, documented methodology for infrastructure vulnerability assessment and adaptation to a changing climate. It is based on standard risk assessment designed to assist owners and operators of public infrastructure evaluate the risks posed by a changing climate to their infrastructure. The Protocol, currently in version 10, also allows users to evaluate the risks posed by current climate to the infrastructure as part of the overall risk assessment. Electrical distribution infrastructure is a key asset in the delivery of electricity within Canada’s cities. Electrical service is key in virtually countless ways, and vital to a city’s socio-economic activities and environment, as well as the health, safety and well-being of its population. However, climate events, such as storms, wind, lightning and flooding, pose threats to the electrical systems and can cause disruptions to service. Furthermore, these threats are changing as a consequence of a changing climate. The need to understand the evolving nature of these threats, and to maintain robust and resilient electrical distribution systems, is clear. Key stakeholders in the City of Toronto such as the WeatherWise Partnership have recognized the importance of the electrical sector and its vulnerability to a changing climate, and targeted it in 2011 as a priority area for further investigation. As part of this endeavour, Engineers Canada engaged the Clean Air Partnership to work with Toronto Hydro-Electrical System Limited (THESL) in order to demonstrate the applicability of the Protocol on Toronto Hydro owned electrical distribution infrastructure in the City of Toronto. THESL is Canada’s largest municipal electrical distribution utility. It owns and operates the city’s electrical distribution infrastructure system which supplies power to over 700,000 residential, commercial and industrial customers. This application of the Protocol thus serves as an opportunity for THESL and other main stakeholders in the City of Toronto to better understand the threats posed by climate change on the electrical distribution system. This can lead to the identification of priority areas for further action and investment, thereby allowing THESL to better prioritize its response to climate related threats and continue to provide a safe, reliable supply of electricity to Canada’s largest city. 1.2 Project Scope and Objective The Protocol is composed of five key steps: Step 1 – Project Definition; Step 2 – Data Gathering and Sufficiency; Step 3 – Risk Assessment; Step 4 – Engineering Analysis; Step 5 – Recommendations and Conclusions. To accommodate the budget and short time available to conduct this study, the scope of this Protocol case study was purposefully limited to the completion of Steps 1 to 3 of the Protocol, and only evaluates risks posed by current climate. Similarly, activities such as data gathering and analysis were prioritized to focus only on the elements that were necessary to complete the risk assessment workshop, a key step in demonstrating the applicability of the Protocol on electrical systems. The activities undertaken comprise a project referred to in the following report as the pilot case study, and represents a subset of the efforts that would normally be required as part of a full Protocol case study. Similarly, this report has been identified as an interim report because it represents a subset of the documentation that would normally be required in a full Protocol case study. Additional work required to complete a full Protocol case study is presented at the end of this interim report. Interim Report, rev. 3 – July 2012 1
AECOM Toronto Hydro-Electric System PIEVC Pilot Case Study
Thus, the objective of this pilot case study is to evaluate the vulnerability of selected THESL distribution
infrastructure to current climate, using the Protocol, Steps 1 to 3, to structure the evaluation. The infrastructure
components selected by THESL for this project are seven feeder systems from three sub-stations:
Area A Station: Three 27.6 kV feeders: A-1, A-2 and A-3;
Area B Station: Two 13.8 kV feeders: B-1; B-2;
Area C Station: Two 13.8 kV feeders: C-1; C-2.
The following elements, which are normally part of a full Protocol case study, were not completed as part of the
pilot case study:
Site visit;
Collection and examination of condition assessments, maintenance records and practices, emergency
planning procedures and practices;
Application of the Protocol using changing climate data projections;
Steps 4 and 5 of the Protocol;
Completion of all Protocol worksheets: 1, 2, 4 and 5.
Nonetheless, the pilot case study’s objective was still achieved in spite of these limitations, namely the lack of a
site visit by AECOM or examination of infrastructure information as described above, due to the contributions,
participation and expertise of Toronto Hydro staff throughout the pilot case study.
1.3 Project Team
For this pilot case study, the Clean Air Partnership acted as the contract administrator and client side project
manager. CAP retained the services of AECOM Consulting to conduct the risk assessment on the identified
THESL electrical distribution infrastructure. Risk Sciences International was retained to provide climate expertise
and data on current climate. XTN Sustainable Life-cycle Asset Management Consulting was also retained as
facilitator for the workshop that was held as part of this pilot case study.
The members of the project team involved in the completion of this pilot case study are presented in the following
table.
Table 1.1 Project Team Members
Organization Team Member Role in Team
Eva Ligeti
Client Side Project Manager
Clean Air Partnership Kevin Behan
Funding Partner
Shazia Mirza
Funding Partner and National Vulnerability
Engineers Canada David Lapp
Assessment Coordinator
Sheikh Nahyaan
Joyce McLean
Toronto Hydro-Electric System Limited Infrastructure Owner
Mary Byrne
John Hecimovic
Toronto Environment Office David MacLeod Project Coordinator
City of Burlington Sam Sidawi Project Coordinator
Interim Report, rev. 3 – July 2012 2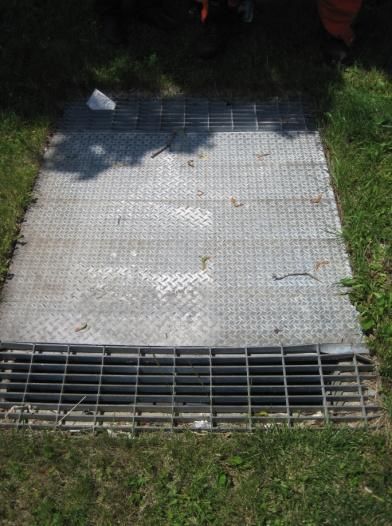
AECOM                                         Toronto Hydro-Electric System PIEVC Pilot Case Study

                                     Chee F. Chan
AECOM Consulting                     Chris Harabaras           Consultant - Risk Analysis
                                     James Jorgensen

Risk Sciences International          Heather Auld              Consultant - Climate Analysis

XTN Sustainable Life-cycle Asset
                                     Brian Kyle                Consultant - Workshop Facilitator
Management Consulting

Interim Report, rev. 3 – July 2012                                                                   3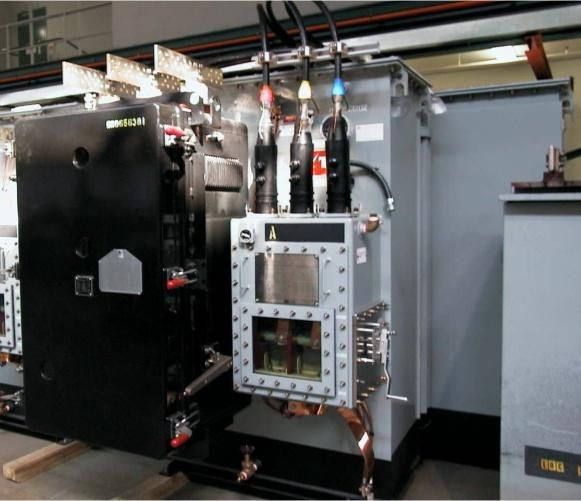
AECOM Toronto Hydro-Electric System PIEVC Pilot Case Study
2 Infrastructure
The following chapter provides an overview of the infrastructure that is being assessed in this pilot case study.
The characteristics, function and geographical context of each infrastructure component are described.
Information about infrastructure components was obtained from the following documents:
Toronto Hydro Environmental Impact Risk Assessment Study, Mar. 21, 2012;
Toronto Hydro Distribution System Planning Guidelines, Nov. 28, 2007;
Distribution Construction Standards – various components (1999 and older);
Distribution Construction Standards – various components (2000 and newer);
Overview of Toronto Area Transmission Grid and Distribution Systems, May 2010;
Overview of Toronto Hydro Distribution Systems, May 2010;
B-1 (2009), B-2 (2010), C-1(2011), C-2 (2008) Feeder prints;
13.8 kV Network System Summer Switching Restrictions Report, April 2010.
2.1 Feeder Systems
Toronto is supplied electricity from its transmission service provider, Hydro One Networks Inc., at two voltages:
230 kV in the areas around downtown Toronto and 115 kV in downtown Toronto. The 230 kV is a newer, high
capacity system that supplies customers as well as connects portions of the larger network, including generating
stations, together.
Power is delivered by two main 230 kV transmission paths to two transformer stations, Leaside and Manby, which
step the voltage down from 230 kV to 115 kV for use in the downtown system. The southernmost point of the
115 kV system is connected to the Portlands Energy Centre, a 550 MW generating facility.
Seven feeders and their components from the Area A, Area B and Area C transformer stations were selected by
THESL for this study. They were chosen because they are representative of the different types of equipment and
electrical configurations that are used by THESL. The feeders are:
Area A Station: Three 27.6 kV feeders: A-1, A-2 and A-3;
Area B Station: Two 13.8 kV feeders: B-1; B-2;
Area C Station: Two 13.8 kV feeders: C-1; C-2.
For this study, feeders are assumed to operate normally. Loading criteria on any given feeder is generally limited
to 400 Amps. Under emergency conditions, a feeder can be loaded as high as 600A although it cannot be
maintained for long time durations without causing undue wear or damage to equipment. Ideally, feeders are
loaded to 200 – 250 Amps. This operating guideline allows for the entire feeder’s load to be transferred to a
supporting feeder without causing failure of the latter if the former is taken off-line, either for maintenance or due
1
to electrical fault problems .
2.1.1 Area A Station Feeders
The three 27.6 kV feeders from the Area A Station selected for this study are A-1, A-2 and A-3. These feeders
serve suburban neighbourhoods in the north end of the City of Toronto.
1
The system is under ‘first contingency’ when a feeder is taken offline and its load is transferred to another feeder. As feeders are assumed to
operate normally for the purposes of this study, first contingency condition is not part of the scope of this assessment.
Interim Report, rev. 3 – July 2012 4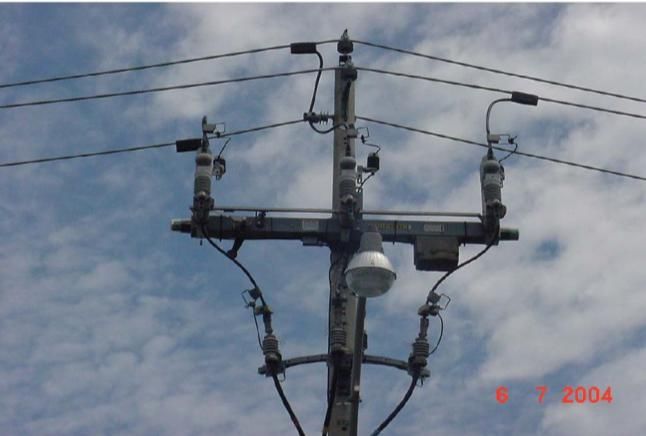
AECOM                                                   Toronto Hydro-Electric System PIEVC Pilot Case Study

The feeders are radial, open loop distribution systems with a mix of overhead and underground infrastructure.
Feeders have open points (switches) between adjacent feeders that can supply power in the event of a fault on
one feeder. Figure 2.1 presents a schematic of the three Area A feeders.
Figure 2.1 Schematic of Area A Feeders A-1, A-2 and A-3

Image source: Toronto Hydro-Electric System

Feeder A-2 primarily serves a residential neighbourhood to the south of Area A Station. This feeder supplies 3315
customers, including one key account (highest kW: 1256). This feeder is largely an overhead distribution system
with a large proportion of equipment (~80%) mounted on poles.

Feeder A-3 serves residential neighbourhoods and an industrial sector to the northwest of Area A Station. This
feeder supplies 490 customers, including one key account (highest kW: 2161). Like feeder A-2, feeder A-3 is
largely an overhead distribution system with a greater proportion of equipment (~70%) mounted on poles than at
grade or underground.

Feeder A-1 serves an industrial sector to the northwest of Area A Station. The main line of the feeder travels
northwest of the Area A Station underground before transitioning approximately 3 km later to the overhead feeder
system. This feeder supplies 1780 customers, including 3 key accounts who are industrial customers (highest kW:
1452). This feeder is made up of a greater proportion of below-grade equipment (~60%) than at grade or
overhead.

2.1.2           Area B Station Feeders

The two 13.8 kV feeders from the Area B Station selected for this pilot case study are B-1 and B-2. These feeders
are located in an inner city neighbourhood approximately 5 km to the northwest of downtown Toronto (see figure
2.2).

Interim Report, rev. 3 – July 2012                                                                               5
AECOM                                                   Toronto Hydro-Electric System PIEVC Pilot Case Study

Figure 2.2 Schematic of Area B Feeders B-1 and B-2

Image source: Toronto Hydro-Electric System

Feeder B-1 is a dual radial underground system that supplies five customers. It includes no key accounts. As a
dual radial system, all customers on this feeder have 100% redundancy in their power supply, as this feeder is
backed up by feeder B-3 (not included in this pilot case study).

Feeder B-2 is composed of two types of systems, an overhead (OH) open loop distribution system that is similar
in character to the Area A feeders, as well as an underground residential distribution system (URD). It supplies
2141 customers, which are generally inner city residential and commercial properties. There are no key accounts
on this feeder.

2.1.3           Area C Station Feeders

The two 13.8 kV feeders from the Area C Station selected for this study are C-1 and C-2. These feeders run
entirely underground and are located in downtown Toronto. They serve predominantly high-rise buildings (see
figure 2.3).

Feeder C-1 is an underground dual radial system. All transformers and switches on this feeder are customer
owned and are not within the scope of this pilot case study. THESL is responsible for the cable chambers and
underground cables that supply power to customer locations. This feeder supplies 12 customers, including one
key account (highest kW: 5745).

Interim Report, rev. 3 – July 2012                                                                                 6
AECOM                                                  Toronto Hydro-Electric System PIEVC Pilot Case Study

Figure 2.3 Schematic of Area C Feeders C-1 and C-2

Image source: Toronto Hydro-Electric System

Feeder C-2 is an underground network secondary distribution system. A network secondary system affords a high
degree of redundancy and reliability to customers. All equipment on this feeder is owned by THESL. The feeder
supplies 5 customers, including 1 key account holder (highest kW: 1664).

Table 2.1 presents several characteristics of each of the seven feeders, as well as loading, outage data and
THESL performance indices. In terms of outage performance over the last decade and last year, the Area A
Station feeder A-2 performs more poorly than A-3, which in turn performs more poorly than feeder A-1. This is
highly correlated to the fact that the three feeders, A-2, A-3 and A-1 respectively, have successively more
infrastructure below grade than at-grade or overhead. This same tendency can be observed between the two
Area B feeders, as B-1 is entirely underground while B-2 has some overhead distribution. The three underground
feeders, two from Area C and one from Area B perform similarly to one another in terms of outage performance.

Table 2.1 Feeder Loading and Performance Characteristics

                Feeder                   A-2   A-3       A-1              B-1             B-2             C-1      C-2

Number of customers on
                                        3315   490       1780              5             2141                 12   5
Feeder

Interim Report, rev. 3 – July 2012                                                                                       7
AECOM Toronto Hydro-Electric System PIEVC Pilot Case Study
# of Key Accounts 1 1 3 0 0 1 1
12.3 MVA 9.1 MVA 8.6 MVA 4.6 MVA 4.4 MVA 1.92 MVA 3.4 MVA
Average Feeder Loading 2011
258 Amps 190 Amps 180 Amps 194 Amps 183 Amps 81 Amps 144 Amps
Number of outages 2001 – Feb
147 71 37 6 51 5 2
2012
1
FESI - # Outages in last 12
12 8 2 3 4 0 1
months (up to Feb 2012)
Worst Performing Feeder
2 15 24 183 566 56 N/A 653
Ranking
2011 SAIFI - Average number
of customer power 0.031643 0.0083 0.004338 0.000029 0.015217 0 0.0000056
3
interruptions
2011 SAIDI - Average duration
of customer power 0.704792 1.048305 0.060144 0.002436 0.64296 0 0.000382
4
interruptions
1 FESI – Feeders Experiencing Sustained Interruptions.
2 Based on customers impacted and duration of outages over last 24 months. Rank 1 is worst out of approximately 700 feeders that have a
ranking.
3 SAIFI – System Average Interruption Frequency Index.
4 SAIDI – System Average Interruption Duration Index.
Interim Report, rev. 3 – July 2012 8AECOM Toronto Hydro-Electric System PIEVC Pilot Case Study
2.2 Components
A brief description of infrastructure components is provided in the following section. A detailed breakdown of
these components can be found in appendix A.
2.2.1 Primary Conductors
Primary conductors (wires) are used to transmit electricity through the system. Overhead wires suspended
between poles employ bare aluminum stranded conductors, or aluminum stranded conductors with a steel
reinforced centre cable. Underground conductors in this study are aluminum stranded conductors sheathed with a
crosslinked polyethylene (XLPE) insulator. In Area C feeders, older paper-insulated lead-covered copper cables
(PILC) are also used (see figure 2.4). Primary conductors in this study all carry high voltage, and underground
conductors are fed through polyvinyl chloride (PVC) ducts that are encased in concrete.
Figure 2.4 Underground Cables
Underground XLPE power cables Underground PILC power cables
Image source: www.otds.co.uk
Underground cables encased in a concrete duct bank
entering a vault
Image source: Toronto Hydro-Electric System
Interim Report, rev. 3 – July 2012 9AECOM Toronto Hydro-Electric System PIEVC Pilot Case Study
2.2.2 Switches
Switches provide control over the routing and distribution of electricity across feeder systems. They allow THESL
staff to isolate sections of the electrical distribution system for maintenance or repairs of electrical faults. There
are a variety of electrical switch types in place in the feeders under study (figure 2.5). However, the various switch
types were not considered as part of this study, as they were not indicative of their sensitivity to climate events.
Rather, switches were categorized only according to their location on the feeder, and their construction
orientation. For the purposes of this study, the following switch categorizations are used:
Overhead (pole mounted) main feeder switches – switches located along the primary powerline, or backbone,
of the overhead Area A and Area B feeders.
Overhead (pole mounted) lateral line switches – switches located on branches connected to the main line of
overhead Area A and Area B feeders. Lateral lines generally feed a group of customers;
Overhead (pole mounted) customer switches – switches on powerlines that only feed a single customer;
Pad mounted switches – switches located at grade in a metal enclosure on a concrete footing;
Underground switches – switches located below grade in vaults.
Figure 2.5 Switches
Scada Mate Pole mounted switch Pole mounted switches
SF6 Pad mounted switch Mini-rupter switches located below-
grade
Image source: Toronto Hydro-Electric System
Interim Report, rev. 3 – July 2012 10AECOM Toronto Hydro-Electric System PIEVC Pilot Case Study
2.2.3 Transformers
Transformers are used in electrical systems to convert voltages and facilitate the distribution of energy. In a
distribution system, transformers step voltages down from the distribution voltage (27.6 or 13.8 kV) to the lower
voltages that used by customers (120 – 600V). Transformers, like switches, can be located above grade on poles,
at grade in metal enclosures on concrete pads, or in buildings, as well as below grade in vaults (see figure 2.6).
Transformers are filled with either mineral or vegetable oil for cooling. Below grade transformers are submersible,
as they are sealed in water tight metal enclosures.
Figure 2.6 Transformers
3 phase pole mounted transformers Pad mounted transformer
3 Phase submersible transformer
Submersible transformer
Image source: Toronto Hydro-Electric System
2.2.4 Network Units
Network units are made up of a transformer, network protector and switch (see figure 2.7). These units are used
only in downtown feeders in secondary network distribution systems. The role of the network protector is
essentially to act as a low voltage circuit breaker that can automatically cut the electrical connection if power from
feeder fails or is taken offline for service. In this study, network units, like below-grade transformers, are located in
vaults and are submersible.
Interim Report, rev. 3 – July 2012 11AECOM Toronto Hydro-Electric System PIEVC Pilot Case Study
Figure 2.7 Network Unit
Transformer
Switch
Network Protector
Image source: Toronto Hydro-Electric System
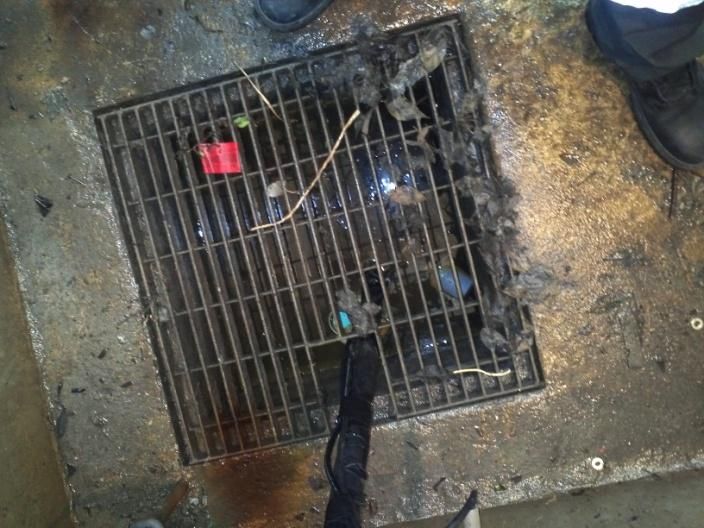
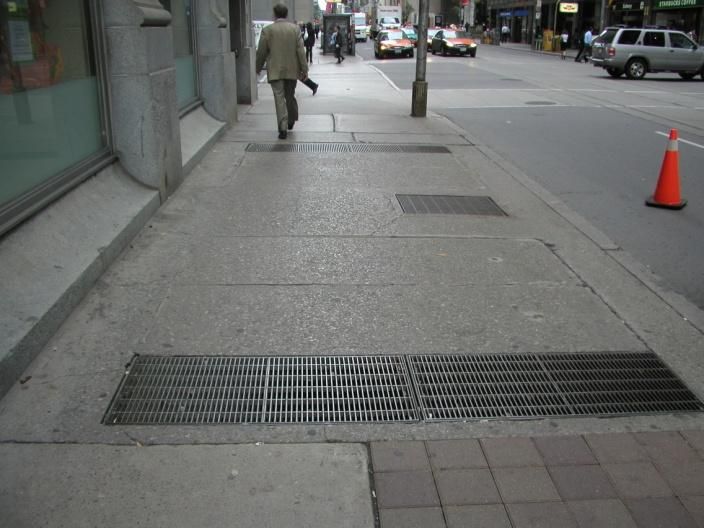
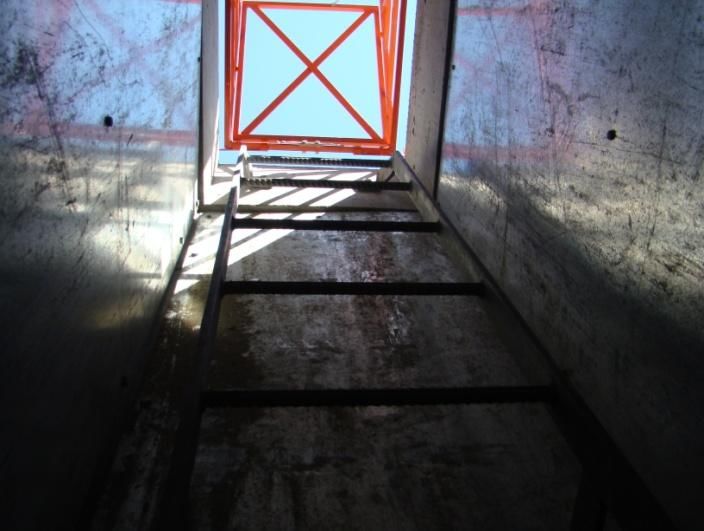
2.2.5 Vaults
Equipment below grade are located in vaults, underground concrete box structures that are accessible through a
ladder well (see figure 2.8). Small vault chambers, for example with only one transformer, are generally covered
by metal lids. Larger vaults, such as those found in inner city or downtown locations, are covered by concrete
slabs. 95% of THESL vaults are naturally ventilated, with grills in the vault ceiling open to the street level. Where
grills cannot be located directly in the ceiling due to at-grade infrastructure, air ducts are used to allow air
circulation.
Vaults have sumps and drains connected to the storm water or combined storm water and sewer network.
Backflow valves are present on drains to prevent drainage backflow from entering the vaults. Sump pumps are
also present in some vaults. THESL staff have indicated that drains do become clogged with debris when not
regularly maintained.
Figure 2.8 Vaults
Ladder well access
Ventillation grills
Vault under a sidewalk in downtown
Interim Report, rev. 3 – July 2012 12AECOM Toronto Hydro-Electric System PIEVC Pilot Case Study View up to ladder well access Drain and sump Image source: Toronto Hydro-Electric System 2.2.6 Poles Poles are used to suspend primary conductors above ground and may also carry transformers and switches (see figure 2.9). Poles are either made from cedar wood tree trunks, concrete or steel, though the majority of poles in this study are made of wood (>99%). In this study, poles are only found in the three Area A feeders and part of the Area B B-2 feeder, and range in height from 30 to 60 ft. Generally, poles of lower height carry less equipment (transformers, switches) than poles of greater height. Conductor cable tension between poles provides some lateral support to poles, while poles at the end of a linear segment or at a street corner may be guyed with steel cables for additional support. Figure 2.9 Poles Wood poles Concrete poles Image source: Toronto Hydro-Electric System Interim Report, rev. 3 – July 2012 13
AECOM                                                                Toronto Hydro-Electric System PIEVC Pilot Case Study

2.3             Time Horizon

This pilot case study deals with current climate only. The infrastructure design life by component is presented in
the table below.

Table 2.2 Useful Design Life

Component                                              Useful Design           Comments
                                                           Life*

Overhead conductor                                            63

Poles                                                         45               All types

Underground TRXLPE conductor                                  50

Underground PILC conductor                                    75               Downtown Area C Station only

Overhead switch                                            40 – 45

Pad mount switch (PMH)                                        30

Underground switch                                            40

Overhead, pad mount, underground
                                                           33 – 35
transformer

Underground network unit                                      20               Switch, transformer, network protector

Vault                                                         35

                                                                               Downtown Area C Station only. Network vault ceilings
Network vault                                                 60
                                                                               are replaced once every 30 years.

Cable Chamber                                                 65
*values based on THESL Kinetrics useful life modelling system for asset planning and management

Generally, the design life of electrical equipment is in the range of 30 – 40 years. An analysis of the installation
date of components in this case study reveal that most were installed in the 1980s and 90s (see table 2.3 below).
A detailed breakdown of equipment by date of installation is also presented in appendix A. Based on the design
life for equipment and their date of installation, the majority of equipment will be approaching the limits of their
design lives by the 2020s.

Interim Report, rev. 3 – July 2012                                                                                                14
AECOM Toronto Hydro-Electric System PIEVC Pilot Case Study
Table 2.3 Date of Installation for Assets within Feeders Under Study
Approximate % of assets by period of installation
Station / Feeder 60s 80s / 90s After 2000
Area A
A-2
O o
A-3 O O o
A-1 O o o
Area B
B-1 o O o
B-2 o O o
Area C
C-1
O
C-2 o O
O ≥ 80% of equipment O ~ 50% of all equipment o < 20% of all equipment
2.4 Jurisdictional Considerations
Some of the jurisdictions, laws, regulations, guidelines and administrative processes, external to Toronto Hydro,
that are applicable to the THESL distribution infrastructure are as follows:
Jurisdictions that have direct control/influence on the infrastructure:
The City of Toronto
Ontario Energy Board
Electrical Safety Authority
Laws and bylaws that are relevant to the infrastructure:
Federal
Transportation of Dangerous Goods Act;
Provincial
Electricity Act, 1998;
Ontario Energy Board Act, 1998;
Green Energy and Green Economy Act;
Environmental Protection Act;
Technical Standards and Safety Act;
Fire Protection and Prevention Act;
Dangerous Goods Transportation Act;
Ontario Occupational Health and Safety Act;
Local
City of Toronto Municipal by-laws;
Regulations that are relevant to the infrastructure:
OEB Transmission System Code;
OEB Distribution System Code;
Interim Report, rev. 3 – July 2012 15AECOM Toronto Hydro-Electric System PIEVC Pilot Case Study
OEB Standard Supply Service Code;
Ontario Regulation 22/04 Electrical Distribution Safety
Ontario Electrical Safety Code;
Electric Utility Safety Rules;
Industry Standards relevant to the design, operation and maintenance of the infrastructure:
CSA C22.3 No. 1 and 7National Building Code;
Ontario Building Code;
Canadian Electrical Code, Part 1;
O.Reg. 213/91 Construction Projects;
Harmonized Electric Utility Safety Association Rulebook;
2.5 Other Potential Changes that May Affect Infrastructure
Planned load transfers, generally for maintenance purposes, will increase loads temporarily on the feeder
systems. Increased summertime temperatures will increase load demand for air conditioning. Urban development
and the addition of new customers are the largest contributors to increased loads over time. Planned service
upgrades may provide new load capacity.
2.6 Data Sufficiency
Given the available study time and budget, data gathering activities during this project were targeted at obtaining
information essential to conducting the workshop. The following points illustrate some areas where more data can
be gathered towards the completion of a full PIEVC case study assessment:
No site visit was conducted as part of the assessment;
Complete information gaps in inventory of elements, such as the quantity, location and/or characteristics of
certain components. They are:
o All Area A feeders (switches, vaults and cable chambers);
o Area B feeder B-2 (switches, vaults and cable chambers);
o Area C feeder C-1 (switches).
Toronto Hydro derived aggregate infrastructure component condition ratings (health indices) were available
for only a small proportion of the infrastructure components under study. A fuller examination of information
on condition assessments can be undertaken;
Maintenance records and information on maintenance practices were not collected. This information would be
useful to determine whether maintenance has increased or decreased the capacity or useful life of the
infrastructure;
Information on emergency plans, procedures and practices were not collected or analysed;
Interim Report, rev. 3 – July 2012 16AECOM Toronto Hydro-Electric System PIEVC Pilot Case Study
3 Climate Analysis
The climate analysis used in this pilot case study was carried out by Risk Sciences International. A summary of
that analysis is presented in the following chapter while the full text is presented in appendix B.
This pilot case study is concerned with the impacts of current climate on electrical distribution infrastructure. A
variety of climate information sources were used to complete the climate analysis. These include:
The National Building Code of Canada, Appendix C, Climate Information (2010) and CSA/CEA overhead
systems standard;
Environment Canada’s Climate Normals; National Climate Archive online access, including CDCD and IDF
values, etc.;
Environment Canada (and partners) Hazards Portal and web site (www.hazards.ca – no longer available);
Environment Canada (and partners) Climate Change Scenarios website (www.ontario.cccsn.ca) – only a
national version now available;
Environment Canada’s Rainfall Intensity - Duration – Frequency (IDF) curves and publications on regional
IDF values for southern Ontario;
Peer-reviewed journal articles on downscaling methodologies for an ensemble of climate change models (>10
international journal articles on projections of ice storm, wind gust, temperature, heat-air quality-mortality risks
for the Toronto region);
Expert climate judgement.
3.1 Climate Parameters and Thresholds
24 climate events were identified in collaboration with THESL for inclusion in this study based on a list of climate
events known to affect southwestern Ontario. Thresholds beyond which climate-infrastructure interactions could
cause negative impacts were identified for all 24 climate events. Thresholds for temperature (high and low
extremes) and wind were specifically known for electrical distribution infrastructure. Some of these were drawn
from thresholds for related electrical infrastructure systems such as building code design winds, Canadian
Standard Association C22.3 No. 1 “Overhead Systems” and Canadian Electrical Code, Part 1 overhead systems
design temperatures. For all other climate events, thresholds were drawn from a previous PIEVC case study, the
Toronto and Region Conservation Authority Flood Control Dam Water Resources Infrastructure Assessment
(TRCA study). The list of climate events and thresholds used in this pilot case study are presented in the table
below.
Table 3.1 Climate Events and Thresholds for Pilot Case Study
Climate event Threshold Threshold Data Source
Temperature
1 High Temperature Average annual # days with T≥ 30°C CSA
2 Low Temperature Average annual # days < -20°C CSA
3 Heat Wave 3 or more days with Tmax ≥ 30°C Professional judgment
4 Extreme Humidity # Days with Humidex ≥ 40°C Professional judgment
5 Severe Heat Wave 3 or more days with Humidex ≥ 40°C Professional judgment
6 Cold Wave 3 or more days with Tmin ≤20° Professional judgment
Interim Report, rev. 3 – July 2012 17AECOM Toronto Hydro-Electric System PIEVC Pilot Case Study
Climate event Threshold Threshold Data Source
7 Temperature Variability Daily T ranges ≥ 25°C TRCA study
Annual Probability of at least 70 freeze-thaw cycles
8 Freeze-thaw cycle TRCA study
(Tmax>0 and Tmin 90 km/h (~2 days / year at Airport) CSA C22.3 No. 1
Tornado vortex extending from surface to cloud base
13 Tornadoes TRCA study
(near infrastructure)
Precipitation
14 Heavy Rain Daily Rainfall > 50 mm/day TRCA study
15 Heavy 5 day total rainfall 5 days of cumulative rain > 70 mm of rain TRCA study
Average annual probability of at least 25 mm of freezing
16 Ice Storm TRCA study
rain per event
Average annual probability of freezing rain events lasting
17 Freezing Rain 6h or more (i.e. typically more than 10 mm of freezing TRCA study
rain)
18 Blowing snow/Blizzard Average # of days / year with blowing snow (7.8 / y) TRCA study
19 Heavy Snowfall Snowfall > 10cm (2-3days/y) TRCA study
Snow on ground with depths ≥ 30 cm and persisting for 5
20 Snow accumulation TRCA study
or more days (0.17 events/y)
21 Hail Average # of hail days (~1.1/y) TRCA study
Other
22 Severe thunderstorms Average # of Thunderstorm Days (~2.8/y) TRCA study
Average # Days/Year with cloud - ground lightning
23 Lightning TRCA study
strikes (~25)
At least one month at Ontario low water response level II
24 Drought/Dry periods Professional judgment
(i.e. with mandatory water conservation )
3.2 Standardized Probability Scoring
The Protocol version 10 methodology for assessing the probability of a climate event exceeding (or triggering) a
given threshold is measured on a standardized probability scoring scale of 0 – 7. A score of 0 indicates that a
climate-infrastructure threshold will likely not be triggered, while a score of 7 indicates that the threshold will
certainly be triggered within the service life of the infrastructure.
To convert the probability of a climate event triggering a threshold into the 0 – 7 scale, two methods are
suggested by the Protocol, method A and method B. For this pilot case study, method B, the quantitative
approach was selected. The quantitative approach is based upon determining the annualized probability of a
climate event triggering the threshold. This is based on an examination of historical data from the last 10 to 50
years. Once the annualized probability is determined, it can be converted into the 0-7 scale according to method
Interim Report, rev. 3 – July 2012 18AECOM Toronto Hydro-Electric System PIEVC Pilot Case Study
B as shown in table 3.2. A detailed explanation of this procedure for each of the 24 climate events is presented in
appendix B. Standardized probability scores are shown in appendix B and on the risk matrices of appendix D.
Table 3.2 Protocol Probability Scoring Scale
Probability Probability
Score
PIEVC Method A PIEVC Method B
Negligible < 0.1 %,
0
Not Applicable < 1 in 1,000
Highly Unlikely 1%
1
Improbable 1 in 100
Remotely Possible 5%
2
1 in 20
Possible 10%
3
Occasional 1 in 10
Somewhat Likely 20%
4
Normal 1 in 5
Likely 40%
5
Frequent 1 in 2.5
Probable 70%
6
Often 1 in 1.4
Highly Probable > 99%
7
Approaching Certainty >1 in 1.01
3.3 Data Sufficiency
The climate data used in this study came from a variety of current and historically based data sources. It can be
used to determine standardized probability scores with a high degree of confidence given that the analysis was
focused on current climate.
Due to study time constraints, specific electrical distribution infrastructure thresholds for some climate events
could not be determined. To make up for this shortcoming, many of the thresholds used in this study were
adapted from a previous PIEVC TRCA Study. The latter study was chosen because its infrastructure is located
adjacent to the Area A feeders under study. It was found that many of the climate events used in the TRCA study
were applicable to electrical distribution systems. However, some of the thresholds that were used in the TRCA
study, and hence this pilot case study, likely require further fine-tuning to have greater relevance to the power
distribution sector. Therefore, it is recommended that future study should involve an analysis of operations and
maintenance information, as well as a detailed/forensic review of available outage data to identify thresholds
which were more specific to THESL electrical distribution infrastructure.
The impact of potential cumulative or synergistic effects was not adequately evaluated in this pilot case study.
Climate events like high wind, freezing rain and/or lightning often occur in tandem. However, it was difficult to
generalize about the frequency or magnitude of individual climate parameters within cumulative events. As an
example, thunderstorms, an event involving high wind and lighting strikes, was identified. It was difficult to
generalize about the magnitude and frequency of high wind and lighting strikes for thunderstorm events due to
significant variations that exist between one thunderstorm to the next. This in turn made it difficult to quantify
thresholds for thunderstorm events that would trigger an infrastructure response. Further work to assess the
impacts of potential cumulative or synergistic effects is recommended within the context of a full PIEVC case
study.
Interim Report, rev. 3 – July 2012 19AECOM Toronto Hydro-Electric System PIEVC Pilot Case Study
4 Risk Assessment
In Step 3 of the Protocol, a risk assessment based around a risk assessment workshop is conducted. The various
tasks and results of the risk assessment are documented in the following chapter.
4.1 Preparation for the Risk Assessment Workshop
4.1.1 Risk Assessment Methodology
The Protocol methodology for identifying risks involves multiplying the standardized probability score of a climate
event-infrastructure interaction with a severity score for that interaction. The determination of the standardized
probability score was described in the previous chapter and in appendix B. The severity score is measured on a
scale of 0 – 7; the Protocol version 10 provides two methods for determining the severity score, method D and E.
For this pilot case study, method E was selected. As this pilot case study represents the first time the Protocol has
been applied to electrical distribution infrastructure, examples of impacts across the 7 point scoring scale were
determined in collaboration with THESL. The severity scoring scale and electrical distribution system specific
examples of impacts are shown in the table below.
Table 4.1 Protocol Severity Scoring Scale with Electrical Distribution Examples
Severity of Consequences / Description Electrical Distribution System Specific
Score
PIEVC Method E Examples
0 Negligible or Not Applicable Negligible
1 Very Low - Some Measurable Change Arrestor failure
2 Low - Slight Loss of Serviceability Overheating transformer
3 Moderate Loss of Serviceability One distribution transformer out
4 Major Loss of Serviceability - Some Loss of Capacity Broken spring in underground switchgear
5 Loss of Capacity - Some Loss of Function Flooded vault that cannot be pumped
6 Major - Loss of Function Leaning pole / Downed lines
7 Extreme – Loss of Asset Downed pole, line and transformers
Next, the reference set of risk tolerance thresholds was reviewed with THESL. The thresholds for risk used in this
project follow those set out by the Protocol, as shown in the table below.
Table 4.2 Reference Risk Tolerance Thresholds
Risk Score Threshold Response
< 12 Low Risk No action necessary
12 – 36 Medium Risk Action may be required; Engineering analysis may be required*
> 36 High Risk Action required
*Step 4 Engineering analysis is out of scope in this study
Interim Report, rev. 3 – July 2012 20AECOM Toronto Hydro-Electric System PIEVC Pilot Case Study
4.1.2 Relevant Infrastructure Performance Responses
For each of the infrastructure components, the most likely responses to climate events as well as impacts arising
from climate event-infrastructure interactions were identified. Infrastructure performance responses served as the
basis on which to judge the severity of a climate event-infrastructure interaction. The following infrastructure
responses were used in this pilot case study:
Structural design - Structural integrity, cracking, deformation, foundation anchoring ,etc.
Functionality - Effective load capacity, efficiency, etc.
Serviceability - Ability to conduct maintenance or refurbishment, etc.
Operations, maintenance and materials performance - Occupational safety, worksite access, operations and
maintenance practices (frequency and type), etc.
Emergency Response - Planning, access, response time
rd
Insurance Considerations (TH perspective) - claimable for repair, cause 3 party payment, affect insurance
rates
Policy and Procedure Considerations - Planning, public sector, operations, maintenance policies and
procedures, etc.
Health and Safety - Injury, death, health and safety of THESL employees, the public, etc.
Social Effects - Use and enjoyment, access, commerce, damage to community assets (buildings), public
perception, etc.
Environmental Effects - Release or harm to natural systems (air, water, ground, flora, fauna)
The infrastructure performance responses were validated during the workshop. The results are presented in the
completed risk matrices presented in appendix D.
This study acknowledges that there are consequences to public health and safety, as well as social effects, from
electrical equipment damage and failure. However, the extent or severity associated with those consequences
was not examined in this case study because they were out of the study’s scope and budget. Information was not
collected on the presence of key public facilities (hospitals, community centres, schools, water pumps, drainage,
etc), their backup power capabilities, or the redundancies provided by other THESL feeders not considered in this
2
study. This study also did not explore the risks to vulnerable populations from weather such as heat waves , or
the importance and role that the electrical distribution system plays in mitigating these risks. Thus, study
participants were asked to exclude consideration of the wider societal impacts of equipment damage or failure
when assessing severity. The performance response measures listed above were examined from THESL’
perspective in terms of consequences on their assets, planning, operations and maintenance practices.
4.1.3 Yes/No Weather – Infrastructure Interaction Screening
A yes/no screening analysis was done in order to determine whether a given climate event would interact with a
given infrastructure component. Where no interaction occurred, no severity or risk score was calculated. The
yes/no screening analysis was done as part of workshop activities. The results of the yes/no screening analysis
are presented in the completed risk matrix presented in appendix D.
4.2 Risk Assessment Workshop
th
A full day risk assessment workshop was held on May 11 , 2012 in THESL offices in Toronto. A total of 25
participants from a variety of organizations and disciplines were involved in the workshop. The organizations and
experience present at the workshop are listed in the following table.
2
Populations vulnerable to heat include the elderly, infants and young children, people with pre-existing medical conditions or living alone.
Interim Report, rev. 3 – July 2012 21AECOM Toronto Hydro-Electric System PIEVC Pilot Case Study
Table 4.3 Organizations and Experience Present at the Workshop
Organization Expertise
Toronto Hydro-Electric Systems Standards and Policy Planning
System Reliability Planning
Strategic Affairs
Stations
Network Planning
Construction
Control Centre
Dispatch
Hydro One Electrical Transmission
Engineers Canada Protocol Specialist
AECOM Electrical Engineering, Risk Assessment
Risk Sciences International Climate Sciences
Xtn Sustainable Lifecycle Asset Management Facilitation and asset management
Clean Air Partnership Project Management
City of Burlington Infrastructure asset management
Natural Resources Canada Natural Resources Planning
Canadian Standards Association Built Environment and Structures
Toronto Environment Office Environmental Specialist
Toronto Water Water Utilities and Resources
Utilities Kingston Utilities Engineering
Participants were split into four groups. Two groups were assigned one of the two Area A station feeders, A-1 and
A-2. One group was assigned to complete the assessment for both Area B station feeders, and the last group was
assigned to complete the assessment of the two Area C station feeders. Area A station feeder A-3 was not
evaluated during the workshop as there were not enough participants or time to assess the feeder. However, due
to the similarities between feeder A-3 and the other two Area A feeders, the results for the latter two should
adequately represent results for A-3.
During the morning, participants were provided with an overview of the Protocol, current climate, THESL
infrastructure under study and instructions for the workshop exercise. Workshop breakout sessions began late
morning on validating infrastructure performance responses, completing the yes/no screening analysis, and the
assignment of severity scores to weather-infrastructure interactions. The breakout sessions continued into the
afternoon until all tables had completed their assigned feeders. Participants recorded their work on 11x17 risk
assessment matrices that were provided. The results of this analysis are presented in the risk matrices in
appendix D.
4.3 Assessment Results
4.3.1 General
As described in the Protocol, thresholds represent limits beyond which a climate event can have an adverse
impact on the infrastructure. Thresholds were established for all 24 of the climate events of interest. However,
only the thresholds for temperature (high and low extremes) as well as wind were known specifically for this
THESL electrical distribution infrastructure case study. For the majority of climate events, threshold data was
Interim Report, rev. 3 – July 2012 22AECOM Toronto Hydro-Electric System PIEVC Pilot Case Study
adapted from a previous PIEVC case study, the TRCA Water Resource Dam infrastructure system. For this
reason, the results of this risk analysis should be considered preliminary. For the majority of climate events, there
is some uncertainty as to whether climate events that exceed the thresholds used in this analysis actually cause
damage to electrical infrastructure. It is recommended that future study include a detailed forensic analysis of
outage event data as well as examination of maintenance and operations records in order to refine thresholds for
electrical distribution infrastructure.
This analysis attempted to determine whether differences in risk existed between feeders with the same type of
infrastructure (e.g. between overhead feeder systems). In terms of severity, this component level risk analysis
revealed no significant differences in severity scores between similar types of feeders; the impact of a climate
event on an overhead conductor, transformer or switch is no different between an Area A feeder as compared to
3
a Area B feeder .
Since many of the infrastructure components were repeated across the different feeders, a range of severity
scores were often attributed by different tables to the same infrastructure components. For example, overhead
conductors received severity scores ranging from 2 to 4 for high heat (>30°C). These differences cannot be
attributed to the differences between overhead feeders or components; for example, no significant differences in
the characteristics of overhead conductors, poles or distribution systems could be determined between Area A
feeders A-1 and A-2 that would suggest that this variation in severity was feeder specific. As participants brought
different types of experiences and expertise to the workshop, discussions about problems and severities likely
differed between groups. This is the most likely reason for variations in severity scoring for a given component
across different feeders. Nonetheless, while some severity scores were adjusted by AECOM following a review of
workshop materials and comments, different severity scores for a given component were not entirely reconciled
between different feeders. This was done in order to maintain the diversity of opinions that were expressed in the
workshop.
While it may be uncertain whether the numerical differences between two closely scoring risk values represent an
actual difference in risk, the Protocol contains a procedure to handle such variations. It does so through the
application of a coarser – low, medium and high – risk categorization scheme (see Table 4.2) to group weather-
infrastructure interaction risks. By doing so, the small variations in risk scores are de-emphasized and focus is
placed on the overall pattern of risk, thereby making it easier for practitioners and decision-makers to identify the
most important risks and set priorities. Therefore, the low, medium, high risk categories are reported instead of
numerical risks scores in the following sections.
In THESL staff experience, overhead infrastructure is more vulnerable to climate events than underground
infrastructure due to the increased likelihood of climate event-infrastructure interactions. The pattern of risks
revealed in this case study supports this experience, with the majority of above ground equipment being affected
by wind, freezing rain, lightning and other storm events. Below grade infrastructure was found to be vulnerable to
some types of climate events as well, with risks arising primarily from heat, rain and snowfall. In general, the
pattern of risk indicates that all high risks and higher-medium risks tended to affect feeders with overhead
infrastructure, while lower-medium risks and low risks were mostly associated with underground feeder
infrastructure. The following section presents specific climate event-infrastructure interactions by risk category,
while Table 4.4 at the end of the chapter provides a summary overview of these risks.
4.3.2 Low Risk
Assessment of climate event-infrastructure interactions resulting in risk scores below 12 are considered low risk.
Generally, no further action is required. A summary of low risk interactions are presented below.
3
Differences in risk scores could have arisen from differences in the probability score for a climate event for a downtown location as compared
to a suburban location. However, location specific climate data was not always available for all climate events under consideration, and thus
the same climate event probability scores were used across all feeder systems.
Interim Report, rev. 3 – July 2012 23You can also read