State of Play: Telecommunications - Discussion Document - Infrastructure Commission
←
→
Page content transcription
If your browser does not render page correctly, please read the page content below

State of Play:
Telecommunications
Discussion Document
Foreword
Kupu takamua
Our wellbeing depends on our infrastructure
Our way of life depends on infrastructure. Whether it’s moving freight to keep the supermarket
shelves stocked, warming our homes, driving to work or calling our friends, there are few parts of
our lives that don’t rely on the services provided by infrastructure.

Infrastructure decisions have intergenerational impacts, so it is essential that we take a strategic
view of the planning, development and operation of infrastructure in Aotearoa. New
Zealand Infrastructure Commission was formed to give infrastructure this strategic voice, and the
significance of this task is reflected in our Māori name, Te Waihanga, which means cornerstone.

Our first task is to develop a 30-year strategy for infrastructure - this paper is a part of this work. It
takes a closer look at the current state of play in New Zealand’s telecommunications sector. By
understanding where we are now we can set a course for where we want to go and the steps
we’ll need to take to get there over the next 30 years.

New Zealand faces a range of challenges and opportunities over the next 30 years which will have
significant implications for infrastructure. Our changing climate, rapidly growing cities, aging
population and evolving global technologies will change what we need from infrastructure in
order to maximise the wellbeing of New Zealanders. Each of us has our own experiences of
infrastructure, so we look forward to receiving your feedback to ensure this State of Play report
accurately reflects the current state.

Ross Copland
Chief Executive

State of Play: Telecommunications                                                                  Page: 1
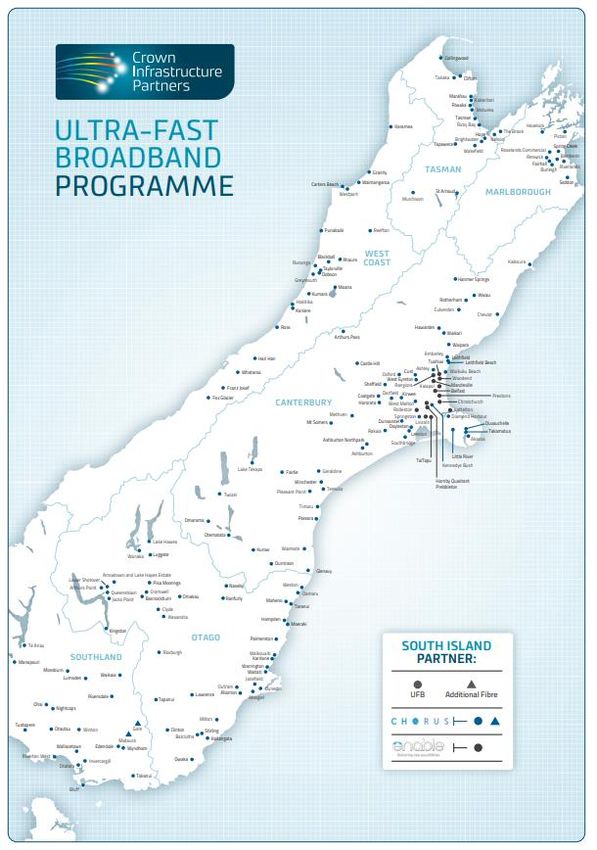
Table of Contents
1      Executive Summary .......................................................................................................... 4
2      Context ............................................................................................................................ 6
    2.1        Who we are and what we do ............................................................................................. 6
    2.2        About our sector State of Plays .......................................................................................... 6
    2.3        Our next steps .................................................................................................................... 6
    2.4        Have your say ..................................................................................................................... 7
3      About the telecommunications system ............................................................................. 8
    3.1        The services provided by telecommunications infrastructure ........................................... 8
    3.2        Physical assets .................................................................................................................. 10
    3.3        Capital flows ..................................................................................................................... 11
    3.4        Wellbeing .......................................................................................................................... 11
4      What shapes the sector today? ........................................................................................14
    4.1    Current ownership and governance of telecommunications infrastructure in New
    Zealand ......................................................................................................................................... 14
    4.2        The regulatory and policy environment ........................................................................... 20
    4.3        Market structure and how assets are financed................................................................ 22
    4.4        A sector where resilience is increasingly important......................................................... 23
5      How is the telecommunications sector performing today? ...............................................25
    5.1        Broadband ........................................................................................................................ 25
    5.2        Mobile............................................................................................................................... 29
    5.3        Asset condition ................................................................................................................. 30
6      How is the sector responding to what might come next? ..................................................32
    6.1        Issues the sector is facing in the short-to-medium term ................................................. 32
    6.2        Digital inclusion ................................................................................................................ 32
    6.3        A long-term solution to rural connectivity remains an open question ............................ 33
    6.4        Resilience to cyber threats ............................................................................................... 34
    6.5        Anticipated rapid demand-led growth is driving investment in new technology ............ 34
    6.6        Data storage: a key opportunity going forward ............................................................... 37
    6.7        Issues the sector is facing in the medium-to-long term ................................................... 37
7      Conclusion ......................................................................................................................39
8      Appendix one: Process, assumptions and limitations........................................................40
    8.1        Our process....................................................................................................................... 40
    8.2        Limitations ........................................................................................................................ 40
9      Appendix two: Glossary...................................................................................................41

State of Play: Telecommunications                                                                                                             Page: 2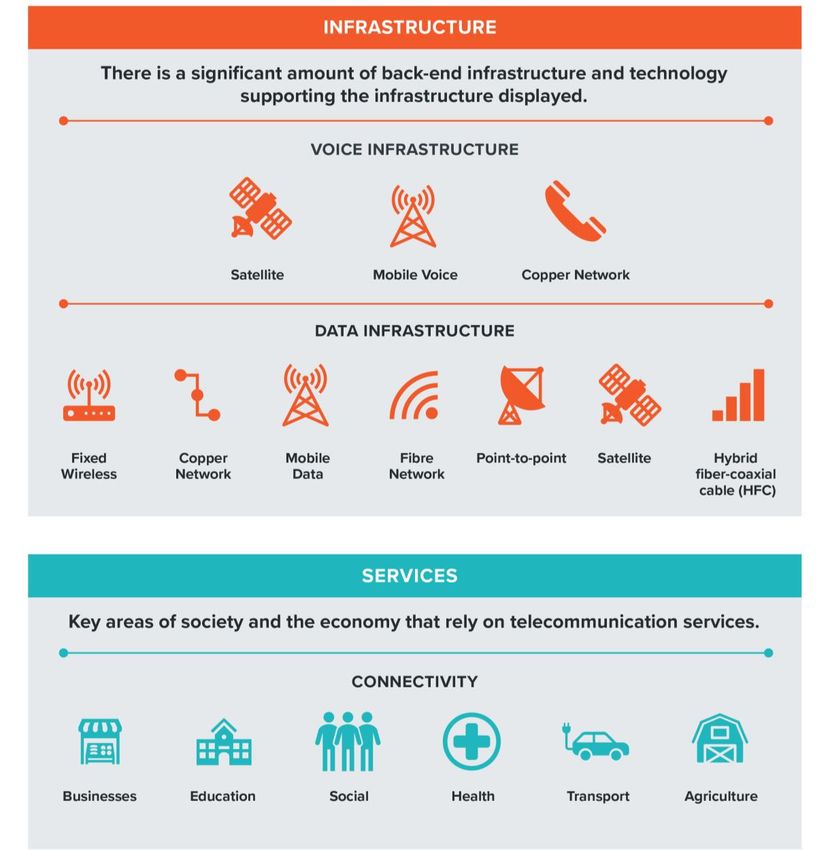
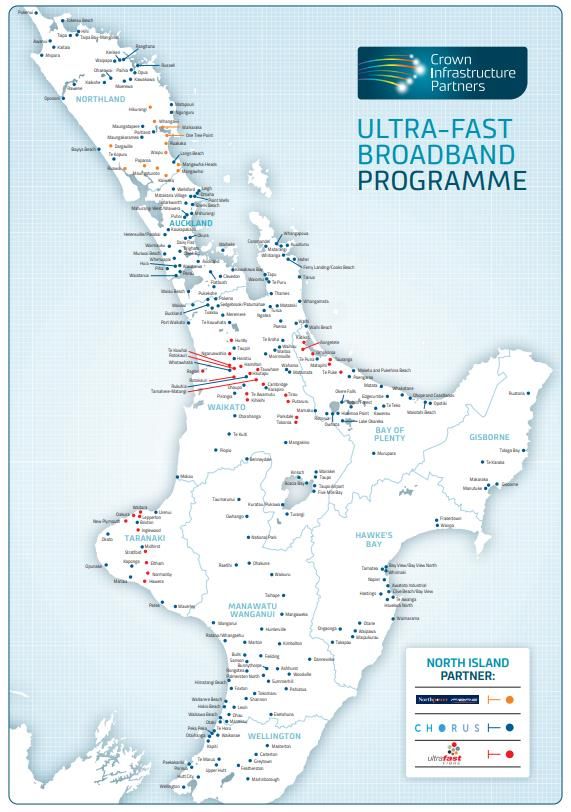
10        Appendix three: References .........................................................................................43
11        Appendix four: UFB rollout schedule – CIP....................................................................48
12        Appendix five: Mobile coverage addressed through RBI2/MBSF – CIP ...........................50

Table of Figures
Figure 1: Telecommunications infrastructure and corresponding services ....................................... 9
Figure 2: Impact of connectivity on the 12-wellbeing domains ....................................................... 12
Figure 3: New Zealand's submarine cable network ......................................................................... 18
Figure 4: New Zealand’s telecommunications ecosystem ............................................................... 19
Figure 5: Consumer Price Index: telecommunication services ........................................................ 23
Figure 6: Network traffic - Upstream ............................................................................................... 24
Figure 7: Fixed-line broadband connection by technology .............................................................. 26
Figure 8: Average broadband download speed ............................................................................... 26
Figure 9: Distribution of latency between households and test servers hosted in New Zealand .... 27
Figure 10: Mobile data consumption ............................................................................................... 35
Figure 11: Average mobile data per mobile subscription (December 2018) ................................... 35

Table of Tables
Table 1: Access and quality metrics by connection .......................................................................... 28
Table 2: Fixed-line broadband only benchmarking .......................................................................... 29
Table 3: Mobile phone services benchmarking ................................................................................ 30

State of Play: Telecommunications                                                                                             Page: 3
1 Executive Summary
Telecommunications infrastructure connects people and ideas. It connects families, whanau,
communities and markets, and is essential in enabling a modern economy and diffusion of
knowledge. It is critical to modern education services and increasingly important for essential
services like healthcare, as more is done virtually. Further uses include the movement and storage
of data that support businesses and other sectors like transport and energy. Ultimately, the
influence of the sector and its infrastructure is significant across the four dimensions of wellbeing:
Economic, Social, Cultural, and Environmental.

Today, the sector is well placed when considered in relation to the services that New Zealanders
can access. It compares favourably with other countries in the OECD and performs strongly
relative to other infrastructure sectors. The sector is coming to the end of a transformational
period with the national rollout of fibre broadband. When the programme is complete, by the end
of 2022, 87% of New Zealanders will have access to fibre, and New Zealand will be one of the
leading countries in the OECD for fibre availability. 1 Considering New Zealand’s international
                                                    0F

standing a decade ago, and the importance of connectivity for an isolated, developed nation, this
is a remarkable achievement.

However, in spite of the substantial progress the sector has made, there are still issues that create
barriers to wellbeing for some New Zealanders. Not everyone can access telecommunications
services. This may be due to factors such as access to devices, having the necessary skills, trust,
motivation, or the cost of connectivity.

Similarly, in a sector dominated by private capital, it is not always economic to provide affordable
infrastructure. Rural communities across New Zealand feel this most acutely. While significant
progress has been made through Crown-Private cooperation and infrastructure sharing, the long-
term solution to addressing internet connectivity for rural communities is not clear.

The impact of Covid-19 has further highlighted the importance of these services. Those excluded
from telecommunications connectivity were unable to access essential services such as healthcare
and education. As the world moves increasingly online, digital exclusion stands as a growing
barrier to economic and social participation.

For the sector, as the sun sets on one transformation another begins. Advancement in technology
and an insatiable demand for data are leading to new technologies such as 5G, which is being
deployed across New Zealand. These technologies continue to push the boundaries on what is
possible with an internet connection.

As technologies develop, and applications, such as an Internet-of-Things (IoT), continue to change
the way we live, security and the importance of protection against cyber threats will increase.
That said, this is an exciting and important chapter in the history of New Zealand’s
telecommunications infrastructure. As connectivity continues to support our society, culture,
environment, and economy, it is critically important the settings are in place for
telecommunications infrastructure to address future needs and wellbeing of New Zealanders.

1
 Crown Infrastructure Partners, Quarterly Connectivity Update. 2020. p.4.
https://www.crowninfrastructure.govt.nz/wp-content/uploads/CIP-Quarterly-Rep-June_FINAL.pdf.

State of Play: Telecommunications                                                              Page: 4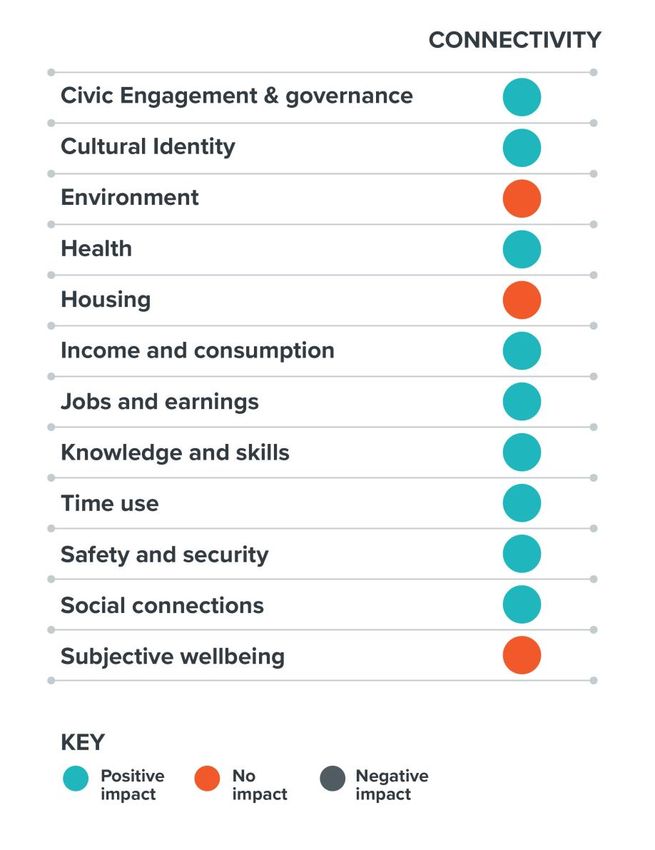
He Whakarāpopoto
He hono tāngata, ariā hoki te mahi a te hanganga whitimamao. E honoa ana ngā whānau, me ngā
hapori me ngā mākete, ā, he mea whaitake hoki hei whakawhanake i tētahi ōhanga ōnāianei, i te
whakahōrapa hoki o te mātauranga. E whai tikanga ana anō ki ngā ratonga mātauranga ōnāianei,
ā, e piki haere ake ana tana whakaawenga ki ngā ratonga whaitake pērā i ngā ratonga
whakahaumanu nō te mea e kake ake ana te rahi o ngā ratonga tuihono. Ko ētahi atu momo
whakamahinga ko te nekenga me te tiakitanga hoki o te raraunga e tautoko ana i ngā pakihi me
ētahi atu rāngai, hei tauira ko te ikiiki me te pūngao. Ko te mutunga anō, he nui tana
whakaawenga i ngā wāhanga e whā o te ora: ko te Ōhanga, Pāpori, Ahurea, me te Taiao.

I ēnei rā, he tino pai te tūranga o te rāngai ina whakaōritengia ki ērā atu ratonga e āhei ana i ngā
tāngata o Aotearoa. E mariu ana tana wāhi ki te whakaōritengia ki ērā atu o ngā whenua i te
OECD, ā, e tino pai ana ngā hua ki ērā atu rāngai hanganga. E tae atu ana te rāngai ki te mutunga o
tētahi wā hurihuri, arā, o te whakatakoto i te taura kaka ōmata huri noa i te motu. Ina oti te
hōtaka, hei te mutunga o te tau 2022, 87% o ngā tāngata o Aotearoa e whai āheinga ana ki te
ipurangi taura kaka ōmata, ā, ko Aotearoa tētahi whenua i te OECD ka riro hei motu kei te
taumata mō te āhei o ngā tāngata ki te whakamahi ipurangi taura kaka ōmata. Ina whakaarotia te
tūranga ā-ao o Aotearoa i te tekau tau i taha ake nei, me te whakahirahira hoki o te honohono i
tētahi motu tū taratahi, whai rawa hoki, koia hoki he paetae mīharo rawa atu tēnei.

Tērā tonu ia ngā take e aukati ana i ngā tāngata o Aotearoa i te whakapiki ake i ō rātou ake ora,
ahakoa te pai o te whanake o te rāngai. Tē taea e te katoa te āhei ki ngā ratonga whitimamao.
Tērā pea ko ētahi o ngā take e pēnei nei te tūāhua ko te korenga o ngā taputapu, me ngā
pūkenga, o te whakapono, o te manawa, tae atu ki te utu o te hononga.

I tētahi rāngai e whakaawetia ana e te moni punga tūmataiti, ehara i te mea ka whai hua ki te
whakarato hanganga e ngāwari ana ki te āhei. E tino rongo ana ngā hapori tuawhenua huri noa i
te motu i tēnei. Ahakoa he nui tonu ngā whakawhanaketanga i oti ai i te mahi ngātahi a te
Karauna me ngā pakihi tūmataiti, me te tuaritanga hoki o te hanganga, kāore i te mārama he aha
te pae tawhiti hei whakatika i te āhei ki te hono ki te ipurangi i ngā hapori tuawhenua.

Nō te putanga mai o te Kowheori-19 kua miramira te hiranga o ēnei ratonga. Ko te hunga e awere
ana i te āhei ki te hono ki te whitimamao kāore rā i āhei ki te whakamahi i ngā ratonga whaitake
pērā i te whakahaumanu me te mātauranga. Nō te piki ake o te whirinaki a te ao ki te ipurangi, ka
riro tonu ko te awere tahiko hei taiepa e aukati ana i te āhei ki te whai wāhi ki te ōhanga me te
pāpori.

I te rāngai nei, tē ai he mutunga o te haerenga. Nō te whanake haere o ngā hangarau me te
totohe whakakakao ki te raraunga kua mea kia whakawhanaketia ngā momo hangarau pēnei i te
5G, he momo hangarau e horaina ana puta noa i te motu nei. Ka haere tonu ēnei momo hangarau
ki te whakapātaritari i ngā whāititanga o ngā āhuatanga e taea ana i tētahi hononga ipurangi.

I te whakawhanake haere o ngā hangarau, me ngā taupānga pērā i te ‘Internet-of-Things (IoT), me
te whakarerekē tonutanga anō hoki o te āhua o tō tātou ao, ka piki ake te hiranga o te haumaru
me te parenga ki ngā tuma ā-ipurangi. Ahakoa tērā, he wā tino whakaihiihi, he wā tino
whakahirahira hoki tēnei i te hītoria o te hanganga whitimamao o Aotearoa. Ka haere tonu te āhei
ki te hono hei mea tautoko i tō tātou pāpori, ahurea, taiao, ōhanga hoki, ā, he tino whakahirahira
kua oti kē ngā tautuhinga te whakarite mō te hanganga whitimamao hei whakarato i ngā hiahia,
me te ora hoki, o ngā tāngata o Aotearoa i te anamata.

State of Play: Telecommunications                                                            Page: 5
2 Context
Horopaki
2.1 Who we are and what we do
The New Zealand Infrastructure Commission, Te Waihanga is working to improve New
Zealanders’ lives through better infrastructure. It aims to lift the level at which infrastructure is
planned and delivered, taking a strategic approach so that we maximise the social return on our
collective dollar, and stand well prepared in the face of an uncertain future.

Our Māori name, Te Waihanga, means a cornerstone, or to make, create, develop, build,
construct, generate. Te Waihanga therefore reflects the significance of long-term planning in
shaping New Zealand’s future.

A major part of this work is the development of a 30-year strategy for infrastructure. The strategy
will look ahead to 2050, and consider how infrastructure might support the environmental, social,
cultural and economic wellbeing for all New Zealanders. This will be delivered to the government
in September 2021, and will set out how we can make sure our investment in infrastructure
delivers what we need, where we need it and at the right time.

2.2 About our sector State of Plays
We understand that our infrastructure works together - it is a system of systems. Our roads carry
pipes and powerlines, and they connect to homes, workplaces and schools. For this reason, our
strategy will focus on cross-cutting themes rather than infrastructure sectors in isolation.
However, we believe that it’s important we understand the infrastructure we have today, why we
have what we have, and how it’s already contributing to New Zealanders’ wellbeing.

Our sector State of Plays are the result of desktop research, augmented by insights from our
survey of infrastructure asset owners, and engagement with sector experts. These reports will be
updated over time. We want to improve the picture as our understanding grows and different
elements come in to focus.

2.3 Our next steps
As well as continuing to build on our picture of the State of Play, next steps include building our
understanding of future trends and likely challenges, including climate change, incorporation of
Mātauranga Māori, demographic change, and the role of technology. We will look at what our
way of life might be 30 years from now. Based on all of this, we will begin to make
recommendations as to how infrastructure might support New Zealand’s future wellbeing.

We’ll share our thinking on what will be included in the strategy, focusing on the cross-cutting
themes that affect all sectors, the opportunities and challenges we can expect in the future, as
well as our initial recommendations and options for consideration.

This will then be followed by a draft strategy that firms up our thinking on recommendations and
provides greater detail as well as the evidence base behind them. From there, we’ll develop the
document that goes to Ministers.

State of Play: Telecommunications                                                               Page: 6
2.4 Have your say
We’ll share our work as we go and are keen to hear what you think, starting now. Tell us what you
think about our State of Play reports – have we got it right or are there issues, information or
problems that we’ve missed?

You’ll also have the opportunity to comment on the draft strategy. We’ll be continually refining
and assessing our work based on the feedback we get from you and others.

State of Play: Telecommunications                                                           Page: 7
3 About the telecommunications
system
E pā ana ki te pūnaha whitimamao
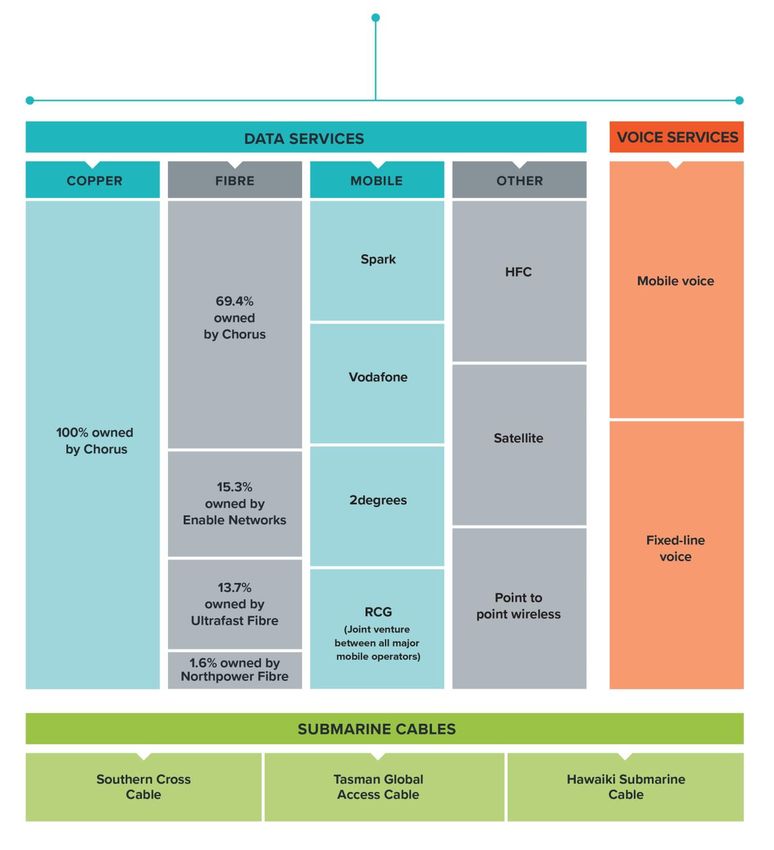
3.1 The services provided by telecommunications infrastructure
Telecommunications infrastructure covers the networks and associated property and equipment
that carry voice and data between users across New Zealand and to other parts of the world. This
includes:
• Voice services: 2 1F
o Copper network
o Mobile voice networks (3G and 4G)
• Data services:
o Broadband internet services:
▪ Fibre network
▪ Copper network (VDSL and ADSL)
▪ Fixed wireless
▪ HFC (hybrid fibre-coaxial)
▪ Point-to-point wireless
▪ Satellite
o Mobile data network:
▪ 3G
▪ 4G
▪ 5G
o Radio spectrum
o Submarine communications cables
o Data storage.
The connectivity of ideas and information provided by telecommunications infrastructure is
important for our society, culture, and economic growth. It connects families, whanau, and
communities across the country, New Zealand businesses domestically and to international
markets, enables the virtual provision of health services, and provides a vast number of other
services including the frictionless movement of data across sectors like transport and agriculture.
The services and corresponding infrastructure are shown in Figure 1 below.
2 Whilst today they remain somewhat discrete, we are observing the convergence between voice and data
services onto the same network. Where they were discrete networks in the past, voice services are
increasingly served via data that includes functionality like video calling.
State of Play: Telecommunications Page: 8Figure 1: Telecommunications infrastructure and corresponding services
Source: New Zealand Infrastructure Commission, Te Waihanga
As data is increasingly becoming an essential ingredient in a productive economy, the importance
of services provided by telecommunications infrastructure has grown substantially relative to
other sectors over the past decades. The National Bureau of Economic Research (NBER) in the US
notes that investment in digital infrastructure has grown the fastest of all sectors and roughly
tenfold from the 1980s to 2017. 3 A similar trend has been observed in New Zealand, with
2F
3
Jennifer Bennett, Robert Kornfield, Daniel Sichel and David Wasshausen, “Measuring Infrastructure in
Bea’s National Economic Accounts” National Bureau of Economic Research. 27446, p.4-33. DOI
10.3386/w27446
State of Play: Telecommunications Page: 9investment in telecommunications 4th in the OECD, proportional to GDP 4 at $1.7b in 2018/19. 5
3F 4F
This highlights how connectivity has permeated through society and crystallised into significant
investment.
Covid-19 highlighted the importance of telecommunications infrastructure, supporting work from
home as well as the migration of essential services like education and heath from in-person to
virtual. However, the pandemic also highlighted concerns around the digital divide, illustrated by
the Ministry of Education having to arrange internet connections and devices for households that
lacked connectivity. 6 While the digital divide has other facets not directly related to infrastructure
5F
such as skills, motivation, and trust, there are affordability and access issues that highlight service
inequality. 7 These issues are more likely to affect lower socio-economic communities, rural
6F
communities, Māori, seniors, people with disabilities, migrants, and those who have previously
been incarcerated.
3.2 Physical assets
There is a wide range of infrastructure needed to provide voice and data services, and it is
dependent on factors such as geography, economic feasibility, and the level of service desired.
Voice services are predominantly supplied by two networks: the fixed line network and mobile
voice network. The first landlines arrived in New Zealand in 1881, and was followed by the
development of a copper network that, at its peak, covered 98% of the country. 8 In recent
7F
decades, three mobile networks have been built by Spark (previously Telecom), Vodafone, and
2degrees.
In the last decade, there has been a transformation of telecommunications assets consistent with
step changes in technology. Since 2011, nearly 30,000km of fibre optic cable has been rolled out
covering roughly 83% of New Zealand 9 - see appendix four for more information. This is predicted
8F
to increase to 87% by 2022 which will deliver high-speed broadband services. 10 Voice services are
9F
also available through the fibre network.
Modern mobile infrastructure is also foundational in telecommunication service provision.
Loosely, these networks work by providing connectivity through cellular towers making use of the
radio spectrum, with spectrum bands dependent on the technology. Currently, mobile coverage is
4
New Zealand Telecommunications Forum, Key Trends in New Zealand Telecommunications: 2020 Industry
report. tcf-industry-report-2020-final-update-oct-2020-single-pages-lr.pdf, 2020. p.24.
5
Commerce Commission, Annual Telecommunications Monitoring report.
https://comcom.govt.nz/__data/assets/pdf_file/0021/212763/2019-Annual-Telecommunications-
Monitoring-Report-Revised-version-12-March-2020.pdf, 2019. p.18.
6
“Internet access, computers and printed learning resources”, Ministry of Education, last modified 24
November 2020. https://www.education.govt.nz/covid-19/distance-learning/internet-access-computers-
and-printed-learning-resources/.
7
Woods, Dr Megan. “Digital Inclusion Blueprint.” Digital Inclusion Blueprint. Accessed August 2020.
https://www.digital.govt.nz/dmsdocument/113-digital-inclusion-blueprint-te-mahere-mo-te-
whakaurunga-matihiko/html.
8
“The future of the copper network” Chorus, accessed August 2020. https://www.chorus.co.nz/copper-
network.
9
The Treasury, Quarterly Connectivity Update. p.5.
10
The Treasury, Quarterly Connectivity Update. p.4.
State of Play: Telecommunications Page: 10available where over 95% of the population live and work but is expected to grow to 99.8%
following several government initiatives (see Appendix five). 11 10F
There are other technologies and infrastructure that provide connectivity depending on the
situation. Mobile infrastructure can also offer wireless broadband through fixed wireless. Other
technologies like point-to-point wireless and hybrid-fibre coaxial technologies are also available at
specific locations across New Zealand.
There has been recent investment in New Zealand’s data storage infrastructure. There are now
numerous data centres across the country located in Auckland, Hamilton, Wellington, and
Christchurch operated by organisations like Spark and Datacom. 12 11F
All of these services are enabled by three submarine fibre optic links that connect New Zealand to
the world. 13
12F
Where fixed-line and mobile services aren’t practical, connectivity can also be provided by
satellite.
3.3 Capital flows
The relationship between natural capital and telecommunications infrastructure is relatively
simple, raw materials are used to produce physical assets. This includes the steel, copper, fibre
optics, as well as the land required to deliver services. Once the infrastructure is established, it
again consumes natural capital for maintenance and operation.
The consumption of human capital is in the form of expertise to deliver the complex technology
required to operate and maintain a national telecommunications network. This requires a
significant and highly skilled workforce across the country. Unlike natural capital, connectivity is
additive for human capital through enabling knowledge and skills. It is a key enabler for work,
study, and recreation as was highlighted during the lockdown period of the Covid-19 pandemic.
In a similar vein to human capital, the use of social capital is reasonably unclear, although
institutional stability is needed to provide any infrastructure service. However,
telecommunications infrastructure makes a significant contribution to social capital. The
connectivity of whanau, friends, and businesses is an essential ingredient in enabling our cultural
identity, customs, values, and interests.
The flows of financial capital are well-defined. Both public and private financial capital is sourced
from a diverse base and invested across the country. These monies are then blended with physical
capital – the equipment, factories etc. – in the creation of the infrastructure we use. There is also
capital flow in the fees charged for the consumption of services.
3.4 Wellbeing
Telecommunications has a broadly positive impact across the 12-wellbeing domains defined in
the Living Standards Framework shown in Figure 2. There are no instances where a domain was
11
“Mobile Blackspots” Crown Infrastructure. Accessed August 2020.
https://www.crowninfrastructure.govt.nz/blackspots/what/.
12
“Cloudscene – Find data centers and cloud service providers”, Cloudscene. Accessed August 2020.
https://cloudscene.com/market/data-centers-in-new-zealand/all.
13
“Cable Landing Stations in New Zealand”, Submarine Networks.
https://www.submarinenetworks.com/stations/oceania/new-zealand. Accessed November 2020.
State of Play: Telecommunications Page: 11thought to be negatively impacted. However, it is important to note, these benefits may not be
felt equally across New Zealand.
Figure 2: Impact of connectivity on the 12-wellbeing domains
Source: New Zealand Infrastructure Commission, Te Waihanga
Statistics New Zealand also measures over 100 indicators of social, economic, and environmental
wellbeing. Under current wellbeing, two indicators are most relevant to the services offered by
telecommunication infrastructure.
The first indicator, loneliness, is assessed across a two-year frequency and recorded at 16.6% of
New Zealanders aged 15 and over feeling lonely at least some of the time in the last four weeks in
2018. This is up from roughly 14% in 2014, however marginally lower than 17% in 2016. This
loneliness is most acutely felt by young people, female, Māori, and Asian peoples. 14 13F
Contact with family/ whānau and friends is the second key indicator that is relevant to
telecommunication. However, this indicator is still under development.
14“Wellbeing data for New Zealanders”, Stats NZ. https://wellbeingindicators.stats.govt.nz/. Accessed
August 2020.
State of Play: Telecommunications Page: 12There has been growing global collaboration on data sovereignty of indigenous peoples. In New
Zealand this is led by Te Mana Raraunga whose purpose is to enable Māori data sovereignty and
to advance Māori aspirations for collective and individual wellbeing. 15
14F
The Department of Internal Affairs (DIA), as part of their work on digital inclusion, maintain an
individual’s wellbeing is increased by being digitally included. 16 Those who do not participate
15F
digitally are missing out on opportunities and services that are only available to those who do.
This is reinforced by evidence from the UK and the Good Things Foundation, which showed that
people who were digitally included had higher earning potentials, saved time, and had a higher
likelihood of employment. For example, the report estimated time savings enabled by financial
and government transactions online would be worth £1.1 billion to the UK economy by 2028. 17 16F
Whether it’s data or connectivity, it is clear that the services provided by telecommunications
infrastructure are fundamental in enabling the wellbeing of New Zealanders, and if anything, our
reliance on telecommunications infrastructure will increase in the future.
15
“What we do”, Te Mana Raraunga. Accessed August 2020.
https://www.temanararaunga.maori.nz/kaupapa.
16
“Digital Inclusion Outcomes Framework”, Digital Government. Accessed August 2020.
https://www.digital.govt.nz/dmsdocument/167~digital-inclusion-outcomes-framework/html.
17
Digital Government, “Digital Inclusion Outcomes Framework”.
State of Play: Telecommunications Page: 134 What shapes the sector today?
He aha ngā whakaawenga ki te
rāngai i ēnei rā?
4.1 Current ownership and governance of telecommunications
infrastructure in New Zealand
New Zealand’s telecommunications sector dates to the 1800s, when the government’s first
telegraph network emerged. The New Zealand Post Office became the lead agency for
telecommunications and was responsible for the first telephone exchange in Christchurch in 1881.
The Post Office would remain responsible for telecommunications until the 1980s, at which time
Telecom New Zealand was created as a separate government-owned entity. In 1989, the sector
was one of the first in the world to be deregulated leading to the privatisation of Telecom. 18 17F
Today, New Zealand’s telecommunications sector includes a number of privately-owned
companies, with government-led investment now often blended with private capital to provide
infrastructure.
The Ultra-Fast Broadband (UFB) initiative dates back to 2008 in response to global
telecommunication trends in Southeast Asia and the relative low quality of internet in New
Zealand. The initiative aimed to provide 75% of New Zealanders with broadband connections
offering 100Mbps download speeds and 50Mbps upload speeds. This precipitated major changes
in the telecommunications sector. 19 18F
Firstly, to deliver UFB, Crown Fibre Holdings (CFH) was established to manage the $1.7 billion
government investment in ultra-fast broadband. CFH then contracted expertise to deliver the
project on a public-private partnership basis including private co-investment. In 2017, CFH was
given additional responsibility relating to bulk housing infrastructure and consequently was
formally renamed and repurposed as Crown Infrastructure Partners (CIP). 20 19F
As part of the contracting process to deliver UFB, Chorus won 69.4% of the rollout, requiring
Telecom’s structural separation 21 in 2008, forming the separate companies of Spark and Chorus. 22
20F 21F
Spark became a provider of services (a retail service provider) and retained the mobile network,
with Chorus becoming a wholesale provider taking the majority of the existing infrastructure,
including Telecom’s copper network. 23 22F
18
“Telecom corporation of New Zealand limited”, Reference for Business, accessed November, 2020.
Telecom Corporation of New Zealand Limited - Company Profile, Information, Business Description, History,
Background Information on Telecom Corporation of New Zealand Limited (referenceforbusiness.com)
19
Fernando Beltran, “New Zealand’s Ultra-Fast Broadband Network” (University of Auckland, 2012).
20
“About”, Crown Infrastructure. https://www.crowninfrastructure.govt.nz/about/. Accessed August 2020.
21
Structural separation is where the entity is split into two new entities with completely separate legal
ownership.
22
“Chorus”, Ultra-Fast Broadband New Zealand. Accessed November 2020 https://ufb.org.nz/broadband-
providers/chorus/.
23
New Zealand Herald, “Plenty of pomp as Chorus and Telecom Part.” Accessed November 2020.
https://www.nzherald.co.nz/business/plenty-of-pomp-as-chorus-and-telecom-
part/QOJJYOAKB5IQPB6KLJ2C2S6M5Y/.
State of Play: Telecommunications Page: 14Consequently, New Zealand’s copper network, which reaches 98 percent of premises and forms
the basis of fixed-line phone, dial-up, and ADSL and VDSL internet, is owned by Chorus. The
network is open for unbundling and open access, meaning other service providers can rent lines
and obtain services from Chorus in order to provide their own retail broadband services.
Chorus is a publicly listed company in which the government retains a stake in the form of equity
and debt instruments under the contractual arrangements relating to the UFB’s deployment and
the initial $929 million of government capital that went into UFB rollout.
Together, the UFB, fixed-wireless, and mobile programmes are growing both access and the
quality of telecommunications infrastructure. They are being driven through several partnerships
between the government’s Crown Infrastructure Partners, Chorus, and three other Local Fibre
Companies (LFCs):
1. Northpower Fibre, a joint venture between CIP and Northpower Limited, provide 1.6 -
percent of the network. Northpower Fibre is still 50 percent owned by Crown
Infrastructure Partners and 50 percent owned by the Northpower. Northpower are
owned by a community trust and the local lines company (electricity distribution
business) based in Whangarei. 24 23F
2. Enable Networks, a joint venture between Crown Infrastructure Partners and Enable
Services Limited (Christchurch City Council) provides 15.3 percent of the network. Crown
Infrastructure Partner’s stake has been bought out by Christchurch City Holdings Limited
(CCHL) meaning 100 percent is owned by the council through CCHL; 25 and 24F
3. UFF was originally structured the same as the other LFCs until Waikato Networks Limited
(WEL Networks Ltd 85 percent and Waipa Networks Ltd 15 percent) acquired Crown Fibre
Holdings interest prior to the rollout of UFB2. The business was sold to First State
Investments Ltd in May 2020. 26 UFF provides 13.7 percent of the network. 27
25F 26F
In 2017, CIP assessed that 90,000 rural homes and businesses would not be able to access
broadband at speeds greater than 20Mbps. This resulted in the Rural Broadband Initiative phase
two/Mobile Black Spots Fund (RBI2/MBSF) which has been rolling out rural fixed wireless and
mobile coverage. CIP has partnered with nine regional Wireless Internet Service Providers (WISPs)
and the Rural Connectivity Group (RCG) which is a joint venture subsidiary of the three mobile
network operators. 28 27F
24
“Opening up new opportunities for Northland”, North Power. Accessed November 2020.
https://northpower.com/fibre/about-us.
25 “Enable Networks”, UFB New Zealand. Accessed November 2020. https://ufb.org.nz/broadband-
providers/enable-networks-lfc/.
26 Gavin Evans, “WEL, Waipa sell fibre business to overseas investor for $854m”, New Zealand Herald,
May 12, 2020. https://www.nzherald.co.nz/business/wel-waipa-sell-fibre-business-to-overseas-
investor-for-
854m/MN6JPBV6AGRWXFD3YOQN6APNNE/#:~:text=Hamilton%2Dbased%20WEL%20and%20neig
hbouring,State%20Investments%20for%20%24854%20million.&text=First%20State%2C%20which
%20also%20owns,would%20remain%20headquartered%20in%20Hamilton.
27 “Ultrafast Fibre”, Ultra-Fast Broadband New Zealand. Accessed August 2020.
https://ufb.org.nz/broadband-providers/ultrafast-fibre-lfc/.
28
“What is the Rural Broadband Initiative phase two (RBI2)? Crown Infrastructure. Accessed August 2020.
https://www.crowninfrastructure.govt.nz/rural/what/.
State of Play: Telecommunications Page: 15The Provincial Growth Fund was also used as a tool to fund regional connectivity contributing
$40m towards RBI2/MBSF. 29 28F
Other technologies are also being used to provide broadband services where it is currently
difficult. In rural areas, Wireless Internet Service Providers or WISPs are offering faster broadband
by connecting to a central fibre link and transmitting signals through hilltop receivers to isolated
communities. 30 29F
The government has also made several interventions in recent years to address other more
specific areas of need:
• Fibre ‘backhaul’ links to be deployed on the West Coast and in Southland to improve
resilience of connectivity in these parts of New Zealand. 31 30F
• A marae connectivity programme, providing broadband to marae around the country as
well as equipment to take advantage of the broadband. 32 31F
• A $15m programme to improve capacity and backhaul on rural networks. 33 32F
• A $50m programme to boost broadband coverage and capacity across regional New
Zealand. 34 33F
Chorus and the LFCs act as wholesalers only for internet services, with Retail Service Providers
(RSPs) providing services to customers. The retail market for UFB services is competitive with
numerous RSPs providing services on the network. 35 34F
Aside from the new network being rolled out by RCG, the existing mobile networks are wholly
owned by Spark, Vodafone, and 2degrees. The underlying ownership of these major providers is
as follows:
• Spark is a publicly listed company on the New Zealand and Australian stock exchanges.
• Vodafone New Zealand is 50 percent owned by New Zealand company Infratil and 50
percent by Canadian company Brookfield Asset Management. The transaction completed
by Infratil and Brookfield took place in 2019 for NZ$3.4 billion. 36 35F
• 2degrees is 51.1 percent owned by Trilogy International a Canadian listed, American
based wireless telecommunications business, and a Dutch company, Tesbrit BV who own
29
“PGF to improve regional digital connectivity”, The Beehive. Accessed November 2020.
https://www.beehive.govt.nz/release/pgf-improve-regional-digital-connectivity.
30
Wispa New Zealand. Accessed November 2020. https://www.wispa.nz/.
31
“Better digital connectivity coming for West Coast and Southland”, The Beehive. Accessed August 2020.
https://www.beehive.govt.nz/release/better-digital-connectivity-coming-west-coast-and-southland.
32
“Digital connectivity boost for urban marae” https://www.beehive.govt.nz/release/digital-connectivity-
boost-urban-marae and “Investment to deliver better connected marae and communities in the regions”
https://www.beehive.govt.nz/release/investment-deliver-better-connected-marae-and-communities-
regions, The Beehive. Accessed August 2020.
33
“Rural broadband upgrade to boost COVID-19 recovery in remote communities”, The Beehive. Accessed
August 2020. https://www.beehive.govt.nz/release/rural-broadband-upgrade-boost-covid-19-recovery-
remote-communities.
34
“First project utilising $50 million ‘shovel ready’ fund for rural broadband announced”, The Beehive.
Accessed August 2020. https://www.beehive.govt.nz/release/first-project-utilising-50-million-shovel-ready-
fund-rural-broadband-announced.
35
“Broadband Providers”, Ultra-Fast Broadband New Zealand. Accessed November 2020.
https://ufb.org.nz/broadband-providers/
36
“Infratil announces acquisition of Vodafone New Zealand”, Infratil, May 14 2019. Accessed November
2020. https://infratil.com/for-investors/announcements/2019/infratil-announces-acquisition-of-vodafone-
new-zealand/.
State of Play: Telecommunications Page: 1649.9 percent. 37 The Hautaki Trust historically owned 10 percent of the business but in
36F
2017 when Trilogy International listed on the Toronto Stock Exchange, Hautaki exchanged
its shares in 2degrees to shares in Trilogy International. 38, 39
37F 38F
There are three major international fibre submarine cables that connect New Zealand to the
world. They are: 4039F
• The Southern Cross Cable. The first major international submarine cable that connected
New Zealand to the USA in 2000. It was the only major cable connecting New Zealand
between 2000 and 2018. It is roughly 30,500 km long, connects to Australia through
Whenuapai, and to Hawaii from Takapuna. It is owned by Southern Cross Cables Limited,
a partnership between telecommunications providers in NZ, Australia, and the US. Spark
owns a 38 percent interest in the cable. 41
40F
• The Tasman Global Access (TGA). A 2,288 km cable connecting New Zealand to Australia,
landing in Raglan. It is owned by Spark, Vodafone, and Telstra and was commissioned in
2017.
• The Hawaiki Submarine Cable. A 15,000 km cable connecting NZ to the US from
Mangawhai. It was commissioned in 2018, with ~NZ$455 million of capital privately
sourced. 42 The government supported the development of the cable through REANNZ,
41F
who were an anchor tenant for cable when it was launched. 43 42F
37
Rebecca Howard, “Tesbrit gets greenlight to buy up to 49.9% of 2degrees”. NBR, July 31 2017.
https://www.nbr.co.nz/article/tesbrit-gets-greenlight-buy-499-2degrees-should-opportunity-arise-b-
205905.
38
“2degrees founder ousted”, Otago Daily Times, July 10 2012. https://www.odt.co.nz/business/2degrees-
founder-ousted.
39
“About”, Te Huarahi Tika. Accessed August 2020. https://www.thtt.co.nz/about-hautaki.
40
Submarine Cable map
41
Winston Qiu, “Southern Cross NEXT Cable System Overview”, Submarine Networks, March 1 2020.
https://www.submarinenetworks.com/en/systems/trans-pacific/southern-cross-next/southern-cross-next-
cable-system-
overview#:~:text=Southern%20Cross%20Cable%20Limited%20was,Southern%20Cross%20NEXT%20subsea
%20cable.
42
Tom Pullar-Strecker, “$445m NZ internet cable opens for traffic”. Stuff News, July 20 2018.
https://www.stuff.co.nz/business/105624605/445m-nz-internet-cable-opens-for-traffic.
43
“Hawaiki seals new capacity deal with REANNZ to boost global research collaboration”, REANNZ, February
20 2020. https://www.reannz.co.nz/news-and-events/hawaiki-seals-new-capacity-deal-with-reannz-to-
boost-global-research-collaboration/.
State of Play: Telecommunications Page: 17Major international cables, as well as domestic fibre links are shown in Figure 3 below.
Figure 3: New Zealand's submarine cable network
Source: Submarine cable map
Another major international cable set for construction is the Southern Cross Next. This will
operate in a similar partnership through Southern Cross Cables Limited, with the New Zealand
interest funded by Spark. The cable will be approximately 14,000km, will connect New Zealand to
the US and Pacific through Takapuna, and is expected to be ready for service in 2022.
Domestically, the Acqualink Cable is another major piece of telecommunications infrastructure.
The cable was built in 2001 and connects major international fibre links in Auckland down to the
Waikato, Taranaki, Manawatu-Wanganui, Wellington, Marlborough, and Canterbury. The cable is
owned by Vodafone.
Spark also owns and operates a 212 km submarine link between Nelson and Levin, that was
commissioned in 2001. 44 43F
44
Te Huarahi Tika “About”.
State of Play: Telecommunications Page: 18A summary of New Zealand’s telecommunications ecosystem is show in Figure 4 below.
Figure 4: New Zealand’s telecommunications ecosystem
Another piece of important telecommunications infrastructure in New Zealand, is the radio
spectrum, defined as electromagnetic energy of frequencies lower than 3000 GHz. It is managed
by the Crown, through MBIE, on behalf of the public 45. Management of the radio spectrum is
44F
essential given the potential for interference with critical lifesaving infrastructure, for example air
traffic radar.
45
Radio Spectrum Management. Accessed November 2020. https://www.rsm.govt.nz/.
State of Play: Telecommunications Page: 19Frequency bands are planned for various uses depending on the purpose and technology. The
government licences and auctions frequency bands for periods of up to 20-years allowing
telecommunication services to be provided. From an infrastructure perspective, this is crucial in
the provision of 3G, 4G, and 5G mobile infrastructure. 46 There is a direct trade-off between
45F
spectrum and amount of infrastructure needed to provide services – the more spectrum the
fewer towers and vice versa.
In 2019, the Government gave the go-ahead for the 3.5 GHz band to be used for 5G networks,
with spectrum rights being allocated in 2020 though auction. Due to Covid-19, the auction was
cancelled, and a direct allocation process followed. This resulted in the offers of 40 MHz to Dense
Air, 60 MHz to Spark, and 60 MHz to 2degrees, with Vodafone having long-dated existing
ownership of a 3.5 GHz spectrum band. 47 46F
Dense Air is an international telecommunications company based in London, operating spectrum
assets in Europe, Australia, and New Zealand. They are a carrier of carriers, meaning they sell
wholesale services, agnostic of retail carrier across 4G LTE and 5G spectrum. In addition to 5G
spectrum, in 2018 Dense Air acquired 70MHz of spectrum in the 2.5Ghz band on the secondary
market, with the intention of offering complementary services to the existing mobile network
operators. 48
47F
The Government has allocated part of the 3.5 GHz spectrum for Māori use. 49 48F
4.2 The regulatory and policy environment
Given the risk of monopolistic behaviour in pockets of the telecommunications sector, the
Commerce Commission plays an important regulatory role. The regulatory regime has evolved in
recent years to reflect technological changes and has regulatory frameworks dedicated to
particular subject areas such as fibre wholesale services or copper line wholesale services.
For copper line services, the Commerce Commission enforces a wholesale regulatory framework
with service determinations, which includes setting the maximum price Chorus may charge retail
service providers (RSPs) and the minimum service quality standards to be met. Pursuant to the
Telecommunications Act 2001, 50 wholesale prices are set by the Commerce Commission. 51 For
49F 50F
several years, the network has been open for unbundling, which is where retail service providers
install their own equipment in the network and only rent the bare copper lines.
In 2018, there were changes in the regulatory environment providing for the deregulation of the
copper network from 1 January 2020 in those areas where fibre is available, and the right for
Chorus to withdraw copper services subject to a number of consumer protections being in place.
46
“Spectrum licensing and management rights”, Radio Spectrum Management. Accessed November 2020.
https://www.rsm.govt.nz/about/our-work/spectrum-licensing-and-management-rights/.
47
“Preparing for 5G in New Zealand”, Radio Spectrum Management. Accessed November 2020.
https://www.rsm.govt.nz/projects-and-auctions/current-projects/preparing-for-5g-in-new-zealand/.
48
“Mobile Market Study – Findings”, Gale et al. Commerce Commission. p.31. Accessed August 2020.
https://comcom.govt.nz/__data/assets/pdf_file/0022/177331/Mobile-Market-Study-Findings-report-26-
September-2019.PDF.
49
“Government enables early access to 5G spectrum”, The Beehive. Accessed November 2020.
https://www.beehive.govt.nz/release/government-enables-early-access-5g-spectrum
50 Telecommunications Act 2001.
51
“Commission’s role in telecommunications”. Commerce Commission. Last modified 25 November 2019.
Accessed November 2020. https://comcom.govt.nz/regulated-
industries/telecommunications/commissions-role-in-telecommunications.
State of Play: Telecommunications Page: 20For fibre connectivity, a wholesale regulatory framework has been introduced that will replace
the price controls through contracts that Local Fibre Companies and Chorus have with the Crown
through CIP.
Chorus is subject to price/quality regulation which sets out the maximum allowable revenue they
can earn. However, within that revenue cap there are no regulatory controls on Chorus’ price
discrimination ensuring consumers are protected from monopoly powers. The other Local Fibre
Companies (Enable Fibre, Northpower Fibre, and Ultrafast Fibre) are subject to information
disclosure – the same regulations as airports – which essentially makes financial/forecast
information public. This form of regulation does not stop excessive profits but is a deterrent. 5251F
Similar to copper, the government had concerns about continued investment and innovation by
the monopoly. This has been addressed via a number of interdependent mechanisms. Structural
separation, competition from competing technologies, a building blocks regime and an obligation
to unbundle.
At a high-level there are numerous network layers stemming from the Open System
Interconnection model. For the purposes of unbundling, only the first two layers are of
significance: Layer 1 being the physical fibre connection and Layer 2 being bitstream access or the
movement of data between points. 53 An example of Layer 2 services would be a fibre plan of
52F
100Mbps download, and 20Mbps upload that sits ‘above’ the physical fibre connection, Layer 1.
Unbundled fibre services sit on top of Layer 1 meaning the retail service providers rent the
physical connection but can develop bespoke Layer 2 services that support differentiated retail
services to customers.
The unbundling that is being offered provides for an RSP to invest and use their own electronics –
avoiding the cost of paying Chorus’ electronics. 54 This requires the RSP equipment to be co-
53F
located with Chorus’. Fibre unbundling has yet to be implemented and depends on commercial
negotiation by network operators in the industry. 55 54F
Although there is a lower level of regulation than broadband, targeted regulation across mobile
infrastructure has enabled competition to develop and facilitated the entry of the third mobile
network operator (2Degrees) into the market. The Commerce Commission monitors performance,
development, and competition in the telecommunications market and conducts inquiries/
reviews where appropriate.
Regulation specifically governs the auctioning of spectrum bands under the Radiocommunications
Act 1989, overseen by Radio Spectrum Management at MBIE. Under the Act, property rights were
established for spectrum bands. Following a review in 2005, there is a defined spectrum auction
design that ensures a competitive allocation. 56
55F
52 “Fibre price-quality path and information disclosure”. Commerce Commission. Last modified 26 October
2020. Accessed November 2020. https://comcom.govt.nz/regulated-
industries/telecommunications/projects/fibre-price-quality-path-and-information-disclosure.
53
“Untangling Fibre Unbundling”, The Download. Accessed August 2020. https://thedownload.co.nz/our-
stories/untangling-fibre-unbundling/.
54
Sarah Putt. “Fibre network unbundling, the New Zealand way”, Computer World, June 25, 2020.
https://www.computerworld.com/article/3563927/fibre-network-unbundling-the-new-zealand-way.html
55
“Unbundled layer 1 fibre service”, Commerce Commission, last modified October 26, 2020
https://comcom.govt.nz/regulated-industries/telecommunications/projects/unbundled-layer-1-fibre-
service.
56
Ministry of Economic Development. Spectrum Auction Design in New Zealand. Wellington: Ministry of
Economic Development, 2005.
https://www.rsm.govt.nz/assets/Uploads/documents/8380f2d85e/spectrum-auction-design-in-new-
zealand.pdf.
State of Play: Telecommunications Page: 21The New Zealand Telecommunications Forum (TCF) is the industry association, representing a
large number of agents in the telecommunications sector. 57 It coordinates the development of
56F
access codes for regulated services and industry contributions on regulatory matters.
4.3 Market structure and how assets are financed
Because the fibre and copper line markets have monopoly power characteristics, these markets
are regulated. The private capital made available for investment is therefore highly sensitive to
the rate of financial return that the regulated pricing allows. Currently this results in a blend of
public and private capital combining to charge users for the infrastructure they use.
In rural areas where there are only small numbers of users and it is not economically feasible for
the private sector to build the network infrastructure needed, the Government has funded the
Rural Broadband Initiative Phase 2 to increase number of households with broadband
connectivity. These households pay for the infrastructure they use, but in combination with a
taxpayer subsidy.
From an economic perspective this is efficient with users effectively paying for the level of service
they use – internet plans for greater levels of data are generally more expensive. However, this
increasingly presents a socio-economic issue where cost is a barrier to access infrastructure.
The effect unbundling will have on the market is yet to be seen. The unbundling of the copper
network led to some competitive intensification. However, the wholesale price was regulated,
and while there is a pathway to regulate the wholesale price of fibre in a similar way, the
expectation is that a ‘fair-price’ will be established on a commercial basis. Similarly, given New
Zealand’s relatively advanced global position in household fibre, the technology and economics of
fibre unbundling is not yet well developed.
For mobile services, competition has improved over the course of the last decade after the
entrance of 2degrees in 2009, with benefits to consumers in terms of choice, quality, and price –
the price elements shown in Figure 5 below. This results in light regulation with the Commerce
Commission reporting on price and quality in comparison to international standards. However,
there remain significant barriers for new entrants into the mobile market, specifically around
spectrum, the sharing of roaming services, and access to infrastructure. 58 Despite this, Dense Air
57F
have entered the market, acquiring spectrum and offering services to the three mobile network
operators to address coverage pockets of their networks. 5958F
57
“Member Brands”, The New Zealand Telecommunications Forum. Accessed August 2020.
https://www.tcf.org.nz/consumers/about-us/member-brands/.
58
Ministry of Business, Innovation and Employment, “Announcements on the future of communications
regulation” accessed via https://www.beehive.govt.nz/sites/default/files/Fact%20sheet%20-
%20Announcements%20on%20the%20future%20of%20communications%20regulation.pdf. Accessed
August 2020. p.6.
59
Gale et al, “Mobile Market Study – Findings” p.31.
State of Play: Telecommunications Page: 22You can also read