Communications and media in Australia Supply and use of services, 2019-20
←
→
Page content transcription
If your browser does not render page correctly, please read the page content below
Communications and media in Australia
Supply and use of services, 2019–20
APRIL 2021
Canberra
Red Building
Benjamin Offices
Chan Street
Belconnen ACT

PO Box 78
Belconnen ACT 2616
T +61 2 6219 5555
F +61 2 6219 5353

Melbourne
Level 32
Melbourne Central Tower
360 Elizabeth Street
Melbourne VIC

PO Box 13112
Law Courts
Melbourne VIC 8010
T +61 3 9963 6800
F +61 3 9963 6899

Sydney
Level 5
The Bay Centre
65 Pirrama Road
Pyrmont NSW

PO Box Q500
Queen Victoria Building
NSW 1230

T +61 2 9334 7700 or 1800 226 667
F +61 2 9334 7799

Copyright notice

https://creativecommons.org/licenses/by/4.0/

With the exception of coats of arms, logos, emblems, images, other third-party material or devices protected by a trademark, this content is made available
under the terms of the Creative Commons Attribution 4.0 International (CC BY 4.0) licence.

We request attribution as © Commonwealth of Australia (Australian Communications and Media Authority) 2021.

All other rights are reserved.
The Australian Communications and Media Authority has undertaken reasonable enquiries to identify material owned by third parties and secure permission
for its reproduction. Permission may need to be obtained from third parties to re-use their material.

Written enquiries may be sent to:
Manager, Editorial Services
PO Box 13112
Law Courts
Melbourne VIC 8010
Email: info@acma.gov.au
Contents

About this report                                                   1

Executive summary                                                   2

At a glance – access to services                                    4

Telecommunications                                                  6
Key findings                                                        7
Telecommunication providers in the Australian market                8
Carriers and carriage service providers                                 8
Telecommunications infrastructure                                   8
National Broadband Network                                              8
NBN during the COVID-19 pandemic                                  10
Satellite services                                                10
Satellite filings and licences issued by the ACMA                 11
Foreign space objects                                             11
Improved spectrum access and pricing                              11
Submarine cables                                                  12
Mobile services                                                   13
3G networks                                                       13
4G networks                                                       13
5G networks                                                       13
Access to mobile voice and broadband services                     13
Mobile numbers                                                    14
Internet and voice services in Australia                          14
Internet services in Australia                                    14
Fixed-line voice services                                         15
Payphones and geographic, smart and other numbers                 16
Payphones                                                         16
Smartnumbers                                                      17
Geographic numbers                                                17
Other numbers                                                     18
Domain name registrations                                         18
International trends                                              18
Financial performance                                             18
Market developments                                               20

                                                       acma   |   iii
Contents (Continued) Viewing and listening 22 Key findings 22 Television licensing, ownership and control 23 Licensing 23 Ownership and control 23 Television viewing 23 SVOD market share 25 Radio licensing, ownership and control 25 Licensing 25 Ownership and control 26 Radio and podcast listening 26 Cross-media ownership 28 Foreign owners of media assets 28 Financial performance 29 Market developments 29 Measurement – TV and radio 31 Digital platforms 32 Regulatory environment 32 Google and Facebook market position 32 Use of social media and search 33 Online advertising revenue 34 Market developments 35 Glossary 38 Appendix A – Ownership and control of commercial television services in Australia 2019–20 44 Appendix B – Ownership and control of commercial radio services in Australia 2019–20 45 Appendix C – Number of long-term community radio broadcasting licences by community interest 47 acma | iv
About this report
The Communications and media in Australia—Supply and use of services 2019–20
provides information on the supply and use of communications and media services in
Australia during 2019–20. It covers the communications infrastructure and systems
that underpin and shape the adoption of technology in an ever increasingly
interconnected environment.

Legislative basis
This report fulfills multiple legislative obligations under the Australian Communications
and Media Authority Act 2005. These include requirements to:
   report to and advise the Minister of Communications, Urban Infrastructure, Cities
   and the Arts in relation to the telecommunications industry
   make available to the public information about matters relating to the
   telecommunications industry
   inform ourselves and advise the minister on technological advances and service
   trends in the broadcasting, internet and datacasting industries.

ACMA research
The Australian Communications and Media Authority (ACMA) research program
considers how current and future developments in the communications and media
landscape will impact public interest outcomes and provides evidence to support
regulatory decisions.

Find out more about the ACMA’s research program.

                                                                              acma   |   1
Executive summary
This report’s findings draw attention to the ever-increasing use of products and
services delivered by the communications and media sectors in Australia. The report
also highlights developments in the digital platforms sector and the ACMA’s increased
regulatory responsibilities in 2019–20.
Mobile phones are the predominant device with which Australians connect to
the internet. Most data is downloaded through devices connected to fixed
networks. The rollout of 5G gained momentum.
The number of fixed internet subscriptions grew slightly (3%) in 2019–20 compared
to the previous year. The proportion of all fixed-line connections made to the
National Broadband Network (NBN) increased by 28% from 64% in June 2019 to
82% in June 2020.
Data consumption increased further during the COVID-19 pandemic, reaching a
monthly average of 330 GB per user in April 2020 (from 297 GB in June 2020).
Telstra and Optus commenced the rollout of their 5G networks with Telstra
deploying 1500 base stations by August 2020 and Optus deploying 800 by June
2020.
In December 2020, the Minister for Communications, Cyber Safety and the Arts
made a formal declaration that the NBN should be ‘treated as built and fully
operational’.
Free-to-air television viewing continued to fall with catch-up TV gaining in
popularity. The penetration of subscription video on demand (SVOD) services
also continued to grow while radio listening remained largely unchanged.
Advertising revenue increased for online, and declined for TV, radio, outdoor
and cinema.
There was no change in the number of commercial, subscription and long-term
community television licences in 2019–20. There were very small net changes in
the number of commercial and long-term community radio licences issued by the
ACMA (one additional of each in 2019–20).
The popularity of SVOD and pay-per-view services continued to grow, as did the
consumption of free-to-air (FTA) television via online catch-up services. The
consumption of FTA television (live or recorded) declined.
Three-quarters of Australians live in households with at least one SVOD service,
half have two or more.
Radio ownership and listening changed little, while an estimated 420 million
podcasts were downloaded. One in 5 Australians reported listening to a podcast in
the previous week (in June 2020).
Advertising revenue for print, TV, radio, outdoor and cinema declined in 2019–20.
Only online advertising reported increased revenue.
Digital platforms continue to grow in Australia and the ACMA is playing an
important role.
Google has approximately 95% of the search engine market in Australia. Among
the increasing number of Australians using social media (72% in June 2020, up
from 63% a year earlier), two-thirds reported that Facebook is the social networking
site they used most often (this figure excludes other sites owned by Facebook,
such as WhatsApp and Instagram).
2 | acmaOnline advertising received two-thirds of advertising revenue in Australia in 2019–
20. It is estimated that of every $100 spent by advertisers on online advertising in
2019, Google received $53 and Facebook $28.
Other new social platforms continue to gain popularity in Australia (such as Signal,
TikTok and Clubhouse).
acma | 3At a glance – access to services
NBN 7.44 million active NBN services in June 2020.
5G rollout reached around one-third of the Australian
5G rollout
population by June 2020.
Carrier licences 310 licensed carriers, up 1.3%.
Fixed-line phones 9.6 billion call minutes in 2019–20, down by half from
(voice calls) 2015–16.
Mobiles 69.9 billion call minutes in 2019–20, up 18% from 2015–
(voice calls) 2016.
8.2 million terabytes of data downloaded over fixed-line
Data
and mobile services in the 3 months to June 2020,
downloaded
compared to 6 million terabytes a year earlier.
Internet of Things (IoT) services in operation grew by 8%
IoT
in the 6 months to June 2020.
61% of Australians watched free-to-air TV in the
Television viewing – previous week, a decrease from 77% in 2017.
live and on demand 36% watched catch-up TV online, an increase from 19%
in 2017.
Subscription video 77% of Australian households now have at least one
on demand SVOD service, compared to 61% in 2017.
20% of Australians listened to a podcast in the last week
Radio and podcast in 2020.
listening 78% of Australians listened to FM radio and 34%
listened to AM in the last week.
72% of Australians used a social media platform in
Social networking
2020, with an average of 4 social networking sites.
4 | acmaUsing Google and Facebook products make up
Digital platforms
approximately 40% of Australians’ time spent online.
Online advertising received two-thirds (68%) of
advertising revenue in Australia.
Online advertising Of every $100 spent by advertisers on online advertising
(excluding classifieds), $53 went to Google and $28 to
Facebook in 2019.
acma | 5Telecommunications The telecommunications sector in Australia saw a range of achievements and challenges during 2019–20. The build of the National Broadband Network (NBN) approached completion and more than 1.7 million premises connected to the NBN for the first time – bringing the total of premises connected to 7.44 million. The number of mobile services (prepaid, postpaid and mobile broadband) declined slightly to 32.2 million, and the rollout of 5G gained pace. Australians continued to rely increasingly on their mobiles, with the time spent on mobiles for voice calls (69.9 billion minutes) 7 times greater than for fixed-line phones (9.6 billion minutes). The amount of call minutes has increased 18% for mobiles and halved for fixed line services between 2015–16 and 2019–20. The Statutory Infrastructure Provider (SIP) regime commenced on 1 July 2020. It ensures all Australians have access to superfast networks, which may be fixed-line, fixed wireless or satellite broadband connection. Access to superfast networks applies whether Australians are in an area served by the NBN or in an area served by an alternative superfast network. 2019–20 also brought significant challenges, including extensive damage to telecommunications infrastructure caused by bushfires, and localised interruptions to telecommunications services from severe storms in the greater Sydney area in February 2020. The global COVID-19 pandemic saw higher demands on telecommunications service networks (for example, remote work and schooling), with 8.2 million terabytes of data downloaded across the retail NBN, non-NBN fixed retail and mobile services networks in the June quarter of 2020. Financial reporting at 30 June 2020 highlighted that, while the effects of the COVID-19 pandemic resulted in consumers using more telecommunications services from home, there were also revenue pressures for telcos. This reflected consumers and small businesses spending less, reductions in international roaming revenue, and a fall in new consumers of local telecommunications services arriving in Australia. Retail network operators experienced lower margins as customers migrated to services delivered over the NBN. Over the reporting period, the telecommunications sector continued to innovate, with service offerings around the Internet of Things (IoT), cloud and edge computing, and software defined networks expanding. Several low earth and geosynchronous satellite trials that will provide broadband connectivity to remote areas were conducted ahead of expected commercial launches. The sector also saw merger and acquisition activity, such as the creation of the listed company, TPG Telecom Limited by a scheme of arrangement between TPG Telecom Limited and Vodafone Hutchison Australia Pty Limited. 6 | acma
Key findings
Mobile phones were the device most frequently used to connect to the internet.
Devices connected to fixed-line services carried the majority of data
downloaded.
   At 30 June 2020, there were around 32.2 million prepaid, postpaid and mobile
   broadband services in operation.
   There were around 7.9 million fixed internet subscriptions in Australia at 30 June
   2020, a small increase (3%) on the previous year. Services delivered over the NBN
   increased from 64% of all Australian fixed-line connections in June 2019, to 82% in
   June 2020.
   The trend for NBN internet plans to be high-speed wholesale plans (50 megabits
   per second (Mbps) or higher) continued. Seven in 10 (69%) Australian premises
   were on a high-speed plan in 2020, up from 16% in June 2017.
   Data consumption increased before and during the COVID-19 pandemic. Monthly
   average consumption per end user increased approximately 50% between June
   2018 and June 2020 (207 gigabytes (GB) to 297 GB per month). A combination of
   increased use due to the effects of the COVID-19 pandemic and network capacity
   discounts saw NBN data usage peak at 330 GB in April 2020. NBN Co Limited has
   since reported that peak data demand is returning to levels forecast before the
   pandemic.
   There were 26 Australian satellite filings in place with the International
   Telecommunication Union (ITU) that have completed the process for coordination
   and notification of satellite systems. This is unchanged from the previous year.
   Satellites for telecommunications services generally operate under space
   apparatus licences. Thirteen licensees hold nearly 400 space or space receive
   licences.
   During the COVID-19 pandemic, some telcos accelerated plans to manage
   customer queries online and use onshore call centre staff for more complex
   interactions.

Telcos are rolling out 5G, connecting increasing numbers of IoT services and
developing new products and services.
   The rollout of 5G, which began in 2019, expanded rapidly to over 2,300 sites
   deployed by Telstra and Optus by mid-2020.
   Technological developments enabled new forms of service delivery, including
   ‘software defined everything’, which combines cloud, 5G and edge technologies to
   create new revenue opportunities for telcos.
   The IoT as a mobile category also continued to grow, with the number of services
   in operation reaching 4.4 million in 2019–20.

                                                                           acma    |   7
Telecommunication providers in the Australian market
Carriers and carriage service providers
Carriers own and operate telecommunications networks and infrastructure. Carriage
service providers (CSPs) use carrier networks to provide services such as phones and
internet.1
At end of June 2020, there were 310 licenced carriers in Australia, a 1.3% increase on
the previous year. During 2019–20, the ACMA granted 29 carrier licences, 18 carriers
surrendered their carrier licences, and 7 carrier licensees were deregistered by the
Australians Securities and Investment Commission (ASIC) (Table 1).
Table 1: Number of carrier licences in Australia
2014–15 2015–16 2016–17 2017–18 2018–19 2019–20
Total in operation 229 249 275 292 306 310
Total granted 27 31 33 27 24 29
Total surrendered/ 4 11 7 8 10 25
cancelled
Source: ACMA.
A nominated carrier declaration (NCD) permits the owner(s) of one or more network
units2 to nominate a carrier to be responsible for the units so they can be used to
supply services to the public. At 30 June 2020, there were 89 NCDs in force. In 2019–
20, the ACMA granted 5 NCDs, up from 3 in 2018–19 and revoked 7, an increase of 2
on the previous year (Table 2).
Table 2: Number of nominated carrier declarations in Australia
2014–15 2015–16 2016–17 2017–18 2018–19 2019–20
Total in operation 79 84 90 93 91 89
Total granted 6 9 8 8 3 5
Total revoked 1 4 2 5 5 7
Source: ACMA.
The Telecommunications Industry Ombudsman (TIO) is the industry-based dispute
resolution scheme for small businesses and residential customers of carriers and
eligible CSPs. Carriers and eligible CSPs must join the TIO scheme.3
The TIO reported a total of 1,390 carriers and CSP members; 322 left and 194 joined
in the year to 30 June 2020.4
Telecommunications infrastructure
National Broadband Network
The NBN is the Australian Government initiative to upgrade Australia’s existing phone
and internet infrastructure through government investment. NBN Co Limited (NBN Co)
is the Commonwealth of Australia-owned government business enterprise responsible
for rolling out the NBN. Further information can be found in the government’s
Statement of Expectations.5
8 | acmaAt the end of June 2020, there were over 7.4 million NBN wholesale residential
broadband services6 in operation, with fibre-to-the-node (FTTN) the most common
network access type, accounting for 2.9 million services (Table 3). Of the different
types of NBN connections in the multi-technology mix, the strongest growth in the year
to June 2020 was in fibre-to-the-curb (FTTC) services, which more than doubled to
680,000 services. Hybrid fibre coaxial (HFC) cable services increased by 87.5% and
satellite NBN services reduced marginally in 2019–20, as alternative connection types
became available in regional areas.
Table 3: Active NBN network residential access services by technology type
Jun 2017 Jun 2018 Jun 2019 Jun 2020 2019–20
change (%)
Fibre-to-the-premises 1,125,477 1,266,788 1,372,540 1,495,441 9.0
(FTTP)
Fibre-to-the-building 63,450 103,886 140,447 201,253 43.3
(FTTB)
Fibre-to-the-node 906,662 2,010,080 2,648,564 2,944,059 11.2
(FTTN)
Fibre-to-the-curb 228,325 679,077 197.4
(FTTC)
Hybrid fibre coaxial 153,371 418,385 905,965 1,698,797 87.5
(HFC)
Fixed wireless 187,754 244,035 289,603 324,910 12.2
Satellite 74,678 90,617 95,808 96,584 0.8
Total 2,511,392 4,133,791 5,681,252 7,440,121 30.9
*Residential access services are Traffic Class 4 services, which are mass market broadband services.
Source: ACCC, NBN Wholesale market indicators reports, 2017–20.
Services delivered over the NBN increased from 64% of all Australian fixed-line
connections in June 2019, to 82% in June 2020.7
The proportion of NBN internet services on higher speed plans increased significantly
in recent years, more than quadrupling from 16% in June 2017, to 69% in June 2020
(Table 4).
Table 4: Proportion of premises on high or low speed wholesale internet NBN
plans (%)
Jun 2017 Jun 2018 Jun 2019 Jun 2020
50 Mbps* or higher 16 45 64 69
25 Mbps or lower 84 55 36 31
*Megabits per second.
Source: NBN Co Monthly Progress Reports, June 2018 and June 2020 accessed December 2020.
The volume of data downloaded over the NBN continued to increase. Monthly
downloads, measured at average data per end user, reached 297 GB at June 2020,
an increase of nearly 40 GB (15%) from the previous year (Table 5).
acma | 9Table 5: NBN monthly average data consumption per end user (GB)
Jun 2018 Jun 2019 Jun 2020
Downstream 207 258 297
Source: NBN Co, media statement 2 December 2019, accessed December 2020; NBN Co, Corporate Plan
2021, p 35, accessed December 2020.
NBN during the COVID-19 pandemic
On 18 March 2020, NBN Co announced that all Australian internet providers could
order additional network capacity (Connectivity Virtual Circuit or CVC) of up to 40% for
3 months from 23 March, at no extra charge.8 This measure was implemented to assist
internet providers deal with the expected increase in demand brought about by
COVID-19 response measures including lockdowns and working from home. NBN Co
then extended the offer for 40% additional CVC to 30 November 2020.9
In October 2020, NBN Co reported that data demand was starting to return to forecast
levels of growth following higher usage earlier in the year.10 NBN monthly average
data consumption for January to June 2020 shows the peak usage for the reporting
period occurred in April 2020 (Table 6).
Table 6: NBN monthly average data consumption per user (GB)
Jan 2020 Feb 2020 Mar 2020 Apr 2020 May 2020 Jun 2020
290 282 312 330 314 297
Source: NBN Co, Corporate Plan 2021, page 30.
In June 2020, the government announced that the NBN build was 99% complete.11
There were 11.73 million premises ready to connect to the NBN by 30 June 2020.12
Statutory Infrastructure Provider regime
The Statutory Infrastructure Provider (SIP) regime (introduced 1 July 2020) is intended
to ensure that all premises around Australia have access to either a superfast fixed-
line, fixed wireless or satellite broadband connection.
NBN Co is the default SIP for most Australian premises. Other carriers can also be
SIPs; for example, they may have contracts to connect premises in apartments,
shopping centres or other properly developments.13
The ACMA maintains a national register of SIPs and their service areas.14 The register
lists carriers that are installing networks or have completed networks. It includes the
location of superfast broadband service areas and the SIP that is responsible. It is
updated as new carriers enter the market and commence network installations, or
acquisitions or takeovers result in SIPs leaving the market. There were 17 SIPs
(including NBN Co) at 30 June 2020.
Satellite services
Australia relies on satellite services for remote areas of the country, for both
communications and television services. Multiple new operators are launching or
planning to launch fleets of low earth orbit (LEO) satellites that will offer broadband
connectivity to more remote parts of countries around the world, including Australia.
One example, SpaceX, has started testing a beta service from its Starlink LEO
constellation in the US, and Canada has started the regulatory approvals process in
Australia to offer its service locally in the future.15
10 | acmaThere are many other opportunities for expansion in the Australian space sector for
activities such as weather monitoring, science experimentation and IoT networks for
remote industries such as mining and agriculture.
Satellite filings and licences issued by the ACMA
Before a satellite can use spectrum and orbital resources, it requires an associated
‘satellite filing’. A filing is a tool to obtain – through ITU, a specialised agency of the
United Nations – international recognition of these resources. Activity in Australia in
2019–20 included16:
Australian satellite operators with filings (new or existing): 8.
Australian operators with one or more satellites operating: 5
The total of Australian satellite filings that met the ITU ‘bringing into use’
requirements: 26 (the number of operational satellites is less than the number of
satellite filings as the frequency ranges used by a single satellite can be covered by
multiple satellite filings), unchanged from the previous year
satellite filing coordination managed by the ACMA: 48
satellite filings approved by the ACMA: 6 (not including modifications to existing
filings).
Satellites for telecommunications services (satellite phones, satellite broadcast
services, satellite IoT and satellite-based internet services) would generally be
expected to be licensed under ‘space’17 and ‘space receive’18 apparatus licences.
During 2019–20, there were 3 space and 4 space receive apparatus licences issued
by the ACMA. Based on analysis of radiocommunications licence data for 2019–20,
there were 128 space and 258 space receive licences operational, held by a total of
13 licensees.19
Foreign space objects
In January 2020, the ACMA made the Radiocommunications (Foreign Space Objects)
Amendment Determination 2020 (No. 1) to include Kepler Communications Inc.,
SpaceX Services Inc. and Swarm Technologies Inc. These companies can apply for
space and space receive apparatus licences to operate services in Australia.20
Improved spectrum access and pricing
In February 2020, the ACMA made an additional 2.6 GHz of spectrum available,
expanding the amount of continuous spectrum available for ubiquitous earth stations
terminals to:
2.05 GHz in the 10.7–12.75 GHz band
2.5 GHz in the 17.7–20.2 GHz band
1.7 GHz in the 28.3–30 GHz band.
The ACMA also decreased licence taxes for space licences in the 10.7–11.7 GHz,
18.2–18.8 GHz and 19.3–19.7 GHz bands to the minimum amount.21
Information on licences and holders is available on the ACMA Register of
Radiocommunications Licences.
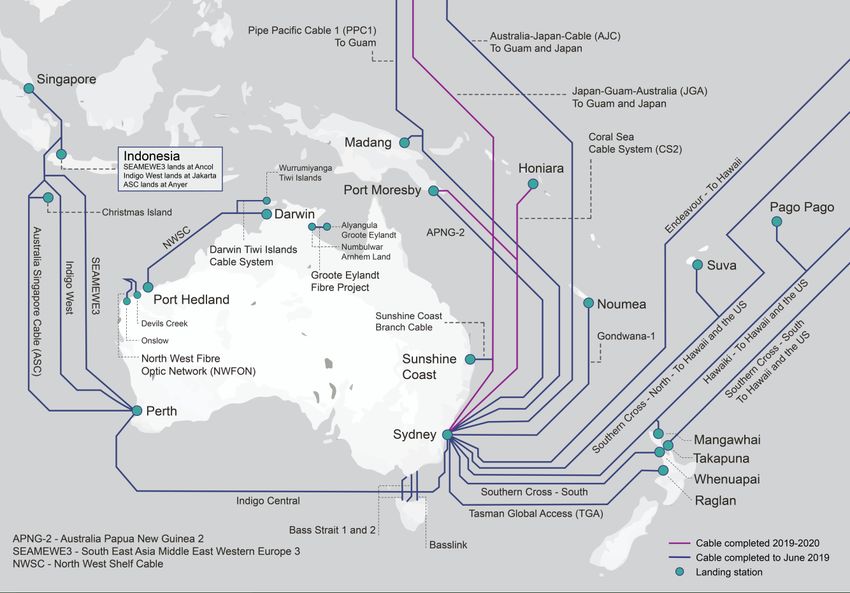
acma | 11Submarine cables
Submarine cables are critical for global communications, carrying most international
data and voice traffic. At the end of June 2020, there were 13 submarine cables
connecting Australia to the rest of the world22 (Figure 1).
In 2019–20, increasing demand for bandwidth saw 4 international cable projects in
Australia completed or underway:
The Coral Sea Cable System was completed in December 2019, connecting
Australia to the Solomon Islands and Papua New Guinea.23
The Japan–Guam–Australia cables (north and south) were completed mid-2020,
connecting Australia with Guam and Asia.24
Due for completion by January 2022, the Southern Cross NEXT cable (SCN) is an
international submarine optic fibre cable network that will connect Australia to New
Zealand, Fiji, Samoa. Tokelau, Kiribati, and California.25
Sub.CO is building the Oman Australia Cable (OAC) from Perth, Australia to
Muscat, Oman, due for completion by December 2021. It will be the only express
cable connecting Australia to the Middle East region.26
Figure 1: Australian region submarine cables 2019–20
Note: Southern Cross North and Southern Cross South are counted as one international submarine cable.
Sources: Cable data: ACMA; map data: snazzy.com.
12 | acmaMobile services
In 2019–20, network operators continued to phase out their 3G networks, 4G
supported much of Australia’s mobile data and voice connections, and coverage for
5G began to roll out.
3G networks
In October 2019, Telstra announced it will be switching off its 3G mobile network in
June 2024.27 Before its merger with TPG, Vodafone had been phasing out 3G
connectivity on its 2100 MHz spectrum and upgrading it to 4G. Vodafone (now part of
TPG Telecom) has reserved the 900 MHz spectrum for its 3G network28, and has
committed to keeping its 3G network operation to support regional communities.29
4G networks
During 2019–20, mobile network operators continued to expand their 4G network
coverage. Developments included:
Telstra announced in February 2020 that it, in partnership with Ericsson, was
deploying new technology that will double the range of a 4G mobile base station to
200 kilometres. This technology will provide additional support to regional and
remote communities.30 As Telstra winds down its 3G network, it is reusing its
2100 MHz spectrum to boost capacity on its 4G network.31
Optus expanded access to voice over Long-Term Evolution (VoLTE) and wi-fi
calling on its 4G mobile network to mobile virtual network operator (MVNO)
postpaid customers from July 2020. These services are additional to existing data
services.32
The former TPG had been providing mobile services to its customers using the
Vodafone network since 2015, the merger announcement highlighted over 5,600
mobile sites and the coverage of their 4G network.33
5G networks
Telstra’s rollout of its 5G network encompassed around one-third of the Australian
population, covering selected areas of 53 cities and regional towns at 30 June 2020.34
Telstra reported over 1,500 5G sites in August 2020.35 When its 3G network is shut
down, Telstra will repurpose this spectrum to support its 5G network.36
In February 2020, Optus launched the world’s first 2300 MHz and 3500 MHz spectrum
5G dual-band production network, partnering with Ericsson and Samsung.37 By June
2020, Optus had 800 fixed wireless sites in Australia.38
Vodafone, in partnership with Nokia, started the rollout of its 5G network in the first half
of 202039 and in March 2020, announced its first live 5G sites were in Parramatta,
NSW.40
Access to mobile voice and broadband services
At June 2020, there were over 32.2 million mobile voice and broadband services in
operation in Australia, a decrease of 1.6% compared with June 2019. Among
Australia’s largest providers (Telstra, Optus, Vodafone and Vocus), a little over half of
mobile services (17.6 million or 54.7%) were postpaid in June 2020. Prepaid services
were used by 30% of mobile phone users (Figure 2).
acma | 13Figure 2: Mobile voice and broadband services in operation by product
category (million)
Source: ACCC, Internet Activity RKR data 30 June 2019 and 2020, published 14 October 2020. Internet
Activity RKR data 30 June 2019 and 2020.
The mobile virtual network operators (MVNO) segment grew slightly in the year to
June 2020, supplying 15% of the total services in operation, up from 13% the previous
year and 11% in June 2017.41
The number of IoT services in Australia continued to grow, reaching an estimated
4.4 million in June 2020, an increase of 8% from December 2019.42
Mobile numbers
During 2019–20, CSPs were allocated 3,300,000 new mobile numbers, a 27%
increase from 2,600,000 new mobile numbers allocated in 2018–19.
Internet and voice services in Australia
Internet services in Australia
At June 2020, there were over 40 million internet services in operation (SIO) in
Australia, the majority using mobile networks.43 Table 7 provides a snapshot of fixed
and mobile internet SIO by technology type. The completed rollout of the NBN had a
significant impact on the number of non-NBN fixed-line services. ADSL and non-NBN
cable SIO more than halved in the year to June 2020, while non-NBN fixed wireless
services declined to a third of their June 2019 levels.
14 | acmaTable 7: Internet subscriptions by technology type (million)
Jun 19* Jun 20
Non- ADSL 1.863 0.912
NBN
Cable 0.774 0.329
Satellite 0.032 0.03
Fixed wireless 0.003 0.001
Fibre 0.152 0.164
NBN 4.905 6.501
Total fixed internet subscriptions (non-NBN and NBN) 7.729 7.935
Mobile handset (prepaid and postpaid) 27.535 27.454
Mobile broadband 5.227* 4.794
Total mobile internet subscriptions 32.762* 32.248
Total internet subscriptions 40.491* 40.183
* Previously published data revised down by ACCC.
Note: RKR data is obtained from selected providers and will not reflect the entire number of services in
operation.
Source: ACCC Internet Activity RKR data as at 30 June 2020, table 2.
According to the Australian Competition and Consumer Commission (ACCC), the
volume of data downloaded in Australia for the June 2020 quarter (retail NBN, retail
non-NBN and mobile services) was 8.2 million terabytes, an increase of more than
one-third compared to the June 2019 quarter (6 million terabytes).44
Fixed-line voice services
The use of fixed-line voice services continues to decline. At 30 June 2020, there were
6.17 million fixed-line voice services in operation (bundled and standalone)45, a 0.6%
decrease from 6.21 million in June 2019 (Table 8).46
Among Australian adults, 39% (or 7.8 million people) had a fixed-line phone at home
in the 12 months to June 2020, compared to 68% in June 2016 (Figure 3).47
Telstra was the largest provider of fixed-line voice services in Australia during 2019–
20, accounting for 46% of the market, with TPG holding 28% and Optus 24%. Vocus
held 2% of the market.48
ACMA research, Telco consumer experience: Australian adults, households and
businesses showed that while households with fixed-line voice services may have a
service in operation, it may be unconnected to a handset, or never used. For further
information, see also our research Mobile-only Australia: living without a fixed line at
home.
acma | 15Table 8: Fixed-line voice services in operation (million)
Jun 16 Jun 17 Jun 18 Jun 19 Jun 20 2019–20
change (%)
Services in 8.89 8.83 8.51 6.21 6.17 –0.64
operation
Note: Figures have been revised by the ACCC and include Telstra, Optus, TPG and Vocus services
Source: ACCC, Communications Market Report 2019-20, 11 December 2020; June 2016–19, ACCC data
collected from providers stated in the Div.12 Record Keeping Rules.
Figure 3: Australians with a fixed-line phone service at home (%)
100
75
68
64
50 58
49
39
25
0
2016 2017 2018 2019 2020
Base: Australians aged 18 years and over, in the 12 months to June of each year.
Source: Roy Morgan Single Source.
The decline in use of fixed lines for voice services is supported by ACCC data, which
shows fixed-line voice call minutes halving in the last 4 years, falling to 9.6 billion
minutes in 2019–20, from nearly 20 billion in 2015–16.49
The use of mobile phone voice minutes was 7 times greater than fixed lines –
69.9 billion minutes in 2019–20, an increase of 18% since 2015–16.50
Payphones and geographic, smart and other numbers
Payphones
Under the Universal Service Obligation (USO), Telstra is responsible for ensuring
reasonable access to a working payphone for all Australians on an equitable basis,
regardless of where they live or work.51
The number of public payphones has gradually decreased over time. At 30 June 2020,
there were 15,495 public Telstra payphones, 397 fewer than 30 June 2019. Table 9
provides a breakdown of Telstra payphones by state and territory.
16 | acmaTable 9: Distribution of Telstra payphones by state and territory
State/Territory 30 Jun 2019 30 Jun 2020 2019–20
change (%)
New South Wales 4,769 4,640 –2.7
Victoria 2,984 2,893 –3.0
Queensland 3,846 3,761 –2.2
South Australia 1,355 1,334 –1.5
Western Australia 1,695 1,661 –2.0
Tasmania 480 471 –1.9
Northern Territory 653 629 –3.7
Australian Capital Territory 110 106 –3.6
Total 15,892 15,495 –2.5
Source: Telstra.
Information on the location of payphones is available in Telstra’s payphone register.
Smartnumbers
The Numbering System sells the rights of use to smartnumbers (numbers starting with
13, 1300 and 1800, where the number may have a valuable pattern or spell a word). In
2019–20, the rights of use to 4,073 smartnumbers were sold, 91 fewer than 2018–19.
Geographic numbers
Also known as local numbers, geographic numbers are used to provide access to local
phone services, and related voicemail and fax services.
In 2019–20, CSPs were allocated 10,196,400 geographic numbers, more than triple
the previous year’s total. The increase was mostly due to 2 large allocations of
numbers (to one new and one existing CSP). Following discussion on the efficient use
of numbers with a CSP, the return of approximately 3 million numbers is expected in
2020–21. A total of 3,421,200 numbers were surrendered in 2019–20; no numbers
were surrendered in 2018–19 (Table 10).
In 2019–20, the ACMA withdrew 2,190,600 numbers from CSPs that had ceased
operation or no longer required them.
Table 10: Geographic number allocations
2015–16 2016–17 2017–18 2018–19 2019–20
Geographic 3,083,200 7,020,800 6,069,000 3,073,200 10,196,400
numbers allocated
per annum to CSPs
Geographic 0 1,996,400 956,200 0 3,421,200
numbers
surrendered
Source: ACMA.
acma | 17Other numbers During 2019–20, 3 interconnection and routing codes, and 2 mobile network codes were allocated, along with one international signalling point code. Domain name registrations On 30 June 2020, there were over 3.18 million domains being managed by .au Domain Administration Limited (auDA). auDA is a not-for-profit organisation responsible for the administration and registration of ‘.au’ domain names. From March 2020 onwards, there was a spike in the registration of new domains, with over 56,100 registered in June 2020 compared to nearly 41,500 in June 2019. This increase was driven by businesses and organisations shifting to online platforms following COVID- 19 restrictions on access to physical premises.52 International trends In December 2019, Australia was ranked 19th among OECD countries for fixed broadband subscriptions and 8th for mobile broadband subscriptions, per 100 inhabitants. The rankings in December 2018 were 23rd for fixed broadband and 7th for mobile broadband. The OECD website has information on fixed broadband subscriptions and mobile broadband subscriptions. Another international point of comparison is the Ofcom International Broadband Scorecard 2020. It documents a range of aspects of fixed and mobile broadband to measure relative performance for 18 countries. Of the countries included, Australia ranks 5th for the volume of fixed data consumption (72.6 GB per capita per month), behind the UK, USA, Singapore and New Zealand. Australia also ranked 5th in 2019, with 61 GB per capita per month data consumption. For mobile data consumption, Australia is similarly ranked (5th), with 9.3 GB per capita per month, behind Taiwan, Sweden, South Korea and the USA. Australia ranked 6th in 2019, with 5.3GB per capita per month data consumption.53 Financial performance Telstra’s revenue fell by 6% to $23.7 billion for the 2019–20 financial year, while Optus’s revenue declined by 3% to $8.9 billion. The newly merged Vodafone and TPG, TPG Telecom, reported pro forma revenue of $2.7 billion for the 6 months to 30 June 2020, which cannot be compared to the previous reporting period. Vocus reported a 6% revenue decline (Table 11). 18 | acma
Table 11: Revenues by Australia’s largest service providers, ($ billion)

Provider            2015–16        2016–17         2017–18       2018–19         2019–20       2019–20
                                                                                                change
                                                                                                   (%)
Telstra                25.91           26.01           25.85         25.26           23.71           –6.1
Optus                    9.26            8.59            8.86          9.23           8.95           –3.0
Vodafone                 3.33            3.44            3.61          3.51
TPG                      2.39            2.49             2.5          2.48
TPG                                                                                  2.71*
Telecom*
Vocus                    .083            1.82            1.88          1.89           1.78           –5.8
Note: TPG’s and Vodafone Hutchison Australia’s merger was completed in June 2020, creating TPG
Telecom.
*TPG Telecom’s figure for June 2020 is for 6 months only and is the pro forma figure, which simulates what
the group’s revenue would have been had the merger taken effect at the start of 2020.
Source: Standard & Poor’s Capital IQ platform an offering of S&P’s Global Market Intelligence; Revenue for
last 12 months on years ended 30 June, derived from company financial reports, media releases; TPG
Telecom, Financial Results Commentary, 4 September 2020, p 4.

Market share varies for different types of services. Telstra holds the largest market
share for wholesale NBN, mobile and fixed-line voice services (Figure 4).

Figure 4: Market share 2019–20 (%)

Source: ACCC Communications Market Report 2019-20, figures 3.1, 3.13 and 5.1.

For the mobile market, the market share for prepaid and postpaid subscriptions for
2019 (prior to the Vodafone and TPG merger) is shown in Figure 5.

                                                                                             acma    |   19
Figure 5: Market share for postpaid and prepaid mobiles, Dec 2019 (%)
Source: GlobalData mobile operator forecast Australia, September 2020.
Market developments
Telcos with networks experienced a reduction in margins when customers migrated
to services delivered over the NBN.
The continuing rollout of 5G created the opportunity for fixed wireless 5G to be
offered as an alternative to the NBN.
The COVID-19 pandemic resulted in a tightening in cashflow for many telcos.
Revenue from sources such as international roaming and prepaid services
purchased by international students declined.
In light of the challenges associated with offshore call centres, the pandemic also
accelerated plans by some telcos to manage some customer queries online, while
using onshore call centre staff for more complex interactions.
The capital investment required to bring 5G coverage to all of Australia has seen the
industry look to different options to support deployments. Globally, mobile operators
are exploring the sale of mobile infrastructure to private equity investors to free up
equity in those assets. In Australia, Singtel Optus is planning to sell its towers54, while
Telstra has restructured into 3 divisions, with all physical network assets now under
the control of Telstra InfraCo, providing flexibility to explore asset sales in the future.
Alternative methods to cut the costs of deployments include partnerships and
infrastructure sharing. For example, the guidelines for the latest round of the Mobile
Black Spot Program encourage potential participants to consider innovative ways to
deliver improved coverage.55
20 | acmaSpotlight on: Mobile Black Spot Program
The Australian Government has committed $380 million to the Mobile Black Spot
Program to invest in telecommunications infrastructure to improve mobile phone
coverage and competition in regional and remote Australia.
The program is supported by co-contributions from state and local governments,
mobile network carriers (Optus, Telstra, TPG Telecom and Field Solutions Group),
businesses and local communities.56
Since the program’s introduction in 2014–15, total investment of more than
$836 million has funded the delivery of 1,229 new base stations across Australia.57
More information on the Mobile Black Spot Program is available on the Department of
Infrastructure, Transport, Regional Development and Communications website.
Merger and acquisition activity during the reporting period included:
TPG Corporation Limited and Vodafone Hutchison Australia Pty Limited entered
into a scheme of arrangement to create TPG Telecom Limited at the end of June
2020. This created the opportunity for the new entity to sell fibre products to former
Vodafone customers and mobile products to former TPG customers.
Uniti Group undertook several acquisitions in the year to 30 June 2020, purchasing
LBNCo, OPENetworks and 1300 Australia and establishing private fibre
infrastructure and specialty services businesses. The purchase of OptiComm was
proposed during the reporting period but not finalised by 30 June 2020.
Spotlight on: Software defined everything
Software defined everything (SDE) is an emerging trend in telecommunications
markets. It is an all-encompassing term that refers to the virtualisation of functions
previously conducted by hardware. Telecommunications markets use software defined
network (SDN) technologies to achieve cost savings and service agility through
automation. SDE technologies are being combined with cloud58, 5G and edge
technologies to drive better application performance and improve security.59
In Australia, most of the recent developments in this space relate to competition in
providing network services to business customers. Telcos are using software-defined
wide area network (SD-WAN) technology to connect users to the same network
through computers and devices over large geographic areas. As software (like cloud
technologies) replaces physical equipment such as servers, costs for storage,
equipment and maintenance are reduced.
GlobalData reports that 60% of enterprises have adopted SD-WAN technology.60
acma | 21Viewing and listening
In 2019–20, broadcasters faced significant challenges. The cancellation of many local
and international sporting events, and significant reductions in advertising spending
impacted their reach and revenue.
The period from June 2019 to June 2020 saw falls in use of free-to-air (FTA)
television, while uptake of subscription video on demand (SVOD) and broadcast video
on demand (FTA catch-up services, or BVOD) increased. Competition for viewers
increased with new entrants in the SVOD market, such as Acorn TV (expanded in
Australia in September 2019), Disney + (November 2019), Apple TV+ (November
2019) and Britbox (announced launch in June 2020, commenced November 2020).
Following the launch of their sporting SVOD service Kayo in November 2018, Foxtel’s
entertainment SVOD service Binge was launched in May 2020.
Radio broadcasters saw changes in listening behaviour due to the effects of the
COVID-19 pandemic, although increases in at-home listening largely balanced out
reductions to in-car listening. In June 2020, one in 5 Australian adults had listened to a
podcast in the previous week, and over 420 million podcasts were downloaded in
2020.
Advertising revenue for print, TV, radio, outdoor and cinema declined in the year to
30 June 2020, after modest increases to total spend in the previous 3 years. Online
advertising proved most resilient as the only channel to receive more revenue in
2019–20 compared to the previous year.
Key findings
Small changes were observed around licensing and changes of control.
No change in the numbers for commercial, subscription and long-term community
television licences in 2019–20.
Some changes of control, mainly in commercial radio, including the acquisition by
Nine Entertainment Co. Holdings Ltd (Nine Entertainment) of the remainder of
Macquarie Media Limited and acquisitions by Southern Cross Media Group
Limited.
Very small net change in the number of commercial and long-term community radio
licences issued by the ACMA (one additional of each in 2019–20).
Advertising revenue for television and radio fell during 2019–20 despite the
increasing popularity of catch-up TV.
As a result of decline in advertising revenue (except for online), listed broadcasters
in Australia reported declines in revenue between 2019 and 2020, with the
exception of Nine Entertainment.
Total advertising revenue fell 6.2% in 2019–20 compared to the previous year in
nearly all categories – outdoor, cinema, print, radio and TV. Digital advertising
continued to increase its share of all advertising revenue.
The growth in the share of advertising revenue earned by BVOD is a form of digital
marketing that allows broadcasters to monetise the viewership by providing more
targeted digital advertising options.
Viewing and listening habits in Australia continue to evolve. Take-up of SVOD and
BVOD services increased over the period, while the growth in podcast popularity
saw more than 420 million downloaded over 2019–20.
22 | acmaServices that deliver television or radio programs only through the internet do not fall
within the definition of a ‘broadcasting service’ and are not regulated as such by the
Broadcasting Services Act 1992 (BSA). See the Broadcast Services (“Broadcasting
Service” Definition — Exclusion) Determination 2019.
Television licensing, ownership and control
Licensing
The number of commercial, subscription and long term-community television licences
in operation was unchanged during 2019–20 (Table 12).
Table 12: Number of broadcasting licences allocated in Australia
2017–18 2018–19 2019–20
Commercial television 69 69 69
Subscription television 2,835 2,835 2,835
Long-term community television 5 5 5
Trial community television (up to 12-months duration) 2 2 2
Source: Broadcasting licences | ACMA.
Ownership and control
The media control and diversity rules (set out in relevant legislation such as the
Broadcasting Services Act 1992) seek to limit the concentration of broadcasting
ownership and control within licence areas.
The Seven, Nine and Ten networks operate commercial television broadcasting
licences predominantly in metropolitan markets. Their programming is also made
available in regional markets through affiliation agreements with the regional television
licences controlled by Prime Media Group Limited, Southern Cross Media Group
Limited (Southern Cross), WIN Corporation Pty Ltd (WIN) and Imparja Television Pty
70
Ltd. Appendix A summarises ownership and control of these services in Australia.
There were no trigger events in 2019–20. The following regional, aggregated,
commercial television broadcasting licensees in Queensland, New South Wales,
Victoria and Tasmania must continue to broadcast minimum amounts of material of
local significance (local content) as defined by the Broadcasting Services Local
Programming Determination 2018 (Determination):
Seven Qld, Southern Cross and WIN TV in regional Queensland
NBN Ltd, Prime Television and WIN TV in northern New South Wales
Prime Television, Southern Cross and WIN TV in southern New South Wales
Prime Television, Southern Cross and WIN TV in regional Victoria
Southern Cross, WIN TV and Southern Cross/WIN joint venture in Tasmania.
Television viewing
The 2019–20 year highlighted a growing preference to watch video content on
demand rather than in linear form. The uptake of online subscription services (SVOD)
and BVOD continued to accelerate, while the viewership of live FTA television
declined (Figure 6). According to Roy Morgan, the number of Australians with
subscription television in their household increased by 6% from February to March
2020.
acma | 23Figure 6: Television or video watched last 7 days, Australian adults (%)
61
Free-to-air (live or recorded) 64
70
77
Online subscription service 55
49
(SVOD) 40
32
Other content on an online 40
43
platform such as YouTube 38
36
BVOD (Catch-up TV) 28
22
19
25
Movies/TV shows for free 25
17
17
Foxtel/other subscription TV 22
27
channels (live or recorded) 27
27
Watched or played games 11 2020
8
online 9 2019
3 2018
Pay-per-view service 3
3 2017
1
Base: Australian adults aged 18 and over.
Note: Other content online and watched or played games was not asked prior to 2018.
Source: ACMA annual consumer survey 2017–20.
In line with these viewing trends, three-quarters of Australians now live in households
with at least one SVOD service, with approximately half of all households having
access to 2 or more subscription services (49%) (Figure 7).
Figure 7: Australians living in a household with SVOD services (%)
Source: ACMA annual consumer survey 2017–20.
24 | acmaSVOD market share
As the number of SVOD services in Australia increased, the market share of the
earlier entrants declined. Netflix remains the predominant service in the Australian
SVOD market (Figure 8).
Figure 8: Market share, SVOD market in Australia (%)
53
Netflix 59
64
17
Stan 19
17
4
Disney+
3
Foxtel Play/Foxtel Now 5
5
3
Kayo 1
5
Amazon Prime Video 2
1
Apple TV+
4
Optus Sport 4 2019
3
10 2018
Others 10
10 2017
Source: GlobalData Subscription Video On Demand forecasts (reported by calendar year).
Radio licensing, ownership and control
Licensing
The number of radio licences in Australia changed little in the past year. In 2019–20:
commercial radio licences increased by one
long-term community radio licences increased by one, as a result of 4 new licences
coming into effect and 3 licences expiring (Table 13).
Table 13: Number of radio licences by type
Licence type 2017–18 2018–19 2019–20
Commercial radio 274 274 275
Long-term community radio 353 357 358
Temporary community radio* 104 105 95
* A maximum of 12-months duration.
Source: ACMA.
There was also minimal change in the number of community radio broadcasting
licences by area of interest. At 30 June 2020, there were 358 long-term community
radio broadcasting licences, compared with 357 in 2019. These continue to represent
a range of community interests, with 1 in 5 classified as representing the Indigenous or
Torres Strait Islander interest.
Appendix C shows the number of long-term community radio broadcasting licences by
community interest.
acma | 25Ownership and control Media control and diversity rules seek to limit concentration of broadcasting ownership and control within licence areas. In 2019–20, Southern Cross, Australian Radio Network Pty Ltd, Nova Entertainment Pty Ltd and Nine Entertainment owned most of the capital city commercial radio broadcasting licences. Southern Cross, Broadcast Operations Pty Ltd (Super Radio Network) and Grant Broadcasters Pty Ltd remain the 3 largest networks of regional commercial radio broadcasting licences. At 30 June 2020, 8 different networks (one fewer than the previous year) each controlled more than 6 commercial radio broadcasting licences. Together, these 8 networks control 236 licences out of a total of 261 commercial radio licences that are subject to the media diversity and control rules.61 The remaining 25 licences are held by 13 networks/owners, with each controlling 5 or fewer licences. Appendix B shows ownership and control of commercial radio services in 2019–20. During this period, there were 2 trigger events affecting 9 regional commercial radio licences. Six of those licences were previously affected by a trigger event. Local presence obligations ceased for 4 regional commercial radio. Radio and podcast listening While radio listening was broadly unchanged overall in 2019–20, the COVID-19 pandemic resulted in some shifts in listening habits. The early stages of the pandemic lockdown (April 202062) saw in-car listening decrease. The increase in listening at home more than offset the decline in in-car listening, with audiences growing between 5% and 9% in capital cities, particularly for daytime listening.63 FM radio remains most popular, with nearly 8 in 10 Australian adults (78%) listening in the previous 7 days in June 2020, unchanged in the last 4 years. Around a third of Australian adults (34%) listened to AM radio in the previous 7 days in 2020, unchanged in the last 4 years (Figure 9). 26 | acma
Figure 9: Australian adults who listened to the radio and podcasts in the past
          7 days (%)

    80 80 78 78

                      38 37
                              33 34

                                            19                                     20          2017
                                                 16 16
                                       14                 13 15 12 11                          2018
                                                                                               2019
                                                                                               2020
      FM radio          AM radio       Digital radio at   Radio online   Podcast
                                            home

Note: Listening to podcasts was not asked before 2020.
Source: ACMA annual consumer survey, 2017–20.

            Spotlight on: Podcasts in 2020
Australia is reported to have some of the highest rates of podcast listening in the
world.64

According to research commissioned by Commercial Radio Australia, over 420 million
podcasts were downloaded in Australia in 202065 while Deloitte reported a predicted
annual revenue for podcasting in Australia of A$47 million in 2020.66

The 5 most popular genres and numbers of downloads were:
1. radio shows: 101.3 million
2. true crime: 67.6 million
3. comedy: 63.5 million
4. news: 51.9 million
5. lifestyle and health: 33.4 million.

Many of the most popular podcasts were produced overseas, but locally produced
shows increased, with catchup of radio shows and true crime series prevalent.

With many channels hosting podcasts in Australia, there are no definitive ratings for
the most popular podcasts. Sources include the Australian Podcast Ranker from
Commercial Radio Australia and Chartable that reports on Spotify’s podcast activity.

                                                                                        acma   |   27
Cross-media ownership
In 2019–20, the following entities controlled 2 types of media assets in the same
market:
Southern Cross Media Group Limited controlled a combination of radio and
television broadcasting licences in 21 radio licence areas.
Nine Entertainment controlled 2 radio licences and a newspaper in Melbourne, and
2 radio licences and a newspaper in Sydney.
Seven Group Holdings Limited controlled a television licence and a newspaper in
Perth.
WIN Corporation controlled a radio and television licence in Wollongong.
Lachlan Murdoch, through his position as Co-Chairman of News Corporation and
interests in Nova Entertainment Pty Ltd, controlled 2 radio licences and an
associated newspaper in each of the Sydney, Brisbane, Adelaide, and Melbourne
metropolitan licence areas.
During the reporting period, the ACMA received notifications relating to 9 events
affecting the control of media operations, involving:
5 commercial television broadcasting licences
31 commercial radio broadcasting licences
1 associated newspaper.
There were also several ownership and control changes of media entities. Some were
the result of takeovers and mergers while others were a result of company
restructures. They included:
John Singleton and associated entities ceased to hold shares in Macquarie Media
Limited following an off-market takeover bid by Nine Entertainment. As a result,
they relinquished control of 7 commercial radio broadcasting licences (15 October
2019).
Southern Cross Media Group Ltd and associated entities acquired 9 Redwave
Media commercial radio broadcasting licences in Western Australia from Seven
West Media Limited (the Redwave licences) (31 December 2019).
Southern Cross Media Group Ltd acquired 2 commercial radio broadcasting
licences in the Carnarvon RA1 licence area from Hits Radio Pty Ltd (1 March
2020).
Crocmedia Pty Ltd (renamed to Sports Entertainment Network Pty Ltd) (SEN)
acquired commercial radio licence 6EL Bunbury RA1 from Southern Cross Media
Group Ltd (1 May 2020).
During 2019–20, the ACMA gave 2 formal warnings for late notifications of changes in
control.
Foreign owners of media assets
The ACMA must maintain a Register of Foreign Owners of Media Assets. The register
must include the information provided by foreign stakeholders and their interests in
Australian media assets. The register commenced on 1 March 2019.
At 30 June 2020, there were 92 registered foreign stakeholders in 138 Australian
media companies. During the reporting period, the ACMA received 222 foreign
stakeholder notifications.
View the Register of Foreign Owners of Media Assets.
28 | acmaYou can also read