CENSUS OF ALABAMA EYE CARE PROVIDERS - PAUL A. MACLENNAN, MPH, PHD CYNTHIA OWSLEY, PHD, MSPH KAREN SEARCEY, MPSH GERALD MCGWIN, JR., MS, PHD
←
→
Page content transcription
If your browser does not render page correctly, please read the page content below
Census of Alabama
Eye Care Providers

           Prepared for

               By

  Paul A. MacLennan, MPH, PhD
   Cynthia Owsley, PhD, MSPH
       Karen Searcey, MPSH
   Gerald McGwin, Jr., MS, PhD

            June 2012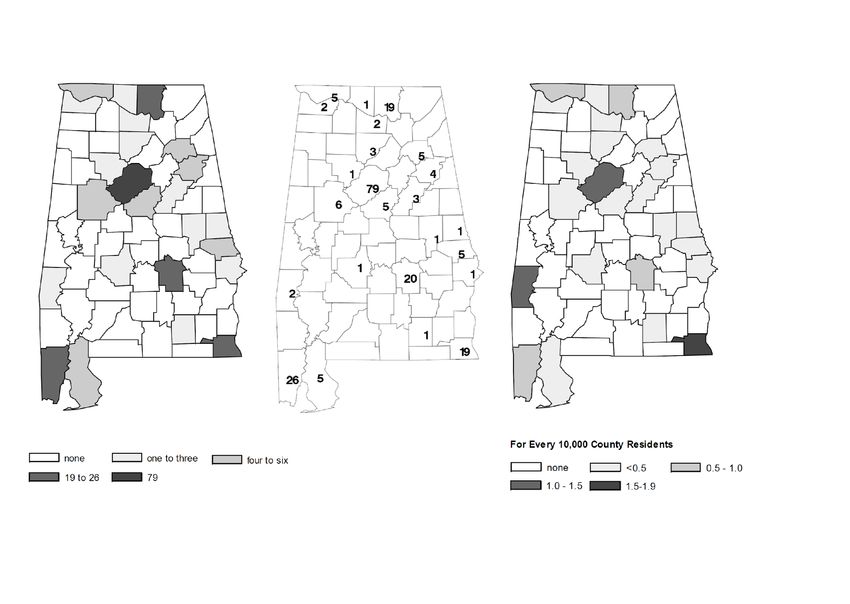
Author Information:

Paul MacLennan PhD
Assistant Professor
Department of Surgery
School of Medicine
University of Alabama at Birmingham

Cynthia Owsley PhD, MSPH
Nathan E. Miles Chair of Ophthalmology
Vice Chair for Clinical Research
Department of Ophthalmology
School of Medicine
University of Alabama at Birmingham

Karen Searcey, MSPH
Clinical Research Unit Manager
Department of Ophthalmology
School of Medicine
University of Alabama at Birmingham

Gerald McGwin Jr. MS, PhD
Professor of Epidemiology, Ophthalmology, and Surgery
Vice Chair of Epidemiology
School of Public Health
University of Alabama at Birmingham

                                                        2
FUNDING SUPPORT

This work was funded by the EyeSight Foundation of Alabama, with supplementary support
from UAB’s Comprehensive Diabetes Center; Department of Ophthalmology, School of
Medicine; Minority Health and Disparities Research Center; School of Public Health; and Vision
Science Research Center.

                                                                                             3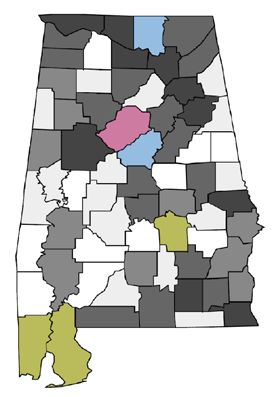
ACKNOWLEDGMENTS

We appreciate the guidance of Torrey V.A. DeKeyser, Executive Director, and Shirley
Hamilton, Director of Grants and Communications; Stephen A. Yoder, JD, Chairman, Board of
Trustees; and N. Carlton Baker Jr., Immediate Past Chairman, Board of Trustees, all of The
EyeSight Foundation of Alabama.

We thank the following individuals for facilitating our efforts in surveying eye care providers in
Alabama: Amanda Buttenshaw, CAE, Executive Director, Alabama Optometric Association;
Mike Merrill, JD, Executive Director, Alabama Academy of Ophthalmology; Fred Wallace, OD,
Executive Director, Alabama Board of Optometry; Dawn DeCarlo, OD, Associate Professor of
Ophthalmology, UAB; Jennifer Elgin OTR/L, CDRS, Occupational Therapist, Department of
Ophthalmology, UAB and Tammy Than OD, Associate Professor of Optometry, UAB.

In addition, we thank Melissa Braswell, Research Specialist, Clinical Research Unit, UAB
Department of Ophthalmology, for assistance with data collection.

                                                                                                 4
TABLE OF CONTENTS
EXECUTIVE SUMMARY .........................................................................6
BACKGROUND .........................................................................................8
METHODS ................................................................................................10
RESULTS ..................................................................................................15
Provider characteristics
Ophthalmologists ...........................................................................19
Optometrists ...................................................................................20
Rehabilitation providers .................................................................21
Practice characteristics
Ophthalmologists ...........................................................................22
Optometrists ...................................................................................25
Rehabilitation providers .................................................................28
Patient characteristics
Ophthalmologists ...........................................................................31
Optometrists ...................................................................................33
Rehabilitation providers .................................................................35
Provider opinions
Ophthalmologists ...........................................................................37
Optometrists ..................................................................................40
Rehabilitation providers .................................................................43
DISCUSSION ............................................................................................46
REFERENCES ..........................................................................................51
APPENDICES
Appendix A. Eligible and participating providers by county ........57
Appendix B. Provider surveys .......................................................60
Appendix C. Domains and subcategories for written responses....81
5Executive Summary
In 2010 the EyeSight Foundation of Alabama commissioned a survey of eye care providers in
Alabama as part of a needs assessment for eye health and eye care issues in Alabama. The
survey’s specific purpose was to obtain information about the characteristics of providers
(ophthalmologists, optometrists, visual rehabilitation specialists), and their practices and patients.
In addition, providers’ opinions were solicited on major unmet eye care needs in Alabama. This
report is a summary of the survey methodology and its results. A survey with similar although
not identical content was previously conducted in 1999 shortly after the Foundation was created.
The current survey, carried out about ten years after the original survey, was conducted in order
to get an up-to-date picture on the topic. The results of this survey will provide guidance to the
Foundation for potential areas of need. It is also hoped that this report will serve as a resource to
clinicians, researchers and policy-makers in Alabama.
Surveys specific to each provider group were developed and administered. These surveys
requested information regarding four domains: provider characteristics, practice characteristics,
patient characteristics and provider opinions as elicited by two opened-ended questions. Survey
participants were identified from August 2010 to October 2010 through information obtained
from professional associations, licensing boards, and internet searches. The final group of
eligible participants consisted of 1,033 vision care providers: 217 ophthalmologists, 638
optometrists and 178 rehabilitation providers. Survey participants were contacted over a ten-
month period from November 2010 through August 2011. Overall, 438 of eligible vision health
providers participated in the survey. Participation varied by provider group with
ophthalmologists having the highest participation rate (51.2%), followed by rehabilitation
providers (45.5%) and optometrists (38.6%).
The survey found that many Alabama communities are geographically isolated from eye care
services. Due to long travel distances, people who live in rural areas have increased barriers to
receive basic and specialized eye care, and vision rehabilitation services. Among survey
participants, Jefferson County had the highest number of participants, followed by Madison,
Mobile, Shelby and Montgomery. The majority of participating vision care providers was located
in urban counties. All rehabilitation providers located in rural areas were in northern rural
counties but none were located in southern counties.
The majority of participating ophthalmologists, optometrists and rehabilitation providers
identified themselves as white of non-Hispanic origin. According to 2010 US Census estimates,
over one-quarter of Alabama’s population is African American. Previous research indicates that
rates of vision impairment and eye disease among African Americans are two times higher than
those of whites, especially uncorrected refractive error, cataract, glaucoma, and diabetic
retinopathy. Research suggests that provider-patient communication and the use of preventive
services can be facilitated when there is racial/ethnic concordance between providers and
patients. Thus, it is possible that an increase in the number of African American
ophthalmologists and optometrists in Alabama would have positive benefits on eye health in the
state.
6The growing prevalence of diabetes in Alabama is likely to result in more people, and at younger
ages, at risk for diabetic eye diseases. Diabetic retinopathy is the leading cause of blindness
among working age adults in the United States. Those with diabetes are also at increased risk for
glaucoma and cataracts. Based on Centers for Disease Control & Prevention estimates, Alabama
has a higher prevalence of diabetes than any other state. In the current survey, ophthalmologists
and optometrists estimated that 27% and 22%, respectively, of their patients had diabetes;
however, providers estimated that the proportion that adhered to eye care guidelines was 61%
among ophthalmology patients and 53% among optometry patients. Programs that enhance the
likelihood of early detection and monitoring with timely treatment could stop or slow disease
progression.
A frequently expressed opinion among participating ophthalmologists, optometrists and vision
rehabilitation providers was the need for more providers. A recent analysis concluded that due to
changing patient demographics, retirement, and a fixed number of ophthalmology residency slots
nationwide, ophthalmology will face substantial challenges in manpower by year 2020.
Four priority focus areas were identified that can potentially deliver significant benefit to the eye
health of Alabamians. They are: 1) Identify strategies to increase the number of eye care
providers, including more African American providers; 2) Develop and implement strategies in
the eye care system for improved detection and follow-up management of the ocular
complications of diabetes; and 3) Develop and implement strategies to improve access to eye
care, satellite eye care practices, telemedicine approaches and possibly transportation systems.
(4) Scientifically evaluate these and any other public eye health interventions to improve the
quality of and access to eye care in Alabama, in terms of their impact on both health outcomes
and cost, so that eye health strategies in the state are evidence-based.
7BACKGROUND
Vision health is an important public health concern that affects Alabama’s children, adults and
the elderly. Even though research has shown that early detection and treatment are effective in
preventing many vision problems, adequate vision care remains an unmet need for many
Americans.1 Compared to many other chronic diseases, the personal and economic burden
associated with eye disease is high.2,3 Those with vision impairment have difficulties with
communication, mobility and performance of everyday tasks, and among older adults visual
deficits can result in increased isolation, depression, disability and premature death.4,5 Among
infants and children, the most prevalent and disabling problems include amblyopia, strabismus,
and uncorrected refractive error.6 For adults younger than 40, problems related to refractive error
are common but eye injury is also prevalent.7 Other eye diseases that can be detected and treated
early among at risk adults include glaucoma and diabetic eye conditions. For people 40 and
older, the most common eye diseases are age-related macular degeneration, cataract, diabetic
retinopathy, and glaucoma.1 With increasing age the prevalence of blindness and vision
impairment increase dramatically and is greatest for those older than 75; as the population ages,
the number at risk also increases.8 Moreover, the prevalence of diabetes in the United States has
more than doubled over the past 20 years,9 a trend that is expected to continue,10 increasing the
numbers at risk for diabetic retinopathy.
Inadequate access to eye care results in delayed diagnosis, causing unnecessary increases in
burden of disease, disability and costs.2,3 For some eye diseases such as cataract, glaucoma, age-
related macular degeneration, and diabetic eye conditions and retinopathy, by the time symptoms
are apparent, damage is permanent that could have been avoided or delayed. A recent Centers for
Disease Control and Prevention (CDC) Vision Impairment Task Force reported that the primary
barriers related to individuals’ decisions not to seek vision care (i.e., screening, diagnosis,
treatment and rehabilitation) were related to behavior, costs, and accessibility.11 Many people are
unaware of the importance of eye care and often cite the reason for not seeking care as “did not
feel a need.”12 However, barriers to eye care are not equivalent for all groups. For example, a
recent investigation of perceptions and beliefs of vision care among older African Americans
who resided in Birmingham and Montgomery reported that the most frequently cited barrier to
care was transportation, followed by trusting the doctor, communicating with the doctor, and
costs.13 A similar investigation of eye care beliefs among elderly African Americans in Maryland
reported that cost was the most important barrier.14
Prohibitively high cost is frequently identified as a barrier to eye care.12 As an example,
researchers utilizing the CDC’s Behavioral Risk Factor Surveillance System reported that among
women 40 and older diagnosed with diabetic retinopathy, glaucoma and age-related macular
degeneration, those without eye care insurance less frequently followed recommended guidelines
for visiting an eye-care provider.15 The proportion of Alabama’s population without health
insurance is relatively large and has increased in a short time from a low of 12.5% in 2005 to
approximately 16% in 2011.16 Medicaid is a state run health insurance program for certain,
qualifying low income populations; however, not all people with low incomes or those without
insurance qualify for Medicaid. For those who do qualify, coverage may not be accepted by
providers because it fails to cover their costs. Among Medicare patients, routine eye
examinations for those without eye conditions are not covered. The costs for spectacles and
8contact lenses are not covered (except for spectacles following cataract surgery). For those with
health care insurance, coverage may be insufficient for purchasing spectacles and prescription
medications, or high co-pays may act as disincentives to seeking care. Among adults with self-
reported severe vision impairment, eye care utilization in the preceding 12 months was no
greater than 61% for those with vision care insurance and 34% for those with no insurance.
Overall, those with vision care insurance are more than twice as likely to have an annual eye
examination. Other factors associated with increased likelihood of eye care utilization include
higher income, and greater educational attainment.17
Accessibility is also an important barrier to eye care and is related to patients’ geographic
location and the lack of general and specialized providers in some geographic areas.12 Research
has reported that rural populations are at increased risk for vision problems relative to urban
populations.18 Owsley et al. (2006) reported that transportation was the most frequently
perceived barrier among older African Americans.13 Interestingly, study participants were drawn
from Birmingham and Montgomery, two of the largest cities in Alabama where, compared to
other locations in the state, the prevalence of providers is high and transportation options
greater.13
Previous research has advocated an integrated approach to reduce the burden of vision
impairment through multilevel interventions of a number of identified modifiable factors
(system, provider and patient) associated with increased disease incidence.11 Information about
the prevalence of these risk factors can be used to inform policy makers and stakeholders to
identify and understand gaps in care. Ultimately, information can be used for targeted multilevel
interventions, directed at those in greatest need and ensuring that scarce public health care
dollars are focused on areas identified through scientific evidence.11
A survey carried out by the Alabama Eye Institute (former name of the EyeSight Foundation of
Alabama) in 1999 identified eye care providers working in Alabama, the services available to
address vision problems, and services provided by ophthalmologists and optometrists, and
reported participating eye care providers’ perceptions of what the major eye care needs were in
their communities.19 The researchers summarized the major gaps in service availability for eye
health and vision problems as needs for: (1) public education concerning the importance of
routine screening and preventative eye care; (2) financial support for eye health services; (3)
greater availability of rehabilitation and adaptive aids and services; and (4) improved geographic
access to specialty services.19 Over ten years has passed since the previous survey and although
informative, the current survey aims to provide up to date information on many of the topics
included in the previous survey. It also aims to increase the numbers of participants, and to
enquire more deeply into the characteristics of providers, their practices, and patients. The
current assessment of Alabama’s eye care providers, their patients, and available services will
help to identify gaps in services by aligning known resources to population needs.
9METHODS
This is a survey of eye care providers delivering eye care in the State of Alabama. The
Institutional Review Board of the University of Alabama at Birmingham reviewed and approved
the survey’s protocol.
Study Population
The survey population consisted of three provider groups: (1) Ophthalmologists, defined as
physicians (MD or DO) who have a medical license in Alabama per the Alabama State Board of
Medical Examiners, have completed residency training in ophthalmology, and practice at least
part time in Alabama; (2) Optometrists, defined as those who have a Doctor of Optometry
degree, are licensed by the Alabama Board of Optometry to practice optometry in Alabama, and
practice at least part time in Alabama; and (3) Vision rehabilitation providers, defined as those
who provide vision rehabilitation services and practice at least part time in Alabama.
Ophthalmologists or optometrists who provide vision rehabilitation services were categorized
with their respective profession (ophthalmologist or optometrist), not in the vision rehabilitation
provider category.
Survey participants were identified from August 2010 through October 2010. Identification and
contact information was initially obtained from professional associations, licensing boards, and
internet searches. Attempts were made to contact all potential participants via telephone to verify
that providers still worked in Alabama and that their contact information was correct. When
incorrect, contact information was updated; however, participants who met the exclusion criteria,
e.g., retired and no longer practicing, deceased, or relocated outside of Alabama, were deemed
ineligible.
Overall, 1,337 potential participants were identified: 378 ophthalmologists, 759 optometrists, and
200 rehabilitation providers (Table 1). Of these, 42.6% of ophthalmologists (161 of 378), 15.9%
of optometrists (121 of 759), and 11.0% of rehabilitation providers (22 of 200) were deemed
ineligible of whom, 88.2%, 92.6%, and 72.7%, respectively, were excluded because they no
longer worked in Alabama. In addition, 8.1% and 1.7% of the ineligible ophthalmologists and
optometrists, respectively, were excluded because they were still in training. The final group of
eligible participants consisted of 1,033 vision care providers: 217 ophthalmologists (21.0%), 638
optometrists (61.8%) and 178 rehabilitation providers (17.2%).
Jefferson County had the greatest number of eligible providers overall and in each provider
group; 36.4% of ophthalmologists, 27.4% of optometrists, and 39.9% of rehabilitation providers
(Table 2). The majority of vision care providers (94.0% of ophthalmologist, 79.6% of
optometrists, and 85.4% of rehabilitation providers) were located in urban counties. There were
ten counties for which no eligible providers were identified: Bullock, Clay, Coosa, Hale,
Lawrence, Lowndes, Monroe, Randolph, Washington, and Wilcox. A detailed list of county level
eligibility and participation by provider type is found in Appendix A.
10Table 1. Determination of eligibility status among study subjects by provider group
Ophthalmologists Optometrists Rehabilitation
Potential participants 378 759 200
Eligibility (%)
Eligible 217 (57.4) 638 (84.1) 178 (89.0)
Ineligible 161 (42.6) 121 (15.9) 22 (11.0)
Ineligible reason (%)
Not practicing in Alabama 142 (88.2) 112 (92.6) 16 (72.7)
Medical leave/disability 2 ( 1.2) 0 ( -- ) 0 ( -- )
Residency 13 ( 8.1) 2 ( 1.7) 0 ( -- )
Duplicate entry 1 ( 0.6) 4 ( 3.3) 1 ( 4.6)
Other 3 ( 1.9) 3 ( 2.5) 5 (22.7)
Table 2. County and region location of eligible participants by provider group
Ophthalmologists Optometrists Rehabilitation
217 638 178
Top ten counties by numbers of
eligible participants, N (%)
Jefferson 79 (36.4) 175 (27.4) 71 (39.9)
Madison 19 ( 8.8) 53 ( 8.3) 9 ( 5.1)
Mobile 26 (12.0) 33 ( 5.2) 12 ( 6.7)
Shelby 5 ( 2.3) 49 ( 7.7) 9 ( 5.1)
Montgomery 20 ( 9.2) 31 ( 4.9) 9 ( 5.1)
Houston 19 ( 8.8) 18 ( 2.8) 3 ( 1.7)
Tuscaloosa 6 ( 2.8) 18 ( 2.8) 9 ( 5.1)
Baldwin 5 ( 2.3) 23 ( 3.6) 1 ( 0.6)
Talladega 3 ( 1.4) 5 ( 0.8) 16 ( 9.0)
Calhoun 4 ( 1.8) 16 ( 2.5) 3 ( 1.7)
Eligibility by regiona (%)
Urban 204 (94.0) 508 (79.6) 152 (85.4)
North rural 7 ( 3.2) 68 (10.7) 22 (12.4)
South rural 3 ( 1.4) 53 ( 8.3) 2 ( 1.1)
Black Belt 3 ( 1.4) 9 ( 1.4) 2 ( 1.1)
a 20
Based on regional classification defined by the Alabama Department of Public Health
Survey Instrument
Surveys specific to each provider group were developed by the authors of this report with input
from providers in the fields of ophthalmology, optometry, and vision rehabilitation. For all
provider types, survey structure was similar and requested information regarding four areas of
interest: provider characteristics, practice characteristics, patient characteristics and provider
opinions as elicited by two opened-ended questions. In general, the length of all three surveys
was similar, for example, ophthalmologists were asked 31 questions while optometrists and
rehabilitation providers were asked 30 questions. Many of the questions were similar, but a
moderate proportion of survey questions were unique to each provider type (see Appendix B).
11Provider characteristics questions inquired about demographics (i.e., race/ethnicity, age and
gender) and training. With respect to training, information was requested from ophthalmologists
regarding the year of residency completion, whether residency was followed by a fellowship, and
if yes, the field of training; from optometrists, the year of receiving optometry degree, whether
specialty training was completed, and if yes, the field of specialty training; and from
rehabilitation providers, the year of receiving highest degree and vision rehabilitation specialty.
Practice characteristics questions inquired about practice types, other settings where services
were provided, practice organization and function, types of insurance accepted, and available
patient services. Practice type information included whether respondents worked in group
practice with another ophthalmologist or optometrist, and whether their practice was based at a
university, Department of Veterans Affairs facility, rehabilitation hospital, general hospital,
outpatient rehabilitation clinic, independent service for the visually impaired, State agency,
optical retail shop, or other type. Those who selected other were asked to be specific. In addition,
information was requested about other settings where participants provided services. Other
settings included: day programs in public or private schools, residential schools, general
hospitals, in-patient psychiatric hospitals, nursing homes, State or Federal prisons or local jails,
and other. Those who selected other were asked to be specific.
Requested practice organization and function information included whether services were
provided in group practice, whether an optical shop was located at the practice, if services were
provided in Spanish, the typical amount of time from patients’ seeking an appointment to seeing
the provider, if walk in appointments were accepted, the average number of patients personally
seen per week, and sources of patient referral. We also asked whether insurance was accepted
and if yes, the types of insurance.
The final practice characteristics questions were specific to each provider type and solicited
information about types of services provided. Both ophthalmologists and optometrists were
asked whether services provided included: comprehensive eye care for adults, comprehensive
eye care for infants and children, and contact lens fitting and dispensing. Ophthalmologists were
asked whether they provided any of the following services: cataract surgery, refractive surgery,
retinal – vitreal surgery, glaucoma surgery, corneal surgery, oculo-plastic surgery, visual
rehabilitation services, neuro-ophthalmological services and other. Optometrists were asked
whether they provided vision therapy and/or low vision rehabilitation services. Those who
selected other were asked to be specific. Rehabilitation providers were asked whether they
provided in-home services, and the following training services: the use of assistive devices (e.g.,
optical, non-optical), orientation and mobility, eccentric viewing or preferred retinal loci,
scanning strategy, strategies to perform everyday visual tasks (e.g., household activities,
managing money, preparing meals), and the use of computers and software. Rehabilitation
providers were also asked if they offered any of the following services: psychological or
counseling, support groups (for clients and/or families), social work, driving rehabilitation,
home-based visits for education or training, vocational rehabilitation or career counseling, and
other. Those who selected other were asked to be specific.
Patient characteristics questions inquired about the providers’ patient or client base,
specifically demographics, i.e., the estimated proportions of patients by age group, race, and
12gender; and the estimated proportions of patients by insurance type (e.g., Medicare, Medicaid,
and private insurance).
All providers were asked to estimate the prevalence of each of the following eye conditions
among their patients: refractive error, amblyopia, strabismus, dry eye, age-related macular
degeneration, glaucoma, diabetic eye conditions including retinopathy, cataract, vision loss from
brain injury including stroke, juvenile or young adult onset retinal degenerations, optic neuritis
or other optic nerve disorders, retinopathy of prematurity, corneal problems, complications from
contact lens wear, conjunctivitis, ocular trauma, and refractive error. Participants were asked to
estimate the prevalences of diabetes and low-vision among their patients; ophthalmologists and
optometrists were asked to estimate the proportion of diabetic patients that adhere to eye care
guidelines. In addition ophthalmologists and optometrists were asked where low-vision patients
in need of rehabilitative services were referred. Finally, rehabilitation providers were asked to
estimate the proportion of their patients with the following specific difficulties or problems:
reading, writing, financial management, other detailed near tasks, independent living, mobility,
driving, identification of objects/ people/ events from a distance, self care/domestic activity, and
emotional or psychological adjustment.
Provider opinions were sought for two open ended questions: 1) “What are the greatest unmet
eye care needs in your community?” and 2) “What single action by a private foundation (such as
the EyeSight Foundation of Alabama) would make the greatest improvement in eye care in your
community?” Responses were reviewed by two researchers with experience in health care
research, and general domains were defined and within those domains, specific subcategories
were delineated. For the first question regarding unmet community needs, five general domains
were defined: clinical care, education, accessibility, eye care organization, and policy. For the
clinical care domain, subcategories included eye care, glaucoma screening, diabetic retinopathy
screening, pediatric in general, pediatric screening, pediatric comprehensive eye exams, and
Hispanic care. For the education domain, subcategories included education to the public and
provider education. For the accessibility domain, subcategories included transportation to
appointments, satellite clinics, and nursing homes. For the eye care organization domain,
subcategories included more providers, new eye hospital, dyslexia services, disparities, blind
services, VA services, handicapped children, dual sensory impairment screening, sports related,
and support groups. For the policy domain, subcategories included financial assistance with
prescriptions, lower co-pays for office visits, higher reimbursements, spectacles for Medicare,
state funds for disability services, pedestrian mobility paths, school screenings, funding for
school spectacles, assistance to indigent patients, and vision rehabilitation funding.
General domains and subcategories for the second question regarding what single action by a
private foundation would make the greatest improvement in community’s eye care included:
fund research, education (public and provider), accessibility (transportation to appointments),
policy, clinical care and screening, and building relationships.
Text responses were reviewed by two members of the research team, and each independent
statement (many participants gave several) was classified according to its corresponding general
domain and subcategory. For example, a response that stated that glaucoma screening was an
unmet eye care need would fall into the clinical care domain and the specific category of
13glaucoma screening. A thorough description of the general domains and specific categories
within them is available in Appendix C.
Survey Conduct
Study participants were contacted over a ten-month period from November 2010 through August
2011. Eligible subjects (N=1,033) were first contacted via mail informing them of the study
goals and requesting their participation. Included in the mail contact was a survey specific to
subject provider type and a pre-paid return envelope. Additional steps were taken to encourage
participation among non-responders; these included: telephone calls to practices to remind the
provider about the opportunity to participate, faxes and emails by study personnel to the
provider, attendance at several professional seminars and conferences where surveys were made
available, two announcements of the survey in the Alabama Optometric Association monthly
newsletter, a mass email to members of the Alabama Optometric Association, and the option of
completing the survey online.
Analysis
Results are presented for each survey domain (provider characteristics, practice characteristics,
patient characteristics and provider opinions) by provider group. Calculated percentages are
based on the numbers of providers who responded to the question. For example, although 111
ophthalmologists participated in the survey, only 109 responded to the race/ethnic group
question and 107 responded to the gender question; thus, for those questions, denominators for
calculating percentages were 109 and 107, respectively.
14RESULTS
Overall, 438 (42.4%) of 1,033 eligible vision health providers participated in the survey (Table
3). Participation varied by provider group with ophthalmologists having the highest participation
(51.2%), followed by rehabilitation providers (45.5%) and optometrists (38.6%).
Table 3. Region and county of participants by provider group
Ophthalmologists Optometrists Rehabilitation
Participants 111 246 81
Top ten counties by numbers of
participants, N (%)
Jefferson 46 (41.4) 80 (32.5) 27 (33.3)
Madison 10 ( 9.0) 23 ( 9.4) 7 ( 8.6)
Mobile 11 ( 9.9) 15 ( 6.1) 7 ( 8.6)
Shelby 2 ( 1.8) 22 ( 8.9) 5 ( 6.2)
Montgomery 10 ( 9.0) 15 ( 6.1) 5 ( 6.2)
Houston 9 ( 8.1) 6 ( 2.4) 0 ( -- )
Tuscaloosa 4 ( 3.6) 8 ( 3.3) 3 ( 3.7)
Baldwin 2 ( 1.8) 4 ( 1.6) 1 ( 1.2)
Talladega 3 ( 2.7) 1 ( 0.4) 11 (13.6)
Calhoun 1 ( 0.9) 4 ( 1.6) 0 ( -- )
Participants by region (%)
Urban 105 (94.6) 200 (81.3) 67 (82.7)
North rural 6 ( 5.4) 23 ( 9.4) 14 (17.3)
South rural 0 ( -- ) 21 ( 8.5) 0 ( -- )
Black Belt 0 ( -- ) 2 ( 0.8) 0 ( -- )
By county of location, Jefferson County had the highest number of participants, followed by
Madison, Mobile, Shelby and Montgomery. The majority of participating vision care providers
was located in urban counties. However, relative to ophthalmologists (5.4%), a greater number
of optometrists (18.7%) and rehabilitation providers (17.3%) were located in rural areas. All
rehabilitation providers located in rural areas were in northern rural counties but none were
located in southern counties. Only two survey participants were from Black Belt counties; both
were optometrists.
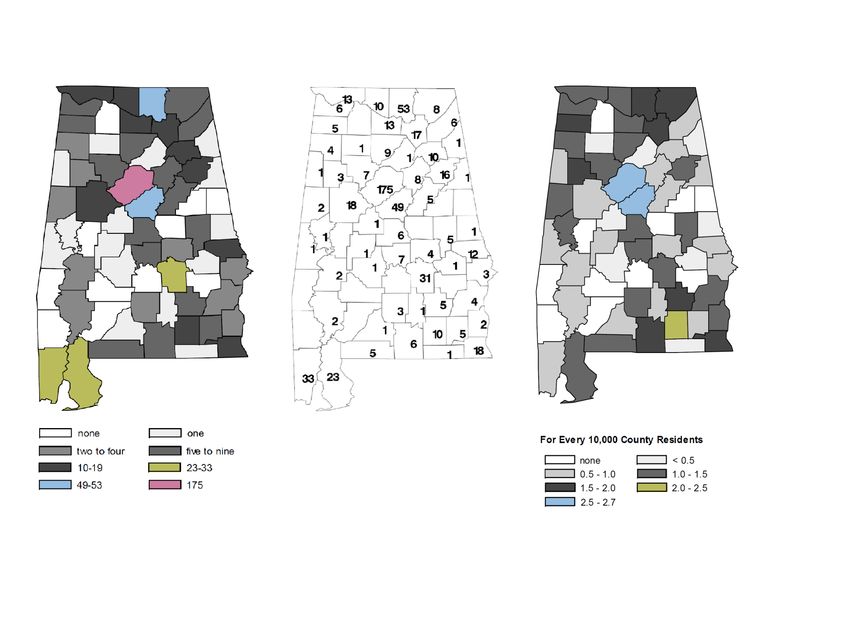
Figures 1 – 3 provide information on the numbers of ophthalmologists and optometrists per
10,000 county residents eligible for the survey, regardless of whether they participated or not,
organized by county location. Figures 2 and 3 provide additional information regarding the
number of ophthalmologists and optometrists per county.
15Figure 1. County Location of Ophthalmologists and Optometrists for every 10,000
County Residents, Alabama (2010)
16Figure 2. County Location of Alabama Ophthalmologists (2010)
17Figure 3. County Location Alabama Optometrists (2010)
18PROVIDER CHARACTERISTICS
Ophthalmologists
The majority of participating ophthalmologists identified themselves as non-Hispanic White
(94.5%), with only one or two reporting for each of the other race/ethnicity groups (Table 4).
Respondents’ average age was 53 years and most (88.8%) were male.
Table 4. Demographic characteristics of ophthalmologists
Race/ethnicity group (%)
White, non-Hispanic 103 (94.5)
African-American 1 ( 0.9)
Hispanic 1 ( 0.9)
Asian 2 ( 1.8)
Native American 1 ( 0.9)
Other 1 ( 0.9)
Average age (SD) 53.0 (11.8)
Gender (%)
Male 95 (88.8)
Female 12 (11.2)
Among ophthalmologists, 25.2% completed their residency training in 2000 or after, 19.8% in
the 1990s, 19.8% in the 1980s, and 35.2% before 1980 (Table 5). Approximately 50% of
ophthalmologists had completed a fellowship, and among those, the most common areas of
specialty were retina (20.4%), cornea (18.5%), glaucoma (16.7%), pediatric ophthalmology
(13.0) and oculoplastics (13%). Other specialties specified by respondents included: anterior
segment, aviation ophthalmology, cataract, general ophthalmology, nuclear ophthalmology,
ocular trauma, and refractive surgery.
Table 5. Training characteristics of ophthalmologists
Year residency training completed N (%)
2000 and after 28 (25.2)
1990 – 1999 22 (19.8)
1980 – 1989 22 (19.8)
Before 1980 39 (35.2)
Fellowship post residency?
Yes 53 (49.5)
Fellowship field
Retina 11 (20.4)
Glaucoma 9 (16.7)
Cornea 10 (18.5)
Pediatric Ophthalmology & Strabismus 7 (13.0)
Neuro-Ophthalmology 4 ( 7.4)
Oculoplastics 7 (13.0)
Visual Rehabilitation 0 ( -- )
Ophthalmic Pathology 1 ( 1.9)
Ocular Inflammatory Disease 1 ( 1.9)
Other 7 (13.0)
19Optometrists
Among participating optometrists, most (89.6%) identified themselves as non-Hispanic White
(Table 6). On average they were 45 years of age and though most (55.7%) were male, a large
proportion (44.3%) was female.
Table 6. Demographic characteristics of optometrists
Race/ethnicity group (%)
White, non-Hispanic 216 (89.6)
African-American 16 ( 6.6)
Hispanic 4 ( 1.7)
Asian 2 ( 0.8)
Native American 2 ( 0.8)
Other 1 ( 0.4)
Average age (SD) 45.7 (12.0)
Gender (%)
Male 136 (55.7)
Female 108 (44.3)
Among optometrists, 31.7% received their optometry degree in 2000 or after, 27.2% in the
1990s, 24.4% in the 1980s, and 16.7% before 1980 (Table 7). Among those who reported
completing a residency (21.3%), the most frequently areas of specialty training were family
practice (26.9%), geriatric optometry (26.9%), low vision rehabilitation (23.1%) and primary eye
care (21.1%). Less frequently listed areas of specialty included cornea and contact lenses (9.6%),
pediatric optometry (7.7%), vision therapy (3.8%), and refractive and ocular surgery (1.9%).
Other areas of specialty training specified by participants included hospital based and ocular
diseases.
Table 7. Training characteristics of optometrists
Year O.D. degree received N (%)
2000 and after 78 (31.7)
1990 – 1999 67 (27.2)
1980 – 1989 60 (24.4)
Before 1980 41 (16.7)
Following O.D., residency in specialty?
Yes 52 (21.3)
Residency specialty (%)
Community Health Optometry 0 ( -- )
Cornea and Contact Lenses 5 ( 9.6)
Family Practice Optometry 14 (26.9)
Geriatric Optometry 14 (26.9)
Low Vision Rehabilitation 12 (23.1)
Pediatric Optometry 4 ( 7.7)
Primary Eye Care 11 (21.1)
Refractive and Ocular Surgery 1 ( 1.9)
Vision Therapy 2 ( 3.8)
Other. Specify 16 (30.8)
20Vision Rehabilitation Providers
Among participating rehabilitation providers, 84.0% were non-Hispanic White and 13.6% were
African Americans (Table 8). On average participants were 47 years of age and most (80.3%)
were female.
Table 8. Demographic characteristics of rehabilitation providers
Race/ethnicity group (%)
White, non-Hispanic 68 (84.0)
African-American 11 (13.6)
Hispanic 1 ( 1.2)
Asian 0 ( -- )
Native American 1 ( 1.2)
Other 0 ( -- )
Average age (SD) 47.8 (11.1)
Gender (%)
Male 16 (19.8)
Female 65 (80.2)
Among rehabilitation providers, 33.3% received their highest degree in 2000 or after, 25.9% in
the 1990s, 16.1% in the 1980s, and 24.7% before 1980 (Table 9). Rehabilitation providers’
specialties included educator (30.7%), vision rehabilitation therapist (20.0%) and rehabilitation
counselor (16.0%), and vocational rehabilitation counselor (9.3%). It should be noted that these
categories are not mutually exclusive and that some of the participants selected more than one
answer. Very few participants identified themselves as low vision therapists (5.3%); however,
many participants specified another specialty (30.7%) outside of the ones offered in the survey.
Other specialties specified included administration, assistive technology, case manager, and
consultant.
Table 9. Rehabilitation providers’ year of highest degree and specialties
Year degree received N (%)
2000 and after 27 (33.3)
1990 – 1999 21 (25.9)
1980 – 1989 13 (16.1)
Before 1980 20 (24.7)
Specialty
Occupational therapist 7 ( 9.3)
Occupational therapist assistant 0 ( -- )
Vision rehabilitation therapist 15 (20.0)
Certified low vision therapist 4 ( 5.3)
Social worker 2 ( 2.7)
Rehabilitation counselor 12 (16.0)
Vocational rehabilitation counselor 7 ( 9.3)
Psychologist 2 ( 2.7)
Educator 23 (30.7)
Other 23 (30.7)
21PRACTICE CHARACTERISTICS
Ophthalmologists
Most ophthalmologists (82.0%) worked in a private practice with one or more ophthalmologists;
a lower proportion (24.3%) reported working in a practice with at least one optometrist and
11.7% worked at a university-based practice (Table 10). Very few ophthalmologists reported
working in a Department of Veterans Affairs clinic or medical center (2.7%) or in a general
hospital (3.6%). No participants reported working in a rehabilitation hospital, outpatient
rehabilitation center, independent service for the visually impaired, or state agency. Few
ophthalmologists (7.2%) worked in a practice identified as an optical retail store. Other practice
types specified by ophthalmologists included a practice based at a hospital, a multi-specialty
group, and a common management group of multi-sole practitioners.
Table 10. Practice types of ophthalmologists
N (%)
Private practice with at least one 91 (82.0)
Ophthalmologist
Private practice with at least one Optometrist 27 (24.3)
Practice based in a university 13 (11.7)
Department of Veterans Affairs clinic or 3 ( 2.7)
medical center
Rehabilitation hospital 0( -- )
General hospital 4( 3.6)
Outpatient rehabilitation center 0( -- )
Independent service for the visually impaired 0( -- )
State agency 0( -- )
Optical retail store 8( 7.2)
Other 4( 3.6)
Relatively few ophthalmologists reported that they provided services in other settings (Table
11). Other settings ophthalmologists offered services included general hospitals (18.2%), in-
patient psychiatric hospitals (1.8%) and nursing homes (2.7%).
Table 11. Other settings where ophthalmologists provide services
N (%)
Public or private schools (day programs) 0 ( -- )
Residential schools (e.g., Alabama Institute 1 ( 0.9)
for the Deaf & Blind, residential schools for
the developmentally delayed)
General hospitals 20 (18.2)
In-patient psychiatric hospitals 2 ( 1.8)
Nursing homes 3 ( 2.7)
State or Federal prisons or local jails 0 ( -- )
Other 1 ( 0.9)
22A large proportion of ophthalmologists reported providing comprehensive eye care for adults
(78.2%) and children (52.7%), as well as dispensing and fitting of contact lenses (41.8%) (Table
12). Approximately 80% (N=89) of ophthalmologists reported that they performed any type of
surgery; 61% of ophthalmologists reported that they performed cataract surgery but fewer
performed surgeries that were refractive (20.0%), retinal (13.5%), glaucoma (31.8%), corneal
(18.2%) and oculoplastic (33.6%). Few ophthalmologists reported that they provided visual
rehabilitation services (2.7%). A greater proportion (13.6%) provided neuro-ophthalmological
services. Other services respondents specified included: diagnostic testing, adult strabismus,
ocular inflammatory and other immune diseases, and ocular trauma.
Table 12. Services provided by ophthalmologists
N (%)
Comprehensive eye care for adults 86 (78.2)
Comprehensive eye care for infants and 58 (52.7)
children
Contact lens fitting and dispensing 46 (41.8)
Cataract surgery 67 (60.9)
Refractive surgery 22 (20.0)
Retinal – vitreal surgery 15 (13.5)
Glaucoma surgery 35 (31.8)
Corneal surgery 20 (18.2)
Oculo-plastic surgery 37 (33.6)
Visual rehabilitation services 3 ( 2.7)
Neuro-ophthalmological services 15 (13.6)
Other 9 ( 8.2)
A large number of ophthalmologists reported that they provided services in a group practice
(72.2%) (Table 13). Although very few had previously answered that their practice was an
optical shop (Table 10), a greater number (50.0%) reported that an optical shop was located
within their practice. Nearly one third (32.7%) provided services in Spanish.
Most ophthalmologists (77.0%) estimated that patients would be seen within two weeks of
seeking an appointment but 9.6% estimated that patients could expect to wait for a month or
more. Most accepted walk-in appointments (67.0%); 31.1% accepted walk-in appointments only
from established patients in an emergency. The median number of patients seen per week was
120, and ranged from 15 to 240. The most common source of referrals was patients’ family and
friends (33.5%), followed by patients themselves (24.8%), a physician (17.4%), another
ophthalmologist (17.2%), and an optometrist (16.1%). Respondents estimated that very few of
their patients were referred by hospitals or emergency rooms (3.9%) and school or pre-school
vision screening programs (2.5%).
Most ophthalmologists accepted Blue Cross Blue Shield (93.6%), Medicare (86.4%), Medicaid
(85.5%), Tricare/Champus (84.6%), United Healthcare (83.6%), and Medicare Complete
(83.6%) (Table 14). Acceptance of other types of insurance plans varied by type, for example,
many providers accepted Aetna (79.1%), and Cigna (74.6%); but fewer accepted Viva (61.8%)
and Viva Medicare Plus (52.7%); and less than half accepted GEHA (41.8%), Veterans
Administration coverage (38.2%), CHIP (38.1%), and Multiplan (30.9%).
23Table 13. Practice characteristics of ophthalmologists
N (%)
Provide services in group practice 78 (72.2)
Optical shop at practice/agency 52 (50.0)
Services provided in Spanish 34 (32.7)
Time for appointment:
< 1 week 48 (46.2)
1 – 2 weeks 32 (30.8)
3 – 4 weeks 12 (11.5)
> 1 month 10 ( 9.6)
Do not know 2 ( 1.9)
Walk in appointments accepted?
Yes 69 (67.0)
Only in an emergency w/ est. patient 32 (31.1)
No 2 ( 1.9)
Average number of patients seen per week 119.8 (47.5)
(SD)
Median 120
Range 15-240
Sources of patient referral (%):
Themselves 24.8
Family or friends 33.5
An ophthalmologist 17.2
An optometrist 16.1
Physician, e.g., a family physician 17.4
Hospital emergency room 3.9
School or pre-school vision screening 2.5
program
Other 2.1
Table 14. Patient health insurance plans accepted by ophthalmologists
Insurance plans N (%)
Medicare 95 (86.4)
Medicare Complete 92 (83.6)
Medicaid 94 (85.5)
Blue Cross Blue Shield 103 (93.6)
Viva 68 (61.8)
Viva Medicare Plus 58 (52.7)
United Healthcare 92 (83.6)
Cigna 82 (74.6)
Aetna 87 (79.1)
Multiplan 34 (30.9)
GEHA 46 (41.8)
Tricare/Champus 93 (84.6)
Veterans Administration coverage 42 (38.2)
CHIP (Children’s Health Insurance Program) 42 (38.2)
Others 9 ( 8.2)
Do not accept health insurance 0 ( -- )
24Optometrists
About 2/3 of optometrists (61.0%) worked in a private practice with one or more other
optometrists; a low proportion (10.2%) reported working in a practice with at least one
ophthalmologist and 8.5% worked at a university-based practice (Table 15). Very few
optometrists practiced in a clinic or medical center associated with the Department of Veterans
Affairs (4.1%) or in a general hospital (1.2%). A few participants reported working in a
rehabilitation hospital (0.4%), general hospital (1.2%), outpatient rehabilitation center (0.4%),
independent service for the visually impaired (0.4%), or state agency (0.8%). Few optometrists
(18.7%) worked in a practice identified as an optical retail store. Other practice areas reported by
optometrists included a non-profit agency, an educational facility, a federally qualified health
center, a corporate optometric office, an independent practice within a Wal-Mart, a Lasik center,
an Indian reservation, a referral center and a health care center.
Table 15. Practice types of optometrists
N (%)
Private practice with at least one 25 (10.2)
Ophthalmologist
Private practice with at least one Optometrist 150 (61.0)
Practice based in a university 21 ( 8.5)
Department of Veterans Affairs clinic or 10 ( 4.1)
medical center
Rehabilitation hospital 1 ( 0.4)
General hospital 3 ( 1.2)
Outpatient rehabilitation center 1 ( 0.4)
Independent service for the visually impaired 1( 0.4)
State agency 2 ( 0.8)
Optical retail store 46 (18.7)
Other 18 ( 7.3)
Few optometrists reported that they provided services in other settings (Table 16). Other settings
where providers offered services included public or private schools (4.9%), residential schools
(1.6%), general hospitals (3.7%), in-patient psychiatric hospitals (1.6%), nursing homes (11.4%),
state or federal prisons and local jails (2.9%). Other settings written that were outside of the
choices offered in the survey, included National Guard, community free clinics, and homeless
shelters.
Table 16. Other settings where optometrists provide services
N (%)
Public or private schools (day programs) 12 ( 4.9)
Residential schools (e.g., Alabama Institute 4 ( 1.6)
for the Deaf & Blind, residential schools for
the developmentally delayed)
General hospitals 9 ( 3.7)
In-patient psychiatric hospitals 4 ( 1.6)
Nursing homes 28 (11.4)
State or Federal prisons or local jails 7 ( 2.9)
Other 25 (10.2)
25A large proportion of optometrists reported providing comprehensive eye care for adults (95.1%)
and children (81.3%), as well as fitting and dispensing contact lenses (86.2%) (Table 17).
Optometrists reported that 12.6% provided vision therapy and 15.0% provided low vision
rehabilitation services. Optometrists also offered other services not listed in the survey,
including: occupational and environmental services, and pre- and post- surgery care and
management.
Table 17. Services provided by optometrists
N (%)
Comprehensive eye care for adults 234 (95.1)
Comprehensive eye care for infants and 200 (81.3)
children
Contact lens fitting and dispensing 212 (86.2)
Vision therapy 31 (12.6)
Low vision rehabilitation services 37 (15.0)
Other 20 ( 8.1)
Approximately half of optometrists reported that they provided services in a group practice
(48.8%) (Table 18). Although very few had previously reported that their practice was an optical
shop (Table 15), most (92.5%) reported that an optical shop was located within their practice.
Over one quarter (27.3) provided services in Spanish.
Most optometrists (90.5%) estimated that patients would be seen within two weeks of seeking an
appointment and only 3.0% estimated that patients would not be seen for a month or more. Most
accepted walk-in appointments (75.2%), 22.5% accepted only walk-in appointments from
established patients in an emergency. The median number of patients seen per week was 60, and
ranged from four to 200. The most common estimated source of referrals was patients’ family
and friends (38.1%), followed by patients themselves (34.3%), and a physician (12.3%). Less
common sources of referrals were from school or pre-school vision screening programs (8.2%),
an ophthalmologist (5.1%), another optometrist (4.2%), and hospitals or emergency rooms
(2.0%).
Many optometrists accepted Blue Cross Blue Shield (85.0%), Medicare (78.5%), United
Healthcare (65.5%), Tricare/Champus (58.9%), Medicare Complete (56.9%), and Medicaid
(61.8%) (Table 19). Acceptance of other types of insurance plans varied by type, for example,
many providers accepted Cigna (48.4%), Aetna (47.2%), Viva (45.5%) and Viva Medicare Plus
(41.5%); but few accepted CHIP (23.6%), Veterans Administration coverage (12.2%), GEHA
(10.2%), and Multiplan (6.5%). Optometrists also reported accepting reimbursement from
various health plans including: All Kids, VSP, Humana Vision Care/VCP, and Eye Med.
26Table 18. Practice characteristics of optometrists
N (%)
Provide services in group practice 117 (48.8)
Optical shop at practice/agency 211 (92.5)
Services provided in Spanish 63 (27.3)
Time for appointment (%)
< 1 week 151 (65.4)
1 – 2 weeks 58 (25.1)
3 – 4 weeks 12 ( 5.2)
> 1 month 7 ( 3.0)
Do not know 3 ( 1.3)
Walk in appointments accepted?
Yes 170 (75.2)
Only in an emergency w/ est. patient 51 (22.6)
No 5 ( 2.2)
Average number of patients seen per week 64.3 (36.3)
(SD)
Median 60
Range 4-200
Sources of patient referral:
Themselves 34.3
Family or friends 38.1
An ophthalmologist 5.1
An optometrist 4.2
Physician, e.g., a family physician 12.3
Hospital emergency room 2.0
School or pre-school vision screening 8.2
program
Other 5.0
Table 19. Patient health insurance plans accepted by optometrists
Insurance plans N (%)
Medicare 193 (78.5)
Medicare Complete 140 (56.9)
Medicaid 152 (61.8)
Blue Cross Blue Shield 209 (85.0)
Viva 112 (45.5)
Viva Medicare Plus 102 (41.5)
United Healthcare 161 (65.5)
Cigna 119 (48.4)
Aetna 116 (47.2)
Multiplan 16 ( 6.5)
GEHA 25 (10.2)
Tricare/Champus 145 (58.9)
Veterans Administration coverage 30 (12.2)
CHIP (Children’s Health Insurance 58 (23.6)
Program)
Others 35 (14.2)
Do not accept health insurance 1 ( 0.4)
27Vision Rehabilitation Providers
No rehabilitation providers listed their practice type as private practice with one or more
ophthalmologists or optometrists. Most worked in a state agency (54.3%) and a large proportion
practiced at a Department of Veterans Affairs clinic (13.6%) or independent service for visually
impaired (13.6%) (Table 20). A few listed practices based in a university (4.9%) and one each
worked in a rehabilitation hospital or outpatient rehabilitation center. Among other practice types
specified, responses included: ADRS, Alabama Institute for Deaf and Blind (AIDB), public
school system, private non-profit rehabilitation center, and home-private office.
Table 20. Practice types for rehabilitation providers
N (%)
Private practice with at least one 0 ( -- )
Ophthalmologist
Private practice with at least one 0 ( -- )
Optometrist
Practice based in a university 4 ( 4.9)
Department of Veterans Affairs clinic or 11 (13.6)
medical center
Rehabilitation hospital 1 ( 1.2)
General hospital 0 ( -- )
Outpatient rehabilitation center 1 ( 1.2)
Independent service for the visually 11 (13.6)
impaired
State agency 44 (54.3)
Optical retail store 0 ( -- )
Other 21 (25.9)
Other settings where rehabilitation providers offered services included public and private school
day programs (25.9%) and residential schools such as the AIDB (22.2%) (Table 21). No
participants provided services in a general hospital or an in-patient psychiatric hospital but
approximately 10% provided services to nursing homes. Other setting specified included, homes
as requested, colleges or universities, and ADRS.
Approximately 40% of responding rehabilitation providers worked in a group practice and over
one-third provided services in Spanish (Table 22). Patients were able to be seen within two-
weeks of seeking an appointment for approximately 60.9% of providers, 11.1% accepted only
walk-in appointments from established patients in an emergency. The median number of patients
seen per week was 10, and ranged from one to 40. The most common source for referrals was
ophthalmologists (15.2%), followed by schools (13.4%), family (13.3%), optometrists (11.1%),
vision screening programs (7.0%) and non-ophthalmologist physician (5.6%). Few patients
(0.3%) were estimated referred by hospitals or emergency rooms. Other sources specified
included ADRS, Vocational Rehabilitation, and VA Services.
28Table 21. Other settings where rehabilitation participants provide services
N (%)
Public or private schools (day programs) 21 (25.9)
Residential schools (e.g., Alabama Institute 18 (22.2)
for the Deaf & Blind, residential schools for
the developmentally delayed)
General hospitals 0 (----)
In-patient psychiatric hospitals 0 (----)
Nursing homes 8 (9.9)
State or Federal prisons or local jails 3 (3.7)
Other 17 (21.0)
Table 22. Practice characteristics of rehabilitation providers
N (%)
Provide services in group practice? 30 (40.5)
Optical shop at practice/agency? 5 ( 6.7)
Services provided in Spanish? 25 (34.7)
Time for appointment?
< 1 week 17 (24.6)
1 – 2 weeks 25 (36.2)
3 – 4 weeks 9 (13.0)
> 1 month 6 ( 8.7)
Do not know 12 (17.4)
Do you take walk in appointments?
Yes 27 (42.9)
Only in an emergency w/ est. patient 7 (11.1)
No 29 (46.0)
Average number of patients seen per week 12.9
Median 10
Range 1-40
Sources of patient referral
Themselves 11.2
Family or friends 13.3
Ophthalmologist 15.2
Optometrist 11.1
Another physician including a family 5.6
physician
Hospital emergency room 0.3
Schools 13.4
Vision screening program 7.0
Other 25.8
Few rehabilitation providers accepted health insurance plans for payment (Table 23). For
example, the most commonly accepted was Medicaid (14.8%), followed by Medicare (11.1%)
and Blue Cross Blue Shield (11.1%). Of those responding, 49.4% did not accept health
insurance.
29Table 23. Patient health insurance plans accepted by rehabilitation providers
Insurance plans N (%)
Medicare 9 (11.1)
Medicare Complete 5 (6.2)
Medicaid 12 (14.8)
Blue Cross Blue Shield 9 (11.1)
Viva 2 ( 2.5)
Viva Medicare Plus 2 ( 2.5)
United Healthcare 4 ( 4.9)
Cigna 3 ( 3.7)
Aetna 3 ( 3.7)
Multiplan 0 ( -- )
GEHA 0 ( -- )
Tricare/Champus 4 ( 4.9)
Veterans Administration coverage 4 ( 4.9)
CHIP (Children’s Health Insurance 1 ( 1.2)
Program)
Others 8 ( 9.9)
Do not accept health insurance 40 (49.4)
Approximately 50% of rehabilitation participants provided in-home services (Table 24). The
most frequent service provided was training in the use of assisted devices (63.3%), training in
strategies to perform everyday tasks (55.7%), orientation and mobility training (43.0%), home-
based education or training (40.5%), computer and software training (39.2), vocational
rehabilitation and career counseling services (36.7), and support groups for clients and families
(32.9%). Other services specified by respondents included administrative, awareness and
outreach, teaching Braille, and cognitive testing.
Table 24. Service characteristics of rehabilitation providers
Provide in-home services 40 (49.4)
Services provided:
Training in the use of assistive devices (e.g., 50 (63.3)
optical, non-optical)
Orientation and mobility training 34 (43.0)
Eccentric viewing training or training in 15 (19.0)
preferred retinal loci
Scanning strategy training 20 (25.3)
Training in strategies to perform everyday visual
tasks (e.g., household activities, managing 43 (55.7)
money, preparing meals)
Psychological or counseling services 10 (15.2)
Support groups (for clients and/or families) 26 (32.9)
Social work services 6 ( 7.6)
Driving rehabilitation 3 ( 3.8)
Home-based visits for education or training 32 (40.5)
Vocational rehabilitation or career counseling 29 (36.7)
services
Training in the use of computers and software 31 (39.2)
Other 18 (22.2)
30You can also read