Maintaining Power System Security with High Penetrations of Wind and Solar Generation - International insights for Australia - AEMO
←
→
Page content transcription
If your browser does not render page correctly, please read the page content below
Maintaining
  Power System
  Security with
  High Penetrations
  of Wind and Solar
  Generation

October 2019

International insights for Australia

© AEMO 2019 | Maintaining Power System Security with High Penetrations of Wind and Solar Generation
Important notice

PURPOSE
The purpose of this insights paper is to set the scene for AEMO’s ongoing investigations into renewable
integration in Australia and identify any additional priority focus areas, as described more fully overleaf in
“Purpose of the Renewable Integration Study (RIS)”. This insights paper is generally based on information
available to AEMO as at 1 October 2019 unless otherwise indicated.

DISCLAIMER
While AEMO has made every reasonable effort to ensure the quality of the information in this insights paper,
we cannot guarantee that information, forecasts and assumptions are accurate, complete or appropriate for
your circumstances.
Anyone proposing to use the information in this insights paper (which includes information and forecasts
from third parties) should independently verify its accuracy, completeness and suitability for purpose, and
obtain independent and specific advice from appropriate experts.
Accordingly, to the maximum extent permitted by law, AEMO and its officers, employees and consultants
involved in the preparation of this insights paper:
• make no representation or warranty, express or implied, as to the currency, accuracy, reliability or
  completeness of the information in this insights paper; and
• are not liable (whether by reason of negligence or otherwise) for any statements, opinions, information or
  other matters contained in or derived from this insights paper, or any omissions from it, or in respect of a
  person’s use of the information in this insights paper.

ACKNOWLEDGEMENT
AEMO acknowledges the support, co-operation and contribution of the numerous third parties named
throughout this insights paper, in providing data and information. AEMO’s acknowledgement and thanks to
third parties should not be read as external endorsement of the paper’s contents.

COPYRIGHT

© 2019 Australian Energy Market Operator Limited. The material in this publication may be used in
accordance with the copyright permissions on AEMO’s website.

© AEMO 2019 | Maintaining Power System Security with High Penetrations of Wind and Solar Generation

Context and Purpose of this Insights Paper
The transformation of the power system is presenting new engineering challenges that must be addressed.
Since Australia is leading in many regards in its increase in wind and solar, it is incumbent upon AEMO to
understand the challenges and put solutions in place before they impair operations.
AEMO’s Integrated System Plan (ISP)1 articulates a whole-of-system development pathway for the National
Electricity Market (NEM), to design and execute the transition in a way that maximises benefits at lowest cost
and risk to consumers. AEMO develops a range of future scenarios in the ISP to evaluate the potential
changes that can occur on the power system, and to identify no regrets investments that can be made to
provide the best outcome for consumers.
In addition to the ISP, AEMO conducts further analysis where there is merit in a deeper level of inquiry,
including analysis of those technologies that are at the forefront of the transformation. AEMO has published
several relevant reports into the changing generation mix 2, including a recent study into storage as a
significant component of the modern integrated power system3 and an analysis of the implications of
residential and commercial solar penetration in the Western Australian South West Integrated System (SWIS)4.
As a supplement to developing the 2020 ISP, AEMO commenced the Renewable Integration Study (RIS)5
to take a deeper review into the specific system implications and challenges associated with the integration
of large amounts of variable inverter-based renewable generation and decentralised energy on the power
system.
AEMO’s Power System Requirements reference paper presented an overview of the specific requirements of
the power system6. The RIS builds on that paper, to explore the specific opportunities and risks for
maintaining the physical requirements of the power system while integrating variable inverter-based
renewable resources at increasing levels of penetration. This in-depth review will inform future ISPs as well as
providing foundational engineering advice to government and administrative policy-makers to support their
consideration of future changes needed in electricity regulations and market designs.
The RIS is being undertaken in a series of steps:
1. A review of leading international experience in wind and solar photovoltaic (PV) integration (this report).
2. Detailed analysis of phenomena specifically related to wind and solar PV technologies7, including:
       – Managing changes in wind and solar output.
       – Assessing the adequacy of frequency control in the power system.
       – Operating with increasing levels of distributed energy resources (DER).
3. Presenting a view of what operating the NEM could look like over the next decade. This will include the
   combined results of this international review, AEMO’s detailed analysis in the RIS, and the results of
   ongoing industry investigation into the more localised limits to wind and solar PV penetration (for
   example, network congestion and localised system strength).

1
    See http://www.aemo.com.au/Electricity/National-Electricity-Market-NEM/Planning-and-forecasting/Integrated-System-Plan.
2
    Appendix A.3 provides a summary of relevant past AEMO publications into the changing generation mix.
3
    AEMO, ISP Insights – Building power system resilience with pumped hydro energy storage, July 2019, at https://www.aemo.com.au/-/media/Files/Electricity/
     NEM/Planning_and_Forecasting/ISP/2019/ISP-Insights---Building-power-system-resilience-with-pumped-hydro-energy-storage.pdf.
4
    AEMO, Integrating Utility scale Renewables and Distributed Energy Resources in the SWIS, March 2019, at https://www.aemo.com.au/-/media/Files/
     Electricity/WEM/Security_and_Reliability/2019/Integrating-Utility-scale-Renewables-and-DER-in-the-SWIS.pdf.
5
    AEMO, Renewable Integration Study, July 2019, at https://www.aemo.com.au/Electricity/National-Electricity-Market-NEM/Security-and-reliability/Future-
     Energy-Systems/Renewable-Integration-Study.
6
    AEMO, Power System Requirements, March 2018, at https://www.aemo.com.au/-/media/Files/Electricity/NEM/Security_and_Reliability/Power-system-
     requirements.pdf.
7
    The study uses a projected generation mix and network configuration in 2025 as a focus for its detailed analysis. 2025 was chosen as the focus for the first
     stage of the RIS to enable more detailed focus and increase confidence and certainty in outcomes of power system models, because AEMO has a
     reasonable level of information about the generation projects that might be connected out to 2025.

© AEMO 2019 | Maintaining Power System Security with High Penetrations of Wind and Solar Generation                                                                1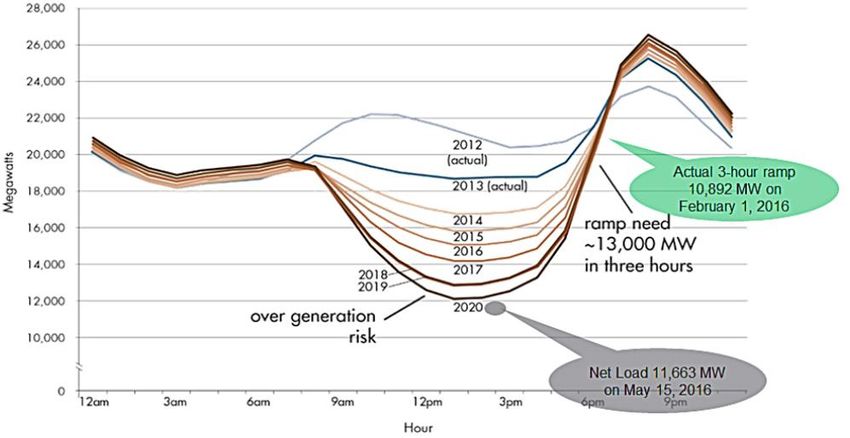
4. Engaging with local and international organisations and independent experts to review and collaborate on
   AEMO’s preliminary findings.
5. A final report in Q1 2020 into the technical challenges and any possible identified system limits associated
   with integrating increasing levels of variable inverter-based resources, and a roadmap of priorities to
   manage these challenges.
In this first step, AEMO is supplementing previous studies with a review on how Australia compares with other
comparative international power systems. The objectives of this international review are:
• First, comparison of the technical challenges that Australia has experienced or identified with the
  experience of other jurisdictions to reveal any previously undetected challenges.
• Second, to update understanding of how these other jurisdictions are managing the technical
  requirements of their power systems during the transformation, and what practices appear effective from
  a technical perspective.
• Third, evaluating these various approaches to see if there are lessons that can be applied to achieve better
  outcomes in Australia’s NEM and SWIS.
AEMO stresses that this international review is to help inform potential approaches to current and emerging
technical challenges, not necessarily to prescribe specific approaches that have worked overseas. Although
the physics underlying power system operation are universal, the need for a particular solution is impacted by
different features of each system, including the level of interconnection with adjacent systems, geographic
size, generation mix, and local climate conditions. Prevailing regulatory and market design considerations also
influence how any necessary requirements can be most effectively implemented in a particular jurisdiction.
This international review has identified five key insights, which are summarised below and explored in more
detail on the following pages:
1. Parts of Australia are already experiencing some of the highest levels of wind and solar generation in the
   world, including one of the highest levels of residential solar PV.
2. Successfully integrating high levels of DER requires an increasing level of visibility, predictability, and
   controllability of these small distributed devices. Australia can learn from several jurisdictions in its
   approaches to these challenges.
3. Managing variability and uncertainty is increasingly challenging at higher levels of wind and solar
   generation. Australia can learn from others in their approaches, including the assessment of system
   ramping requirements and fleet capability.
4. Australia should consider international approaches to frequency management in high renewable
   generation systems, including approaches to maintaining sufficient inertia and enablement of primary
   frequency response on all generators.
5. International power system operators have taken a staged approach to operating power systems with
   progressively less synchronous generation online. A similar approach could be considered in Australia.

© AEMO 2019 | Maintaining Power System Security with High Penetrations of Wind and Solar Generation               2

Key international insights on renewable integration

      Parts of Australia are already experiencing some of the highest levels of wind and solar generation
      in the world, including one of the highest levels of residential solar PV.

• Synchronously interconnected8 power systems have operated for periods where wind and solar energy
  was larger than demand – including Denmark (157%) and South Australia (142%).
• Island power systems9 have operated at high levels of wind and solar generation relative to demand –
  Ireland (85%), Tasmania (70%), and Great Britain (67%).
• Australia is achieving these very high levels while at the forefront of connecting wind and solar generation
  in areas with low system strength10.
• Australia has one of the highest penetrations of residential solar in the world (20% of homes). The most
  comparable international system, in terms of both the penetration and impact of residential solar on
  system operation, is the island of Oahu in Hawaii.

      Successfully integrating high levels of DER requires an increasing level of visibility and
      controllability of these small distributed devices. A minimum level of predictable performance
      during power system disturbances is also needed. Australia can learn from several jurisdictions in
      their approaches to these challenges, and how these approaches can benefit consumers.

• Lack of visibility of DER compromises the system operator’s ability to understand their behaviour and
  appropriately manage the power system. The Electric Reliability Council of Texas (ERCOT) has taken steps
  to collect static information about DER installed on its networks and integrate this information in its power
  system models. New regulations have been introduced in the NEM mandating collection of static device
  information of all DER11, and AEMO is in the process of developing updated load models 12. Other
  jurisdictions have the advantage of a level of real-time operational visibility of significant portions of
  their DER fleet (for example, 70% of small-scale PV in Germany and Italy are commercial systems with
  telemetry). Currently AEMO and Australian distribution network service providers (DNSPs) have limited to
  no real-time visibility of PV systems less than 5 megawatts (MW).
• As passive DER increases, system operators’ controllability of the power system reduces. EPRI found that
  control of DER is often the most cost-effective, and potentially the only, solution to ensure security13. Some
  form of feed-in management over a large fleet of residential solar PV systems has been implemented by
  system operators in Germany, Japan, and Hawaii, but so far these are only intended for isolated
  emergency situations. The NEM and SWIS do not currently have any means to actively control residential
  DER, even in emergency situations.
• Recognising the system impacts of increasing penetrations of residential PV, several jurisdictions have
  recently mandated improved inverter functionality for small-scale PV systems. In Europe, this has been
  through national level implementations of the European Network Code for Generators introduced in 2016,
  most notably Germany and Denmark. In the US, California and Hawaii updated their own local
  requirements in 2016, which in 2018 were integrated within the US national standard for DER connection.

8
     Synchronously interconnected systems are connected to other power systems via alternating current interconnectors.
9
     Island power systems are either not interconnected or are interconnected using high voltage direct current.
10
     See Section 3.5 for a discussion of system strength.
11
     See https://www.aemc.gov.au/rule-changes/register-of-distributed-energy-resources.
12
     AEMO, Technical Integration of DER Report, pages 63 and 64, at https://www.aemo.com.au/-/media/Files/Electricity/NEM/DER/2019/Technical-
     Integration/Technical-Integration-of-DER-Report.pdf.
13
     EPRI International Review on Opportunities to Activate DER, at https://aemo.com.au/Electricity/National-Electricity-Market-NEM/DER-program/Standards-
     and-Protocols.

© AEMO 2019 | Maintaining Power System Security with High Penetrations of Wind and Solar Generation                                                      3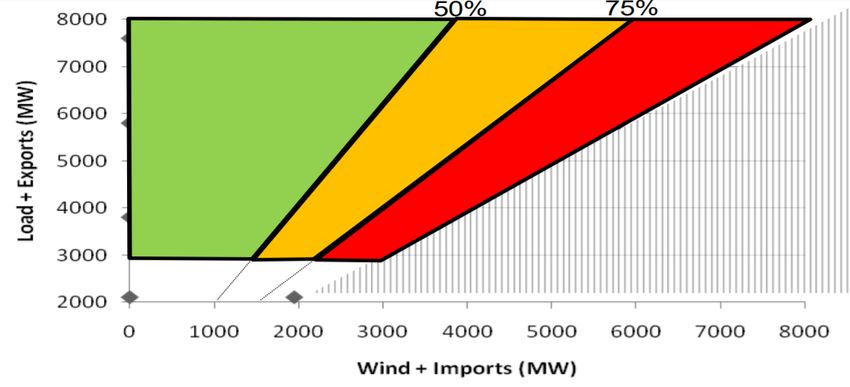
AEMO is leveraging learnings from international standards development, and in collaboration with DNSPs
and local industry, is progressing the introduction of similar requirements in Australia.
Managing variability and uncertainty is increasingly challenging at higher levels of wind and solar
generation. Australia can learn from others in their approaches, including the assessment of system
ramping requirements and fleet capability.
• EUSysFlex – a large cooperative program of work in Europe – identified a likely reduction in system
flexibility if variable generation displaces conventional generation in an uncoordinated way 14. California
has seen a steady drop in midday demand due to high levels of installed solar generation, creating a large
ramp up to the evening peak15.
• To ensure a sufficient amount of system flexibility is available to cover renewable variability, Ireland and
California have implemented ramping constraints that interface with their scheduling process. The
constraints account for uncertainty in demand, renewable generation (utility and distributed), and
conventional generation.
• AEMO is undertaking detailed analysis as part of the RIS to understand how ramping challenges are likely
to emerge in the NEM with increasing levels of variable wind and solar generation. Of particular focus will
be quantifying how system variability changes as more variable generation is installed, and the level of
inherent uncertainty in forecasting the output of these generators on any day.
Australia should consider international approaches to frequency management in high renewable
generation systems, including approaches to maintaining sufficient inertia and enablement of
primary frequency response on all generators.
• In Texas and Ireland, primary frequency response (PFR) is required from conventional and renewable
generation in response to small and large disturbances. The SWIS shares this requirement, but the NEM
does not – only a subset of available generation is required to respond to larger disturbances, when
selected by the market. AEMO has recently recommended changes to the regulatory framework in the
NEM to require PFR from all generators16.
• Texas and Ireland have employed inertia requirements that are applicable at all times. Similarly, Great
Britain and Ireland have employed rate of change of frequency (RoCoF) requirements that apply at all
times. The NEM currently has select inertia and RoCoF requirements that are only active under certain
circumstances.
International power system operators have taken a staged approach to operating power systems
with progressively less synchronous generation online. A similar approach could be considered in
Australia.
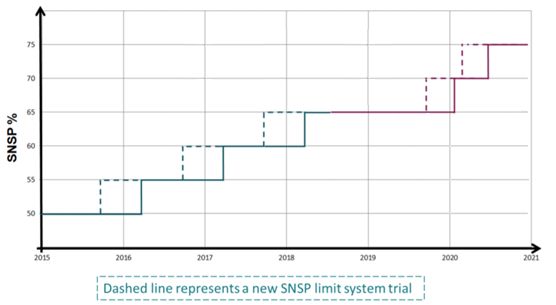
• Of the operators surveyed, EirGrid (Ireland and Northern Ireland) is taking a staged approach to relaxing
power system operational limits related to minimum numbers of synchronous generators online.
• Consideration should be given to how new system conditions can be trialled safely in the NEM and SWIS.
This could include taking a precautionary approach (such as mitigating risks and holding extra reserve) for
a period (for example, one year) while the system is operated closer to its limits (for example, with fewer
synchronous generators online) to build experience and confidence, before accepting those conditions as
a new norm.
14
EUSysFlex Literature Review , accessed 11 September 2019, at http://eu-sysflex.com/wp-content/uploads/2018/12/D2.1_State-of-the-Art_Literature_Review_
of_System_Scarcities_at_High_Levels_of_Renewable_Generation_V1.pdf.
15
See https://www.caiso.com/Documents/FlexibleResourcesHelpRenewables_FastFacts.pdf.
16
At https://www.aemc.gov.au/rule-changes/mandatory-primary-frequency-response.
© AEMO 2019 | Maintaining Power System Security with High Penetrations of Wind and Solar Generation 4
Contents
Context and Purpose of this Insights Paper                                                             1
Key international insights on renewable integration                                                    3

1.        What does this insights paper explore?                                                      6

2.        How does Australia compare?                                                                 8
2.1       Rise of wind and solar                                                                       8
2.2       Pioneers in renewables                                                                       9
2.3       Comparing different systems                                                                 10
2.4       Leaders in distributed energy resources (DER)                                               13

3.        What can Australia learn from other systems?                                                14
3.1       Priority focus areas                                                                        14
3.2       Frequency management                                                                        16
3.3       Managing variability and uncertainty                                                        19
3.4       Voltage management                                                                          21
3.5       System strength                                                                             22
3.6       DER integration                                                                             25
3.7       Other system limits                                                                         28
3.8       Staged transition                                                                           29

4.        Next steps                                                                                  31
4.1       Actions AEMO is taking                                                                      31
4.2       What AEMO intends to do from here                                                           33
4.3       How to get involved                                                                         33

A1.       Abbreviations                                                                               34

A2.       Glossary                                                                                    36

A3.       Reference resources                                                                         37

© AEMO 2019 | Maintaining Power System Security with High Penetrations of Wind and Solar Generation    5
1. What does this insights
   paper explore?
Australia’s large17 power systems continue to undergo an unprecedented and rapid
transition, changing the way in which they will be operated.
Supplying electricity via large interconnected power systems involves a continual balancing of variables over
timescales from years ahead, down to days, hours, minutes, seconds, and sub-seconds. Public discussion
regarding the increasing uptake of renewable energy resources as part of the electricity supply chain often
touches on one or more of the following issues:
• Sustainability – seeking ways to reduce the greenhouse gas emissions associated with electricity supply.
• Reliability of supply – ensuring there is enough electricity available to meet demand at all times,
  particularly when power is being generated from sources that vary with the wind and the sun.
• Affordability – how increased reliance on renewable energy will affect electricity prices.
These questions typically focus on timeframes from years down to days.
Critically important, but less commonly covered in public discussion, is the need to always keep the system
within safe operating limits (referred to as maintaining power system security). This relates to timeframes from
days down to sub-seconds. The focus of this paper is these critical security challenges and how other
jurisdictions are addressing them. If these security limits are exceeded, the power system is designed to
systematically shut down parts of the system, to avoid permanent damage to equipment and prevent health
and safety risks. System security events can lead to customer supply interruptions that last longer and affect
more customers than supply shortfall events on hot summer days.
As an additional consideration, discussions of future energy policy are increasingly touching on the concept
of resilience. A resilient power system is planned and operated to be robust in the face of disturbances, and
to respond and recover from disturbances in a desired way18.
An in-depth analysis of the implications of increasingly high levels of renewables onto Australia’s power
system helps prepare in advance for addressing the known and developing challenges the transformation
presents. This international review provides an important baseline of analysis to help ascertain whether
international experiences identify challenges and solutions that add to Australia’s independent understanding
of these challenges. AEMO’s approach includes:
• The identification of power systems experiencing high levels of renewable penetration (Section 2.2).
• The analysis of different characteristics of these systems, to identify similarities and differences to the
  characteristics of Australia’s large power systems (Section 2.3).
• The identification of large power systems with the highest levels of DER (Section 2.4).
• The key learnings from practical experience of large power systems regarding power system security with
  increasing levels of renewable energy (Section 3). This was based on discussions with the operators of five
  power systems deemed relevant to the Australian context, including:
       – Electric Reliability Council of Texas (ERCOT) (Texas, USA).

17
     For the purposes of this report, ‘large’ power systems are defined as systems having a peak demand greater than 1 GW. Australia’s two large power
     systems are the National Electricity Market (NEM) on the east coast, and the South-West Interconnected System (SWIS) on the west coast. The
     geographical extent of the NEM and SWIS are shown in Figure 3 in Section 2.3.
18
     AEMO explored the concept of power system resilience in its submission to the AEMC Discussion paper: Mechanisms to enhance resilience in the power
     system, page 7, at https://www.aemc.gov.au/sites/default/files/2019-09/AEMO%20-%20Submission%20to%20the%20Discussion%20Paper%20-
     %20EPR0057.pdf.

© AEMO 2019 | Maintaining Power System Security with High Penetrations of Wind and Solar Generation                                                       6
– National Grid Electricity System Operator (National Grid) (Great Britain).
– EirGrid (Ireland and Northern Ireland).
– Hawaiian Electric Company (Hawaii, USA).
– Energinet (Denmark).
• Leveraging the insights from AEMO’s previously commissioned review of how comparable power systems
around the world are integrating DER and resolving the associated system challenges (Section 3.6)19.
• Identification of previous international reviews into the management of increasing levels of renewable
generation, including a summary of key focus areas for maintaining power system security (Section 3.1).
Details on next steps and how to get involved with AEMO’s ongoing RIS are provided in Section 4.
19
EPRI International Review on Opportunities to Activate DER, at https://aemo.com.au/Electricity/National-Electricity-Market-NEM/DER-program/Standards-
and-Protocols.
© AEMO 2019 | Maintaining Power System Security with High Penetrations of Wind and Solar Generation 72. How does Australia
compare?
2.1 Rise of wind and solar
Many countries with limited access to hydro, biofuel, or geothermal energy are looking
towards more sustainable electricity supplies and have focused on wind and solar
technologies.
Wind generation and solar PV technologies are evolving quickly, and a steady reduction in costs combined
with a variety of government subsidies and incentives has led to increasing uptake over the last 20 years.
Figure 1 shows that annual global investments in solar PV and wind exceeded investments in other generation
technology in 2018.
Figure 1 Global investment in the power sector by generation technology, 2018
Sourced from International Energy Agency (2019) World Energy Investment 2019 review, at https://www.iea.org/wei2019/.
Wind and solar PV technologies have several characteristics that differ from those of historically dominant
power generation technologies, including:
• Variability – having fuel sources that are based on weather, rather than sources that can be stockpiled for
continuous use like coal, gas, or large hydroelectric schemes 20.
• Inverter-based resources (IBR) – devices that interface with the grid using a power electronic device
(called an inverter) 21. Solar PV systems, high voltage direct current (HVDC) converters, and most new wind
turbines are all IBR. The inverters digitally synthesize an output to match the power system alternating
current (AC) waveform. These devices operate in different ways to conventional generating systems in
coal, gas, and hydro plants which interface to the grid with a rotating electro-mechanical generator.
• Decentralised – there is a growing uptake of small to medium generators spread out across the network
(such as wind and solar farms in remote areas away from population centres) and highly decentralised
micro generators like residential solar PV and batteries. This contrasts with traditionally having fewer large
power stations, located as close as possible to major population centres.
20
These resources are often referred to as variable renewable energy (VRE) resources.
21
The terms ‘non-synchronous’ and ‘asynchronous’ have been historically used in Australia when referring to inverter-based resources. For the purposes of
this paper, AEMO has used the term inverter-based resources (IBR).
© AEMO 2019 | Maintaining Power System Security with High Penetrations of Wind and Solar Generation 82.2 Pioneers in renewables
Australia is experiencing some of the highest instantaneous levels of wind and solar
generation in the world. Synchronously interconnected22 power systems have operated for
periods where wind and solar energy was larger than demand – including Denmark (157%)
and South Australia (142%). Island systems23 have operated at high levels of wind and solar
generation relative to demand – Ireland (85%), Tasmania (70%), and Great Britain (67%).
Electricity demand is continually varying – seasonally (depending on climate heating and cooling demand),
daily (weekdays experience higher demand than weekends), and hourly (total demand is lowest in the middle
of the night). Wind and solar generation also vary as the wind blows and the sun follows its daily cycle (or is
interrupted by cloud cover). Periods of high renewable generation are not always coincident with high
demand. As such, it is becoming more frequent for large power systems to operate during some periods
where the majority of demand is being supplied by variable IBR.
Figure 2 compares Australian power systems to selected large international power systems with high
penetrations of wind and solar generation24 and a high degree of isolation25.
Figure 2 Large international power systems operating with high instantaneous penetrations of wind and
solar generation, and Australian comparisons 26
The first column in Figure 2 shows the proportion of each region’s annual energy served by wind and solar,
and the second shows the period with the maximum proportion of wind and solar relative to system
demand27. Parts of Australia are already operating at world-leading levels.
22
Synchronously interconnected systems are connected to other power systems via alternating current interconnectors.
23
Island power systems are either not interconnected or are interconnected using high voltage direct current.
24
https://www.iea.org/renewables2018/.
25
As Denmark has the highest level of wind and solar in the world, it was included for comparative purposes despite being heavily interconnected with the
European and Scandinavian power systems,
26
Data sources for Figure 2: Denmark (https://docstore.entsoe.eu/Documents/Publications/Statistics/Factsheet/entsoe_sfs2018_web.pdf and
http://osp.energinet.dk/_layouts/Markedsdata/framework/integrations/markedsdatatemplate.aspx?language=en), Ireland and Northern Ireland
(http://www.eirgridgroup.com/site-files/library/EirGrid/System-and-Renewable-Data-Summary-Repor%20July%202019t.xlsx), Great Britain
(https://www.gov.uk/government/statistics/uk-energy-in-brief-2019 and https://gridwatch.co.uk/), Hawaii (https://www.hawaiianelectric.com/about-
us/power-facts), Texas (http://www.ercot.com/content/wcm/lists/172484/ERCOT_Quick_Facts_01.17.19.pdf), Australia (https://assets.cleanenergycouncil.
org.au/documents/resources/reports/clean-energy-australia/clean-energy-australia-report-2019-fact-sheet.pdf, and internal database).
27
Numbers greater than 100% are achieved if the variable inverter-based power is larger than demand and the excess power is exported.
© AEMO 2019 | Maintaining Power System Security with High Penetrations of Wind and Solar Generation 92.3 Comparing different systems Every power system has physical characteristics that are unique, such as networks, generation mix, and load composition. There is no one system that can be looked to for direct comparative purposes. Instead, AEMO is identifying the comparable characteristics of each system, and combining the learnings to build a complete picture. Each power system will have differing challenges as it transitions to a power system dominated by variable IBR. To understand the nature of the transition for each power system it is important to consider the following characteristics: • Resource location and network topology – relates to the physical locations of generators and power lines and is a product of the geographic area being served, the location of major population centres, and the location of generators. Figure 3 below compares the bulk power system of the jurisdictions covered in this report. It demonstrates the vastly greater scale that the Australian system has compared to the different Irish, Danish, British, Hawaiian, and even Texan systems, which cover much smaller areas than the NEM in eastern Australia. Figure 3 Comparison of network topologies Source: Country outline/jurisdictions: https://gadm.org/data.html, Texas, Oahu Transmission: https://hifld-geoplatform.opendata. arcgis.com/datasets/electric-power-transmission-lines/ European lines: Unofficial extract of ENTSO-E map by Gridkit, link: https://zenodo.org/record/55853#.XYsMRfkzaUk, Geosciences Australia - Electricity Transmission Lines database, Available here: https://data.gov.au/dataset/ds-ga-1185c97c-c042-be90-e053-12a3070a969b/details?q= © AEMO 2019 | Maintaining Power System Security with High Penetrations of Wind and Solar Generation 10
• System complexity – can be related to the number of connected participants and how difficult it is to
  predict the behaviour of the system. As an example, Hawaiian Electric owns and controls the network and
  the existing thermal generators, allowing more central management to accommodate variable IBR28. In
  comparison, large systems like Great Britain, Texas, and the NEM in Australia have hundreds of large
  generators competing in liberalised electricity markets. With such a large combination of possible
  outcomes in the energy market, constant analysis is required to ensure the system is secure. Figure 4
  (column 4) compares the peak demand of high renewable systems identified.
• System flexibility – if the system is flexible, it will be able to accommodate more variable generation. The
  flexibility of a resource is the extent to which its output can be adjusted or committed in or out of service
  including speed of response to start up and shut down, rate of ramping, and whether it can operate in the
  full range of capability or has restrictions29. While new sources of flexibility, most notably the demand side,
  offer huge potential to increase system flexibility, historically the main source of flexibility has been from
  the generation fleet. The installed capacity by fuel type relative to peak system demand is shown in the
  first column of Figure 4. Tasmania’s generation fleet is predominantly hydro, Hawaii’s mostly oil, and
  South Australia, Ireland, and Western Australia are dominated by gas; these fuel sources are historically
  quite flexible. This contrasts with Queensland, New South Wales, and Victoria, whose existing generation
  fleet is predominantly coal-fired, which is historically less flexible. While fuel type can be taken as a proxy
  for flexibility, there can be a wide range of flexibility, depending on specific plant design.
• Coincidence of resource and demand – both are variable, based on season and throughout the day.
  Electricity travels at close to the speed of light and is consumed as it is generated; if the availability of
  energy is coincident with demand it can be accommodated more economically. The second column of
  Figure 4 shows the installed capacity of variable resources relative to system peak demand. The Australian
  mainland power system demand is higher in summer, which seasonally coincides with high solar output 30.
  Conversely, Ireland has low demand at midday in summer when solar output is at peak, but wind is higher
  in winter when seasonal demand is high, but this may also be high during the night when demand is low.
• Storage – can be used to help balance the system, storing energy when there is a surplus and discharging
  when most needed. Installed storage capacity (gigawatts [GW]) relative to peak demand is shown in the
  third column in Figure 4. Storage has traditionally been installed using synchronous pumped hydro
  storage, and AEMO has published an ISP Insights paper on pumped storage developments in the NEM31.
  Battery storage technology is improving, and costs are reducing. An island like Hawaii (Oahu), which
  imports expensive oil to power the system and has a surplus of solar generation during the day, has an
  installed capacity of batteries equivalent to 14% of peak demand.
• Interconnection – can be used to help balance the system, exporting energy when there is a surplus and
  importing when needed. There are two types of interconnection between large power systems: AC
  interconnection allows the transfer of active power, synchronous inertia and system strength, while
  HVDC interconnection allows the transfer of active power. The third column in Figure 4 shows installed
  interconnection capacity relative to peak demand. Denmark is heavily interconnected with the central
  European and Scandinavian power systems with both AC and HVDC, which means it can rely on its
  neighbours for balancing and stabilising services. By contrast, Oahu in Hawaii, Western Australia’s SWIS,
  and the NEM have no interconnection and must source all their requirements locally.

28
     From discussions with Hawaiian Electric.
29
     Resource flexibility is discussed in more detail in AEMO’s Power System Requirements paper, p 6, at https://www.aemo.com.au/-/media/Files/Electricity/
     NEM/Security_and_Reliability/Power-system-requirements.pdf.
30
     The daily peak demand is in the evening with peak generation during the day.
31
     At https://www.aemo.com.au/-/media/Files/Electricity/NEM/Planning_and_Forecasting/ISP/2019/ISP-Insights---Building-power-system-resilience-with-
     pumped-hydro-energy-storage.pdf.

© AEMO 2019 | Maintaining Power System Security with High Penetrations of Wind and Solar Generation                                                           11
Figure 4 Installed components of large international power systems relative peak demand Data Sources: Australia (AEMO, Generation Information: https://www.aemo.com.au/Electricity/National-Electricity-Market-NEM/Planning-and-forecasting/Generation-information, Australian PV Institute, PV Postcode Data: https://pv- map.apvi.org.au/postcode) Great Britain (Department for Business, Energy & Industrial Strategy, Digest of UK Energy Statistics: https://www.gov.uk/government/statistics/electricity-chapter-5-digest-of-united-kingdom-energy- statistics-dukes; Department for Business, Energy & Industrial Strategy, Solar Photovoltaics Deployment: https://www.gov.uk/government/statistics/solar-photovoltaics-deployment) Oahu (Hawaiian Electric, Power Facts: https://www. hawaiianelectric.com/about-us/power-facts; Hawaii State Energy Office, Hawaii Renewable Energy Projects Directory: https://energy.ehawaii.gov/epd/public/energy-projects-list.html)Ireland (EirGrid, All-Island Generation Capacity Statement 2018-2027: http://www.eirgridgroup.com/site-files/library/EirGrid/Generation_Capacity_Statement_2018.pdf; Sustainable Energy Authority of Ireland, Ireland’s Solar Value Chain Opportunity: https://www.seai.ie/ publications/Solar-Chain-Opportunity-report.pdf) Denmark (Energi Data Service, Capacity Per Municipality Data: https://www.energidataservice.dk/en/dataset/capacitypermunicipality; IEA PV Power Systems Programme, National Survey Report of Photovoltaic Applications in Denmark 2017: http://iea-pvps.org/index.php?id=93&eID=dam_frontend_push&docID=4457) Germany, Italy (ENTSO-E, Net Generating Capacity: https://www.entsoe.eu/data/power- stats/net-gen-capacity/; ENTSO-E, Ten Year Network Development Plan 2018 Executive Report, Appendix: https://tyndp.entsoe.eu/Documents/TYNDP%20documents/TYNDP2018/consultation/Main%20Report/ TYNDP18%20Exec%20Report%20appendix.pdf, Bloomberg New Energy Finance, New Energy Outlook 2019 data viewer: https://about.bnef.com/new-energy-outlook/)Texas (ERCOT, Capacity changes by fuel type: http://www.ercot.com/content/wcm/lists/162615/Capacity_Changes_by_Fuel_Type_Charts_November_2018.xlsx; ERCOT, Unregistered DG Installed Capacity Quarterly Report, http://www.ercot.com/services/rq/re/dgresource; U.S. Energy Information Administration, Electric Power Monthly with Data for July 2019: https://www.eia.gov/electricity/monthly/current_month/epm.pdt Table 6.2.B)California (California ISO, Key Statistics August 2019: California Energy Commission, Electric Generation Capacity & Energy: http://www.caiso.com/Documents/MonthlyStats-August2019.pdf https://ww2.energy.ca.gov/almanac/electricity_data/electric_generation_capacity.html; California Distributed Generation Statistics: https://www.californiadgstats.ca.gov/charts/nem; Self-Generation Incentive Program, State-wide Report: https://www.selfgenca.com/documents/reports/statewide_projects) © AEMO 2019 | Power System Security with High Penetrations of Wind and Solar Generation 12
2.4               Leaders in distributed energy resources (DER)
A further dimension of the changing generation mix is the uptake of residential and
commercial rooftop solar and batteries, increasing the decentralisation of energy supply.
Australia has nearly 2 million rooftop solar installations covering 20% of all homes, up to a
third in some regions, making it a world leader in household solar per capita.

DER are comprised of devices and capabilities co-located with customer loads (either in front of or behind the
meter) or embedded within distribution networks. Compared to centralised sources, the disaggregated
nature of DER poses some distinct integration challenges. Historically, distribution networks were not
designed with the accommodation of local generation in mind.
Of the systems considered, the island of Oahu in Hawaii was the most comparable to Australia in terms of
residential PV (where approximately 32% of households have PV systems installed)32. As illustrated in Figure 4,
other jurisdictions with similar shares of distributed solar capacity to Australia typically have significantly
smaller shares of residential PV. For example, around 30% of distributed solar in Germany and Italy are at the
household level, with the bulk of installations being larger systems. In these jurisdictions, larger,
commercial-scale systems have stronger performance requirements, a degree of system operator visibility,
and (in some cases) controllability – which is not generally the case with smaller residential systems.
The extent to which distribution networks can accommodate DER is influenced by two main aspects:
• Distribution network topology – refers to the physical characteristics of the distribution system. Some
  high-DER subregions internationally – such as Vermont (US), Bavaria (Germany), and parts of Japan – are
  within highly meshed interconnected systems. In comparison, Australian distribution networks are
  characterised by longer distances serving lower average population densities (despite some high-density
  urban pockets). As a result, generalised DER hosting capacity rules of thumb33 may not always be as
  appropriate in an Australian context. More sophisticated assessment techniques are being explored in
  Australia and internationally34,35. Efforts are underway in the NEM to collect and consolidate data across
  DNSPs for the development of adequate network models of low voltage distribution feeders36 for hosting
  capacity assessment.
• Distribution network monitoring and capability – refers to the DNSPs’ level of visibility of their low-
  voltage network assets and the extent to which they can actively manage these assets to accommodate
  changes in electricity flows due to increasing behind-the-meter generation from DER. Some distribution
  network operators internationally have a level of visibility via customer metering. In Australia, only Victoria
  has sufficient levels of advanced metering for DNSPs to take advantage of this. Jurisdictions in Australia
  experiencing higher levels of DER are installing advanced measurement facilities within their networks as
  an effort to improve network visibility. Australian and international jurisdictions are trialling a variety of
  active distribution network management initiatives37.

32
     Utility Dive, accessed 26 September 2019, at https://www.utilitydive.com/news/17-of-hawaiian-electric-customers-now-have-rooftop-solar/413014/.
33
     CIGRE Technical Brochure 586, WG C6-24, Capacity of Distribution Feeders for Hosting Distributed Energy Resources, 2014, at
     https://www.cigreaustralia.org.au/assets/ITL-SEPT-2014/3.1-Capacity-of-Distribution-Feeders-for-hosting-Distributed-Energy-Resources-DER-abstract.pdf.
34
     EPRI, Distributed PV Monitoring and Feeder Analysis, at https://dpv.epri.com/hosting_capacity_method.html.
35
     NREL, Advanced Hosting Capacity Analysis, at https://www.nrel.gov/solar/advanced-hosting-capacity-analysis.html.
36
     ARENA, Low-voltage Feeder Taxonomy Study, accessed 26 September 2019, at https://arena.gov.au/projects/national-low-voltage-feeder-taxonomy-
     study/.
37
     IEA PVPS, High Penetration of PV in Local Distribution Grids, at http://www.iea-pvps.org/index.php?id=373&eID=dam_frontend_push&docID=
     2210.

© AEMO 2019 | Maintaining Power System Security with High Penetrations of Wind and Solar Generation                                                      13
3. What can Australia
learn from other
systems?
While some characteristics of each power system differ, the underlying physics of large AC
power systems are universal. For power system operators managing systems with high
levels of wind and solar, there is a well understood group of technical challenges. Each
system offers learning opportunities based on operators’ progress to date managing
changes in the context of their system.
When operating a secure and reliable power system, there are minimum technical requirements that must be
maintained38. This chapter explores which technical requirements are most impacted by increasing levels of
wind and solar generation, and the comparable experiences of power system operators internationally.
For the reasons stated in Section 2, each system faces a different combination of challenges depending on its
characteristics. International power systems also differ in how advanced they are in addressing these
challenges, creating opportunities for knowledge sharing and collaboration.
3.1 Priority focus areas
To focus our renewable integration efforts in the right places, AEMO sought out leading international efforts
into the management of increasing levels of renewable generation, including:
• EUSysFlex – a 20 million euro, four-year, cooperative effort to test operation of the pan-European
electricity system with more than 50% of renewable energy sources 39. It involves a multinational
consortium of system operators, aggregators, technology providers, research institutions, and consultants.
• MIGRATE – a multinational collaboration to address challenges of operating parts of the European
electricity system during periods with very high levels of inverter-based wind and solar generation40.
• Electric Power Research Institute (EPRI) review of international approaches to activating DER in the
energy market41.
• The distillation of key learnings from practical experience of power systems operating with increasing
levels of renewable energy, particularly:
– Electric Reliability Council of Texas (ERCOT) (Texas, USA).
– National Grid Electricity System Operator (National Grid) (Great Britain).
– EirGrid (Ireland and Northern Ireland).
38
An overview of these physical prerequisites is provided in AEMO’s Power System Requirements reference paper, published March 2018, at
https://aemo.com.au/-/media/Files/Electricity/NEM/Security_and_Reliability/Power-system-requirements.pdf.
39
EUSysFlex, accessed 31 August 2019, at https://eu-sysflex.com/.
40
MIGRATE, accessed 31 August 2019, at https://www.h2020-migrate.eu/.
41
EPRI for AEMO (Jul-2019) Activation of DER in the Energy Market, at https://aemo.com.au/Electricity/National-Electricity-Market-NEM/DER-
program/Standards-and-Protocols.
© AEMO 2019 | Maintaining Power System Security with High Penetrations of Wind and Solar Generation 14The MIGRATE and EUSysFlex programs have published detailed reviews that summarise the main technical
constraints or barriers for system operators to maintain power system security with high penetrations of IBR
and renewable energy respectively42,43.
EPRI recommended a set of best practice principles and resulting technical and market enablers for the
efficient and secure integration of high penetrations of passive DER 44. These priority focus areas fall into the
categories shown in coloured columns of Table 1. The table then gives a high-level summary of the extent to
which different power systems have defined specific limits that impact variable IBR for each technical
requirement. Each system has defined its limits in different ways.
A breakdown of these different experiences is provided in the remaining sections of Chapter 3.
Table 1 Comparison of system limits by jurisdiction
Defined system limits that impact renewables
Ireland /
Great
System Attribute Requirement Focus Area NEM SWIS Northern Texas
Britain
Ireland
Primary Frequency
See section 3.2
Response Enabled
Maintain
Frequency
○ ○ ● ○ ●
frequency within Synchronous
Management
limits Inertia
RoCoF ○ ○ ● ● ○
◐ ◐ ◐ ◐ ◐
Maintain voltages
Voltage
within limits
● ○ ○ ○ ○
Maintain stability System Strength
Voltage of system Bulk System
Management
Maintain stability
◐ ○ ○ ○ ◐
System Strength
of individual Generation Connection
generating system
System Variability
○ ○ ◐ ◐ ◐
● ○ ● ○ ○
Minimum Synchronous
Maintain system in Unit Combinations
Other
○ ○ ● ○ ○
secure state
SNSP
DER
○ ○ ○ ○ ○
● Limit specified which currently limits the penetration of wind and solar
◐ Limit specified which may indirectly limit penetration of wind and solar
○ No specified limit
42
At https://www.h2020-migrate.eu/_Resources/Persistent/9bf78fc978e534f6393afb1f8510db86e56a1177/MIGRATE_D1.1_final_TenneT.pdf.
43
EUSysFlex Literature Review , accessed 31 August 2019, at http://eu-sysflex.com/wp-content/uploads/2018/12/D2.1_State-of-the-
Art_Literature_Review_of_System_Scarcities_at_High_Levels_of_Renewable_Generation_V1.pdf.
44
EPRI International Review on Opportunities to Activate DER, at https://aemo.com.au/Electricity/National-Electricity-Market-NEM/DER-program/Standards-
and-Protocols.
© AEMO 2019 | Maintaining Power System Security with High Penetrations of Wind and Solar Generation 153.2 Frequency management
Changes in the generation mix are fundamentally changing the way the system responds
to imbalances in power.
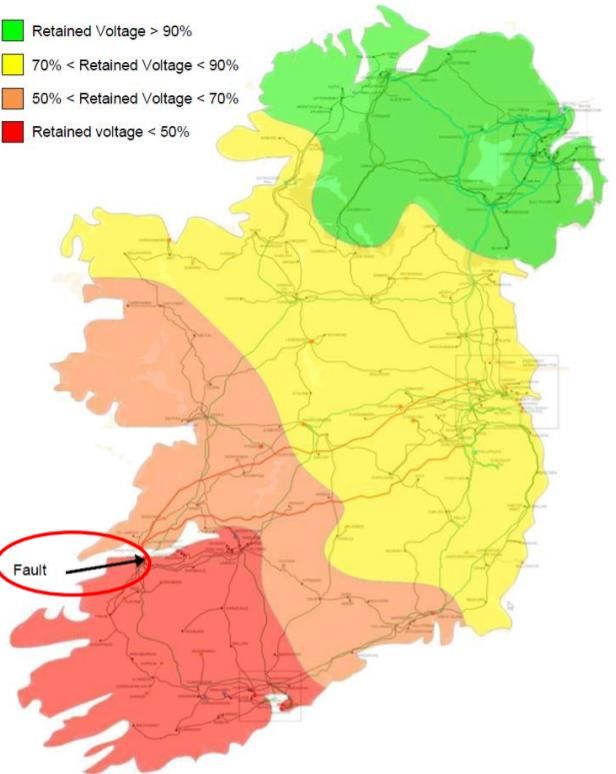
All power systems must have the ability to set and maintain frequency within design limits. If frequency is not
controlled, it can lead to a cascading failure, with generators disconnecting from the power system as the
frequency decreases or increases. In 2016, AEMO commissioned a report, International Review of Frequency
Control Adaption, much of which is still relevant today45.
Frequency management is broken into two categories. The first relates to the system response after small
continuous imbalances in power, and the second relates to managing large imbalances of power.
3.2.1 Small imbalances
The continuous matching of supply and demand is needed to keep the frequency as close to nominal as
possible (50 Hz in Australia and Europe, and 60 Hz in North America).
• Primary frequency response (PFR) is when a generator measures the local frequency and adjusts its
output in response.
– PFR capability – it is mandatory in the jurisdictions assessed to have the capability to control the
frequency for both conventional and renewable generators.
– PFR enablement for conventional generators – this is mandatory in all the reviewed jurisdictions
other than the NEM. In the NEM, there is no existing requirement for PFR to operate in a way that is
sensitive to small frequency changes, however, there are some generators that currently do operate
this way46.
– PFR enablement for renewable generators – in Texas and Ireland, it is also mandatory for renewable
generators to have PFR enabled. In Ireland and Northern Ireland, the grid operator can change the
settings of PFR on renewable plant in real time to make them more responsive to small frequency
changes. This is currently being used to manage grid issues such as damping low frequency common
mode oscillations47. This level of control in Ireland also allows the grid operator to control the
frequency above or below the nominal to manage high and low frequency risk48.
– Reserving headroom – while PFR may be mandatory in some jurisdictions, reserving headroom and
enablement of the service is remunerated through different mechanisms. AEMO has recently
recommended changes to the regulatory framework in the NEM to require PFR from all generators49.
• The NEM has a centrally dispatched frequency regulation service that operates through the Automatic
Generator Control (AGC) system. The AGC system is responsible for five-minute dispatch of generator
output as well as a faster service that adjusts generator output targets every four seconds. Texas employs
a similar central system, but it is accompanied by requirements for generators to regulate through PFR.
PFR and central regulation are not directly interchangeable, due to differences in the speed and qualities
of the response from each. Central regulation provides a slower response suitable for assisting with
correcting frequency over longer periods. It helps keep generators on their dispatch target and controls
the average frequency, known as time error correction.
45
At https://www.aemo.com.au/-/media/Files/Electricity/NEM/Security_and_Reliability/Reports/2016/FPSS---International-Review-of-Frequency-Control.pdf.
46
At https://www.aemc.gov.au/rule-changes/mandatory-primary-frequency-response.
47
At http://www.eirgridgroup.com/site-files/library/EirGrid/DS3-Advisory-Council-23-May-2018.zip.
48
Discussions with EirGrid.
49
At https://www.aemc.gov.au/rule-changes/mandatory-primary-frequency-response.
© AEMO 2019 | Maintaining Power System Security with High Penetrations of Wind and Solar Generation 163.2.2 Large imbalances
Large unexpected changes in power balance happen from time to time on the grid, caused by disconnection
of sources or sinks of power. This can happen for several reasons, such as disconnection of customer plant.
The system must have adequate reserves to quickly balance the energy change to keep the system stable.
• Primary Frequency Response – as with small imbalances, PFR is needed to arrest the frequency change
following a large imbalance. The response is typically provided in the range of 0.1 to 15 seconds and is
procured differently in each jurisdiction assessed. Definitions vary, but for the purposes of this report, Fast
Frequency Response (FFR) is defined as a rapid injection of active power (in a time period of 1-2 seconds
or less), to arrest the frequency decline following a contingency event. In Ireland, Great Britain, and Texas,
operators have incentivised provision of an FFR-type service.
Table 2 Overview of primary frequency response requirements by jurisdiction
Conventional Renewable
Jurisdiction
Capability Enablement Capability Enablement
requirement requirement requirement requirement
East Coast Australia (NEM) Yes Market Based Yes Market Based
Western Australia (SWIS) Yes Yes Yes For over frequency
Ireland/Northern Ireland Yes Yes Yes Yes
Mandatory when Mandatory when
Great Britain Yes selected under Yes selected under
contract contract
Texas Yes Yes Yes Yes
From Review of International Grid Codes, February 2018, at https://certs.lbl.gov/sites/default/files/international_grid_codes_lbnl-
2001104.pdf. Definitive information for Denmark and Hawaii not available to AEMO at time of publication.
• Largest risk covered is the size of the unexpected imbalance for which the operator carries reserve.
Typically, this is the largest source of power and the largest consumer. When a power producer is
disconnected, additional power needs to be brought on, or sufficient load removed, to restore the power
balance. When a load is disconnected, surplus generation must be removed. In the NEM, SWIS, Ireland,
and Great Britain, the single largest loss is covered, which dynamically changes depending on the largest
risk at the time. In the NEM, reserve coverage can be increased due to an increased risk, such as an
environmental risk of lightning or bushfires near a double circuit interconnector. In Texas the amount
of reserve carried is to cover the simultaneous loss of the two largest nuclear units. See Table 3 for a
summary.
• Synchronous inertial response is the instantaneous transfer of energy from conventional rotating
machines to the grid. This is provided by the physics of the conventional machine and does not require
control system interaction. This transfer slows the Rate of Change of Frequency (RoCoF), giving control
systems time to adjust their output. Ireland and Texas have defined a minimum inertia level. The NEM
does not specify a minimum inertia level when the system is intact, but it does specify a minimum inertia
level for each state if there is a predetermined risk of islanding. No inertia level is specified in the SWIS,
although there is a requirement to avoid automated underfrequency load shedding for a single
contingency. In Tasmania, several hydro units can stay connected, with no power output, providing inertia
to the system50.
50
See https://www.aemo.com.au/Media-Centre/~/-/media/B47810C12E25473CB81968D5D4218F78.ashx.
© AEMO 2019 | Maintaining Power System Security with High Penetrations of Wind and Solar Generation 17You can also read