Forest Ecology and Management
←
→
Page content transcription
If your browser does not render page correctly, please read the page content below
Forest Ecology and Management 485 (2021) 118935

                                                                   Contents lists available at ScienceDirect

                                                        Forest Ecology and Management
                                                         journal homepage: www.elsevier.com/locate/foreco

Effects of forest harvesting and biomass removal on soil carbon and
nitrogen: Two complementary meta-analyses
Jason James a, *, Deborah Page-Dumroese b, Matt Busse c, Brian Palik d, Jianwei Zhang e,
Bob Eaton f, Robert Slesak g, Joanne Tirocke b, Hoyoung Kwon h
a
  Exponent Inc. Bellevue, WA 98007, USA
b
  Rocky Mountain Research Station, US Forest Service, Moscow, ID 83843, USA
c
  Pacific Southwest Research Station, US Forest Service, Davis, CA 95618, USA
d
  Northern Research Station, US Forest Service, Grand Rapids, MN 55714, USA
e
  Pacific Southwest Research Station, US Forest Service, Redding, CA 96002, USA
f
  Southern Research Station, US Forest Service, Research Triangle Park, NC 27709, USA
g
  Department of Forest Resources, University of Minnesota, St. Paul, MN 55108, USA
h
  Systems Assessment Center, Energy Systems Division, Argonne National Laboratory, Lemont, IL 60439, USA

A R T I C L E I N F O                                    A B S T R A C T

Keywords:                                                Forest residues and logging slash from pre-commercial forest thinning and regeneration harvests are a potential
Long term soil productivity                              feedstock for bioenergy production but there has been a concern about the impact of residue removal on forest
Soil carbon                                              soil C and N. This study aimed to address such by conducting two meta-analyses using the data available from
Soil nitrogen
                                                         published literature and an independent dataset compiled from the North American Long-Term Soil Productivity
Meta-analysis
Bioenergy production
                                                         (LTSP) study.
Whole tree harvest                                          For the meta-analysis using literature, we categorized forest harvesting and biomass removal into i) no harvest
                                                         control, ii) bole-only (BO, partial or clearcut) regular harvests, iii) BO with partial removal of logging slash and/
                                                         or O horizon (BO+Removal), iv) whole tree harvests (WTH), and v) WTH with slash and O horizon removal
                                                         (WTH+Removal). Accordingly, we compiled soil C and N data and key statistics (e.g., standard deviation) from
                                                         142 scientific articles published since 1979. We compared the results from this meta-analysis with data from 22
                                                         installations of the LTSP study where three levels of organic matter removal - BO, WTH, and WTH plus forest
                                                         floor (+FF, O horizon) removal - as well as an additional vegetation control (+VC) were measured for two
                                                         decades in either completely randomized or randomized block design.
                                                            In the literature meta-analysis, BO+Removal (-19.2%), WTH (-15.4%) and WTH+Removal (-24.9%) contained
                                                         significantly less soil C than no-harvest controls across combined soil depths, while BO had no difference. Within
                                                         individual mineral soil horizons, only BO+Removal and WTH+Removal treatments contained significantly less
                                                         carbon than controls. There was a high degree of heterogeneity in treatment response between studies in the
                                                         literature. The analyses from the LTSP dataset showed no significant difference in combined soil depths for WTH
                                                         or WTH+VC relative to BO harvest, but there was significantly less soil C in BO+VC (-3.6%), WTH+FF (-8.5%)
                                                         and WTH+FF+VC (-15.3%). These treatment effects declined over time since harvest, particularly the most
                                                         intensive treatments. Soil N results largely mirrored soil C in both meta-analyses with smaller estimated effects
                                                         for most treatments at equivalent depths (except for WTH+Removal and WTH+FF+VC, which remain about the
                                                         same). There were no significant differences in soil N for combined soil depths between WTH and no-harvest
                                                         control (in the literature analysis) or BO harvest (for both analyses).
                                                            Since the most severe losses of soil C and N involved FF removal, WTH that accounts for modest removals
                                                         (
J. James et al. Forest Ecology and Management 485 (2021) 118935
1. Introduction research and monitoring (Powers, 2006). Since 1989, the LTSP sites,
located across the US and Canada, have provided valuable long-term
Bioenergy production has the potential to reduce fossil fuel used for data for forest research and results for forest management. One key
heating and transportation (Popp et al., 2014). Growing interest in finding from the first decade of the experiment was that complete
woody biomass feedstocks for bioenergy production has stimulated removal of surface organic matter (including O horizon) led to declines
studies from U.S. Forest Service (White, 2010) and U.S. Department of in soil C and nutrient concentrations to a depth of 20 cm in the mineral
Energy (Langholtz et al., 2016) that assess the resource potential of soil (Powers et al., 2005). By replicating the same study design across
biomass growth and production from managed forests at national and many forests, the LTSP network provides a powerful dataset to quantify
regional levels. In such assessments, scenarios are often developed to the effects of forest residue removal on forest C and N cycling as well as
evaluate the economic, ecological, landscape, and technical impacts of aboveground vegetation growth.
biomass yields, biomass to bioenergy conversion efficiencies, and By employing this dual meta-analytic approach, we evaluated the
management regimes on bioenergy wood production. For example, long-term impacts of harvesting forest residues as a cellulosic biofuel
forest restoration thinning is now actively practiced on national forest feedstock on soil C and N. In particular, our goals were to answer the
lands to reduce tree densities and wildfire hazard, and this means that following research questions:
woody residues are either moved off-site for bioenergy production or
burned in slash piles (Goerndt et al., 2012; Skog and Barbour, 2006). • What effect do different methods of biomass removal in addition to
In recent years, forest residues (i.e. logging residues and pre- conventional harvest have on soil C and N stocks?
commercial forest thinnings) have been proposed as a feedstock for • How does this effect differ with soil depth?
cellulosic biofuels along with corn stover and dedicated energy crops • Are the effects on soil C and N persistent or are they reversible with
(Williams et al., 2009). Historically, forest residues have been underu time?
tilized as a source of biomass feedstock because of low market demands • What effects do LTSP experimental treatments, including whole tree
and high transportation costs (Oswalt and Smith, 2014). Recent cost- harvest, forest floor removal, and herbicide application, have on soil
benefit analyses, however, suggest that as much as 65% of all forest C and N stocks?
residues could theoretically serve as a source for national biofuel pro • Are there differences in LTSP treatment effects with depth or time?
duction (Perlack et al., 2011). • Are the results of the literature synthesis and LTSP analyses com
Studies have investigated life-cycle energy consumption and green parable and consistent?
house gas (GHG) emissions for biofuels produced from forest residues
via either a thermo- or biochemical biomass conversion process, and 2. Methods
found potential for GHG offsets from woody biofuel production (Zanchi
et al., 2012). However, the environmental impacts of removing forest 2.1. Literature search
residues from forestlands have not been well quantified in life-cycle
analyses. In fact, forest residues can increase wood decay rates in the Meta-analysis is a cumulative activity which builds upon previous
mineral soil (Page-Dumroese et al. this issue) or on the soil surface (Finér studies with similar research questions and previous meta-analyses
et al. 2016), providing important ecosystem services such as maintain about forest harvesting effects on soil C have been conducted (James
ing site productivity (McKinley et al., 2011), minimizing erosion (Berhe and Harrison, 2016; Nave et al., 2010). In particular, we revisited the
et al., 2018), and preserving forest diversity (Attiwill and Adams, 1993; database of James and Harrison (2016), which included 112 literature
Buchholz et al., 2014). Forest residues also play a key role in the carbon publications between 1979 and 2016, recreated it, and added sampling
cycle in forest soils, resulting in the storage of significant quantities of variance information (standard deviation (SD), standard error (SE), and
soil C (Achat et al., 2015). As a result, harvesting forest residues for sample number) and soil N data (when available) from each study. More
bioenergy or biofuel could have long-term impacts on soil C, potentially importantly, we expanded the database with studies published between
reducing the net benefit of GHG offsets. 2016 and 2020 by performing the new literature search on the PRO
Several meta-analyses have assessed the impacts of harvesting and QUEST Dialog Databases, which include AGRICOLA, AGRIS, BIOSIS
residue removal on soil C (Achat et al., 2015; James and Harrison, 2016; Previews®, CAB ABSTRACTS, Ecology Abstracts, and Environment
Johnson and Curtis, 2001; Nave et al., 2010). In meta-analysis, results Abstracts, among others, using a set of search terms (Table 1).
from many studies that apply similar treatments are statistically A total of 1067 published papers since 2016 were screened, which
analyzed to provide cumulative answers that may not have been evident were further reviewed by checking abstracts to see if the study included
within individual sites (Hedges et al., 1999; Lajeunesse, 2011). Using treatments of interest and soil C and/or N data. A paper was deemed
this approach, Achat et al. (2015) showed that intensive harvests led to acceptable for inclusion in the analysis if a) a relevant forest treatment
soil C losses in all layers of forest soils. Similarly, James and Harrison (such as thinning or clearcutting) was implemented, b) unharvested
(2016) found that harvesting reduced soil C, on average, by 11.2% and control was reported, c) soil C and/or N stocks were reported, or could
there was substantial variation between responses in different soil be calculated from concentration and bulk density measurements, and
depths, with greatest losses occurring in the O horizon. d) both average and variance were reported for each treatment and
While meta-analysis is a powerful tool, the process of data synthesis control (either SE or SD and sample number). After checking the full
combines many different treatments and study designs from across the
peer-reviewed literature, which sacrifices the fine distinctions in treat
Table 1
ment implementation for greater generalizability. Ideally, a more Search terms used to survey peer reviewed literature for relevant studies.
comprehensive approach where an independent synthesis and meta-
Category Search terms
analysis are conducted using a separate dataset should be taken to
provide consistent study design in a wide variety of forests. This can be Media Soil carbon, SOC, soil C, soil organic matter, SOM, soil nitrogen,
accomplished through the North American Long-Term Soil Productivity soil N
Ecosystem Forest, hardwood, softwood, timber
(LTSP) study in which a similar experimental design was implemented Treatment Thinning, clear cut*, whole tree harvest, forest residue removal,
across a wide variety of forest soils (Powers, 2006). In our study, we forest floor removal, stand management, logging, forest harvest*
conducted meta-analyses on two different datasets – one of published Publication > January 1st 2016
literature and the other of an independent dataset compiled from the Year
LTSP study. The latter includes soil C and N data to quantify the con Note: the * search character was included after some search terms to capture
sequences of pulse soil disturbance on forest productivity through multiple word endings (e.g. cut, cuts, cutting)
2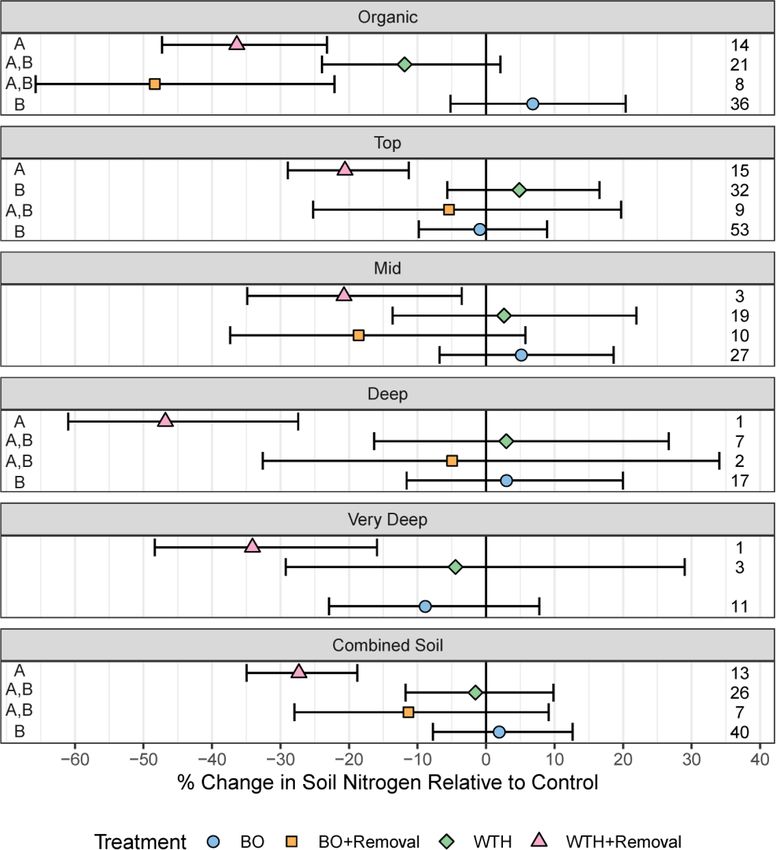
J. James et al. Forest Ecology and Management 485 (2021) 118935
texts of 41 papers identified as relevant, 30 papers were added into the from other published literature, LTSP adopted consistent percentage of
database of James and Harrison (2016) for a total of 142 papers used in residue removals for WTH and WTH+FF, which were approximately 80
the meta-analysis described below. and 100% of surface organics, among installations. At many of these
sites, plots were split and competing vegetation was controlled with
2.2. Data retrieval and effect size calculation either herbicide application or hand removal until crown closure of re
generated forest. However, because 18 combinations of three levels of
We gathered soil C and N data (including average, SD, sample counts, organic matter removal, three levels of compaction, and with and
and SE) from each study identified in the literature search and catego without (two levels) vegetation control were not replicated at each
rized them into every combination of soil depths and treatments we location, treatment effects (and standard errors) at each site were
considered in this study. Soil depths were separated into five groups – O averaged across levels of compaction and compaction effects were not
horizon, top soil (0–15 cm), mid soil (15–30 cm), deep soil (30–60 cm), evaluated. The treatments included in this analysis were:
and very deep soil (60–100+ cm). We also estimated the combined soil C
or N stock from the five soil depth groups for each treatment were • BO: bole-only harvest, where tree limbs and tops were left on site
calculated by summing the means of each sampled depth .Standard • BO+VC: bole-only harvest with complete vegetation control (planted
deviation for the combined soil estimate was calculated as the square trees only)
root of the sum of variances from each depth. Combined soil C or N stock • WTH: whole tree harvest where whole trees are removed from the
was calculated only for treatments with greater than 30 cm maximum study plot
sample depth. For example, a study with two treatments and a control • WTH+VC: whole tree harvest with complete vegetation control.
which measured the O horizon and two mineral soil depths would • WTH+FF: whole tree harvest with forest floor (O horizon) removal
generate 2 treatments × 4 depths (3 measured+combined soil) = 8 by hand or mechanical scraping
observations of treatment effect. • WTH+FF+VC: whole tree harvest with forest floor removal and
Due to the variety of harvest intensities and strategies in the pub complete vegetation control.
lished literature, we categorized forest harvesting and biomass removal
into i) bole-only (BO, partial or clearcut) harvests, ii) BO with partial Twenty-two LTSP sites located in California (CA), Idaho (ID),
(20–80%) removal of logging slash and/or O horizon (BO+Removal), Michigan (MI), Minnesota (MN), North Carolina (NC), Texas (TX),
iii) whole tree harvests (WTH), and iv) WTH with partial or complete Oregon (OR), and Washington (WA) were included (Table 2). Three
removal of logging slash and/or O horizon (WTH+Removal). Thinning studies from the literature database include data from LTSP sites -
and clearcut treatments were lumped together within each of these Mushinski et al. (2017) for Davy Crockett; Kurth et al. (2014) for
categories. Treatments that included fire, broadcast burning, prescribed Chippewa, Huron, and Ottawa; Laiho et al. (2003) for Croatan. Com
fire for fuel management, or tilling/scarification were excluded from the bined soil C and N stocks were calculated for each treatment at each site
analysis, as these treatments have distinct and sometimes severe effects in the same manner as the literature meta-analysis.
on soil C (James and Harrison, 2016; Nave et al., 2011) that are outside Effect size for each depth and treatment at LTSP sites was calculated
the scope of this manuscript. with the log response ratio (RR)–equations (1) and (2), above–except X2
To combine data across studies, effect size was calculated as the log was the mean C or N in the BO treatment rather than no-harvest treatment
response ratio (RR) for each treatment from each study (Hedges et al., as a control, which was used for the literature meta-analysis. Conse
1999; Lajeunesse, 2011). Effect size (RR) was calculated as: quently, the results of the literature synthesis and LTSP studies are not
( ) directly comparable because they are compared against different controls.
X1
RR = ln (1)
X2
2.4. Data analysis
where X1 is the mean C or N stock in a specific depth for an individual
treatment, and X2 is the mean C or N stock at the corresponding depth in The literature and LTSP soil C and N databases were analyzed with
the control (unharvested treatment). The SE of RR was calculated as: multi-level, mixed-effect, meta-regression models. Separate models
√̅̅̅̅̅̅̅̅̅̅̅̅̅̅̅̅̅̅̅̅̅̅̅̅̅̅̅̅̅̅̅̅̅̅̅̅ were fit to examine the treatment effects at different soil depths and the
SE[X1 ]2 SE[X2 ]2 treatment effects over time. In the meta-regression models, nested
SE[RR] = + (2)
X1
2
X2
2 grouping levels are used to express a hierarchical structure of random
effects (Sera et al., 2019; Viechtbauer, 2010). For the model of treatment
Studies that did not report measures of variance were not included in effects (Ti ) at different soil depths (Dj), random effects for each depth
the meta-analysis. The response ratio (and variance) can be back- group (bij ) and time since harvest (bik ) were nested within the reference-
transformed to be expressed as % change relative to control via equa specific random effect (bi ), for a linear model written as:
tion (3):
⎛ ⎞ ⎛ ⎞ RRijr = β0 + β1 Ti + β2 Dj + β3 Ti Dj + bi + bij + bik + εijkr (4)
X − X X
%Change = ⎝
t c ⎠ × 100 = ⎝ − 1⎠×100 = (e(RR) − 1) × 100 (3)
t
β0 is the model intercept .
Xc Xc β1 accounts for Treatment effect
β2 accounts for Depth effect
2.3. Long-Term soil productivity (LTSP) data β3 accounts for Treatment by Depth interaction
bi accounts for study (for literature dataset) or location (for LTSP
A largely independent dataset from the LTSP network was used to dataset) variability
evaluate the effect of various biomass removal treatments on soil C and bij accounts for depth variability within study i
N during the harvesting of original natural stands. The LTSP network is a bik accounts for temporal correlation within study i
set of research sites across the major timber regions in North America εijkr is residual variability
installed to address the impact of organic matter removal and compac i = 1, 2, ⋯, m studies and j = 1, 2, ⋯, mi depth groups in study i, and
tion on forest productivity of following rotations. Each study contained k = 1, 2, ⋯, nij time points at depth j in study i
three levels of organic matter removal (BO, WTH, and WTH+FF) com
bined with three levels of compaction (background, moderate, severe) in with bi ∼ N(0, τ1 2 ) and bij ∼ N(0, τ2 2 ) and bik ∼ N(0, γ2 2 ) and εijkr
( )
a completely randomized or randomized block design. Unlike the studies ∼ N 0, sijkr 2
3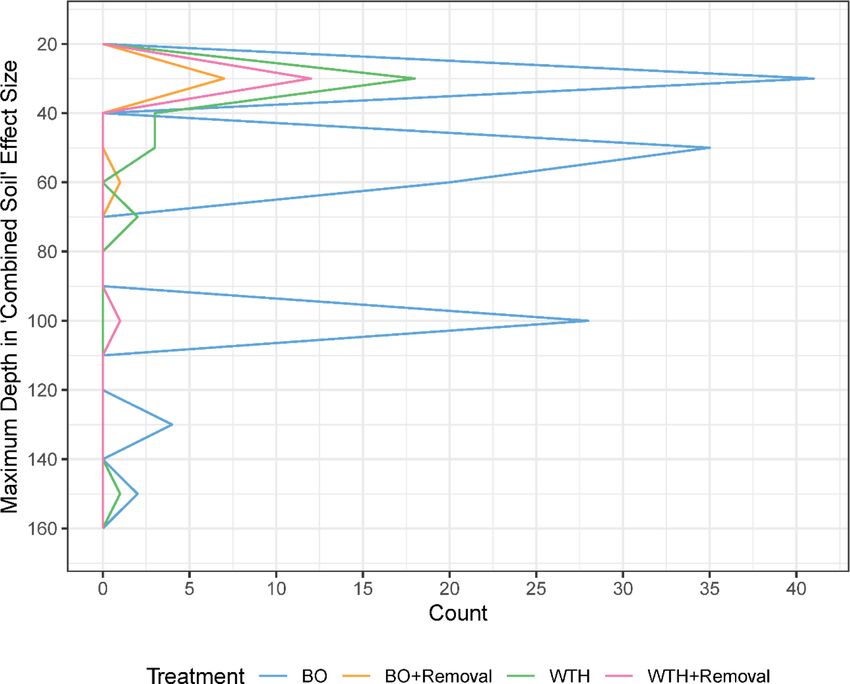
J. James et al. Forest Ecology and Management 485 (2021) 118935
Table 2
Site and pre-treatment stand characteristics of LTSP installations.
State Location Forest type Soil sampling interval (yr) Mean annual precipitation (mm) Texturea Number of response ratio (C and N)
CA Aspen Mixed conifer 0, 5, or 10 226 C 30, 30
Blodgett 0,10, or 20 1650 F 30, 30
Brandy 0,10, or 20 1900 F 30, 30
Central 0,10, or 19 1140 C 30, 30
Challenge 0,10, or 20 1730 F 30, 30
Cone 0, 5, or 10 238 C 30, 30
Lowell Hill 0,10, or 20 1730 F 30, 30
Owl 0,10, or 19 1140 C 30, 30
Rogers 0,10, or 20 1700 C 30, 30
Vista 0,10, or 19 760 C 30, 30
Wallace 0,10, or 20 1780 C 30, 30
ID Council Mixed conifer 0, 5, or 10 772 F 18, 18
Priest River 0, 5, or 10 873 F 12, 12
MIb Huron Aspen 0, 5,10, or 15 75 C 32, 32
Ottawa 0, 5,10, or 15 77 F 32, 32
b
MN Chippewa Aspen 0, 5,10, or 15 64 F 32, 32
NC Croatan Pine–hardwoods 0, 5,10, or 20 1360 F 45, 45
ORb Diamond Lake Douglas-fir 0 or 5 1234 C 4, 4
Molalla 0 or 10 1600 F 4, 0
TXb Davy Crockett Loblolly pine 0 or 20 1107 F 4, 4
WAb Fall River Douglas-fir 15 2260 F 18, 0
Matlock 0 or 10 2400 C 4, 0
a
C - coarse (contains gravel or greater than 60% sand); F - fine (no gravel & loam or finer texture)
b
Use values from published literature
Treatment and depth are of primary interest in this fitted model;
k = 1, 2, ⋯, nij time points at depth j in study i
therefore, they are fit with fixed effects and for the interaction term.
Random effects accounted for differences between studies, and different with bi ∼ N(0, τ1 2 ) and bij ∼ N(0, τ2 2 ) and bik ∼ N(0, γ2 2 ) and εijkr ∼
depth groups within studies. The data for this model utilizes calculated (
N 0, sijkr 2
)
effect sizes, i.e., log response ratios, and the associated uncertainty es
The temporal trend for each treatment effect at each depth is of
timates for each treatment and depth group within each study, rather
primary interest in this fitted model. Thus, they are fit with fixed effects
than raw replicate measurements. Replicate data would allow for a more
and two- and three-way interaction terms to allow the intercept and
standard least-squares approach if there were sufficient studies with
slope to differ for each depth measured in each treatment. Random ef
identical objectives, measurements, and replication. Uncertainty differs
fects accounted for differences between studies (bi), different depth
for each calculated RR, therefore the random effect terms in the fitted
groups within studies (bij), and the correlation between repeated mea
model also must account for these differences. In the definition of error
surements of the same treatments and depths over time (bik). The
structures above, N is the normal distribution. τ1 2 is the variance for the
structure of the temporal correlation was specified as heteroscedastic
random effects for study differences and τ2 2 is the variance for each autoregressive of first order, which allows the correlation between
depth group within each study. γ2 2 is the variance for the random effects measurements in a study to decrease the farther apart they are in time.
for each time point within each study. The data indexed by r represent τ1 2 is the variance of the random effects for study differences, τ2 2 is the
the nijk reported effect sizes for each time point k measured in depth
variance for each depth group within each study, and γ2 2 is the variance
group j nested within study i, each with known within-study variance for the random effects for each time point within each study. The data
sijkr 2 (from equation (2), above). indexed by r represent the nijk reported effect sizes for each time point k
Specification of the linear model for the analysis of treatment effects measured in depth group j nested within study i, each with known
over time utilized a longitudinal repeated measure meta-analysis to within-study variance sijkr 2 (from equation (2), above).
evaluate variability in effect sizes by study, accounting for the nij
For the LTSP data, location was included as a random effect in place
repeated measurements over time at depth j in study i. The full fitted
of reference, since multiple treatments were compared against a single
model can be written as follows:
bole-only treatment within each forest. Depth was included as a random
RRijkr =β0 + β1 Ti + β2 Dj + β3 tijk + β4 Ti Dj + β5 Ti tijk + β6 Dj tijk + β7 Ti Dj tijk effect nested within forest installation name to account for correlation in
+ bi + bij + bik + εijkr measurements of different soil depths within each site. Because the LTSP
data is structured with resampling of the same treatment plots in each
(5)
forest over 20 years, time since treatment was added as a second random
β0 is the model intercept effect nested within forest installation name. Separate models evaluated
β1 accounts for Treatment (T) effect the effect of treatments at different soil depths and over time.
β2 accounts for Depth (D) effect Tukey post-hoc comparisons between harvest treatments at each
β3 accounts for temporal (t) trend depth were evaluated for both the literature and LTSP databases (Hot
β4 accounts for Treatment | Depth interaction horn et al., 2008). The Benjamini and Hochberg (1995) correction for
β5 accounts for temporal trend within treatment levels the false discovery rate was used to adjust the significance level for
β6 accounts for temporal trend within depth groups multiple comparisons. For all statistical tests in this analysis, alpha was
β7 accounts for three-way Treatment | Depth | Time interaction 0.05. All statistical analyses were completed in the R statistical
bi accounts for study (literature) or location (LTSP) variability computing language (R Core Team, 2019). Meta-analytic models to
bij accounts for depth variability within study i evaluate the effect of treatments with soil depth and over time were fit
bik accounts for temporal correlation within study i using the rma.mv function in the metafor package (Viechtbauer, 2010).
εijkr is residual variability Multiple comparisons were computed with the glht function in the
i = 1, 2, ⋯, m studies and j = 1, 2, ⋯, mi depth groups in study i, and multcomp package (Hothorn et al., 2008).
4
J. James et al. Forest Ecology and Management 485 (2021) 118935
3. Results studies examining the three treatments were typically only 30 cm, which
was shallower than BO treatments (Fig. 2). Consequently, the relatively
3.1. Effect of harvesting and biomass removal treatments on soil C in the large effects seen in the combined soil are more highly influenced by
literature meta-analysis reductions in the O horizon and surface mineral soil.
Treatment effects varied with soil depth in the literature meta-
The combined soil C was significantly reduced compared to no- analysis (Fig. 1). Soil C in all three intensive treatments was signifi
harvest control for the treatments of BO+Removal (-19.2% [95% CI cantly reduced in the O horizon compared to no-harvest control, which
− 29.7 to − 7.2%]), WTH (-15.4% [-24.6 to − 5.1%]), and WTH+Re is in line with direct manipulation and removal of O horizon material by
moval (-24.9% [–32.2 to − 16.7%; Fig. 1, Supplementary Table 1). The these treatments. In the mineral soil, the WTH+Removal treatment was
difference was not significant between BO harvest and no-harvest con significantly different from no-harvest control in all depths but had very
trol. The WTH+Removal treatment also had significantly reduced soil C few or just a single effect size estimate below the topsoil. WTH in itself
compared to BO harvest. However, the sample size for the more inten was not significantly different from the control in the mineral soil. The
sive treatments was very small and thus may not be representative of BO+Removal treatment was significantly different from no-harvest in
broader-scale trends. Furthermore, the maximum sampling depths for the mid soil depth group (approximately 15–30 cm), although the 95%
Fig. 1. The effect of bole-only harvest (BO), whole tree harvest (WTH), and biomass removal (+Removal) on soil C in the organic horizon and different mineral soil
depths in the literature meta-analysis. Each estimate is shown with a 95% confidence interval. Within each facet, treatments with different capital letters are sta
tistically significantly different from each other (p < 0.05); facets without letters were not significantly different. The number of observations from literature included
in each estimate is listed on the right. Depth, time since harvest and reference were included as random effects in the model with depth and time nested within the
levels of reference. This accounted for correlation in the effects observed at different depths and times in the same study, as well as for correlation in effects of
different treatments within individual studies that utilize a single control treatment. The test of moderators was QM = 263 (df = 22), p < 0.0001, and test of residual
heterogeneity was QE = 7571 (df = 816), p < 0.0001, and I2 = 80.7%.
5
J. James et al. Forest Ecology and Management 485 (2021) 118935
Fig. 2. Frequency of maximum sampling depths for soil C effect sizes included in ‘combined soil’, split between treatments.
CI was wide due to the small number of effect sizes (11). No effect size were estimated to be close to no different from no-harvest control. The
estimates were available for the BO+Removal treatment deeper than 60 WTH treatments in the combined soil showed little temporal trend,
cm. which had a slight decline over the first decade and recovery toward no
I2 for the overall literature soil C model was 80.7%, which indicates change relative to no-harvest control largely driven by the O horizon. No
how much of the unaccounted variance in the observed effects (which is trend was evident in top mineral soil and only a small number of effect
composed of unaccounted variance in the true effects plus sampling sizes estimates were available in deeper mineral soil layers. It should be
variance) can be attributed to residual heterogeneity (Viechtbauer, noted that for WTH+Removal treatments, a decline over the first 20
2010). The high level of residual heterogeneity indicates that site- and years in combined soil C appears to be strongly influenced by a single
study-specific variability and environmental factors play a considerable study (Mushinski et al. 2017) where deep (~30–60 cm) and very deep
role in moderating the effects of harvest treatments on soil C (Thiffault (~60–100 + cm) soil were examined. I2 for the model was 81.3%, which
et al., 2011). indicates a high degree of residual variability was due to heterogeneity
The trend in treatment effects over time was fit with a second-degree in treatment responses among different papers. This heterogeneity re
polynomial within the meta-regression model to account for the initial flects both variance due to sampling and analytical error as well as site-
loss in soil C followed by a slow recovery over decades (Fig. 3). Studies and study-specific response to treatments. Differences in treatment
on regular BO harvesting practices extend much longer after treatment implementation and study design among studies in the literature also
than for BO+Removal, WTH, or WTH+Removal treatments (~110 years contributes to high residual heterogeneity. Fixed effect parameter esti
vs ~ 40 years for BO+Removal and ~ 20 years for WTH and mates and statistical tests for temporal models may be found in Table S2.
WTH+Removal). For BO harvest, combined soil C declined slightly over
the first 50 years and recovered around 100 years after treatment. While
declines in the O horizon were not consistently evident for the BO 3.2. Whole tree harvest (WTH), forest floor removal (+FF), and
treatment, slightly temporal trends were evident in top (~0–15 cm) and vegetation control (+VC) effects on soil C in LTSP installations
mid (15–30 cm) soil depths with more consistent decline in deep soil
(~30–60 cm). However this trend was driven by a relatively small The LTSP study provided an complementary dataset to indirectly
number of studies with lower variance, and a number of other studies compare with the results of the literature meta-analysis. One notable
show little difference or an increase relative to no-harvest control. difference in study design is the lack of a no-harvest control at most LTSP
Temporal trends for BO+Removal treatments were imprecise due to the sites. By using the least intensive treatment – BO harvest - as the de
gap in sampling timeframes between 5 and 35 years after treatment. nominator when computing effect sizes, the LTSP results are qualita
35–40 years after BO+Removal treatments, O horizon C had not yet tively comparable to the pairwise comparison of WTH and
recovered, but top (~0–15 cm) and mid (~15–30 cm) mineral soil C WTH+Removal treatments vs BO treatment in the literature meta-
analysis (Fig. 1). There is greater variability in the study design,
6J. James et al. Forest Ecology and Management 485 (2021) 118935
Fig. 3. The effect of intensive removal and regular harvest on soil C in O horizon and different mineral soil depths over time in the literature meta-analysis. Within
the meta-analytic model, the effect over time was fit with a second-degree polynomial. The meta-regression model fit was weighted by the inverse of the variance of
each effect size, which is visualized by the size of each point where larger points correspond with smaller variance. Grey areas represent 95% confidence intervals for
each temporal trend line. Time since treatment was also included in the model as a random effect nested within each reference; the random effects utilized a
heterogeneous autoregressive (co)variance structure to account for temporal correlation. The interclass correlation coefficient for time since treatment as a random
effect was 0.28. The test of moderators was QM = 599 (df = 60), p < 0.0001, and the test of residual heterogeneity was QE = 6527 (df = 778), p < 0.0001, with I2
= 88.7%.
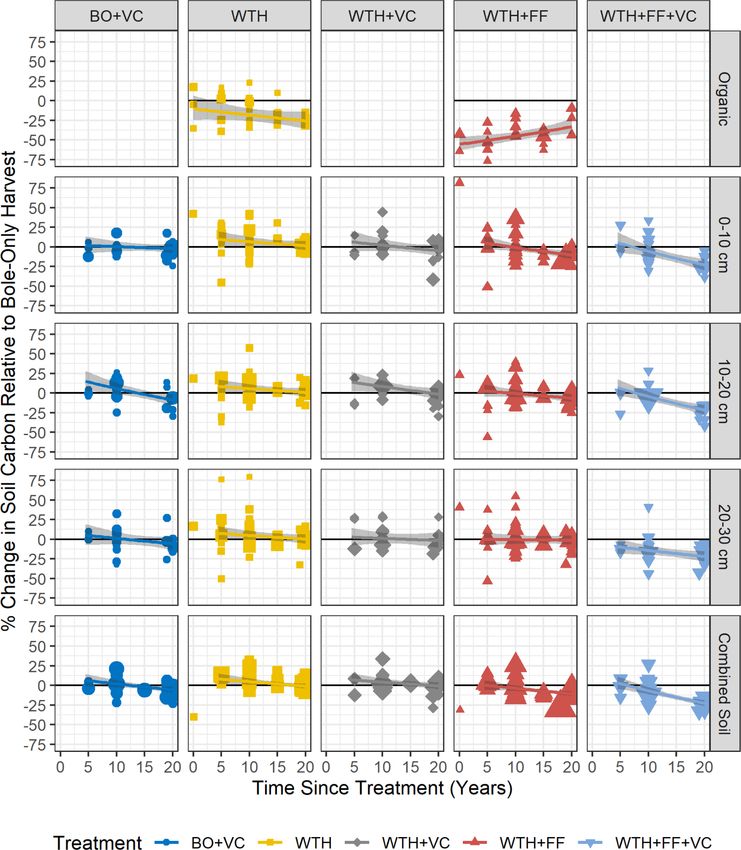
sampling depth, and treatment implementation/intensity in literature effect was small. Soil C in WTH and WTH+VC treatments was similar to
studies than in the LTSP meta-analysis. BO harvest within each soil depth group (except WTH in the O horizon)
Across the combined soil profile (O horizon + 0–30 cm mineral soil), as well as combined soil C, and the treatments were significantly
there was significantly less soil C relative to bole only harvest following different from WTH+FF and WTH+FF+VC. In addition to the large
BO+VC (-3.6% [95% CI − 6.3 to − 0.8%], p = 0.01), WTH+FF (-8.5% difference between WTH+FF and BO treatments in the O horizon, sig
[-10.7 to − 6.3%], p < 0.0001), and WTH+FF+VC (-15.3% [-18.0 to nificant soil C losses were observed in the 0–10 cm and 10–20 cm soil
− 12.5%], p < 0.0001) treatments (Fig. 4). While BO+VC was signifi depths for WTH+FF relative to BO harvest. Soil C in WTF+FF+VC
cantly different from BO harvest in combined soil, there was no signif treatments was significantly lower than BO harvest in all measured
icant difference in any of the individual soil depths and the size of the mineral soil depths with the largest decline occurring in the 20–30 cm
7J. James et al. Forest Ecology and Management 485 (2021) 118935
Fig. 4. The effect of whole tree harvest (WTH), forest floor removal (+FF), and herbicide application (+VC) on soil C relative to bole-only harvest (BO) at the LTSP
sites. Each estimate is shown with a 95% confidence interval. Within each facet, treatments with different capital letters are statistically significantly different from
each other (p < 0.05). The number of observations included in each estimate is listed on the right. Both time since treatment and depth were included as random
effects nested within individual LTSP sites. The random effects utilized a heterogeneous autoregressive (co)variance structure to account for temporal and spatial
correlation. The test of moderators was QM = 420 (df = 21), p < 0.0001, and test of residual heterogeneity was QE = 1173 (df = 655), p < 0.0001, and I2 = 59.1%.
depth interval. This was also the only treatment that was significantly treatment, while such trended downwards after WTH (Fig. 5); after 20
different from other treatments in mineral soil. WTH+FF+VC was years, O horizon C for both WTH+FF and WTH was approximately
significantly different than WTH alone in all mineral soil depths and in − 25% compared to BO harvest. Over two decades, all of the LTSP
the combined soil. This most intensive treatment was also significantly treatment effects trend downward in all three mineral soil sampling
different than WTH+VC and BO+VC treatments in the 10–20 cm and depths and in the combined soil (O horizon + 0–30 cm). The BO+VC
20–30 cm depth increments. This suggests a compounding effect of treatment trends downward in the combined soil, which corresponds
vegetation control and O horizon/harvest residue removal treatments. with declining trends in 10–20 cm and 20–30 cm depth intervals. The
I2 for the model was 59.1%, which indicates a moderate amount of WTH treatment has higher soil C than BO harvest control over the first
residual heterogeneity related to sampling and measurement error, site- 10–15 years after treatment but trends towards no change at 20 years
specific response, and other environmental factors. Adding other envi after harvest in all mineral soil depths and the combined soil. The
ronmental covariates to the model such as soil order and forest type did WTH+VC treatment had small temporal trends, declining slightly from 5
not improve model fit and were not statistically significant. Complete to 20 years after treatment in all mineral soil increments and the com
meta-analytic model results for depth comparisons can be found in bined soil. The WTH+FF treatment trended downward most steeply in
Table S3. the surface 0–10 cm with small or negligible trends in 10–20 cm and
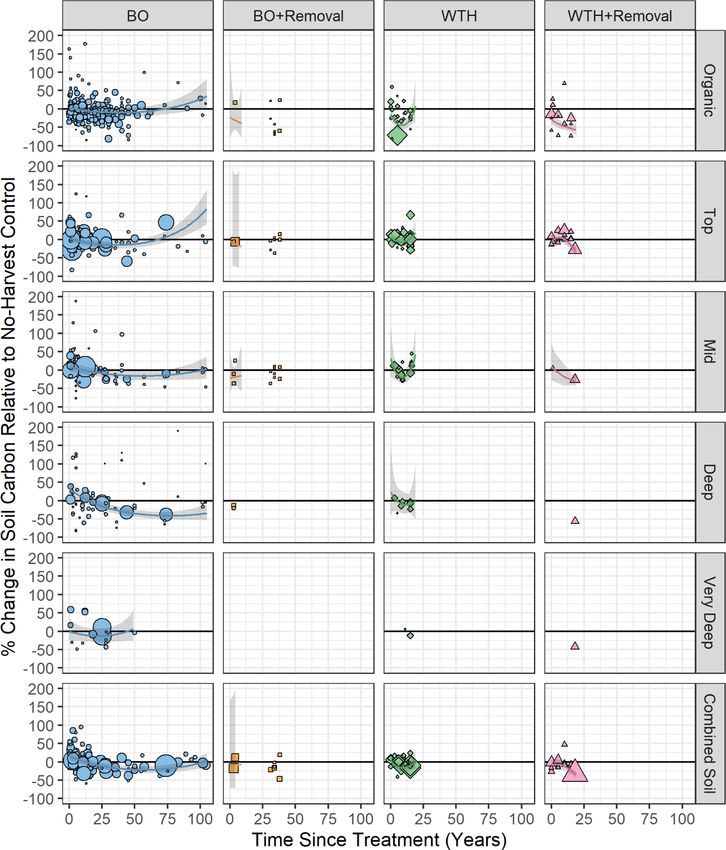
There were statistically significant trends for the effect on soil C 20–30 cm depths. Combined soil for WTH+FF trended downward over
relative to BO harvest in almost all LTSP treatments. In the O horizon, 20 years. The steepest declines over time were visible in the
the initial effect of WTH+FF is nearly − 50%, while it is closer to − 10% WTH+FF+VC treatment. No effect size estimates at 18–20 years after
when the forest floor is left in place (WTH; Fig. 5, Table S4). However, WTH+FF+VC treatment were larger than bole-only harvest. I2 for the
the C in the O horizon trended upwards over 20 years after WTH+FF model including time as a fixed effect (not just as a random effect nested
8J. James et al. Forest Ecology and Management 485 (2021) 118935
Fig. 5. The effect of whole tree harvest (WTH), forest floor removal (+FF), and vegetation control (+VC) on soil C over time since treatment relative to bole-only
harvest at the LTSP sites. The meta-regression model fit was weighted by the inverse of the variance of each effect size, which is visualized by the size of each point
where larger points correspond with smaller variance. Grey areas represent 95% confidence intervals for each temporal trend line. Time since treatment was also
included in the model as a random effect nested within each LTSP site. The random effects utilized a heterogeneous autoregressive (co)variance structure to account
for temporal correlation. The interclass correlation coefficient for time since treatment as a random effect was − 0.15. The test of moderators was QM = 466 (df = 43),
p < 0.0001, and test of residual heterogeneity was QE = 954 (df = 633), p < 0.0001, and I2 = 42.7%.
within each experimental forest) was 42.7%, which indicates that most 3.3. Effect of harvesting and biomass removal treatments on soil N in the
of the remaining variation was due to chance rather than site-specific literature meta-analysis
responses (heterogeneity). The lower I2 compared to the model
excluding time as a fixed effect (59.1%, above) illustrates that temporal Compared to soil C in the literature meta-analysis, treatment effects
trends were a substantial proportion of the remaining variation after on soil N were more muted and the number of studies reporting soil N
accounting for treatment effects. Coefficients for the trend lines in each stocks is smaller . Across the combined soil (O horizon plus 30 + cm of
LTSP treatment can be found in Table S4. mineral soil), only the WTH+Removal treatment was significantly
different from no harvest (− 27.3% (95% CI − 35.0 to − 18.8%; Fig. 6). In
the O horizon, there were significant effects for both +Removal treat
ments, which is axiomatic since the treatments fully or partially
removed the O horizon. Unlike soil C, there was no significant effect of
9J. James et al. Forest Ecology and Management 485 (2021) 118935
Fig. 6. The effect of intensive removal (whole tree harvest with or without forest floor removal) and regular harvest (all other types, including bole-only, clear-cut,
thinning, etc.) on soil N at different soil depths in the literature meta-analysis. Each estimate is shown with a 95% confidence interval. Within each facet, treatments
with different capital letters indicate significant difference from each other (p < 0.05); facets without letters were not significantly different.. The number of ob
servations from literature included in each estimate is listed on the right. Depth, time since harvest and reference were included as random effects in the model with
depth and time nested within the levels of reference. This accounted for correlation in the effects observed at different depths and times in the same study, as well as
for correlation in effects of different treatments within individual studies that utilize a single control treatment. The test of moderators was QM = 268 (df = 22), p <
0.0001, and test of residual heterogeneity was QE = 6439 (df = 347), p < 0.0001, with I2 = 93.7%.
WTH on O horizon N. In the mineral soil, only WTH+Removal was the model excluding time as a fixed effect and suggests that heteroge
significantly different from no-harvest control. The WTH+Removal neity in soil N responses among different studies is not related to tem
treatment was also statistically significantly different from BO harvest in poral differences.
topsoil (~0–15 cm), deep soil (~30–60 cm), and combined soil. How
ever, in deep soil only one study estimated the effect of WTH+Removal
in the deep or very deep soil (~60–100 + cm) intervals. I2 for the meta- 3.4. Whole tree harvest (WTH), forest floor removal (+FF), and
analytic model was 93.7%, which indicates that a high degree of vegetation control (+VC) effects on soil N at the LTSP sites
remaining variance is associated with heterogeneity in study- and site-
specific response to treatment. Across the combined soil (O horizon + 0–30 cm mineral soil), there
There were no statistically significant temporal trends for soil N in were significant reductions in soil N relative to bole only harvest
the literature meta-analysis, with the lone exception of an increasing following BO+VC (-4.4% [95% CI − 7.6 to − 1.0%], p = 0.01), WTH+FF
trend in very deep soil (60–100 + cm) after BO harvest (Table S.6 and (-3.5% [-6.1 to − 0.7%], p = 0.01), and WTH+FF+VC (-13.3% [-16.2 to
Figure S.1). Across combined soil, no temporal trends in soil N were − 10.2%], p < 0.0001) treatments (Fig. 7). The WTH+FF+VC treatment
evident. I2 for the model was 89.6%, which is only slightly lower than contained significantly less soil N than all other treatments in the
combined soil. There were substantial differences in treatment effects at
10J. James et al. Forest Ecology and Management 485 (2021) 118935
Fig. 7. The effect of whole tree harvest (WTH), forest floor removal (+FF), and vegetation control (+VC) on soil N relative to bole-only harvest at the LTSP sits. Each
estimate is shown with a 95% confidence interval. Within each facet, treatments with different capital letters indicate significant difference from each other (p <
0.05). The number of observations included in each estimate is listed on the right. Both time since treatment and depth were included as random effects nested within
individual LTSP sites. The random effects utilized a heterogeneous autoregressive (co)variance structure to account for temporal correlation. The test of moderators
was QM = 497 (df = 21), p < 0.0001, and test of residual heterogeneity was QE = 1850 (df = 651), p < 0.0001, with I2 = 49.9%.
different soil depths. The effects of WTH and WTH+FF were signifi the subsoil.
cantly different from BO harvest in O horizons (Fig. 7, Table S7). There were significant trends in soil N effects over time for a limited
Additional removal of the forest floor resulted in 29% more N loss number of treatments & depths in the LTSP meta-analysis (Table S8).
compared to whole tree harvest alone. In mineral soil, the most notable Soil N trended lower over time since treatment in the 10–20 cm depth
effect was the significant loss of N in all three depth intervals after the increment and combined soil (O horizon + 0–30 cm mineral soil) for all
most severe treatment, WTH+FF+VC. Soil N in this treatment was also treatments (Figure S2). Significant downward trends were evident in all
significantly lower than WTH in all mineral soil intervals. No other depth increments for the WTH treatment, which declined from slightly
treatments were significantly different from BO harvest in 0–10 cm greater soil N than BO harvest in the first 5–10 years to no difference at
mineral soil. In the 10–20 cm interval, both BO+VC and WTH+FF 20 years after treatment. In general, temporal trends were less steep in
treatments contained significantly less soil N than BO, although both soil N than soil C at equivalent depths. The I2 for the model including
effects were small (-5.5% and − 3.4%, respectively). In the 20–30 cm time as a fixed effect was 46.9%, which was a very small decline from
interval, WTH+VC contained significantly less soil N than BO harvest the model excluding time (49.9%), which suggests that site-specific
and was also significantly less than WTH and WTH+FF treatments. The response to treatment was a much larger factor for soil N than tempo
WTH+FF treatment in the 20–30 cm interval was the only treatment ral trends within treatments.
with significantly more soil N than BO harvest, suggesting that N
leaching out of O horizon and surface mineral soil is being retained in
11J. James et al. Forest Ecology and Management 485 (2021) 118935
4. Discussion C decline for the BO+Removal treatment in the literature meta-analysis
(-19.2% in combined soil relative to no harvest), while subject to the
4.1. What effects do different methods of biomass removal in addition to same caveats as WTH+Removal, suggests that additional residue and O
conventional harvest have on soil C stocks? horizon removal has a more substantial effect on soil C than WTH alone.
There was a large degree of site-specific response to WTH in the litera
Both the literature and LTSP meta-analyses show that whole tree ture meta-analysis with most studies measuring only O horizon and
harvest (WTH) with additional harvest residue (+Removal) or forest topsoil (~0–15 cm). In actively managed forest stands, the results sug
floor removal (+FF) results in significant additional soil C loss compared gest that WTH could be used to extract additional biomass for bioenergy
to bole-only (BO) harvest (-24.8 and –8.5%) in the combined soil for the production without widespread reductions in soil C.
literature and LTSP meta-analyses, respectively. There are several The results discussed above are largely consistent with prior meta-
possible explanations for the differences in these estimates. First, there is analyses and reviews. Thiffault et al. (2011) noted no clear or consis
a much greater variety in removal intensity, experimental designs, and tent effect of WTH relative to stem-only (BO) harvest with only four of
sampling depth in the literature meta-analysis than in the LTSP sites. 14 studies reporting significant differences between WTH and BO
Second, pairwise comparisons between WTH+Removal and BO harvest treatments. Likewise, Achat et al. (2015) observed no significant dif
in the literature meta-analysis are highly unequal in sample size (13 vs ference between WTH and BO treatments within individual soil intervals
130 effect sizes for combined soil) and therefore also have unequal and a marginally significant decline (0.05 < p < 0.1) when combining
coverage of soil types and environmental conditions. Third, there are mineral soil layers. James and Harrison (2016) found no overall dif
considerable differences in the maximum sampling depth included in ference between WTH and BO treatments, although they observed a
the combined soil between treatments (Fig. 2), where BO treatments significant increase in mineral soil C in WTH relative to BO harvest.
have many more observations in deep and very deep soil (greater James and Harrison (2016) also found no significant effect of residue
than30 cm depth). The disparity in sampling depths and dearth of removal treatments in addition to harvest, whereas our analysis shows a
studies examining deeper soil C in WTH and other intensive biomass consistent and clear effect of WTH+Removal (in the literature meta-
removal treatments are clear research gaps that have been highlighted in analysis) and WTH+FF (in the LTSP meta-analysis) on soil C. There
several recent reviews (Harrison et al., 2011; James et al., 2014; Gross are several methodological differences between our analysis and both
and Harrison, 2019; Mayer et al., 2020). The small sample size for the Achat et al. (2015) and James and Harrison (2016). To increase sample
WTH+Removal treatment can lead to skewed results that overstate the size, both prior meta-analyses combined all WTH variations as a single
effect of the treatment across forest stands, particularly given the high treatment (e.g. WTH, WTH+Removal, WTH+Till were combined).
degree of residual heterogeneity in the response to treatment (I2 = Consequently, our results are a step forward by more finely differenti
80.7%). Heterogeneity in treatment responses at LTSP sites was a much ating between treatments as well as simultaneously controlling for
smaller proportion of residual variability (I2 = 59.1%), which implies temporal and spatial correlation within each study, which is not possible
that more consistent treatment effects were captured by this model. with the bootstrapping methods used by Achat et al. (2015) and James
Finally, the BO treatment spans a much greater period after treatment and Harrison (2016). The LTSP meta-analysis results also confirm the
than WTH+Removal (approximately 100 years vs. 20 years), which lesser effect of WTH compared to WTH+FF (or WTH+FF+VC) treat
means that WTH+Removal treatments are only capturing the period of ments utilizing more consistent study design and more robust sample
initial decline while BO treatments also capture the recovery period size.
(Fig. 3).
Within individual depth increments, the effect of WTH+Removal (in 4.2. What effects do different methods of biomass removal in addition to
the literature meta-analysis) and WTH+FF (in the LTSP meta-analysis) conventional harvest have on soil N stocks?
on O horizon C were almost identical (-40.3% and − 43.6%, respec
tively). This effect is not surprising due to the direct manipulation of the As with soil C, soil N declined following WTH+Removal treatments
O horizon in the implementation of these treatments. The LTSP showed in the combined soil of the literature meta-analysis but there was no
a higher loss (-43.6%) because the forest floor was uniformly and deli significant decline for WTH or BO+Removal. No other treatment
cately removed when the treatments were applied (Busse et al., 2021). In significantly differed from no-harvest controls. In the mineral soil,
the mineral soil, the literature meta-analysis only differentiated the modeled treatment effects for soil N were mostly smaller than for C in
WTH+Removal and BO treatments in deep soil (~30–60 cm) where only the same depths and treatments for both datasets with the exception of
a single study was available for WTH+Removal (Mushinski et al. 2017). WTH+FF+VC treatment in the LTSP study, where the effect on soil N
While this study showed a considerable treatment effect, it is insufficient and C was similar (Figs. 4 and 7). The significant loss of soil N in the O
to make any generalizable statements about effect outside of the envi horizon and 10–20 cm soil intervals following WTH+FF treatments
ronmental context in which the study was conducted. In contrast, the coupled with the significant increase in the 20–30 cm interval suggests
LTSP meta-analysis found significantly less soil C in the 0–10 cm and that some mineralization and leaching of N from surface soil may be
10–20 cm increments following WTH+FF (-6.7% and − 4.3%, respec occurring at some sites (in addition to organic matter loss which con
tively). Overall, much greater confidence (narrower 95% confidence tains both C and N). As with soil C, there was no effect of WTH treatment
intervals in Fig. 4) in the size and direction of LTSP results may be on soil N in the combined soil or in mineral soil layers in either the
recognized due to the larger sample size, common study design, stan literature or LTSP meta analyses. Despite returning less organic material
dard sampling depth & frequency, and variety of forest & soil types to the site compared to standard BO harvest, WTH does not appear to
represented by the LTSP sites. substantially effect N. Overall, results suggest that WTH may provide a
The WTH+Removal and WTH+FF treatments are frequently inten means to extract additional residues for bioenergy production without
ded to represent an intensive endmember along the spectrum of real- major losses of soil C or N.
world soil disturbance and biomass removal impacts. In contrast, the
WTH treatment on its own is a common forestry practice and much more 4.3. Feedback between changes in soil C and N following residue removal
representative of realistic bioenergy harvests. In both the literature and & vegetation control
LTSP meta-analyses, WTH does not result in additional soil C losses
compared to BO harvest (Fig. 1 pairwise comparisons, Fig. 4). WTH Nitrogen is the most common limiting nutrient for plant productivity
treatments contained significantly less soil C than no-harvest controls in (LeBauer and Treseder, 2008), and the removal of nitrogen contained
the literature (-15.4%), although no significant loss was evident in any within forest residues by bioenergy harvest may induce or deepen N
individual depth increment except for the O horizon. The significant soil limitation. By far the most impactful treatment on both soil C and N in
12J. James et al. Forest Ecology and Management 485 (2021) 118935 the LTSP meta-analysis was WTH+FF+VC. Both C and N declined in all too slowly to be quantified or verified within a short time. Instead, most mineral soil depths by more than 10% in response to this treatment and LCAs assume that soil C stocks remain in steady state during the years of continued to trend downward over 20 years. This suggests a multipli feedstock production, even though this simplification is likely untrue in cative effect of vegetation control and forest floor removal at LTSP sites. situations with extreme biomass removal and intensive management Neither BO+VC nor WTH+VC treatments were significantly different (Buchholz et al. 2014). from BO harvest for soil C in any mineral soil interval, and the treatment This meta-analysis study confirmed that intensive removal of forest effect of WTH+FF+VC on soil C was more than double the WTH+FF residues could cause persistent loss of soil C and N. Such impacts vary by treatment effect in all mineral soil layers (Fig. 4). For soil N, BO+VC was harvest methods and forest management practices. This study suggests significantly lower than BO harvest in combined soil as well as in the that modest residue removals (
J. James et al. Forest Ecology and Management 485 (2021) 118935
(continued )
Reference k for soil C k for soil N Experimental period (year) Max Depth (cm) Location
(Edwards and Ross-Todd, 1983) 6 1 45 TN, USA
(Elliott and Knoepp, 2005) 12 12 3 15 NC, USA
(Ellis et al., 1982) 5 5 1 10 Tasmania
(Ellis and Graley, 1983) 9 9 2 10 Tasmania
(Esquilin et al., 2008) 2 2 14 10 CO, USA
(Falsone et al., 2012) 4 4 5 30 Russia
(Fraterrigo et al., 2005) 1 1 30 15 NC, USA
(Frazer et al., 1990) 4 4 18 14 CA, USA
(Gartzia-Bengoetxea et al., 2009) 2 2 16 5 Spain
(Gillon et al., 1999) 2 2 1 0 France
(Goh and Phillips, 1991) 4 4 2 60 New Zealand
(Goodale and Aber, 2001) 2 2 85 10 NH, USA
(Gough et al., 2007) 15 68 80 MI, USA
(Grady and Hart, 2006) 2 2 12 15 AZ, USA
(Grand and Lavkulich, 2012) 6 6 80 BC, Canada
(Gresham, 2002) 6 10 30 SC, USA
(Griffiths and Swanson, 2001) 3 40 10 OR, USA
(Gundale et al., 2005) 8 8 3 10 MT, USA
(Das Gupta and DeLuca, 2012) 10 10 8 50 Wales
(Hart et al., 2006) 2 2 1 15 AZ, USA
(Hendrickson and Chatarpaul, 2016) 8 8 3 20 ON, Canada
(Herman et al., 2003) 2 2 9 9 CA, USA
(Hölscher et al., 2001) 2 2 22 20 Germany
(Hwang and Son, 2006) 2 2 2 30 Korea
(Jang et al., 2015) 12 12 38 30 MT, USA
(Johnson, 1991) 3 3 20 NH, USA
(Johnson and Todd, 1998) 6 6 15 45 TN, USA
(Johnson, 1995) 12 8 NH, USA
(Johnson et al., 1997) 14 8 53 NH, USA
(Johnson et al., 2014) 4 4 1 60 CA, USA
(Jones et al., 2011) 12 12 15 30 New Zealand
(Kaye and Hart, 1998) 4 4 1 15 AZ, USA
(Keenan et al., 1994) 1 4 20 BC, Canada
(Kelliher et al., 2004) 4 4 22 50 OR, USA
(Kishchuk et al., 2015) 4 4 11 7 AB, Canada
(Klockow et al., 2013) 9 9 1 20 MN, USA
(Klopatek, 2002) 8 8 40 20 WA, USA
(Knoepp and Swank, 1997) 17 17 17 10 NC, USA
(Korb et al., 2004) 1 1 1 10 AZ, USA
(Kraemer and Hermann, 1979) 2 2 26 10 WA, USA
(Kurth et al., 2014) 72 72 15 30 MI, MN, USA
(Laiho et al., 2003) 5 5 22 NC, LA, USA
(Latty et al., 2004) 2 2 90 15 NY, USA
(Law et al., 2001) 12 3 106 100 OR, USA
(LeDuc and Rothstein, 2007) 1 1 5 10 MI, USA
(Maassen and Wirth, 2004) 2 5 Germany
(Mattson and Smith, 1993) 30 23 10 WV, USA
(Mattson and Swank, 1989) 8 7 60 NC, USA
(May and Attiwill, 2003) 2 2 5 10 Australia
(McKee et al., 2013) 8 24 60 ME, USA
(McLaughlin et al., 1996) 10 5 50 AL, USA
(McLaughlin and Phillips, 2006) 2 2 17 50 MI, USA
(Merino and Edeso, 1999) 6 6 4 15 Spain
(Moreno-Fernández et al., 2015) 54 104 50 Spain
(Mu et al., 2013) 18 5 50 China
(Murphy et al., 2006) 28 28 1 60 CA, USA
(Neher et al., 2003) 3 2 20 NC, USA
(Norris et al., 2009) 15 31 100 SK, Canada
(O’Brien et al., 2003) 6 26 50 Australia
(Powers et al., 2011) 20 29 30 MN, WI, USA
(Prest et al., 2014) 5 5 35 50 NS, Canada
(Prietzel et al., 2004) 4 4 2 0 WA, USA
(Puhlick et al., 2016) 10 8 100 ME, USA
(Rab, 1996) 8 1 10 Australia
(Riley and Jones, 2003) 3 1 10 SC, USA
(Roaldson et al., 2014) 4 4 9 20 CA, USA
(Rothstein and Spaulding, 2010) 6 6 15 30 MI, USA
(Sanchez et al., 2006) 6 3 105 SC, USA
(Sanscrainte et al., 2003) 4 4 70 WA, USA
(Saynes et al., 2012) 8 20 5 Mexico
(Selig et al., 2008) 3 14 30 VA, USA
(Shelburne et al., 2004) 4 4 1 10 SC, USA
(Sheng et al., 2015) 5 8 100 China
(Skovsgaard et al., 2006) 12 0 30 Denmark
(Slesak et al., 2011) 12 12 5 60 OR, WA, USA
(Small and McCarthy, 2005) 4 4 7 10 OH, USA
(continued on next page)
14You can also read