A novel mitochondrial Kv1.3-caveolin axis controls cell survival and apoptosis
←
→
Page content transcription
If your browser does not render page correctly, please read the page content below
RESEARCH ARTICLE

                                   A novel mitochondrial Kv1.3–caveolin axis
                                   controls cell survival and apoptosis
                                   Jesusa Capera1†§, Mireia Pérez-Verdaguer1†#, Roberta Peruzzo2‡,
                                   Marı́a Navarro-Pérez1‡, Juan Martı́nez-Pinna3, Armando Alberola-Die3,
                                   Andrés Morales3, Luigi Leanza2, Ildiko Szabó2*, Antonio Felipe1*
                                   1
                                     Molecular Physiology Laboratory, Dpt. de Bioquı́mica i Biomedicina Molecular,
                                   Institut de Biomedicina (IBUB), Universitat de Barcelona, Barcelona, Spain;
                                   2
                                     Department of Biology, University of Padova, Padova, Italy; 3Dept de Fisiologı́a,
                                   Genética y Microbiologı́a, Universidad de Alicante, Alicante, Spain

                                   Abstract The voltage-gated potassium channel Kv1.3 plays an apparent dual physiological role
                                   by participating in activation and proliferation of leukocytes as well as promoting apoptosis in
                                   several types of tumor cells. Therefore, Kv1.3 is considered a potential pharmacological target for
                                   immunodeficiency and cancer. Different cellular locations of Kv1.3, at the plasma membrane or the
*For correspondence:
ildi@mail.bio.unipd.it (IS);       mitochondria, could be responsible for such duality. While plasma membrane Kv1.3 facilitates
afelipe@ub.edu (AF)                proliferation, the mitochondrial channel modulates apoptotic signaling. Several molecular
†
                                   determinants of Kv1.3 drive the channel to the cell surface, but no information is available about its
  These authors contributed
                                   mitochondrial targeting. Caveolins, which are able to modulate cell survival, participate in the
equally to this work
‡
  These authors also contributed
                                   plasma membrane targeting of Kv1.3. The channel, via a caveolin-binding domain (CBD), associates
equally to this work               with caveolin 1 (Cav1), which localizes Kv1.3 to lipid raft membrane microdomains. The aim of our
                                   study was to understand the role of such interactions not only for channel targeting but also for cell
Present address: §Kennedy          survival in mammalian cells. By using a caveolin association-deficient channel (Kv1.3 CBDless), we
Institute of Rheumatology,
                                   demonstrate here that while the Kv1.3–Cav1 interaction is responsible for the channel localization
University of Oxford, Oxford,
                                   in the plasma membrane, a lack of such interaction accumulates Kv1.3 in the mitochondria. Kv1.3
United Kingdom; #Department
of Cell Biology, University of
                                   CBDless severely affects mitochondrial physiology and cell survival, indicating that a functional link
Pittsburgh School of Medicine,     of Kv1.3 with Cav1 within the mitochondria modulates the pro-apoptotic effects of the channel.
Pittsburgh, United States          Therefore, the balance exerted by these two complementary mechanisms fine-tune the
                                   physiological role of Kv1.3 during cell survival or apoptosis. Our data highlight an unexpected role
Competing interests: The
                                   for the mitochondrial caveolin–Kv1.3 axis during cell survival and apoptosis.
authors declare that no
competing interests exist.
Funding: See page 20
Received: 05 April 2021            Introduction
Accepted: 22 June 2021             The voltage-gated potassium channel Kv1.3 is present at the plasma membrane of different cell
Published: 01 July 2021            types, mostly neurons and leukocytes (Cahalan and Chandy, 2009; Martı́nez-Mármol et al., 2016;
                                   Solé et al., 2016). Kv1.3 participates in cell proliferation, activation, and apoptosis (Pérez-
Reviewing editor: Baron
Chanda, Washington University
                                   Verdaguer et al., 2016b). Thus, altered expression of the channel is linked to different pathologies
in St. Louis, United States        such as autoimmune diseases and cancer (Rus et al., 2005; Vallejo-Gracia et al., 2013; Serrano-
                                   Novillo et al., 2019; Szabo et al., 2021). Kv1.3 is efficiently expressed on the cell surface, which
   Copyright Capera et al. This
                                   depends on multiple forward trafficking signatures located at the C-terminal domain of the channel
article is distributed under the
                                   (Martı́nez-Mármol et al., 2013). Moreover, different ancillary interactions modulate the trafficking
terms of the Creative Commons
Attribution License, which         of Kv1.3 (Capera et al., 2019). For example, the Kv1.5 channel and the regulatory KCNE4 subunit
permits unrestricted use and       retain Kv1.3 at the endoplasmic reticulum (ER), negatively modulating the channel surface expression
redistribution provided that the   (Vicente et al., 2006; Vicente et al., 2008; Solé et al., 2009). In addition, the scaffolding protein
original author and source are     caveolin 1 (Cav1) controls Kv1.3 spatial localization in raft microdomains, which is important for sig-
credited.                          naling and cell physiology (Pérez-Verdaguer et al., 2016a; Pérez-Verdaguer et al., 2018).

Capera, Pérez-Verdaguer, Peruzzo, et al. eLife 2021;10:e69099. DOI: https://doi.org/10.7554/eLife.69099                           1 of 24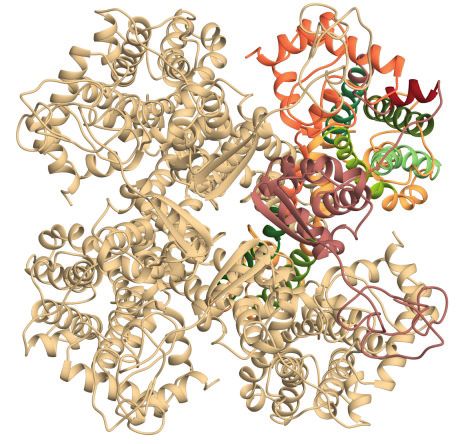
Research article                                                                                      Cancer Biology Cell Biology

                                   Therefore, by controlling Kv1.3 surface expression and localization, oligomeric associations fine-tune
                                   physiological events.
                                       Caveolin (Cav) is the main structural component of caveolae, a specialized form of membrane
                                   lipid raft with a characteristic omega-shaped structure. Caveolae are abundant at the plasma mem-
                                   brane of highly differentiated cells, such as adipocytes, pneumocytes, and muscle cells, but they are
                                   not abundant in central neurons and lymphocytes. Cav1, the main isoform in non-muscle tissues,
                                   forms large oligomers with high affinity for cholesterol and sphingolipids. In addition, Cav1 can
                                   recruit different proteins into caveolar and non-caveolar rafts through its Cav scaffolding domain
                                   (CSD). Therefore, rafts, acting as signaling platforms, initiate signaling pathways, participate in vesic-
                                   ular transport, and contribute to cholesterol homeostasis (Simons and Ikonen, 1997; Razani et al.,
                                   2002; Parton et al., 2006). In addition, these microdomains are essential for immunological synap-
                                   ses during the immune response (Rao et al., 2004), as well as for the insulin modulation of adipocyte
                                   physiology (Pérez-Verdaguer et al., 2018).
                                       In this context, the role of Cav1 in cancer progression raises an intense debate. Cav1 acts either
                                   as a tumor suppressor or as an oncogene, depending on the cancer type and the clinical stage of
                                   the disease. For instance, low Cav1 expression is associated with low survival in stromal breast can-
                                   cer cells, whereas high expression of Cav1 indicates poor prognosis in invasive breast cancer cells
                                   (Qian et al., 2011). Thus, Cav1 regulates different oncogenic properties, such as neoplastic transfor-
                                   mation, apoptosis resistance, migration, invasiveness, and angiogenesis (Quest et al., 2008;
                                   Qian et al., 2019), likely depending on the cell type and/or Cav1 interactions with specific partners.
                                   Reciprocal regulation between Cav1 and the cell oxidative state regulates cell survival and stress-
                                   dependent responses (Wang et al., 2017). In addition, Cav1 also plays non-caveolar functions
                                   (Volonte et al., 2016). Cav1 localizes not only to the plasma membrane, but also to mitochondria,
                                   where it participates in the regulation of cell bioenergetics and apoptosis and, consequently, in can-
                                   cer progression (Nwosu et al., 2016). Cav1 upregulation promotes apoptosis resistance and pro-
                                   vides a metabolic advantage to cancerous cells (Wang et al., 2017). In fact, Cav1 inhibits Bax-
                                   dependent cell death, helping cancer cells to escape chemotherapy (Zou et al., 2012;
                                   Shiroto et al., 2014). In contrast, Cav1 knockdown has been reported to cause hyperpolarization of
                                   the inner mitochondrial membrane (IMM) potential (Dym) and to alter the lipid composition of the
                                   IMM, leading cells to apoptosis (Bosch et al., 2011).
                                       Kv1.3, which is present in lipid rafts (Bock et al., 2003) and associates with Cav1, participates in
                                   apoptosis and chemotherapy resistance through its mitochondrial localization (Szabó et al., 2008;
                                   Leanza et al., 2012). Mitochondrial Kv1.3 (mitoKv1.3) mediates the pro-apoptotic effects of Bax.
                                   Bax blocks Kv1.3 causing the hyperpolarization of the IMM and a subsequent reactive oxygen
                                   species (ROS) production. These events lead to the opening of the permeability transition pore
                                   (PTP) and to consequent IMM depolarization, which is followed by the release of cytochrome c and
                                   the triggering of the intrinsic apoptotic cascade. Sustained PTP opening leads to the loss of mito-
                                   chondrial integrity and respiration and induces swelling (Szabó et al., 2008; Szabò et al., 2011).
                                   The effect of Bax, which is often downregulated in cancer cells, can be mimicked by mitochondria-
                                   targeted Kv1.3 inhibitors (Leanza et al., 2012). For this reason, mitoKv1.3 has become a potential
                                   target for chemotherapy and a solution for overcoming chemotherapeutic resistance (Leanza et al.,
                                   2012; Leanza et al., 2017; Szabo et al., 2021).
                                       Because the Kv1.3 and Cav1 interaction in lipid rafts has an enormous influence on cell physiology
                                   (Vicente et al., 2006; Pérez-Verdaguer et al., 2016a; Pérez-Verdaguer et al., 2018), we analyzed
                                   the functional link between Kv1.3 and Cav1 in the regulation of intrinsic apoptosis. We demon-
                                   strated that the interaction of Kv1.3 with Cav1 is important for the plasma membrane targeting of
                                   the channel. On the other hand, once in the mitochondria, the Kv1.3–caveolin axis functions as an
                                   anti-apoptotic mechanism protecting the cells from Kv1.3-mediated cell death. Our data increases
                                   the understanding of the heterogeneity of cancer by consolidating the roles of Kv1.3 and Cav1 as
                                   targets for anti-cancer therapies.

Capera, Pérez-Verdaguer, Peruzzo, et al. eLife 2021;10:e69099. DOI: https://doi.org/10.7554/eLife.69099                              2 of 24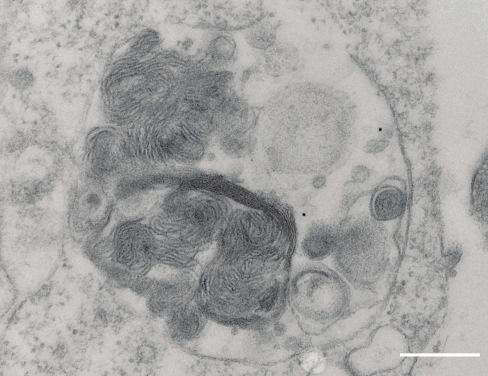
Research article Cancer Biology Cell Biology
Results
Interaction with caveolin-1 governs the spatial localization of Kv1.3
We have previously described that the interaction between Kv1.3 and Cav1 results in the localization
of the channel to lipid rafts and caveolae (Pérez-Verdaguer et al., 2016a; Pérez-Verdaguer et al.,
2018). Kv1.3 contains a caveolin-binding domain (CBD) situated on the N-terminal end of the chan-
nel. Molecular simulations of Kv1.3 identified this CBD as an a-helix in an exposed orientation of the
A N-S1-S2-S3-S4-S5-S6-C
B SM IP- IP: Cav1
WT CBDless WT WT CBDless
100 kDa
W171 IB:Kv1.3
F174 75 kDa
V170 Q167 25 kDa
IB: Cav1
L173
D 30
***
**
FRET efficiency (%)
L172
Q169
R168
F166 ***
20
CBD ɸXXXXɸXXɸ
10
WT FQRQVWLLF
Bottom View Side View CBDless AQRQVGLLA
0
Donor: Cer WTCer Cav1Cer Cav1Cer
C Kv1.3 YFP Cav1 Cer Kv1.3 YFP Cav1 Cer
Acceptor: YFP WTYFP WTYFP CBDlessYFP
PreBleach PreBleach PostBleach PostBleach
1.4 E 1 2 3 4
Kv1.3 WT
5 6 7 8 9 10 11 12
Norm. Fluorescence
1.2
Kv1.3 100 kDa
1
Clathrin
WT
0.8 150 kDa
0.6 50 kDa
Flotillin
0.4
0.2 Caveolin 25 kDa
0 Pre Post
1.4
F Kv1.3 CBDless
Norm. Fluorescence
1.2
1 2 3 4 5 6 7 8 9 10 11 12
CBDless
1
Kv1.3 100 kDa
0.8
0.6 Clathrin 150 kDa
0.4 Flotillin 50 kDa
0.2 Pre
Pre Post Caveolin 25 kDa
0
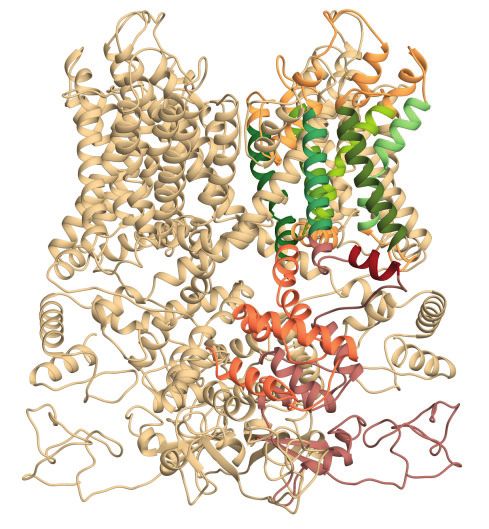
Figure 1. The caveolin-binding domain (CBD) of Kv1.3 mediates the interaction with Cav1 targeting the channel to lipid raft microdomains. (A) Ribbon
Figure 1
representation of a Kv1.3 tetramer. For clarity, the transmembrane domain structures are highlighted with different colors in one monomer, with the
CBD in red. Both the cytoplasmic (bottom view) and the side (side view) planes are shown. Note the exposed orientation of the CBD at the proximal
cytoplasmic N-terminal domain. A zoomed in image is provided for detail. Aminoacids are identified with letters and positions. Lateral chains are
colored by element (C, gray; N, blue; O, red). The consensus sequence of the CBD is provided. The amino acid sequence shows the CBD of wild type
(WT) Kv1.3. The Kv1.3 CBD mutant (CBDless) contains amino acid substitutions (in red) to abrogate the CBD. (B) Kv1.3–Cav1 coimmunoprecipitation
assay. HEK 293 Cav cells were cotransfected with Cav1 and Kv1.3YFP WT or Kv1.3YFP CBDless. Total cell lysates were immunoprecipitated with Cav1
(IP: Cav1). IP , absence of Cav1 antibody. SM, starting materials. Samples were immunoblotted (IB) against Cav1 or Kv1.3. (C) Representative images
from a Förster resonance energy transfer (FRET) experiment on cell unroofing preparations (CUPs). HEK 293 Cav cells were cotransfected with
Kv1.3YFP WT+Cav1 Cerulean (Cav1 Cer) and Kv1.3YFP CBDless+Cav1 Cer. From left to right: acceptor (Kv1.3 YFP) and donor (Cav1 Cer) prebleach and
postbleach images. Square insets indicate the bleached zone. Line graphs at the right show changes in donor (cerulean) and acceptor (yellow)
fluorescence after bleaching. (D) FRET efficiency (%). Values are the mean ± SE (n > 25). **p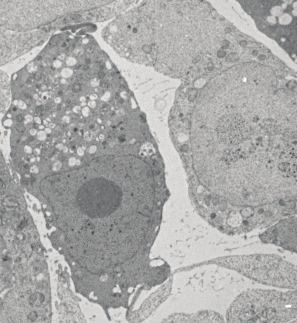
Research article Cancer Biology Cell Biology
tetrameric structure (Figure 1A). The sequence for the CBD (FxxxxFxxF, where F is an aromatic
residue and x is an unspecified amino acid) of Kv1.3 is FQRQVWLLF. To further study the nature of
the Kv1.3–Cav1 interaction, we abrogated the CBD by replacing the aromatic residues with Ala or
Gly (Kv1.3 CBDless, Figure 1A). Deletion of the CBD motif of Kv1.3 caused the loss of Kv1.3–Cav1
association, as demonstrated by the absence of co-IP and Förster resonance energy transfer (FRET)
(Figure 1B–D). Analogous CBDs are located at the N-terminus of HCN channels, and some point
mutations of this motif are sufficient to alter Cav1 binding (Barbuti et al., 2012). Therefore, we ana-
lyzed whether this also applied for Kv1.3 (Figure 1—figure supplement 1). Any substitution of aro-
matic residues in the CBD decreased the colocalization with Cav 1 (Figure 1—figure supplement
1A–C). However, similar to HCN4, only the disruption of the last pair of aromatic amino acids
(W171G/F174A) greatly impaired the association with Cav 1 (Figure 1—figure supplement 1D).
In addition, the absence of the Cav1 interaction displaced Kv1.3 from lipid raft microdomains
(Figure 1E,F). Although the CBD lies next to the T1 (Kv tetramerization domain), its abolition did
not prevent tetramerization of the channel: (1) Kv1.3 CBDless formed tetramers that were observed
by FRET (Figure 1—figure supplement 2A,B) and (2) Kv1.3 CBDless formed oligomeric structures
observed with nondenaturing polyacrylamide gel electrophoresis (Figure 1—figure supplement
2C). However, the biophysical properties of the plasma membrane Kv1.3 CBDless were affected (Fig-
ure 1—figure supplement 3) as assessed in Xenopus oocytes. Two-electrode voltage-clamp record-
ings in oocytes microinjected with Kv1.3 WT or Kv1.3 CBDless (Figure 1—figure supplement 3A)
indicated that Kv1.3 CBDless exhibited less current intensity, with a 20 mV hyperpolarized shift in
the steady-state activation, compared to Kv1.3 WT (Figure 1—figure supplement 3C–G). In addi-
tion, the characteristic C-type inactivation of Kv1.3 was accelerated in Kv1.3 CBDless (Figure 1—fig-
ure supplement 3H,I) also exhibiting a slightly augmented cumulative inactivation (Figure 1—figure
supplement 3J–L). Finally, both Kv1.3 channels, WT and CBDless, hyperpolarized the membrane
potential (Figure 1—figure supplement 3M), but the CBDless mutant decreased the input resistance
of the oocyte cell membrane (Figure 1—figure supplement 3N).
Although Kv1.3 CBDless was functional, an impaired Cav1 interaction altered the membrane distri-
bution of the channel by excluding it from lipid raft structures (Figure 1E,F) and reduced the current
density (Figure 1—figure supplement 3), which could be the consequence of reduced surface abun-
dance (Martı́nez-Mármol et al., 2013). Therefore, we analyzed the targeting of Kv1.3 CBDless to
membranes other than the plasma membrane in HEK 293 cells. The CBD motif disruption caused a
notable intracellular retention (at the ER, Golgi, and mitochondria as shown below), which reduced
the surface expression of the channel (Figure 2A–D); these data were further confirmed by biotinyla-
tion assays (Figure 2E). Kv1.3 usually appears as glycosylated and non-glycosylated protein forms
(Figure 2F). Glycosylation studies, in the presence of tunicamycin, indicated an altered glycosylation
for Kv1.3 CBDless, which mostly affected the larger glycosylated band (Figure 2F,G). Low levels of
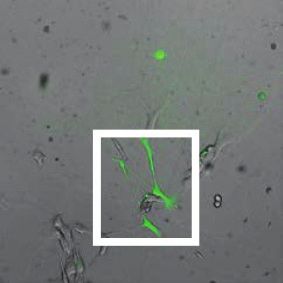
N-glycosylation, a reduced half-life (Figure 2H) and a decrease in surface expression, concomitant
with a punctuated intracellular pattern for Kv1.3 CBDless (Figure 2A–C), suggested an altered matu-
ration and stability of the channel.
N-glycosylation is an elaborated process that occurs at the ER and continues along the Golgi cis-
ternae. To test the route of Kv1.3 CBDless within the cells, we disrupted ER–Golgi traffic with brefel-
din A (BFA) and determined the channel distribution. As we previously described (Martı́nez-
Mármol et al., 2013), BFA blocked the Kv1.3 WT trafficking and, interestingly, Kv1.3 CBDless exhib-
ited a similar uniform ER distribution (Figure 2I).
Kv1.3 CBDless accumulates in mitochondria and alters mitochondrial
morphology and function
As mentioned above, the plasma membrane channel participates in cell proliferation, whereas
mitoKv1.3 overexpression facilitates apoptosis (Szabó et al., 2008). We showed that the Cav1 inter-
action is essential for plasma membrane targeting of the channel and that CBD disruption triggered
a punctate intracellular phenotype. Therefore, we wondered whether this scenario affected the mito-
chondrial localization of the channel, especially because targeting mechanisms for mitoKv1.3 are
unknown. While Kv1.3 does not display a classical N-terminal mitochondria-targeting pre-sequence,
membrane-permeant mitochondriotropic channel antagonists have unequivocally demonstrated a
pivotal role for mitoKv1.3 in the death of primary human lymphocytic leukemia cells as well as of
B16F10 melanoma cells (Leanza et al., 2012; Leanza et al., 2017). Thus, we used melanoma cells in
Capera, Pérez-Verdaguer, Peruzzo, et al. eLife 2021;10:e69099. DOI: https://doi.org/10.7554/eLife.69099 4 of 24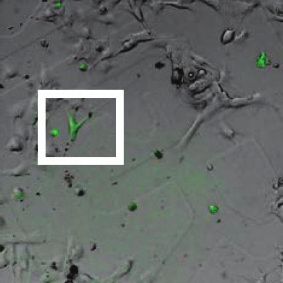
Research article Cancer Biology Cell Biology
A Kv1.3 Mb Merge E SM PD
Aa Ab Ac WT CBDless WT CBDless
Cav1 - + - + - + - +
WT
IB: Kv1.3
75 kDa
IB: Clathrin 150 kDa
25 kDa
IB: Caveolin
Ad Ae Af
CBDless
F WT CBDless
Tunicamycin - + - +
G
Kv1.3 NG
B Kv1.3 Golgi Merge b-actin
75 kDa
50 kDa
Ba Bb Bc
WT
G Glycosylated Non-Glycosylated
Relative expression (%)
120
100
Bd Be Bf 80
CBDless
60
40
20
0
- + - + Tunicamycin
WT CBDless
C Kv1.3 ER Merge H
Kv1.3 expression (A.U.)
Ca Cb Cc Kv1.3 WT
Kv1.3 CBDless
WT
**
Cd Ce Cf
CBDless
Time (h)
I + Brefeldin A
Ia Ib
D Kv1.3 WT Kv1.3 CBDless
WT
1.0
Pearson’s coefficient
***
0.8 **
0.6 **
0.4 Ic Id
CBDless
0.2
0.0
Mb Golgi ER
Figure 2
Figure 2. The integrity of the CBD domain is involved in the surface expression of Kv1.3. HEK 293 cells were transfected with Kv1.3YFP WT and
Kv1.3YFP CBDless. (A–C) Representative confocal images show colocalization of Kv1.3YFP WT and Kv1.3YFP CBDless with (A) plasma membrane (Mb), (B)
Golgi, and (C) endoplasmic reticulum (ER). Green panels, Kv1.3; red panels, subcellular marker; merge panels show colocalization in yellow. The scale
bar is 10 mm. ER (pDsRed-ER) and Mb (Akt-PH-pDsRed) were used as ER and Mb markers, respectively, and were cotransfected with the channel. Golgi
Figure 2 continued on next page
Capera, Pérez-Verdaguer, Peruzzo, et al. eLife 2021;10:e69099. DOI: https://doi.org/10.7554/eLife.69099 5 of 24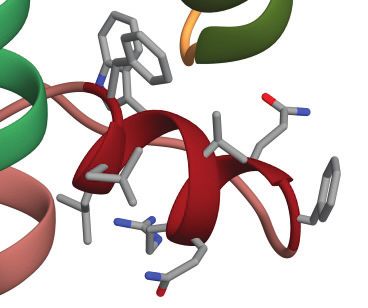
Research article                                                                                              Cancer Biology Cell Biology

Figure 2 continued
was stained with an anti-cis-Golgi antibody (GM130). (D) Colocalization analysis (Pearson’s coefficient) between channel and subcellular markers. Gray
bars, Kv1.3 WT. White bars, Kv1.3 CBDless. Data are the mean ± SE (n > 30 cells) **p
Research article                                                                                                              Cancer Biology Cell Biology

                                                                                    C               Kv1.3   Mitochondria        Merge
                                                                                               Ca           Cb             Cc               D
    A

                                                                                     WT
                                     WT                        CBDless                                                                                         0.4
                                                                                                                                                                        *

                                                                                                                                             Pearson’s Coef.
                               Mb Mit                    Mb Mit                                                                                                0.3

       Kv1.3                                                                                   Cd           Ce             Cf                                  0.2

                                                                                     CBDless
                                                                          75 kDa                                                                               0.1
     Na /K         +      +
                                                                          100 kDa
     ATPase                                                                                                                                                    0.0
                                                                           35 kDa
      VDAC                                                                                                                                                           WT CBDless

    B                                                                               E               Kv1.3   Mitochondria        Merge

                                 *                                    *
                                                                                               Ea           Eb             Ec               F
      Kv1.3/Mb (A.U.)

                                            Kv1.3/Mit (A.U.)

                          1                                    3
                                                                                     WT
                                                                                                                                                               1.0

                                                                                                                                             Pearson’s Coef.
                        0.5
                                                               2
                                                                                                                                                               0.8
                                                                                                                                                                        *
                                                               1

                                                                                                            Ee                                                 0.6
                              WT CBDless                           WT CBDless                  Ed                          Ef
                                                                                     CBDless

                                                                                                                                                               0.4

                                                                                                                                                                     WT CBDless

 Figure 3
Figure 3. Kv1.3 CBDless targets to mitochondria. HEK 293 and B16F10 cells were transfected with Kv1.3YFP WT or Kv1.3YFP CBDless. (A) Subcellular
fractionation isolating mitochondrial (Mit) and membrane (Mb) fractions from HEK 293 cells. Samples were immunoblotted for GFP (Kv1.3), Na+/K+
ATPase (membrane marker) or VDAC (mitochondrial marker). (B) Relative membrane (Mb) mitochondrial (Mit) Kv1.3 expression. Kv1.3 abundance in (A)
was normalized to Na+/K+ ATPase (Mb) and VDAC (Mit) expression and relativized to the Kv1.3 WT. Data are the mean ± SE (n = 4). *p 30). *p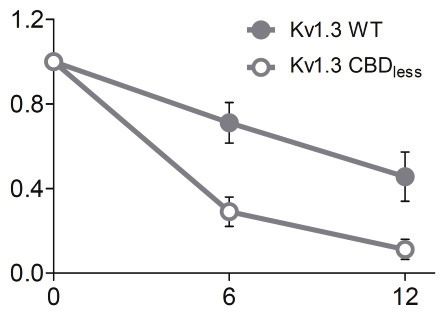
Research article                                                                                                                          Cancer Biology Cell Biology

           A              Kv1.3           Mitochondria Tubeness               Skeleton
                         Aa                Ab          Ac                    Ad
                                                                                              B                                      C                                D
             WT

                                                                                                                         ***                              ***                             ***

                                                                                              Form factor (A.U.)
                                                                                                                   6                              2.0                               5

                                                                                                                                                                      Lenght (µm)
                                                                                                                   5

                                                                                                                                     Area (µm2)
                                                                                                                                                  1.5                               4
                                                                                                                   4
                                                                                                                                                                                    3
                                                                                                                   3                              1.0
                         Ae               Af               Ag                Ah                                    2
                                                                                                                                                                                    2
                                                                                                                                                  0.5
             CBDless

                                                                                                                   1                                                                1

I                                                                                                                  0
                                                                                                                       WT CBDless
                                                                                                                                                  0.0
                                                                                                                                                        WT CBDless
                                                                                                                                                                                    0
                                                                                                                                                                                        WT CBDless

           E             Confocal Microscopy   Correlative Transmission Electron Microscopy

                                                  Transfected cell      Untransfected cell                         G           Transfected cell                 Untransfected cell
                         Ea                    Eb                     Ec                                                     Ga                                 Gb
               WT

                                                                                                                   WT
           F             Confocal Microscopy   Correlative Transmission Electron Microscopy                                  Gc
                                                                                                                             Ic                              Gd
                                                                                                                                                             Id
                                                                                                                   CBDless
                                                  Transfected cell      Untransfected cell

                         Fa                     Fb                     Fc
               CBDless

igureFigure
       4 4. Kv1.3 CBD          less targets mitochondria altering mitochondrial morphology. HEK 293 and B16F10 cells were transfected with Kv1.3YFP WT or
       Kv1.3YFP CBDless. (A) Representative confocal images of HEK-293 cells cotransfected with (Aa–Ad) Kv1.3YFP WT, (Ae–Ah) Kv1.3YFP CBDless (green) and
       pmitoRFP (red). Images were processed (tubeness (Ac, Ag) and skeleton (Ad, Ah)) to perform morphometric analysis (B–D) of mitochondria in Kv1.3
       positive cells. Scale bar represents 10 mm. (B) The form factor (arbitrary units, A.U.) describes the particle shape complexity and is computed as the
       average (perimeter)2/(4parea). A circle corresponds to a minimum value of 1. (C) Average area of particles detected on the binary image. (D) The
       length of mitochondrial networks was measured as the average area of the skeletonized binary image. Data are the mean ± SE (n > 30). ***p
Research article                                                                                                            Cancer Biology Cell Biology

               A                                                                             B                              Oligomycin          FCCP        Antimycin
                                                                                                                  400
                                                                                                                  350                                                        Control
                    TMRM fluorescence (A.U)

                                               8000                  ***                                                                                                     Kv1.3 WT
                                                                                                                  300

                                                                                                 OCR (pmol/min)
                                                                           ***                                                                                               Kv1.3 CBDless
                                               6000                                                               250

                                               4000                                                               200
                                                                                                                  150
                                               2000
                                                                                                                  100

                                                    0                                                              50
                                                           Control   WT      CBDless
                                                                                                                    0
                                                                                                                        0     10      20   30    40    50    60   70    80       90

               C                                                                                                                           Time (min)
                                              200
                                                                     Control             Kv1.3 WT                           Kv1.3 CBDless                                        ***
                 Normalized OCR (%)

                                                                                                                                                                             *
                                              150
                                                                                                                                                                                      **
                                              100
                                                                                                                             **
                                                                                                                                  *
                                               50                                       **

                                                0
                                                        ATP-linked                     Proton                           Reserve            Non-mitochondrial              Maximal
                                                        respiration                     leak                            capacity              respiration                respiration

Figure    5
    Figure 5. Kv1.3 CBD      severely impairs mitochondrial function. HEK-293 cells were transfected with Kv1.3YFP WT and Kv1.3YFP CBD . Non-
                                                    less
    transfected cells were used as a control. (A) Mitochondrial membrane potential was determined by tetramethyl rhodamine methyl ester (TMRM)
                                                                                                                                                                                  less

          fluorescence. Positive transfected cells (separated by sorting) were incubated with TMRM and analyzed by confocal microscopy. Data are the
          mean ± SE (n = 3). ***p
Research article Cancer Biology Cell Biology
A B C
Kv1.3 WT Kv1.3 CBDless
100
** ** **
Apoptosis (%)
80 **
60
40
D b E
20
0
S
e
e
l
tro
id
id
ST
am
os
on
µM
op
C
er
Et
C
5
a
0.
µM
µM
10
5
F G H
Mild effects
I J K
Severe effects
Figure 6. Kv1.3 CBDless sensitizes cells to apoptosis. HEK-293 cells were transfected with Kv1.3YFP WT or Kv1.3YFP CBDless. (A) Flow cytometry analysis
evaluating apoptosis by Annexin V staining. Cells were cultured for 24 hr in the absence (control) or the presence of different pro-apoptotic compounds
(0.5 mM staurosporine [STS], 10 mM ceramide, and 5 mM etoposide). Transfected cells were sorted and the % of Annexin V-positive cells was calculated.
Gray bars, Kv1.3 WT. White bars, Kv1.3 CBDless. Data are the mean ± SE (n = 3). **pResearch article Cancer Biology Cell Biology
Figure 6 continued
The online version of this article includes the following figure supplement(s) for figure 6:
Figure supplement 1. Flow cytometry evaluates apoptosis by Annexin V staining.
Figure supplement 2. The accumulation of Kv1.3 in mitochondria is not responsible for the increase in apoptosis.
Figure supplement 3. Kv1.3 CBDless triggered no ER-stress.
B16F10 melanoma cells. Our data indicated that altering the functional crosstalk between Cav1 and
Kv1.3 plays a crucial role in determining the sensitivity of cells to apoptosis.
Finally, we isolated CD4+ T lymphocytes from blood of human donors. As expected, human T
lymphocytes, which express membrane lipid raft integral proteins such as flotillin, express endoge-
nously Kv1.3, but not Cav 1 (Figure 8A). Confocal experiments, performed in Kv1.3 WT and CBDless
transfected cells, indicated that both Kv1.3 channels shared similar plasma membrane (Mb) and
mitochondrial (mito) colocalization (Figure 8B–E). Morphometric analysis of Kv1.3 WT and CBDless T
cells indicated that mitochondria were similarly affected by the expression of either channel (Fig-
ure 9). Thus, both channels triggered an increase in mitochondrial length and form factor, whereas
mitochondrial area diminished in CD4+ lymphocytes. The expression of Kv1.3 WT and CBDless
decreased also the mitochondrial membrane potential (Figure 10A), which is concomitant to similar
levels of apoptosis (Figure 10B). Interestingly, the introduction of external Cav 1 in primary CD4
+ cells (Cav+) partially counteracted apoptosis solely in cells expressing Kv1.3 CBDless. Our data
from primary CD4+ human T lymphocytes showed that the presence of Cav 1, which interacts with
Kv1.3 WT but not CBDless, partially protected cells against apoptosis and further confirmed what
obtained with Jurkat T cells and 3T3-L1 cells.
Discussion
Kv1.3 plays important but apparently contrasting roles in the cell physiology because Kv1.3 in the
plasma membrane supports proliferation, while mitoKv1.3 sensitizes cells to apoptosis. Furthermore,
caveolin is also involved in both pro- and anti-apoptotic events participating in the regulation of cell
survival and in cancer protection. Our results indicate that the interaction of Kv1.3 with Cav1 has
important physiological consequences for controlling apoptosis. Cav1 association, via the N-terminal
located CBD of Kv1.3, drives the channel to the plasma membrane. Altering the CBD impairs mem-
brane targeting, promoting the Kv1.3 intracellular retention and mitochondrial accumulation. In this
way, we were able to distinguish the effects of intracellular/mitochondrial Kv1.3 from those of the
plasma membrane channel. Once inside mitochondria, the CBDless channel facilitates apoptosis. In
the presence of Kv1.3, either the depletion of caveolin or the lack of Cav1 binding favors apoptosis,
suggesting that the Cav1 functional interaction with the channel facilitates apoptotic resistance.
Therefore, we identified that Cav1 associates with Kv1.3, thereby modulating the pro-apoptotic
effects of mitochondrial Kv1.3 channels. This observation is key for the understanding how these two
proteins can reciprocally regulate their role in cancer progression, with significant implications for
anti-cancer therapy.
Acute inhibition of mitoKv1.3 transient hyperpolarizes IMM inducing ROS release. Subsequent
PTP opening leads to loss of mitochondrial integrity, IMM depolarization, swelling, and cytochrome
c release. Overexpression of mitochondrial K+ transporting pathways drives the influx of depolarizing
K+ into the matrix triggering mitochondrial depolarization as well as changes in ultrastructure
(Paggio et al., 2019). Thus, acute changes in the mitochondrial membrane potential, upon block of
the channel, induce ROS and PTP opening, while overexpression of mitochondria-located Kv1.3, that
is more prominent in the case of CBDless mutant or in the absence of Cav (for both WT and CBDless
Kv1.3), causes sustained depolarization that sensitizes cells to apoptotic stimuli. PTP opening further
depolarizes IMM and reduces respiration due to swelling and loss of cytochrome c. Here we show
that overexpression of WT or CBDless Kv1.3 equally depolarized mitochondria and caused apoptosis
in primary T cells, which lack endogenous Cav. Interestingly, while overexpression of Kv1.3 promotes
apoptosis, the channel deficiency renders the cells resistant to apoptosis (Szabó et al., 2008). Thus,
similarly to the ATP-dependent K+ channel of pancreatic b cells (Miki et al., 1998), pharmacological
Capera, Pérez-Verdaguer, Peruzzo, et al. eLife 2021;10:e69099. DOI: https://doi.org/10.7554/eLife.69099 11 of 24Research article Cancer Biology Cell Biology
A B C
Mit Mb
Kv1.3
75 kDa
25 kDa
Caveolin
100 kDa
Na+/K+ ATPase
37 kDa
VDAC
D E Jurkat
Cav- Cav+
Jurkat
100
** ** *** ***
Apoptosis (%)
Cav- Cav+
80 **
Kv1.3 75 kDa
60
25 kDa
Cav 40
CBDless
CBDless
20
YFP
YFP
WT
WT
0
F G 3T3-L1
-
av
*
C
20
Apoptosis (%)
L1
L1
3-
3-
3T
3T
15
Kv1.3 50 kDa 10
25 kDa
Caveolin 5
50 kDa
β-actin 0
-
L1
av
3-
C
L1
3T
3-
3T
Figure 7. Caveolin modulates the pro-apoptotic activity of Kv1.3. (A) Subcellular fractionation was used to isolate mitochondrial (Mit) and plasma
membrane (Mb) fractions in HEK-293 cells transfected with Kv1.3YFP WT. Samples were immunoblotted for GFP (Kv1.3), Caveolin, Na+/K+ ATPase, and
VDAC. (B, C) Electron micrographs showing HEK-293 cells transfected with Kv1.3YFP WT. Kv1.3 was immunolabeled with 18 nm gold particles (black
arrowheads) and Cav1 with 12 nm gold particles (white arrowhead). The square inset in (B) indicates the zoomed in region in (C). Scale bars represent
Figure 7 continued on next page
Capera, Pérez-Verdaguer, Peruzzo, et al. eLife 2021;10:e69099. DOI: https://doi.org/10.7554/eLife.69099 12 of 24Research article Cancer Biology Cell Biology Figure 7 continued 500 nm. (D) Regular human Jurkat T lymphocytes express Kv1.3 and a negligible amount of endogenous Cav1 (Cav ). In addition, a Jurkat cell line with notable expression of Cav1 was selected (Cav+). (E) Jurkat cells (Cav and Cav+) were electroporated with Kv1.3YFP WT or Kv1.3YFP CBDless. After 24 hr, apoptosis was assessed by Annexin V staining with flow cytometry. Black bar, cells electroporated with YFP; gray bar, Kv1.3 YFP WT; white bar, Kv1.3YFP CBDless. (F) Mouse 3T3-L1 and 3T3-L1 Cav- preadipocytes were analyzed for the expression of endogenous Cav1 and Kv1.3. b-actin was used as a loading control. (G) Flow cytometric analysis quantifying apoptosis by Annexin V on 3T3-L1 (gray bar) and 3T3-L1 Cav- (white bar) preadipocytes. Note that the amount of Cav1 exerted notable effects on the Kv1.3-related apoptosis in native 3T3-L1 cells. Values are the mean ± SE of 3–6 independent experiments. *p
Research article                                                                                                        Cancer Biology Cell Biology

          A                                               B
                                                                     Kv1.3                        Mb                           merge
                               93

                                1

                                2
                             -2

                            or

                            or
                     EK

                          on

                          on
                    H

                           D

                        D
                                             75 kDa
       Kv1.3

                                                        WT
     b-actin                                 50 kDa

    Flotillin                                50 kDa

                                                        CBDless
       Cav 1                                 20 kDa

          C Kv1.3                               mito                  merge                     D                             Kv1.3/Mb

                                                                                                      Pearson’s Coef.
                                                                                                                        0.8

                                                                                                                        0.6

                                                                                                                        0.4
        WT

                                                                                                                        0.2

                                                                                                                        0.0
                                                                                                                              WT     CBDless

                                                                                                E                             Kv1.3/mito
                                                                                                      Pearson’s Coef.

                                                                                                                        1.0
        CBDless

                                                                                                                        0.5

                                                                                                                        0.0
                                                                                                                              WT     CBDless

Figure 8. Kv1.3 colocalizes with plasma membrane and mitochondria in primary human T lymphocytes. CD4+ lymphocytes were isolated from human
blood as indicated in Materials and methods. (A) Representative western blot from HEK 293 cells and T lymphocytes samples from two independent
human donors showing differential protein expression of Kv1.3, Flotillin, and Cav1. b-Actin was a loading control. (B) Representative confocal images of
Kv1.3 colocalization in plasma membrane (Mb) from Kv1.3YFP WT and Kv1.3YFP CBDless-transfected cells. WGA stained plasma membrane. (C)
Representative confocal images of Kv1.3 colocalization in mitochondria (mito) from Kv1.3YFP WT and Kv1.3YFP CBDless expressing cells. MitoTracker
was used for mitochondrial staining. Scale bar represents 10 mm. Quantification of Kv1.3/Mb (D) and Kv1.3/mito (E) colocalization was performed by
Pearson’s coefficient. Data are the mean ± SE (n > 20), Student’s t-test. Gray bars, Kv1.3YFP WT cells; white bars, Kv1.3YFP CBDless cells.

                                     hypothesis. In T-lymphocytes, which lack of endogenous Cav1 expression, no differences in apopto-
                                     sis between cells expressing Kv1.3 WT and Kv1.3 CBDless were found. Similarly, silencing of Cav1
                                     expression in 3T3-L1 preadipocytes increased the apoptosis. However, the presence of Cav1 exhib-
                                     ited anti-apoptotic properties but solely in cells expressing the wild-type channel.

Capera, Pérez-Verdaguer, Peruzzo, et al. eLife 2021;10:e69099. DOI: https://doi.org/10.7554/eLife.69099                                              14 of 24

Figure 8
Research article Cancer Biology Cell Biology
Kv1.3 Mitochondria Tubeness Skeleton
A B C D M Length (mm)
Control
0.4 ***
***
0.3
0.2
0.1
0.0
Control WT CBDless
E F G H N Form factor (A.U.)
4 ***
WT
3
***
2
1
0
Control WT CBDless
I J K L O Area (mm2)
CBDless
0.8 ***
0.6
***
0.4
0.2
0.0
Control WT CBDless
Figure 9. The expression of Kv1.3YFP WT and Kv1.3YFP CBDless in T lymphocytes alters the mitochondrial morphology. Human CD4+ T lymphocytes
were transfected with Kv1.3YFP WT or Kv1.3YFP CBDless. (A–D) Representative confocal images of non- transfected T cells. (E–H) T lymphocytes
transfected with Kv1.3YFP WT. (I–L) T lymphocytes transfected with Kv1.3YFP CBDless. (A, E, and I) Kv1.3YFP (green); (B, F, and J) MitoTracker (red).
Images were processed (tubeness (C, G, and K) and skeleton (D, H, and L)) to perform morphometric analysis (M, N, and O) of mitochondria. Scale bar
represents 10 mm. (M) The length of mitochondrial networks was measured as the average area of the skeletonized binary image. (N) The form factor
Figure 9
(arbitrary units, A.U.) describes the particle shape complexity and is computed as the average (perimeter)2/(4parea). A circle corresponds to a minimum
value of 1. (O) Average area of particles detected on the binary image. Data are the mean ± SE (n > 20). ***pResearch article Cancer Biology Cell Biology
A B
Cav- Cav+
TMRM fluorescence (A.U.)
250 15
*
200 *
* *
Apoptosis (A.U.)
150 10
100
5
50
0 0
Control WT CBDless WT CBDless WT CBDless
Figure 10. Caveolin-1 protects from apoptosis when associated with Kv1.3 in primary human T lymphocytes. Human CD4+ T lymphocytes were
transfected with Kv1.3YFP WT or Kv1.3YFP CBDless and the mitochondrial membrane potential (TMRM) and apoptosis were measured. YFP-transfected
cells were used as a control. (A) Mitochondrial membrane potential was determined by tetramethyl rhodamine methyl ester (TMRM) fluorescence. Cells
were incubated with TMRM and analyzed by flow cytometry. A.U, arbitrary units. (B) T cells were electroporated with Kv1.3YFP WT or Kv1.3YFP CBDless
with (Cav+) or without (Cav ) Cav1 Cerulean. After 24 hr, transfected cells were sorted and apoptosis was assessed by Annexin V staining with flow
cytometry. The level of apoptosis in arbitrary units (A.U.) was measured in each group by resting the value of basal apoptosis in cells transfected with
YFP in the presence (Cav ) or the absence (Cav ) of Cav1. Black bar, cells electroporated with YFP; gray bar, Kv1.3 YFP WT; white bar, Kv1.3YFP
CBDless. Cav , regular CD4+ cells without Cav 1; Cav+, T cells transfected with Cav1 Cer. Data are the mean ± SE (n = 5–7). *pResearch article Cancer Biology Cell Biology
Isolation of T-cell subsets, cell culture, and T-cell blast generation
Human CD4+ T-cell subsets were isolated from peripheral whole blood using negative selection
Rosette Sep kit from STEMCELL Technologies. Human T lymphocytes were cultured at 37˚C, 5%
CO2, in RPMI 1640 medium (Life Technologies) supplemented with 10% FCS, 1% glutamine, 1% pen-
icillin–streptomycin (Gibco), 1 Non-Essential Amino Acids Solution (Thermo Fisher Scientific), 10
mM HEPES (Life Technologies), and 50 U/ml IL-2 (Bionova). To generate T-cell blasts, the Dynabeads
Human T-Activator CD3/CD28 for T-cell expansion and activation kit (Life Technologies) was used
following manufacturer’s instructions. Human T-cell blasts were used after 6–7 days of expansion
protocol. No IL-2 was supplemented in media the day before an experiment. In some experiments,
pEYFP-Kv1.3 WT, pEYFP-Kv1.3CBDless, and pECerulean-Cav1 were electroporated into human CD4
+ lymphocytes as abovementioned.
The protocol was reviewed and approved by the Ethics Committee of the Universitat de Barce-
lona and the Banc de Sang i Teixits de Catalunya (BST). Institutional Review Board (IRB00003099).
All procedures followed the rules of the Declaration of Helsinki Guidelines. All donors signed a writ-
ten informed consent, and samples were totally anonymous and untraceable.
Raft isolation
Low-density, Triton-insoluble complexes were isolated as previously described (Pérez-
Verdaguer et al., 2016a). Briefly, after three washes in phosphate-buffered saline (PBS), cells were
homogenized in 1 ml of 1% Triton X-100 MBS (150 mM NaCl, 25 mM 2-morpholinoethanesulfonic
acid 1-hydrate, pH 6.5) supplemented with 1 mg/ml aprotinin, 1 mg/ml leupeptin, 1 mg/ml pepstatin,
and 1 mM phenylmethylsulfonyl fluoride to inhibit proteases. Sucrose in MBS was added to a final
concentration of 40%. A 5–30% linear sucrose gradient was layered on top and further centrifuged
(39,000 rpm) for 20–22 hr at 4˚C in a Beckman SW41Ti swinging rotor. Gradient fractions (1 ml) were
collected from the top and analyzed by western blot.
Purification of mitochondria
Mitochondria from HEK 293 cells were purified by differential centrifugation (adapted from
Wieckowski et al., 2009). Briefly, 80% confluent cells were trypsinized and washed twice with PBS
without Ca2+ and centrifuged at 600 g for 10 min. Cells were homogenized in initial buffer 1 (225
mM mannitol, 75 mM sucrose, 0.1 mM EGTA, 30 mM Tris, pH 7.4) and centrifuged again at 600 g
for 10 min to remove unlysed cells and nuclei. The supernatant was centrifuged at 7000 g 10 min.
The mitochondria-containing pellet was suspended in initial buffer 2 (225 mM mannitol, 75 mM
sucrose, 30 mM Tris, pH 7.4) and centrifuged again at 7000 g. The suspension of the pellet was
repeated and centrifuged at 10,000 g to obtain a purified mitochondrial fraction. The supernatant
from the first 7000 g centrifugation was then centrifuged at 20,000 g for 30 min and the pellet
contained the membranous fraction. Mitochondrial and membranous fractions were suspended in 50
ml of initial buffer 2. All centrifugations were performed at 4 ˚C.
Protein extraction, coimmunoprecipitation, biotinylation of cell surface
proteins, and western blot analysis
Cells were washed in cold PBS, lysed on ice with NHG solution (1% Triton X-100, 10% glycerol, 50
mM HEPES pH 7.2, 150 mM NaCl) supplemented with 1 mg/ml aprotinin, 1 mg/ml leupeptin, 1 mg/ml
pepstatin, and 1 mM phenylmethylsulfonyl fluoride to inhibit proteases. Homogenates were centri-
fuged at 16,000 g for 15 min, and the protein content was measured using the Bio-Rad Protein
Assay. For immunoprecipitation, samples were precleared with 30 ml of protein A-sepharose beads
for 2 hr at 4˚C with gentle mixing and the beads were then removed by centrifugation at 1000 g
for 30 s at 4˚C as part of the coimmunoprecipitation procedures. Meanwhile, 50 ml of protein
A-sepharose beads were incubated in 500 ml of NGH in the presence or in the absence of an anti-
caveolin antibody (4 ng/mg protein) at 4˚C with gentle agitation and washed three times to obtain
antibody-bound A-sepharose beads. The precleared samples were then incubated overnight at 4˚C
with antibody-bound A-sepharose beads. Finally, supernatants were removed by centrifugation at
1000 g for 30 s at 4˚C, and beads were washed four times with NHG and resuspended in 100 ml of
Laemmli SDS buffer.
Capera, Pérez-Verdaguer, Peruzzo, et al. eLife 2021;10:e69099. DOI: https://doi.org/10.7554/eLife.69099 17 of 24Research article Cancer Biology Cell Biology
Three oocytes were placed into a 1.5 ml Eppendorf tube and homogenized by pipetting in 100 ml
of homogenization buffer (20 mM Tris–HCl pH 7.6, 0.1 M NaCl, 1% Triton X-100) with protease
inhibitor cocktail. Homogenates were incubated for 20 min at 4˚C to solubilize membrane proteins
and centrifuged at 10,000 g for 2 min at 4˚C. Supernatants were transferred to a new tube, and
protein content was determined using the Bio-Rad Protein Assay (Bio-Rad).
Cell surface biotinylation was determined with the Pierce Cell Surface Protein Isolation Kit (Pierce)
following manufacturer’s instructions. Briefly, cell surface proteins were labeled with sulfosuccini-
midyl-2-(biotinamido)ethyl-1,3-dithiopropionate (Sulfo-NHS-SS-biotin; Pierce). Then, cells were
treated with lysis buffer, and clear supernatant was reacted with immobilized NeutrAvidin gel slurry
in columns (Pierce) to isolate surface proteins. Protein samples (50 mg), raft fractions (50 ml), mito-
chondria and membranous fractions (50 ml), and immunoprecipitates were boiled in Laemmli SDS
loading buffer and separated by 10% SDS–PAGE. Next, samples were transferred to PVDF mem-
branes (Immobilon-P, Millipore) and blocked with 5% dry milk-supplemented with 0.05% Tween 20
in PBS. The filters were then immunoblotted with specific antibodies: anti-GFP (1:500, Roche), anti-
caveolin (1:250, BD Biosciences), anti-Kv1.3 (1:200, Neuromab), anti-clathrin (1:1000, BD Bioscien-
ces), anti-flotillin (1:500, BD Biosciences), anti-b actin (1:50,000, Sigma), anti-Na+/K+ ATPase (Devel-
opmental Studies Hybridoma Bank, The University of Iowa), anti-VDAC (1:5000, Calbiochem), anti-
GRP78 (1:1000, Cell Signaling Technology), anti-XBP1 (1:1000, Abcam), anti-ATF4 (1:500, Santa Cruz
Biotechnologies), anti-eIF2a (1:1000, Abcam), and anti-eIF2a pS51 (1:1000, Abcam). Finally, mem-
branes were washed with 0.05% Tween 20 in PBS and incubated with horseradish peroxidase conju-
gated secondary antibodies (Bio-Rad).
Immunocytochemistry and confocal imaging
Cells seeded on poly-D-lysine-treated coverslips were used 24 hr later for transfection. Cells were
washed with PBS and fixed (only HEK 293 cells) with 4% paraformaldehyde (PFA) for 10 min at room
temperature (RT). To detect cis-golgi, cells were permeabilized by incubating with 0.1% Triton X-100
for 10 min. After a 60 min in blocking solution (10% goat serum [Gibco], 5% nonfat dry milk, PBS),
cells were treated with a mouse anti-GM130 antibody (1/1000, BD Transduction Laboratories) anti-
body in 10% goat serum and 0.05% Triton X-100 and were again incubated for 1 hr. After three
washes, preparations were incubated for 45 min with an Alexa-Fluor-660 conjugated antibody
(1:200; Molecular Probes), washed, and mounted in Mowiol (Calbiochem). All procedures were per-
formed at RT. All images were acquired with a Leica TCS SP2 AOBS microscope. Colocalization anal-
ysis was performed with ImageJ (National Institutes of Health, Bethesda, MD) following
Sastre et al., 2019, and the morphometric analysis of mitochondria was performed following
Strack and Usachev, 2017.
In CD4+ human T lymphocytes, 500 nM MitoTracker (Thermo Fisher Scientific) was used to visual-
ize mitochondria according to manufacturer’s instructions. For membrane surface labeling, Wheat
Germ Agglutinin-Alexa555 (WGA, Invitrogen) was used. Cells were washed with PBS at 4˚C and
stained with a dilution of WGA (1/1500) in RPMI supplemented with 30 mM Hepes for 5 min at 4˚C.
Next, cells were washed twice and fixed with 4% paraformaldehyde for 10 min. Finally, cells were
washed and mounted in Mowiol (Calbiochem). Confocal images were acquired with a Zeiss 880 con-
focal microscope.
Cell unroofing preparations (CUPs) and Förster resonance energy
transfer (FRET)
CUPs were obtained via osmotic shock as previously described (Oliveras et al., 2020). Briefly, cells
were cooled on ice for 5 min and washed twice with PBS. Next, cells were incubated for 5 min in 1:3
diluted KHMgE (70 mM KCl, 30 mM HEPES, 5 mM MgCl2, 3 mM EGTA, pH 7.5) and were gently
washed with nondiluted KHMgE to induce the hypotonic shock. Broken cells were removed from the
coverslip by pipetting up and down. After two washes with KHMgE buffer, only membrane sheets
remained attached. CUPs were fixed with fresh 4% paraformaldehyde for 10 min at RT and mounted
in Mowiol mounting media.
FRET was performed using the acceptor photobleaching configuration. Samples were imaged
with a Leica SP2 confocal microscope. Images were acquired before and after YFP bleaching using a
63 oil immersion objective at a zoom setting of 4. Excitation was performed via the 458 and 514
Capera, Pérez-Verdaguer, Peruzzo, et al. eLife 2021;10:e69099. DOI: https://doi.org/10.7554/eLife.69099 18 of 24Research article Cancer Biology Cell Biology
nm lines using an Ar laser, and 465–510 and 525–560 bandpass emission filters were used. FRET effi-
ciency (FRETeff) was calculated using the following equation:
ðFDafter FDbeforeÞ=FDbefore x 100
where FDafter: donor fluorescence (Cerulean) after and FDbefore before acceptor (YFP) bleach.
Analysis was performed using ImageJ.
Transmission electron microscopy and correlative transmission electron
microscopy
Cells were transfected and, after 24 hr, fixed with 4% PFA and 0.1% glutaraldehyde at RT for 1 hr
followed by a treatment with 2% PFA for 30 min. High-pressure freeze cryofixation with liquid N2
and cryosubstitution, Lowicryl resine embedding, polymerization of blocks, and ultrathin sections (60
nm) were performed in collaboration with Unitat de criomicroscòpia electrònica (CCiT, University of
Barcelona). Samples were mounted over Formvar-coated grilles, and sections were finally contrasted
with uranyl acetate 2% for 15 min. Immunolabeling was performed with the primary antibodies anti-
Kv1.3 (Neuromab, 1:30) and anti-Caveolin 1 (1:70, Abcam). Secondary antibodies were conjugated
to 12 and 18 nm gold particles as indicated. Samples were imaged using a Tecnai Spirit 120kV
microscope. Correlative transmission electron microscopy was performed by the Microscopy Facility
of the Department of Biology, University of Padova, as described in Leanza et al., 2017.
Cell death assays, mitochondrial membrane potential measurements,
and oxygen consumption rate (OCR) measurements
For the evaluation of apoptosis, plated cells were treated for 18 or 24 hr with the indicated drugs
(0.5 mM staurosporine; 10 mM ceramide; 5 mM etoposide) in DMEM without serum and phenol red.
After treatment, cells were washed with PBS and suspended in FACS buffer (10 mM HEPES, 140
Mm NaCl, 2.5 mM CaCl2, pH 7.4) containing Annexin V APC and DAPI for 15 min in the dark. Sam-
ples were immediately analyzed using either a Gallios flow cytometer (HEK 293 cells) or a micro-
scope (B16F10 cells). To measure mitochondrial membrane potential, cells were incubated with 20
nM tetramethyl rhodamine methyl ester (TMRM) in DMEM without serum and phenol red. Next,
samples were diluted up to 5 nM TMRM with more DMEM and analyzed by flow cytometry (FACS-
Canto II, Becton Dickinson).
Respiration was measured using an XF24 Extracellular Flux Analyzer (Seahorse, Bioscience). HEK
293 cells, with >60% transfection efficiency, were seeded at 1.5 104 cells/well in 100 ml of DMEM.
After 24 hr, the medium was replaced with 670 ml/well of high-glucose DMEM without serum and
sodium bicarbonate and supplemented with 10 mM sodium pyruvate and 2 mM L-glutamine. The
OCR was measured upon the addition of oligomycin to block ATP synthase (2 mg/ml), FCCP uncou-
pler (200 nM), and Antimycin A to inhibit complex III (1 mM). All chemicals were added to 70 ml of
DMEM. Positive YFP fluorescence was used to monitor cell transfection before OCR measurements
by using a Leica microscope (not shown).
Molecular modeling
Kv1.3 was modeled using high-resolution templates of remote or close homologs available from the
Protein Data Bank (PDB; http://www.rcsb.org/pdb) as previously described (Martı́nez-Mármol et al.,
2013; Solé et al., 2019). Transmembrane domains and the N-terminus (except for the first 49 amino
acids [aa]) were modeled with the Kv1.2 potassium channel (PDB code 2R9R). The C terminus and
the remaining 49 aa from the N-terminus were modeled with 3HGF (nucleotide-binding domain of
the reticulocyte-binding protein Py235) and 1PXE (zinc-binding domain from neural zinc finger fac-
tor-1) structures, respectively. The procedure was defined by the i-Tasser online server (http://zhan-
glab.ccmb.med.umich.edu/I-TASSER/), and sequence alignments were executed using CLUSTALW
from the European Bioinformatics Institute site (http://www.ebi.ac.uk). The homology modeling was
performed using the Swiss-Model Protein Modeling Server on the ExPASy Molecular Biology web-
site (http://kr.expasy.org/) under the Project Mode. The final molecular graphic representations
were created using PyMOL v1.4.1 (http://www.pymol.org/) (Martı́nez-Mármol et al., 2013;
Solé et al., 2019).
Capera, Pérez-Verdaguer, Peruzzo, et al. eLife 2021;10:e69099. DOI: https://doi.org/10.7554/eLife.69099 19 of 24Research article Cancer Biology Cell Biology
Oocyte preparation, microinjection, and electrophysiological recordings
Animal handling was carried out in accordance with the guidelines for the care and use of experi-
mental animals adopted by the E.U (RD214/1997). Adult female Xenopus laevis (Harlan Interfauna
Ibérica) were immersed in cold 0.17% ethyl 3-aminobenzoate methanesulfonate for 20 min, and a
piece of ovary was drawn out aseptically. Fully grown immature oocytes, stages V and VI, were iso-
lated and their surrounding layers were removed manually. Cells were kept at 15–16˚C in a modified
Barth’s solution (88 mM NaCl, 1 mM KCl, 2.40 mM NaHCO3, 0.33 mM Ca(NO3)2, 0.41 mM CaCl2,
0.82 mM MgSO4, 10 mM HEPES [pH 7.4], 100 U/ml penicillin, and 0.1 mg/ml streptomycin) until use.
Oocytes were microinjected with 100 nL of cRNA from Kv1.3 WT or Kv1.3CBDless pCDNA3.
Membrane current recordings were performed at 21–25˚C, 16–72 hr after injection using a high-
compliance two-microelectrode voltage-clamp system (TurboTEC-10CD npi, Tamm). The recording
methodology has been described in detail elsewhere (Morales et al., 1995; Olivera-Bravo et al.,
2007). Briefly, oocytes were placed in a 150 mL recording chamber and continuously superfused with
normal frog Ringer’s solution (115 mM NaCl, 2 mM KCl, 1.8 mM CaCl2, 5 mM HEPES, pH 7.0). The
membrane potential was held at 100 mV and 20 mV depolarizing voltage steps were applied
to +40 mV for a duration of 2.5 s. Membrane currents were low-pass filtered at 30–200 Hz and
recorded on a PC, after sampling (Digidata 1200, Molecular Devices, San Jose, CA) at fivefold the fil-
ter frequency, using the WCP v.3.2.8 package developed by J. Dempster (Strathclyde Electrophysiol-
ogy Software, University of Strathclyde, UK).
Statistics
The results are expressed as the mean ± SE. Student’s t-test, one-way ANOVA, and Tukey’s post
hoc test and two-way ANOVA were used for statistical analysis (GraphPad PRISM v5.01). pResearch article Cancer Biology Cell Biology
European Regional Develop- Antonio Felipe
ment Fund
The funders had no role in study design, data collection and interpretation, or the
decision to submit the work for publication.
Author contributions
Jesusa Capera, Formal analysis, Validation, Investigation, Visualization, Methodology, Writing - origi-
nal draft, Writing - review and editing; Mireia Pérez-Verdaguer, Conceptualization, Formal analysis,
Validation, Investigation, Visualization, Methodology, Writing - original draft, Writing - review and
editing; Roberta Peruzzo, Juan Martı́nez-Pinna, Armando Alberola-Die, Formal analysis, Investiga-
tion, Methodology; Marı́a Navarro-Pérez, Formal analysis, Validation, Investigation, Visualization,
Methodology, Writing - review and editing; Andrés Morales, Formal analysis, Funding acquisition,
Validation, Investigation, Methodology; Luigi Leanza, Formal analysis, Supervision, Validation, Inves-
tigation, Methodology; Ildiko Szabó, Conceptualization, Supervision, Funding acquisition, Validation,
Methodology, Writing - original draft, Project administration, Writing - review and editing; Antonio
Felipe, Conceptualization, Supervision, Funding acquisition, Validation, Writing - original draft, Proj-
ect administration, Writing - review and editing
Author ORCIDs
Jesusa Capera https://orcid.org/0000-0002-8123-7725
Roberta Peruzzo https://orcid.org/0000-0001-9209-9068
Marı́a Navarro-Pérez https://orcid.org/0000-0001-8106-9787
Armando Alberola-Die http://orcid.org/0000-0001-5391-5739
Antonio Felipe https://orcid.org/0000-0002-7294-6431
Ethics
Human subjects: The protocol was reviewed and approved by the Ethics Committee of the Universi-
tat de Barcelona and the Banc de Sang i Teixits de Catalunya (BST). Institutional Review Board
(IRB00003099). All procedures followed the rules of the Declaration of Helsinki Guidelines. All
donors signed a written informed consent and samples were totally anonymous and untraceable.
Animal experimentation: Animal handling was carried out in accordance with the guidelines for the
care and use of experimental animals adopted by the E.U (RD214/1997).
Decision letter and Author response
Decision letter https://doi.org/10.7554/eLife.69099.sa1
Author response https://doi.org/10.7554/eLife.69099.sa2
Additional files
Supplementary files
. Transparent reporting form
Data availability
All data generated or analysed during this study are publicly available on Dryad at https://doi.org/
10.5061/dryad.mcvdnck13.
The following dataset was generated:
Database and
Author(s) Year Dataset title Dataset URL Identifier
Felipe 2021 Data from: A novel mitochondrial https://doi.org/10.5061/ Dryad Digital
Kv1.3-caveolin axis controls cell dryad.mcvdnck13 Repository, 10.5061/
survival and apoptosis dryad.mcvdnck13
Capera, Pérez-Verdaguer, Peruzzo, et al. eLife 2021;10:e69099. DOI: https://doi.org/10.7554/eLife.69099 21 of 24Research article Cancer Biology Cell Biology
References
Barbuti A, Scavone A, Mazzocchi N, Terragni B, Baruscotti M, Difrancesco D. 2012. A caveolin-binding domain in
the HCN4 channels mediates functional interaction with caveolin proteins. Journal of Molecular and Cellular
Cardiology 53:187–195. DOI: https://doi.org/10.1016/j.yjmcc.2012.05.013, PMID: 22659290
Bock J, Szabó I, Gamper N, Adams C, Gulbins E. 2003. Ceramide inhibits the potassium channel Kv1.3 by the
formation of membrane platforms. Biochemical and Biophysical Research Communications 305:890–897.
DOI: https://doi.org/10.1016/S0006-291X(03)00763-0
Bosch M, Marı́ M, Herms A, Fernández A, Fajardo A, Kassan A, Giralt A, Colell A, Balgoma D, Barbero E,
González-Moreno E, Matias N, Tebar F, Balsinde J, Camps M, Enrich C, Gross SP, Garcı́a-Ruiz C, Pérez-Navarro
E, Fernández-Checa JC, et al. 2011. Caveolin-1 deficiency causes cholesterol-dependent mitochondrial
dysfunction and apoptotic susceptibility. Current Biology 21:681–686. DOI: https://doi.org/10.1016/j.cub.2011.
03.030, PMID: 21497090
Brini M, Leanza L, Szabo I. 2018. Lipid-Mediated modulation of intracellular ion channels and redox state:
physiopathological implications. Antioxidants & Redox Signaling 28:949–972. DOI: https://doi.org/10.1089/ars.
2017.7215, PMID: 28679281
Byrne DP, Dart C, Rigden DJ. 2012. Evaluating caveolin interactions: do proteins interact with the caveolin
scaffolding domain through a widespread aromatic residue-rich motif? PLOS ONE 7:e44879. DOI: https://doi.
org/10.1371/journal.pone.0044879, PMID: 23028656
Cahalan MD, Chandy KG. 2009. The functional network of ion channels in T lymphocytes. Immunological Reviews
231:59–87. DOI: https://doi.org/10.1111/j.1600-065X.2009.00816.x, PMID: 19754890
Capera J, Serrano-Novillo C, Navarro-Pérez M, Cassinelli S, Felipe A. 2019. The potassium channel odyssey:
mechanisms of traffic and membrane arrangement. International Journal of Molecular Sciences 20:734.
DOI: https://doi.org/10.3390/ijms20030734, PMID: 30744118
Giacomello M, Pyakurel A, Glytsou C, Scorrano L. 2020. The cell biology of mitochondrial membrane dynamics.
Nature Reviews Molecular Cell Biology 21:204–224. DOI: https://doi.org/10.1038/s41580-020-0210-7,
PMID: 32071438
Hatanaka M, Maeda T, Ikemoto T, Mori H, Seya T, Shimizu A. 1998. Expression of caveolin-1 in human T cell
leukemia cell lines. Biochemical and Biophysical Research Communications 253:382–387. DOI: https://doi.org/
10.1006/bbrc.1998.9744, PMID: 9878546
Leanza L, Henry B, Sassi N, Zoratti M, Chandy KG, Gulbins E, Szabò I. 2012. Inhibitors of mitochondrial Kv1.3
channels induce Bax/Bak-independent death of cancer cells. EMBO Molecular Medicine 4:577–593.
DOI: https://doi.org/10.1002/emmm.201200235, PMID: 22496117
Leanza L, Romio M, Becker KA, Azzolini M, Trentin L, Managò A, Venturini E, Zaccagnino A, Mattarei A,
Carraretto L, Urbani A, Kadow S, Biasutto L, Martini V, Severin F, Peruzzo R, Trimarco V, Egberts JH, Hauser C,
Visentin A, et al. 2017. Direct pharmacological targeting of a mitochondrial ion channel selectively kills tumor
cells in Vivo. Cancer Cell 31:516–531. DOI: https://doi.org/10.1016/j.ccell.2017.03.003, PMID: 28399409
Levitan I, Fang Y, Rosenhouse-Dantsker A, Romanenko V. 2010. Cholesterol and ion channels. Sub-Cellular
Biochemistry 51:509–549. DOI: https://doi.org/10.1007/978-90-481-8622-8_19, PMID: 20213557
Martı́nez-Mármol R, Pérez-Verdaguer M, Roig SR, Vallejo-Gracia A, Gotsi P, Serrano-Albarrás A, Bahamonde MI,
Ferrer-Montiel A, Fernández-Ballester G, Comes N, Felipe A. 2013. A non-canonical di-acidic signal at the
C-terminus of Kv1.3 determines anterograde trafficking and surface expression. Journal of Cell Science 126:
5681–5691. DOI: https://doi.org/10.1242/jcs.134825, PMID: 24144698
Martı́nez-Mármol R, Comes N, Styrczewska K, Pérez-Verdaguer M, Vicente R, Pujadas L, Soriano E, Sorkin A,
Felipe A. 2016. Unconventional EGF-induced ERK1/2-mediated Kv1.3 endocytosis. Cellular and Molecular Life
Sciences 73:1515–1528. DOI: https://doi.org/10.1007/s00018-015-2082-0
Miki T, Nagashima K, Tashiro F, Kotake K, Yoshitomi H, Tamamoto A, Gonoi T, Iwanaga T, Miyazaki J, Seino S.
1998. Defective insulin secretion and enhanced insulin action in KATP channel-deficient mice. PNAS 95:10402–
10406. DOI: https://doi.org/10.1073/pnas.95.18.10402, PMID: 9724715
Morales A, Aleu J, Ivorra I, Ferragut JA, Gonzalez-Ros JM, Miledi R. 1995. Incorporation of reconstituted
acetylcholine receptors from Torpedo into the Xenopus oocyte membrane. PNAS 92:8468–8472. DOI: https://
doi.org/10.1073/pnas.92.18.8468, PMID: 7667313
Nwosu ZC, Ebert MP, Dooley S, Meyer C. 2016. Caveolin-1 in the regulation of cell metabolism: a Cancer
perspective. Molecular Cancer 15:71. DOI: https://doi.org/10.1186/s12943-016-0558-7, PMID: 27852311
Okada S, Raja SA, Okerblom J, Boddu A, Horikawa Y, Ray S, Okada H, Kawamura I, Murofushi Y, Murray F, Patel
HH. 2019. Deletion of caveolin scaffolding domain alters Cancer cell migration. Cell Cycle 18:1268–1280.
DOI: https://doi.org/10.1080/15384101.2019.1618118, PMID: 31116089
Olivera-Bravo S, Ivorra I, Morales A. 2007. Diverse inhibitory actions of quaternary ammonium cholinesterase
inhibitors on Torpedo nicotinic ACh receptors transplanted to Xenopus oocytes. British Journal of
Pharmacology 151:1280–1292. DOI: https://doi.org/10.1038/sj.bjp.0707329, PMID: 17572698
Oliveras A, Serrano-Novillo C, Moreno C, de la Cruz A, Valenzuela C, Soeller C, Comes N, Felipe A. 2020. The
unconventional biogenesis of Kv7.1-KCNE1 complexes. Science Advances 6:eaay4472. DOI: https://doi.org/10.
1126/sciadv.aay4472
Paggio A, Checchetto V, Campo A, Menabò R, Di Marco G, Di Lisa F, Szabo I, Rizzuto R, De Stefani D. 2019.
Identification of an ATP-sensitive potassium channel in mitochondria. Nature 572:609–613. DOI: https://doi.
org/10.1038/s41586-019-1498-3
Capera, Pérez-Verdaguer, Peruzzo, et al. eLife 2021;10:e69099. DOI: https://doi.org/10.7554/eLife.69099 22 of 24You can also read