Social networks predict the life and death of honey bees
←
→
Page content transcription
If your browser does not render page correctly, please read the page content below
bioRxiv preprint doi: https://doi.org/10.1101/2020.05.06.076943. this version posted September 1, 2020. The copyright holder for this
 preprint (which was not certified by peer review) is the author/funder. It is made available under a CC-BY 4.0 International license.

 Social networks predict the life and death of honey bees

                Benjamin Wild1∗ †, David M Dormagen1 †, Adrian Zachariae2 †,
                Michael L Smith4,5,6 , Kirsten S Traynor1,7 , Dirk Brockmann2,3 ,
                            Iain D Couzin4,5,6 , Tim Landgraf1∗

        1   Department of Mathematics and Computer Science, Freie Universität Berlin, Berlin, Germany.
                                          2   Robert Koch Institute, Berlin, Germany
                 3   Institute for Theoretical Biology, Humboldt University Berlin, Berlin, Germany.
   4   Department of Collective Behaviour, Max Planck Institute of Animal Behavior, Konstanz, Germany.
   5   Centre for the Advanced Study of Collective Behaviour, University of Konstanz, Konstanz, Germany.
                          6   Department of Biology, University of Konstanz, Konstanz, Germany.
                 7   Global Biosocial Complexity Initiative, Arizona State University, Tempe, USA.

                     ∗
                         Corresponding authors; b.w@fu-berlin.de, tim.landgraf@fu-berlin.de
                                               † Equal contribution

                                                             Abstract

        In complex societies, individuals’ roles are reflected by interactions with other conspecifics.
        Honey bees (Apis mellifera) generally change tasks as they age, but developmental trajectories
        of individuals can vary drastically due to physiological and environmental factors. We introduce
        a succinct descriptor of an individual’s social network that can be obtained without interfering
        with the colony. This network age accurately predicts task allocation, survival, activity patterns,
        and future behavior. We analyze developmental trajectories of multiple cohorts of individuals
        in a natural setting and identify distinct developmental pathways and critical life changes. Our
        findings suggest a high stability in task allocation on an individual level. We show that our method
        is versatile and can extract different properties from social networks, opening up a broad range of
        future studies. Our approach highlights the relationship of social interactions and individual traits,
        and provides a scalable technique for understanding how complex social systems function.

                                                                  1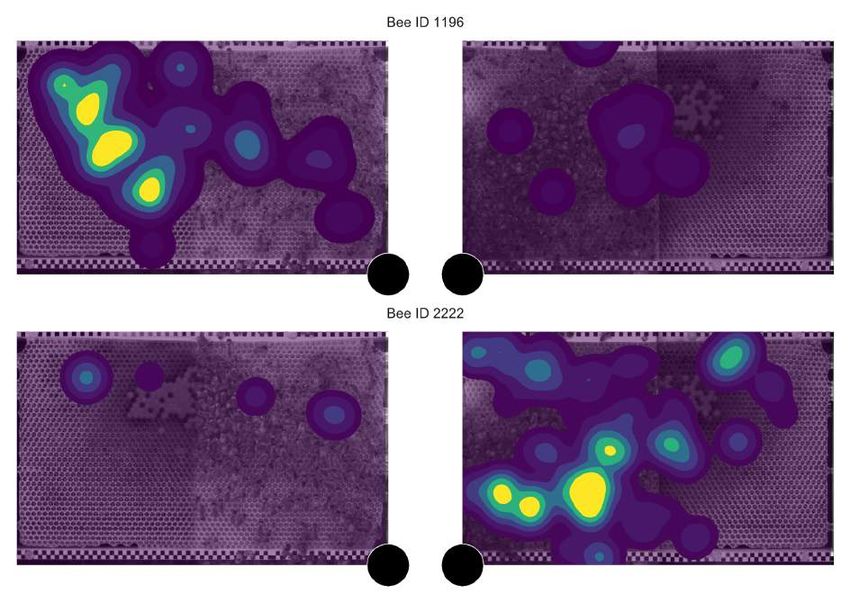
bioRxiv preprint doi: https://doi.org/10.1101/2020.05.06.076943. this version posted September 1, 2020. The copyright holder for this
  preprint (which was not certified by peer review) is the author/funder. It is made available under a CC-BY 4.0 International license.

1      Introduction
In complex systems, intricate global behaviors emerge from the dynamics of interacting parts. Within
animal groups, studying the ways that individuals interact helps elucidate their function (Farine et al.
2015; Gordon 2010; Krause et al. 2015; Pinter-Wollman, Hobson, et al. 2014). Social interaction
networks have been used to investigate e.g. pair-bonding (Psorakis et al. 2012), inter-group brokering
(Lusseau et al. 2004), offspring survival (Cheney et al. 2016), cultural spread (Aplin et al. 2015),
policing behavior (Flack et al. 2006), leadership in mobile groups (Strandburg-Peshkin et al. 2018),
organization of food retrieval (Planckaert et al. 2019), and the propagation of alarm response (Rosenthal
et al. 2015; Sosna et al. 2019). As our ability to collect detailed social network data increases, so too
does our need to develop tools for understanding the significance and functional consequences of these
networks (Gomez-Marin et al. 2014).
Social insects are an ideal model system to study the relationship between social interactions and
individual roles, because task allocation has long been hypothesized to arise from interactions (Gordon
1996; Tofts et al. 1992; Traniello et al. 1997). The relationship of individual roles within the colony
and the social network, however, is not well understood. Individuals, for example, can modify their
behavior based on nestmate interaction (Pinter-Wollman, Bala, et al. 2013; Pinter-Wollman, Wollman,
et al. 2011; Seeley 1992), and interactions change depending on where and with whom individuals
interact (Davidson et al. 2017; Pinter-Wollman, Wollman, et al. 2011; Quevillon et al. 2015). These
studies typically target specific types of interactions (e.g. food-exchange), specific roles within task
allocation (e.g. foraging), or specific stimuli within the nest (e.g. brood), but an automatic observation
system could capture the entirety of behaviors and interactions within a colony without human bias.
Measuring the multitude of social interactions and their effect on behavior, and the social networks
over the lifetime of individuals without interfering with the system (e.g., by removing individuals) is
an open problem.
In honey bees, task allocation is characterized by temporal polyethism (Baracchi et al. 2014; Naug
2008; Schneider et al. 2004), where workers gradually change tasks as they age: young bees care
for brood in the center of the nest, while old bees forage outside (Huang et al. 1996; Seeley 1982).
Previous works often used few same-aged cohorts resulting in an unnatural age distribution (Baracchi
et al. 2014; Gernat et al. 2018; Huang et al. 1996; Naug 2008). The developmental trajectory of
individuals can, however, vary drastically due to internal physiological factors (i.e. genetics, ovary size,
sucrose responsiveness (Gro Vang Amdam et al. 2003; Ihle et al. 2010; Pankiw et al. 1999; Scheiner
2012; Wang, Kocher, et al. 2012; Wang, Kaftanoglu, Siegel, et al. 2010)), nest state (i.e. amount of
brood, brood age, food stores (Dreller et al. 1999; Seeley 1989; Traynor et al. 2015)), and the external
environment (i.e. season, resource availability, forage success (Ament et al. 2010; Huang et al. 1995;
Toth et al. 2005; Wang, Kaftanoglu, Brent, et al. 2016)). These myriad influences on maturation rate
are difficult to disentangle, but all drive the individual’s behavior and task allocation. Due to the spatial
organization of honey bee colonies, task changes also result in a change of location, with further
implications on the cues that workers encounter (Seeley 1982). How and when bees change their
allocated tasks in a natural setting has typically been assessed through destructive sampling (e.g. for
measuring hormone titers of selected individuals), but understanding how all these factors combine
would ideally be done in an undisturbed system.
With the advent of automated tracking, there has been renewed interest in how interactions change
within colonies (Blut et al. 2017; Mersch et al. 2013), how spatial position predicts task allocation
(Crall et al. 2018), and how spreading dynamics occur in social networks (Gernat et al. 2018). Despite
extensive work on the social physiology of honey bee colonies (Seeley 1995), few works have studied
interaction networks from a colony-wide or temporal perspective (Gernat et al. 2018; Hasenjager et al.
2020). While there is considerable variance in task allocation, even among bees of the same age, it is
unknown to what extent this variation is reflected in the social networks. In large social groups, like

                                                                   2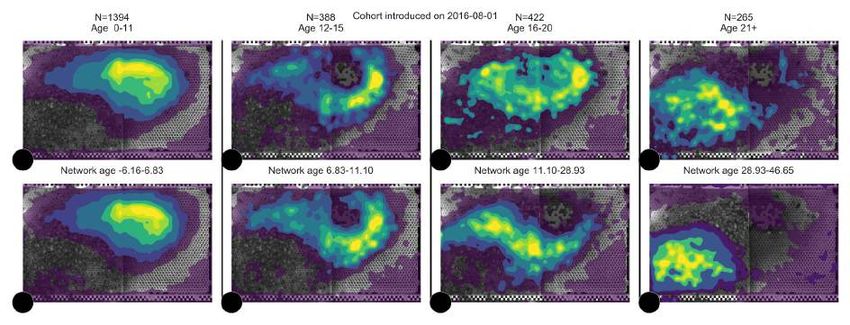
bioRxiv preprint doi: https://doi.org/10.1101/2020.05.06.076943. this version posted September 1, 2020. The copyright holder for this
  preprint (which was not certified by peer review) is the author/funder. It is made available under a CC-BY 4.0 International license.

honey bee colonies, typically only a subset of individuals are tracked, or tracking is limited to short
time intervals (Blut et al. 2017; Bozek et al. 2020; Naug 2008).
Tracking an entire colony over a long time would allow one to investigate the stability of task allocation.
Prior research has shown that during each life stage, an individual spends most of its time in a specific
nest region (Johnson 2010; Seeley 1982), interacting with nestmates, but with whom they interact may
depend on more than location alone (Farina 2000; Girard et al. 2011). Social interactions permit an
exchange of information and can have long-term effects on an individual’s behavior (Cholé et al. 2019).
While honey bees are well-known for their elaborate social signals (e.g. waggle dance, shaking signal,
stop signal (Frisch 1967; Nieh 2010; Seeley et al. 2012)), they also exchange information through food
exchange, antennation, or simple colocalization (Balbuena et al. 2012; Goyret et al. 2003). However,
identifying an individual’s role in a group based on its characteristic patterns of interaction remains
challenging, particularly with large numbers of individuals and multiple modes of interaction.
In order to broadly understand how an individual’s social network may contribute to its lifetime role
within a complex society, we developed a tracking method of an entire colony of several thousand
individuals with a natural age distribution, which permits unbiased long-term assessments. We
investigate how we can extract meaning from the multitude of interactions and interaction types, among
thousands of individuals in a honey bee colony.
We introduce a low-dimensional descriptor, network age, that allows us to compress the social network
of all individuals in the colony into a single number per bee per day. Network age, and therefore the
social network of a bee, captures the individual’s behavior and social role in the colony and allows us
to predict task allocation, mortality, and behavioral patterns such as velocity and circadian rhythms.
Following the developmental trajectories of individual honey bees and cohorts that emerged on the
same day reveals clusters of different developmental paths, and critical transition points. In contrast to
these distinct clusters of long-term trajectories, we find that transitions in task allocation are fluid on an
individual level. We show that the task allocation of individuals in a natural setting is stable over long
periods, allowing us to predict a worker’s task better than biological age up to one week into the future.

Figure 1: Network age, a one-dimensional descriptor of an individual’s role within the colony,
based on an individual’s interaction pattern. Using the BeesBook automated tracking system, we
obtain lifetime tracking data for individuals (A). These tracks are used to construct multiple weighted
social interaction networks (B). We aggregate daily networks (C) to then extract embeddings that group
bees together with similar interaction patterns, using spectral decomposition (D). Finally, we use a
linear transformation (e; CCA = canonical-correlation analysis) that maximizes correlation with the
fraction of time spent in different nest areas (F) to compress them into a single number called network
age (G).

                                                                   3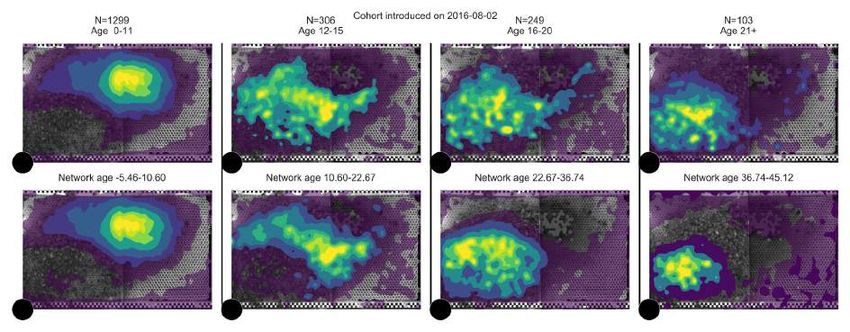
bioRxiv preprint doi: https://doi.org/10.1101/2020.05.06.076943. this version posted September 1, 2020. The copyright holder for this
  preprint (which was not certified by peer review) is the author/funder. It is made available under a CC-BY 4.0 International license.

2      What is network age?
To obtain the social network structure over the lifetime of thousands of bees, we require methods
that will track the tasks and social interactions of many individuals over consecutive days. We video
recorded a full colony of individually marked honey bees (A. mellifera) at 3 Hz for 25 days (from 2016-
08-01 to 2016-08-25) and obtained continuous trajectories for all individuals in the hive (Boenisch
et al. 2018; Wario, Wild, Couvillon, et al. 2015). We used a two-sided single-frame observation hive
with a tagged queen and started introducing individually tagged bees into the colony approximately
one month before the beginning of the focal period (2016-06-28 to 2016-08-23). To ensure that no
unmarked individuals emerged inside the hive, we replaced the nest substrate regularly (approx. every
21 days). In total, we recorded 1921 individuals aged from 0 days to 8 weeks.
A worker’s task and the proportion of time she spends in specific nest areas are tightly coupled in
honey bees (Seeley 1982). We annotated nest areas associated with specific tasks (e.g. brood area
or honey storage) for each day separately (see section SI 1.4), as they can vary in size and location
over time (Smith et al. 2016). We then use the proportion of time an individual spends in these areas
throughout a day as an estimate of her current tasks.
We calculated daily aggregated interaction networks from contact frequency, food exchange (trophal-
laxis), distance, and changes in movement speed after contacts (see section SI 1.3). These networks
contain all the pairwise interactions between all individuals over time. For each day and interaction
type, we extract a compact representation that groups bees together with similar interaction patterns,
using spectral decomposition (Belkin et al. 2003; von Luxburg 2007). We then combine each bees’
daily representations of all interaction types and map them to a scalar value (network age) that best
reflects the fraction of time spent in the task-associated areas using CCA (canonical-correlation anal-
ysis; (Hotelling 1936; Knapp 1978)). Note that network age is solely a representation of the social
network and not of location; the fraction of time spent in the task-associated areas is only used to
select which information to extract from the social networks (e.g., by assigning higher importance to
trophallactic interactions). Network age can still represent an individual’s location, but only if this
information is inherently present in the social networks. Network age thus compresses millions of
data points per individual and day (1920 potential interaction partners, each detected 127 501 ± 50 340
times on average per day, with four different interaction types) into a single number that represents
each bee’s daily position in the multimodal temporal interaction network. Since CCA is applied over
the entire focal period, network age can only represent interaction patterns that are consistent over
time. See fig. 1 for an overview and section SI 1.5 for a detailed description of the methods.
Network age is a unitless descriptor. We scale it such that 90% of the values are between 0 and 40
to make it intuitively comparable to a typical lifespan of a worker bee during summer, and because
biological age is commonly associated with task allocation in honey bees. This scaling can be omitted
for systems where behavior is not coupled with biological age.

3      Network age correctly identifies task allocation
We quantify to what extent network age, and therefore the social interaction patterns, reflect task
allocation by using multinomial regression to predict the fraction of time each bee spends in the
annotated nest areas (see section SI 2.4). Note that while we also used these spatial preferences to
select which information to extract from the interaction networks, it is not certain whether the spatial
information is contained in the social network in the first place, and how well a single dimension
can capture it. Furthermore, the social network structure could vary over many days with changing
environmental influences, preventing the extraction of a stable descriptor. The regression analysis
allows us to compare different variants of network age to biological age as a reference.

                                                                   4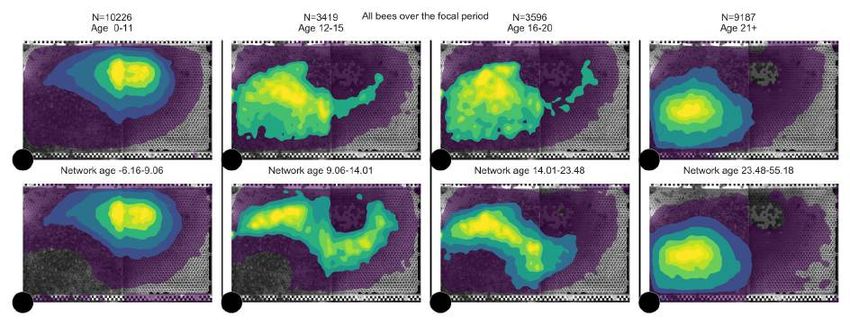
bioRxiv preprint doi: https://doi.org/10.1101/2020.05.06.076943. this version posted September 1, 2020. The copyright holder for this
  preprint (which was not certified by peer review) is the author/funder. It is made available under a CC-BY 4.0 International license.

(A)                                                                                      (B)

(C)

Figure 2: Network age is an accurate descriptor of task allocation. (A) The proportion of time
spent on task-associated locations in relation to biological age and network age with each cross
representing one individual on one day of her life. For a given value on the y-axis (network age)
colors are more consistent than for a given value on the x-axis (biological age). (B) Z-transformed age
distributions for known foragers visiting a feeder (N=40). The variance in biological age is greater
than the variance in network age (boxes: center dot, median; box limits, upper and lower quartiles;
whiskers, 1.5x interquartile range). Corresponding biological ages are also shown on the right y-axis
(original biological age: 34.2 ± 7.9, original network age: 38.3 ± 4.6; mean ± standard deviation). (C)
Spatial distributions of an example cohort over time (bees emerged on 2016-07-29, 64 individuals over
25 days), grouped by biological age (top row) versus network age (bottom row). Note how network
age more clearly delineates groups of bees than biological age, with bees transitioning from the brood
nest (center of the comb), to the surrounding area, to the dance floor (lower left area).

To evaluate the regression fit, we use McFadden’s pseudo R2 scores R2McF (McFadden 1973). Network
age is twice as good as biological age at predicting the individuals’ location preferences, and therefore
their tasks (network age: median R2McF = 0.682, 95% CI [0.678, 0.687]; biological age: median
R2McF = 0.342, 95% CI [0.335, 0.349]; 95% CI of effect size [0.332, 0.348], N=128; likelihood-ratio
χ2 test p  0.001, N=26 403, table 1, see section SI 2.6 for details). Network age provides a better
separability of time spent in task-associated nest areas than biological age (fig. 2A, example cohort in
fig. 2C, section SI 1.8 for all cohorts). Network age correlates with location because of the inherent
coupling between tasks and nest areas. Still, it is not a direct measure of location: bees with the same
network age can exhibit different spatial distributions and need not directly interact (see section SI 2.3).
While we can improve the predictive power of network age by extracting a multi-dimensional de-
scriptor instead of a single value (see sections SI 1.5 and SI 2.4 for details), the improvements for

                                                                   5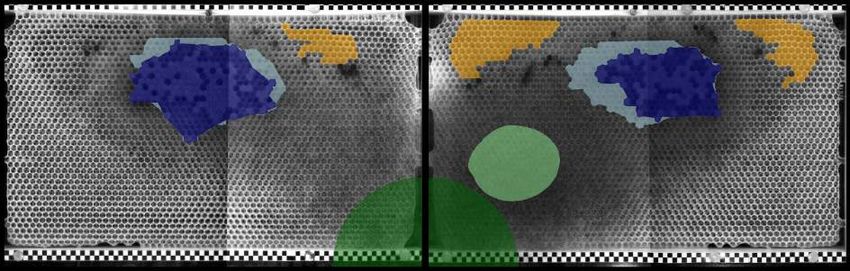
bioRxiv preprint doi: https://doi.org/10.1101/2020.05.06.076943. this version posted September 1, 2020. The copyright holder for this
preprint (which was not certified by peer review) is the author/funder. It is made available under a CC-BY 4.0 International license.
additional dimensions are marginal. This implies that a one-dimensional descriptor captures most of
the information from the social networks that is relevant to the individuals’ location preferences and
therefore their tasks.
We experimentally demonstrated that network age robustly captures an individual’s task by setting up
sucrose feeders and identifying workers that foraged at the feeders (known foragers, N=40, methods
in section SI 2.5). We then compared the biological ages of these known foragers to their network
ages. As expected, foragers exhibited a high biological age and a high network age, whereas biological
age exhibited significantly larger variance than network age (fig. 2B; Levene’s test (Levene 1960),
performed on z-transformed values: p
0.001, N=200). Indeed, while we observed a forager as
young as 12 days old, that individual had a network age of 25.5, demonstrating that network age
more accurately reflected her task than her biological age (z-transformed values: biological age -0.46;
network age 0.61).
Tagging an entire honey bee colony is laborious. However, by sampling subsets of bees, we find
that network age is still a viable metric, even when only a small proportion of individuals are tagged
and tracked. With only 1% of the bees tracked, network age is still a good predictor of task (median
R2McF = 0.516, 95% CI [0.135, 0.705], N=128) while increasing the number of tracked individuals to
5% of the colony results in a R2McF value comparable to the fully tracked colony (5% of colony tracked:
median R2McF = 0.650, 95% CI [0.578, 0.705], N=128; whole colony tracked: median R2McF = 0.682,
95% CI [0.678, 0.687], N=128; see section SI 2.2). Similarly, we find that an approximation of network
age can be calculated without annotated nest areas: Network age can be extracted in an unsupervised
manner using PCA on the spectral embeddings of the different interaction type matrices (median
R2McF = 0.646, 95% CI [0.641, 0.650], N=128, see section SI 1.6).
4 Developmental changes over the life of a bee
Network age reveals differences in interaction patterns and task allocation among same-aged bees
(fig. 3A). After around six days of biological age, the network age distribution becomes bimodal (see
section SI 3.4). Bees in the functionally old group (high network age) spend the majority of their time
on the dance floor, whereas same-aged bees in the functionally young group (low network age) are
found predominantly in the honey storage area (fig. 3A). Transitions from high to low network age are
a rare occurrence in our colony (see section SI 3.5).
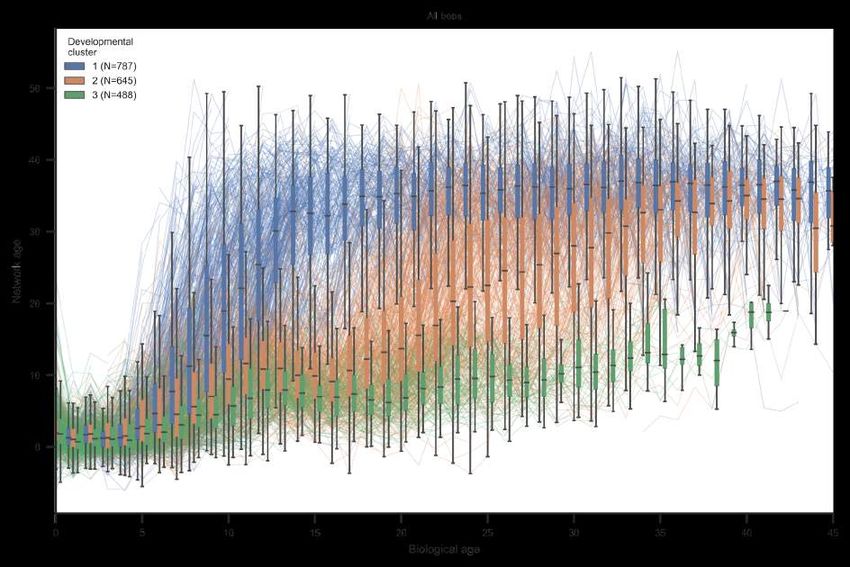
We attribute the split on the population level to distinct patterns of individual development. Clustering
the time series of network ages over the lives of bees identifies distinct developmental paths within
same-aged cohorts (see section SI 3.2 for the method). In the cohort that emerged on 2016-08-01, the
first developmental cluster (blue, fig. 3B) rapidly transitions to a high network age (likely corresponding
to foraging behavior) after only 11 days. The second cluster (orange) transitions at around 21 days of
biological age, while bees in the third cluster (green) remain at a lower network age throughout the
focal period. We see similar splits in developmental trajectories for all cohorts, although the timing of
these transitions varies (see section SI 3.2 for additional cohorts). Such divergence in task allocation
has been previously shown in bees; factors that accelerate a precocious transition to foraging include
hormone titers (Robinson et al. 1987), genotype (Pankiw et al. 1999), physiology, especially the
number of ovarioles (Gro V. Amdam, Norberg, et al. 2004), and sucrose response threshold (Scheiner
et al. 2004).
The transition from low to high network age over multiple days is characterized by a gradual shift in
the spatial distribution (see example in fig. 3C), highlighting that an individual’s task changes gradually.
The network age of most bees is highly repeatable (median R = 0.612 95% CI=[0.199, 0.982], see
section SI 3.1 for details), indicating task stability over multiple days. Both findings (gradual change
6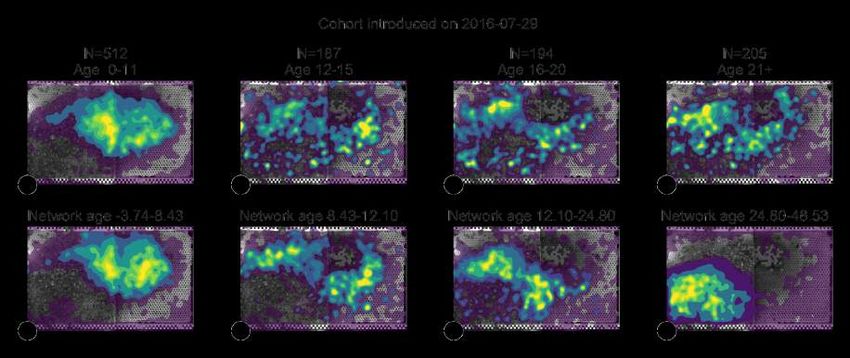
bioRxiv preprint doi: https://doi.org/10.1101/2020.05.06.076943. this version posted September 1, 2020. The copyright holder for this
  preprint (which was not certified by peer review) is the author/funder. It is made available under a CC-BY 4.0 International license.

(A)

(B)

(C)

Figure 3: Network age reveals distinct developmental paths. (A) Left: The median of network ages
over biological ages for all individuals that lived more than 11 days (light blue: 60% of data; see
section SI 3.3). We observe a split in network age corresponding to different tasks: The upper heatmap
(network age 30-40, biological age 20-30, 577 bees, 857 283 data points) corresponds to the dance
floor, while the lower heatmap (network age 5-15, biological age 20-30, 381 bees, 742 622 data points)
borders between dance floor and brood nest. Right: The mean fraction of time a bee with a given
network age spends on our annotated regions throughout a day. (B) Lines depict the network age of
individual bees of a same-aged cohort with the colors indicating clusters of their network age over time.
Boxes summarize bees belonging to each cluster for a given day (center line, median; box limits, upper
and lower quartiles; whiskers, 1.5x interquartile range). (C) Heatmaps showing the spatial distribution
of bees in the developmental cluster 2 (orange) from 2016-08-19 to 2016-08-24. The smooth transition
in network age (orange in line plot, B) from one mode to another corresponds to a smooth transition in
spatial location (heatmaps, C).

                                                                   7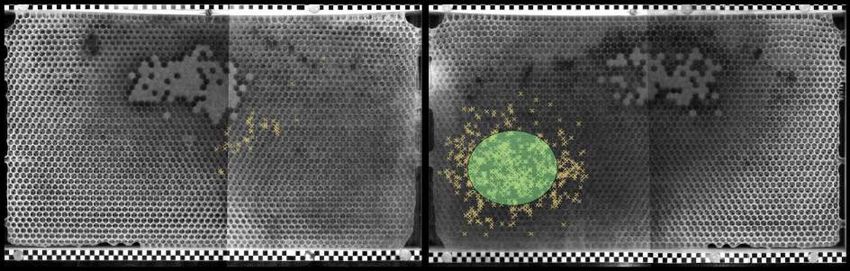
bioRxiv preprint doi: https://doi.org/10.1101/2020.05.06.076943. this version posted September 1, 2020. The copyright holder for this
  preprint (which was not certified by peer review) is the author/funder. It is made available under a CC-BY 4.0 International license.

over a few days and high repeatability) are consistent with the dynamics of the underlying physiological
processes, such as vitellogenin and juvenile hormone, that influence task allocation and the transition
to foraging (Gro V. Amdam and Page Jr 2010).

5      Network age predicts an individual’s behavior and future role
       in the colony
Network age predicts task allocation (i.e. in what part of the nest individuals will be) up to ten days into
the future. Knowing the network age of a bee today allows a better prediction of the task performed by
that individual next week than her biological age informs about her current tasks (fig. 4C, binomial test,
p  0.001, N=55 390, 95% CI of effect size [0.055, 0.090], N=128, see section SI 4.4 for details). We
confirm that this is only partially due to network age being repeatable (see section SI 4.4). We do note,
however, that our ability to predict the future tasks of a young bee is limited, especially before cohorts
split into high and low network age groups (fig. 3A). This limitation hints at a critical developmental
transition point in their lives, an attractive area for future study.
We explicitly optimized network age to be a good predictor of task-associated locations. However, we
find that network age predicts other behaviors better than biological age, including an individual’s
impending death (network age: median R2 = 0.165, 95% CI [0.158, 0.172], versus biological age:
median R2 = 0.064, 95% CI [0.059, 0.068]; 95% CI of effect size [0.037, 0.039], N=128, likelihood-
ratio χ2 test p  0.001, N=26 403). Biologically-young but network-old bees have a significantly
higher probability of dying within a week (80.6% N=139) than do biologically-old but network-young
bees (42.1% N=390; χ2 test of independence p  0.001 N=529; see section SI 4.5 for details). This
is likely because a biologically-young bee with a high network age, i.e. a bee that starts to forage
earlier in life and faces more perils imposed by the outside world, is more likely to die than a bee of
the same age with a low network age. This finding is consistent with previous work showing increased
mortality with precocious foraging (Perry et al. 2015; Rueppell et al. 2008).
Network age also captures movement patterns of individual bees such as daily and nightly average
speed, the circadian rhythm, and the time of an individual’s peak activity better than biological age (for
all dependent variables likelihood-ratio χ2 test p  0.001, N=26 403, see section SI 4.3 for 95% CI of
effect sizes). Network age thus explains behaviors of individuals independent of their location.
To investigate whether network age is a good predictor of future task allocation and behavior only
because it captures the spatial information contained in the social network, we repeat the analyses
above using the time spent in task-associated locations as independent variables. We find that network
age, even though it was extracted using this spatial information as a guide, is still a better predictor
of an individuals’ behavior (for all dependent variables likelihood-ratio χ2 test p  0.001, N=26 403,
see Location (1D) in section SI 4.6 and table 4d for 95% CI of effect sizes). This difference in
predictive power highlights that the multimodal interaction network contains more information about
an individual than spatial information alone.
While we focus on predicting tasks from network age, we can control the information we extract
from the observed social networks and derive variants of network age better suited for other research
questions. By replacing the task associated location preferences in the final step of our method with
days until death, we extracted a descriptor that captures social interaction patterns related to mortality.
This descriptor improves the prediction of the individuals’ death dates by 31% compared to network
age (median increase in R2 = 0.05; 95% CI [0.04, 0.06] N=128, see section SI 4.2 and table 4c),
opening up novel social network perspectives for studies such as the risk factors of disease transmission.
Similarly, we extracted descriptors optimized to predict the movement patterns introduced in the last
paragraph (for all except Time of peak activity likelihood-ratio χ2 test p  0.001, N=26 403, see

                                                                   8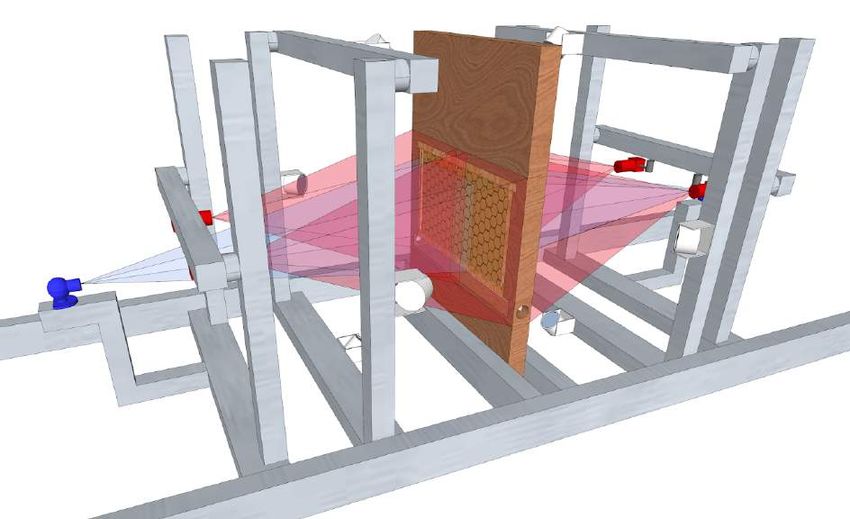
bioRxiv preprint doi: https://doi.org/10.1101/2020.05.06.076943. this version posted September 1, 2020. The copyright holder for this
  preprint (which was not certified by peer review) is the author/funder. It is made available under a CC-BY 4.0 International license.

(A)                                                                  (B)

(C)

Figure 4: Network age can be used to predict other properties, such as mortality and circadian
rhythms. It also predicts an individual’s future task allocation. (A) An individual’s mortality
on the next day based on her age (x-axes show original and z-transformed biological age and z-
transformed network age). Bees with a low network age have lower mortality than biologically young
bees; bees with a high network age have higher mortality than biologically old bees (shaded areas:
95% bootstrap confidence intervals for the regression estimates). (B) Network age can be used to
predict task allocation and future behaviors. Network age predicts the task of an individual 7 days
into the future better than biological age predicts the individual’s task the same day (blue dotted line).
Each box comprises 128 bootstrap samples (center line, median; box limits, upper and lower quartiles;
whiskers, 1.5x interquartile range; points, outliers). (C) Selected properties mapped for network age
over biological age with each cross representing one individual on one day of her life. Note that for a
given value on the y-axis (network age) colors are more consistent than for a given value on the x-axis
(biological age).

                                                                   9
bioRxiv preprint doi: https://doi.org/10.1101/2020.05.06.076943. this version posted September 1, 2020. The copyright holder for this
  preprint (which was not certified by peer review) is the author/funder. It is made available under a CC-BY 4.0 International license.

table 4c for 95% CI of effect sizes). These targeted embeddings provide precise control over the type
of information we extract from the social networks and extend the network age method to address
other important research questions in honey bees and other complex animal societies.

6      Conclusion
Combining automated tracking, social networks, and spatial mapping of the nest, we provide a low-
dimensional representation of the multimodal interaction network of an entire honey bee colony. While
many internal and external factors drive an individuals’ behavior, network age represents an accurate
way to measure the resulting behavior of all individuals in a colony non-invasively over extended
periods.
We use annotated location labels to select which information to extract from the social network, but
stress that network age can only contain information inherent in the social network. Therefore, the
predictive power of network age demonstrates that the social interaction network by itself compre-
hensively captures an individual’s behavior. We show that network age does not only separate bees
into task groups, such as foragers and nurses, but also allows us to follow maturing individuals as
they develop. A recent work derived a social maturity index in colonies of the social ant C. fellah
(Richardson et al. 2020), similarly highlighting a strong separation of nurses and foragers in the social
network and high variability in transition timing. In contrast to the fluid changes in task allocation
at an individual level, we find distinct clusters of developmental trajectories at the colony level, with
some groups entering critical developmental transitions earlier in life than others. Investigating the
precise combination of internal and external factors that drive those transitions is a promising direction
for future research.
These transition points are also reflected in changes in nest location, because spatial preferences, task
allocation, and interactions are inherently coupled in honey bees. However, we show that network
age is more than just a representation of location: Bees with the same network age do not necessarily
share a location in the nest, and the time spent in task-associated locations is less predictive of an
individual’s current and future behavior than network age. Additionally, we calculate a variant of
network age that is not guided by auxiliary spatial information but instead extracts the information with
the highest variance from the social networks (Network age PCA). The PCA variant is still predictive
of task allocation, suggesting that location is the predominant signal in the social network. However,
the higher predictive power of the CCA network age variant and the targeted embeddings indicates
that there is more information in the social network that our method can extract.
In this study, we extract network age from daily aggregated interaction networks, and thereby disregard
potentially relevant intraday information, which could reveal further differences between individuals
(e.g., the temporal aspects of intraday interaction networks can disentangle the contribution of different
modes of interactions (Hasenjager et al. 2020)). While we observe thousands of individuals and
many overlapping cohorts, there is no straight-forward extension of the method to extract a common
embedding of social networks that do not share individuals (e.g., over different experimental treatments
or repetitions). Analyzing how network age changes within a day, over other datasets with possibly
other types of interactions, or how network age shifts in response to disease pressure or experimental
manipulation of age demography would be potentially fruitful areas for future investigation, as recent
work has shown that there is an effect of viral infection on interaction behaviors (Geffre et al. 2020).
Network age can be repurposed and extended for other research questions: We show that (1) variants
of network age capture different aspects from the social networks related to mortality, velocity, or
circadian rhythms, and (2) with a subsample of only 5% of the bees in the colony, we can extract
a good representation of the social network. This makes the method applicable to systems with

                                                                  10
bioRxiv preprint doi: https://doi.org/10.1101/2020.05.06.076943. this version posted September 1, 2020. The copyright holder for this
preprint (which was not certified by peer review) is the author/funder. It is made available under a CC-BY 4.0 International license.
far more individuals or with much less required experimental effort for a comparable number of
individuals. Network age could be calculated in real-time, opening up a wide range of possibilities
for future research: For example, it would be possible to selectively remove bees that have just begun
a developmental change to determine their influence on colony-wide task allocation. Sequencing
individual bees could determine how known genetic drivers of behavioral transition, like the double-
repressor co-regulation of vitellogenin and juvenile hormone, are reflected in the social network. Our
perspective captures both internal and external influences that impact social interactions and is thus
applicable to all complex systems with observable multimodal interaction networks. Network age
can be adapted to questions that explore social interaction patterns independent of age and division
of labor, making it broadly applicable to any social system. As such, our method will permit future
research to analyze how complex social animal groups use and modify interaction patterns to adapt
and react to biotic and abiotic pressures.
7 Acknowledgements
We are indebted to numerous students, in particular Fernando Wario Vázquez, Franziska Lojewski,
Andreas Jörg, Leon Sixt, Hauke Mönck, Maria Sparenberg, Sascha Witte, Alexa Schlegel, Mathis
Hocke and Andreas Berg for providing hardware and software parts of the BeesBook system. We
thank Peter Knoll and Randolf Menzel for providing the honey bee colony and valuable advice.
Giovanni Galizia and Jake Graving gave critical feedback which helped improve the manuscript. Our
work was supported by the HPC-Service of ZEDAT (Freie Universität Berlin) and the North-German
Supercomputing Alliance who generously provided computing resources and storage capacity.
8 Funding
DMD received funding from the Andrea von Braun Foundation, and the Elsa-Neumann-Scholarship.
MLS is a Simons Foundation Postdoctoral Fellow of the Life Sciences Research Foundation, and
received funding from the Heidelberg Academy of Science and the Zukunftskolleg Mentorship Program.
This project has received funding from the European Union’s Horizon 2020 research and innovation
programme under grant agreement No 824069. This work was in part funded by the Klaus Tschira
Foundation. IDC and MLS acknowledge support from the Deutsche Forschungsgemeinschaft (DFG,
German Research Foundation) under Germany’s Excellence Strategy - EXC 2117 - 422037984 and
IDC acknowledges support from NSF Grant IOS-1355061 and Office of Naval Research Grants
N00014-09-1-1074 and N00014-14-1-0635. KST acknowledges support of the Wissenschaftskolleg zu
Berlin.
9 Author contributions
Conceptualization: BW, DMD, AZ, TL, MLS, KST; Methodology: BW, DMD, AZ, TL; Software:
BW, DMD; Resources, supervision: TL, DB, IDC; Project administration: TL; Data curation: BW,
DMD, MLS; Writing: BW, DMD, TL, MLS, KST, IDC; Visualization: BW, DMD.
10 Competing interests
Authors declare no competing interests.
11bioRxiv preprint doi: https://doi.org/10.1101/2020.05.06.076943. this version posted September 1, 2020. The copyright holder for this
preprint (which was not certified by peer review) is the author/funder. It is made available under a CC-BY 4.0 International license.
11 Data and materials availability
The datasets generated during and/or analysed during the current study are available from the corre-
sponding authors on reasonable request.
References
Abdi, Hervé (2007). “Singular and Generalized Singular Value Decomposition”. In: Encyclopedia of
Measurement and Statistics. 3 vols. Thousand Oaks: SAGE Publications, Inc., pp. 908–912. doi:
10.4135/9781412952644.
Amdam, Gro V., Kari Norberg, et al. (Aug. 3, 2004). “Reproductive Ground Plan May Mediate Colony-
Level Selection Effects on Individual Foraging Behavior in Honey Bees”. In: Proceedings of the
National Academy of Sciences 101.31, pp. 11350–11355. doi: 10.1073/pnas.0403073101.
Amdam, Gro V. and Robert E. Page Jr (2010). “The Developmental Genetics and Physiology of
Honeybee Societies”. In: Animal behaviour 79.5, pp. 973–980.
Amdam, Gro Vang and Stig W. Omholt (Aug. 2003). “The Hive Bee to Forager Transition in Honeybee
Colonies: The Double Repressor Hypothesis”. In: Journal of Theoretical Biology 223.4, pp. 451–464.
doi: 10.1016/S0022-5193(03)00121-8.
Ament, Seth A., Ying Wang, and Gene E. Robinson (2010). “Nutritional Regulation of Division of
Labor in Honey Bees: Toward a Systems Biology Perspective”. In: WIREs Systems Biology and
Medicine 2.5, pp. 566–576. doi: 10.1002/wsbm.73.
Aplin, Lucy M. et al. (Feb. 26, 2015). “Experimentally Induced Innovations Lead to Persistent Culture
via Conformity in Wild Birds”. In: Nature 518.7540, pp. 538–541. doi: 10.1038/nature13998.
Balbuena, M. S., J. Molinas, and W. M. Farina (Mar. 1, 2012). “Honeybee Recruitment to Scented Food
Sources: Correlations between in-Hive Social Interactions and Foraging Decisions”. In: Behavioral
Ecology and Sociobiology 66.3, pp. 445–452. doi: 10.1007/s00265-011-1290-3.
Baracchi, David and Alessandro Cini (2014). “A Socio-Spatial Combined Approach Confirms a
Highly Compartmentalised Structure in Honeybees”. In: Ethology 120.12, pp. 1167–1176. doi:
10.1111/eth.12290.
Belkin, Mikhail and Partha Niyogi (June 2003). “Laplacian Eigenmaps for Dimensionality Reduc-
tion and Data Representation”. In: Neural Computation 15.6, pp. 1373–1396. doi: 10 . 1162 /
089976603321780317.
Blut, Christina et al. (Dec. 15, 2017). “Automated Computer-Based Detection of Encounter Behaviours
in Groups of Honeybees”. In: Scientific Reports 7.1, p. 17663. doi: 10.1038/s41598-017-17863-
4.
Boenisch, Franziska et al. (2018). “Tracking All Members of a Honey Bee Colony Over Their Lifetime
Using Learned Models of Correspondence”. In: Frontiers in Robotics and AI 5, p. 35.
Bozek, Katarzyna et al. (Mar. 27, 2020). “Markerless Tracking of an Entire Insect Colony”. In: bioRxiv,
p. 2020.03.26.007302. doi: 10.1101/2020.03.26.007302.
Cheney, Dorothy L., Joan B. Silk, and Robert M. Seyfarth (2016). “Network Connections, Dyadic
Bonds and Fitness in Wild Female Baboons”. In: Royal Society Open Science 3.7, p. 160255. doi:
10.1098/rsos.160255.
Cholé, Hanna et al. (Apr. 22, 2019). “Social Contact Acts as Appetitive Reinforcement and Supports
Associative Learning in Honeybees”. In: Current Biology 29.8, 1407–1413.e3. doi: 10.1016/j.
cub.2019.03.025.
Collaboration, The Astropy et al. (Aug. 23, 2018). “The Astropy Project: Building an Inclusive, Open-
Science Project and Status of the v2.0 Core Package”. In: The Astronomical Journal 156.3, p. 123.
doi: 10.3847/1538-3881/aabc4f.
12bioRxiv preprint doi: https://doi.org/10.1101/2020.05.06.076943. this version posted September 1, 2020. The copyright holder for this
preprint (which was not certified by peer review) is the author/funder. It is made available under a CC-BY 4.0 International license.
Crall, James D. et al. (Apr. 3, 2018). “Spatial Fidelity of Workers Predicts Collective Response to
Disturbance in a Social Insect”. In: Nature Communications 9.1, p. 1201. doi: 10.1038/s41467-
018-03561-w.
Davidson, Jacob D. and Deborah M. Gordon (Oct. 31, 2017). “Spatial Organization and Interactions
of Harvester Ants during Foraging Activity”. In: Journal of The Royal Society Interface 14.135,
p. 20170413. doi: 10.1098/rsif.2017.0413.
Dreller, Claudia, Robert E. Page Jr, and M. Kim Fondrk (Mar. 1, 1999). “Regulation of Pollen Foraging
in Honeybee Colonies: Effects of Young Brood, Stored Pollen, and Empty Space”. In: Behavioral
Ecology and Sociobiology 45.3-4, pp. 227–233. doi: 10.1007/s002650050557.
Farina, Walter Marcelo (2000). “The Interplay between Dancing and Trophallactic Behavior in the
Honey Bee Apis Mellifera”. In: Journal of Comparative Physiology A. doi: 10.1007/s003590050424.
Farine, Damien R. and Hal Whitehead (2015). “Constructing, Conducting and Interpreting Animal
Social Network Analysis”. In: Journal of Animal Ecology 84.5, pp. 1144–1163.
Flack, Jessica C. et al. (Jan. 2006). “Policing Stabilizes Construction of Social Niches in Primates”. In:
Nature 439.7075, pp. 426–429. doi: 10.1038/nature04326.
Frisch, Karl von (1967). “The Dance Language and Orientation of Bees.” In:
Geffre, Amy C. et al. (Apr. 22, 2020). “Honey Bee Virus Causes Context-Dependent Changes in
Host Social Behavior”. In: Proceedings of the National Academy of Sciences. doi: 10.1073/pnas.
2002268117.
Gernat, Tim et al. (Feb. 13, 2018). “Automated Monitoring of Behavior Reveals Bursty Interaction
Patterns and Rapid Spreading Dynamics in Honeybee Social Networks”. In: Proceedings of the
National Academy of Sciences 115.7, pp. 1433–1438. doi: 10.1073/pnas.1713568115.
Girard, M. B., H. R. Mattila, and T. D. Seeley (Feb. 1, 2011). “Recruitment-Dance Signals Draw
Larger Audiences When Honey Bee Colonies Have Multiple Patrilines”. In: Insectes Sociaux 58.1,
pp. 77–86. doi: 10.1007/s00040-010-0118-x.
Gomez-Marin, Alex et al. (Nov. 1, 2014). “Big Behavioral Data: Psychology, Ethology and the
Foundations of Neuroscience”. In: Nature Neuroscience 17.11, pp. 1455–1463.
Gordon, Deborah M. (Mar. 1996). “The Organization of Work in Social Insect Colonies”. In: Nature
380.6570 (6570), pp. 121–124. doi: 10.1038/380121a0.
– (2010). Ant Encounters: Interaction Networks and Colony Behavior. Princeton University Press.
Goyret, J. and W. M. Farina (Aug. 1, 2003). “Descriptive Study of Antennation during Trophallactic
Unloading Contacts in Honeybees Apis Mellifera Carnica”. In: Insectes Sociaux 50.3, pp. 274–276.
doi: 10.1007/s00040-003-0678-0.
Hasenjager, Matthew J., William Hoppitt, and Ellouise Leadbeater (Jan. 31, 2020). “Network-Based
Diffusion Analysis Reveals Context-Specific Dominance of Dance Communication in Foraging
Honeybees”. In: Nature Communications 11.1 (1), pp. 1–9. doi: 10.1038/s41467-020-14410-0.
Hotelling, Harold (Dec. 1, 1936). “Relations between Two Sets of Variables”. In: Biometrika 28.3-4,
pp. 321–377. doi: 10.1093/biomet/28.3-4.321.
Huang, Z. Y. and G. E. Robinson (Apr. 1, 1995). “Seasonal Changes in Juvenile Hormone Titers and
Rates of Biosynthesis in Honey Bees”. In: Journal of Comparative Physiology B 165.1, pp. 18–28.
doi: 10.1007/BF00264682.
– (Sept. 1, 1996). “Regulation of Honey Bee Division of Labor by Colony Age Demography”. In:
Behavioral Ecology and Sociobiology 39.3, pp. 147–158. doi: 10.1007/s002650050276.
Ihle, Kate E. et al. (May 1, 2010). “Genotype Effect on Regulation of Behaviour by Vitellogenin
Supports Reproductive Origin of Honeybee Foraging Bias”. In: Animal Behaviour 79.5, pp. 1001–
1006. doi: 10.1016/j.anbehav.2010.02.009.
Johnson, Brian R. (Jan. 2010). “Division of Labor in Honeybees: Form, Function, and Proximate
Mechanisms”. In: Behavioral Ecology and Sociobiology 64.3, pp. 305–316. doi: 10.1007/s00265-
009-0874-7.
13bioRxiv preprint doi: https://doi.org/10.1101/2020.05.06.076943. this version posted September 1, 2020. The copyright holder for this
preprint (which was not certified by peer review) is the author/funder. It is made available under a CC-BY 4.0 International license.
Knapp, Thomas R. (1978). “Canonical Correlation Analysis: A General Parametric Significance-
Testing System”. In: Psychological Bulletin 85.2, pp. 410–416. doi: 10.1037/0033-2909.85.2.
410.
Krause, Jens et al. (2015). Animal Social Networks. Oxford University Press. 279 pp.
Levene, H. (1960). “Robust Tests for Equality of Variances, p 278–292”. In: Contributions to probability
and statistics: essays in honor of Harold Hotelling. Stanford University Press, Palo Alto, CA.
Lusseau, David and M. E. J. Newman (2004). “Identifying the Role That Animals Play in Their Social
Networks”. In: Proceedings: Biological Sciences 271, S477–S481.
McFadden, Daniel (1973). Conditional Logit Analysis of Qualitative Choice Behavior.
Mersch, Danielle P., Alessandro Crespi, and Laurent Keller (2013). “Tracking Individuals Shows
Spatial Fidelity Is a Key Regulator of Ant Social Organization”. In: Science 340.6136, pp. 1090–
1093.
Mönck, Hauke Jürgen (2016). “Large Scale Supercomputer Assisted and Live Video Encoding with
Image Statistics”. Masters Thesis. Freie Universität Berlin.
Naug, Dhruba (Sept. 1, 2008). “Structure of the Social Network and Its Influence on Transmission
Dynamics in a Honeybee Colony”. In: Behavioral Ecology and Sociobiology 62.11, pp. 1719–1725.
doi: 10.1007/s00265-008-0600-x.
Nieh, James C. (Feb. 23, 2010). “A Negative Feedback Signal That Is Triggered by Peril Curbs Honey
Bee Recruitment”. In: Current Biology 20.4, pp. 310–315. doi: 10.1016/j.cub.2009.12.060.
Otsu, Nobuyuki (Jan. 1979). “A Threshold Selection Method from Gray-Level Histograms”. In:
IEEE Transactions on Systems, Man, and Cybernetics 9.1, pp. 62–66. doi: 10.1109/TSMC.1979.
4310076.
Pankiw, T. and R. E. Page Jr. (Aug. 1, 1999). “The Effect of Genotype, Age, Sex, and Caste on
Response Thresholds to Sucrose and Foraging Behavior of Honey Bees (Apis Mellifera L.)” In:
Journal of Comparative Physiology A 185.2, pp. 207–213. doi: 10.1007/s003590050379.
Paszke, Adam et al. (2019). “PyTorch: An Imperative Style, High-Performance Deep Learning Library”.
In: p. 12.
Pedregosa, Fabian et al. (2011). “Scikit-Learn: Machine Learning in Python”. In: Journal of Machine
Learning Research 12 (Oct), pp. 2825–2830.
Perry, Clint J. et al. (Mar. 17, 2015). “Rapid Behavioral Maturation Accelerates Failure of Stressed
Honey Bee Colonies”. In: Proceedings of the National Academy of Sciences 112.11, pp. 3427–3432.
doi: 10.1073/pnas.1422089112.
Pinter-Wollman, Noa, Ashwin Bala, et al. (July 1, 2013). “Harvester Ants Use Interactions to Regulate
Forager Activation and Availability”. In: Animal Behaviour 86.1, pp. 197–207. doi: 10.1016/j.
anbehav.2013.05.012.
Pinter-Wollman, Noa, E. A. Hobson, et al. (Mar. 1, 2014). “The Dynamics of Animal Social Networks:
Analytical, Conceptual, and Theoretical Advances”. In: Behavioral Ecology 25.2, pp. 242–255. doi:
10.1093/beheco/art047.
Pinter-Wollman, Noa, Roy Wollman, et al. (Nov. 7, 2011). “The Effect of Individual Variation on the
Structure and Function of Interaction Networks in Harvester Ants”. In: Journal of The Royal Society
Interface 8.64, pp. 1562–1573. doi: 10.1098/rsif.2011.0059.
Planckaert, Joffrey et al. (Oct. 30, 2019). “A Spatiotemporal Analysis of the Food Dissemination
Process and the Trophallactic Network in the Ant Lasius Niger”. In: Scientific Reports 9.1 (1),
pp. 1–11. doi: 10.1038/s41598-019-52019-6.
Psorakis, Ioannis et al. (Nov. 7, 2012). “Inferring Social Network Structure in Ecological Systems from
Spatio-Temporal Data Streams”. In: Journal of the Royal Society, Interface 9.76, pp. 3055–3066.
doi: 10.1098/rsif.2012.0223.
Quevillon, Lauren E. et al. (Aug. 24, 2015). “Social, Spatial, and Temporal Organization in a Complex
Insect Society”. In: Scientific Reports 5, p. 13393. doi: 10.1038/srep13393.
14bioRxiv preprint doi: https://doi.org/10.1101/2020.05.06.076943. this version posted September 1, 2020. The copyright holder for this
preprint (which was not certified by peer review) is the author/funder. It is made available under a CC-BY 4.0 International license.
Richardson, T.O. et al. (2020). Ant Behavioral Maturation Is Mediated by a Stochastic Transition
between Two Fundamental States.
Robinson, Gene E. and Francis LW Ratnieks (1987). “Induction of Premature Honey Bee (Hy-
menoptera: Apidae) Flight by Juvenile Hormone Analogs Administered Orally or Topically”. In:
Journal of Economic Entomology 80.4, pp. 784–787.
Rosenthal, Sara Brin et al. (Apr. 14, 2015). “Revealing the Hidden Networks of Interaction in Mobile
Animal Groups Allows Prediction of Complex Behavioral Contagion”. In: Proceedings of the
National Academy of Sciences 112.15, pp. 4690–4695. doi: 10.1073/pnas.1420068112.
Rueppell, Olav et al. (May 6, 2008). “Aging and Demographic Plasticity in Response to Experimental
Age Structures in Honeybees (Apis Mellifera L)”. In: Behavioral Ecology and Sociobiology 62.10,
p. 1621. doi: 10.1007/s00265-008-0591-7.
Salvatier, John, Thomas V. Wiecki, and Christopher Fonnesbeck (Apr. 6, 2016). “Probabilistic Program-
ming in Python Using PyMC3”. In: PeerJ Computer Science 2, e55. doi: 10.7717/peerj-cs.55.
Scheiner, Ricarda (Aug. 1, 2012). “Birth Weight and Sucrose Responsiveness Predict Cognitive Skills
of Honeybee Foragers”. In: Animal Behaviour 84.2, pp. 305–308. doi: 10.1016/j.anbehav.2012.
05.011.
Scheiner, Ricarda, Robert E. Page, and Joachim Erber (2004). “Sucrose Responsiveness and Behavioral
Plasticity in Honey Bees (Apis Mellifera)”. In: Apidologie 35.2, pp. 133–142.
Schneider, Stanley S. and Lee A. Lewis (Mar. 2004). “The Vibration Signal, Modulatory Communica-
tion and the Organization of Labor in Honey Bees, Apis Mellifera”. In: Apidologie 35.2, pp. 117–131.
doi: 10.1051/apido:2004006.
Seeley, Thomas D. (Dec. 1, 1982). “Adaptive Significance of the Age Polyethism Schedule in Honeybee
Colonies”. In: Behavioral Ecology and Sociobiology 11.4, pp. 287–293. doi: 10.1007/BF00299306.
– (Mar. 1, 1989). “Social Foraging in Honey Bees: How Nectar Foragers Assess Their Colony’s
Nutritional Status”. In: Behavioral Ecology and Sociobiology 24.3, pp. 181–199. doi: 10.1007/
BF00292101.
– (Dec. 1, 1992). “The Tremble Dance of the Honey Bee: Message and Meanings”. In: Behavioral
Ecology and Sociobiology 31.6, pp. 375–383. doi: 10.1007/BF00170604.
– (1995). The Wisdom of the Hive: The Social Physiology of Honey Bee Colonies. Cambridge, Mass:
Harvard University Press. 295 pp.
Seeley, Thomas D. et al. (Jan. 5, 2012). “Stop Signals Provide Cross Inhibition in Collective Decision-
Making by Honeybee Swarms”. In: Science 335.6064, p. 108. doi: 10.1126/science.1210361.
Smith, M. L., M. M. Ostwald, and T. D. Seeley (Nov. 1, 2016). “Honey Bee Sociometry: Tracking
Honey Bee Colonies and Their Nest Contents from Colony Founding until Death”. In: Insectes
Sociaux 63.4, pp. 553–563. doi: 10.1007/s00040-016-0499-6.
Sosna, Matthew M. G. et al. (Oct. 8, 2019). “Individual and Collective Encoding of Risk in Animal
Groups”. In: Proceedings of the National Academy of Sciences 116.41, pp. 20556–20561. doi:
10.1073/pnas.1905585116.
Strandburg-Peshkin, Ariana et al. (May 19, 2018). “Inferring Influence and Leadership in Moving Ani-
mal Groups”. In: Philosophical Transactions of the Royal Society B: Biological Sciences 373.1746,
p. 20170006. doi: 10.1098/rstb.2017.0006.
Tofts, Chris and Nigel R. Franks (Oct. 1, 1992). “Doing the Right Thing: Ants, Honeybees and
Naked Mole-Rats”. In: Trends in Ecology & Evolution 7.10, pp. 346–349. doi: 10.1016/0169-
5347(92)90128-X.
Toth, Amy L. et al. (Dec. 2005). “Nutritional Status Influences Socially Regulated Foraging Ontogeny
in Honey Bees”. In: The Journal of Experimental Biology 208 (Pt 24), pp. 4641–4649. doi: 10.
1242/jeb.01956.
Traniello, James FA and Rebeca B. Rosengaus (1997). “Ecology, Evolution and Division of Labour in
Social Insects”. In: Animal behaviour 53.1, pp. 209–213.
15bioRxiv preprint doi: https://doi.org/10.1101/2020.05.06.076943. this version posted September 1, 2020. The copyright holder for this
preprint (which was not certified by peer review) is the author/funder. It is made available under a CC-BY 4.0 International license.
Traynor, Kirsten S., Yves Le Conte, and Robert E. Page (Jan. 1, 2015). “Age Matters: Pheromone
Profiles of Larvae Differentially Influence Foraging Behaviour in the Honeybee, Apis Mellifera”. In:
Animal Behaviour 99, pp. 1–8. doi: 10.1016/j.anbehav.2014.10.009.
Van der Walt, Stéfan et al. (June 19, 2014). “Scikit-Image: Image Processing in Python”. In: PeerJ 2,
e453. doi: 10.7717/peerj.453.
Von Luxburg, Ulrike (Dec. 1, 2007). “A Tutorial on Spectral Clustering”. In: Statistics and Computing
17.4, pp. 395–416. doi: 10.1007/s11222-007-9033-z.
Wang, Ying, Osman Kaftanoglu, Colin S. Brent, et al. (Apr. 1, 2016). “Starvation Stress during Larval
Development Facilitates an Adaptive Response in Adult Worker Honey Bees (Apis Mellifera L.)”
In: Journal of Experimental Biology 219.7, pp. 949–959. doi: 10.1242/jeb.130435.
Wang, Ying, Osman Kaftanoglu, Adam J. Siegel, et al. (Dec. 1, 2010). “Surgically Increased Ovarian
Mass in the Honey Bee Confirms Link between Reproductive Physiology and Worker Behavior”. In:
Journal of Insect Physiology 56.12, pp. 1816–1824. doi: 10.1016/j.jinsphys.2010.07.013.
Wang, Ying, Sarah D. Kocher, et al. (Jan. 1, 2012). “Regulation of Behaviorally Associated Gene
Networks in Worker Honey Bee Ovaries”. In: Journal of Experimental Biology 215.1, pp. 124–134.
doi: 10.1242/jeb.060889.
Ward, Joe H. Jr. (1963). “Hierarchical Grouping to Optimize an Objective Function”. In: Journal of the
American Statistical Association 58.301, pp. 236–244. doi: 10.1080/01621459.1963.10500845.
Wario, Fernando, Benjamin Wild, Margaret J. Couvillon, et al. (Sept. 25, 2015). “Automatic Methods
for Long-Term Tracking and the Detection and Decoding of Communication Dances in Honeybees”.
In: Frontiers in Ecology and Evolution 3. doi: 10.3389/fevo.2015.00103.
Wario, Fernando, Benjamin Wild, Raúl Rojas, et al. (2017). “Automatic Detection and Decoding of
Honey Bee Waggle Dances”. In: PloS one 12.12, e0188626.
Wild, Benjamin, Leon Sixt, and Tim Landgraf (Feb. 13, 2018). Automatic Localization and Decoding
of Honeybee Markers Using Deep Convolutional Neural Networks.
16You can also read