Forage and Habitat for Pollinators in the Northern Great Plains-Implications for U.S. Department of Agriculture Conservation Programs
←
→
Page content transcription
If your browser does not render page correctly, please read the page content below
Prepared in cooperation with the U.S. Department of Agriculture

Forage and Habitat for Pollinators in the Northern Great
Plains—Implications for U.S. Department of Agriculture
Conservation Programs

Open-File Report 2020–1037

U.S. Department of the Interior
U.S. Geological Survey
A B C
D E F
G H I
Cover. A, Bumble bee (Bombus sp.) visiting a locowood flower. Photograph by Stacy Simanonok,
U.S. Geological Survey (USGS). B, Honey bee (Apis mellifera) foraging on yellow sweetclover
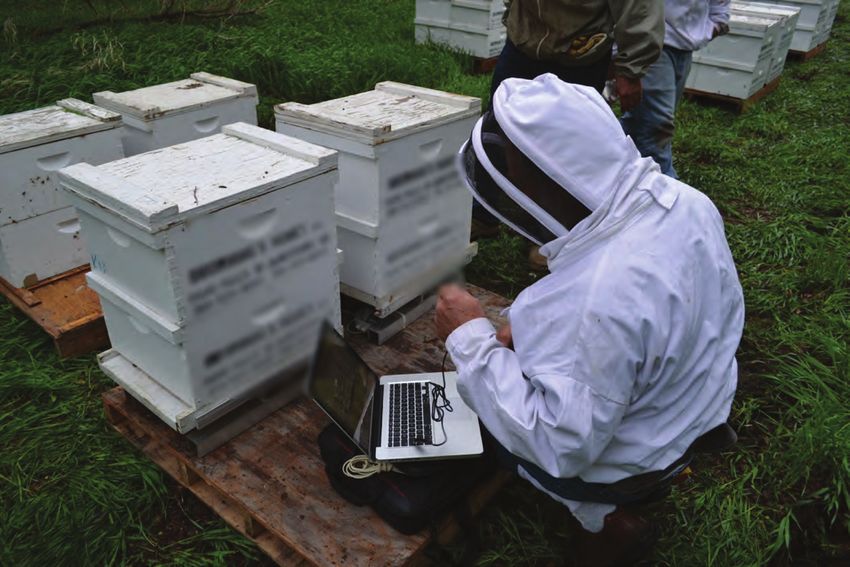
(Melilotus officinalis). Photograph by Sarah Scott, USGS. C, Two researchers working on honey
bee colonies in a North Dakota apiary. Photograph by Elyssa McCulloch, USGS. D, Purple prairie
clover (Dalea purpurea) against a backdrop of grass. Photograph by Stacy Simanonok, USGS.
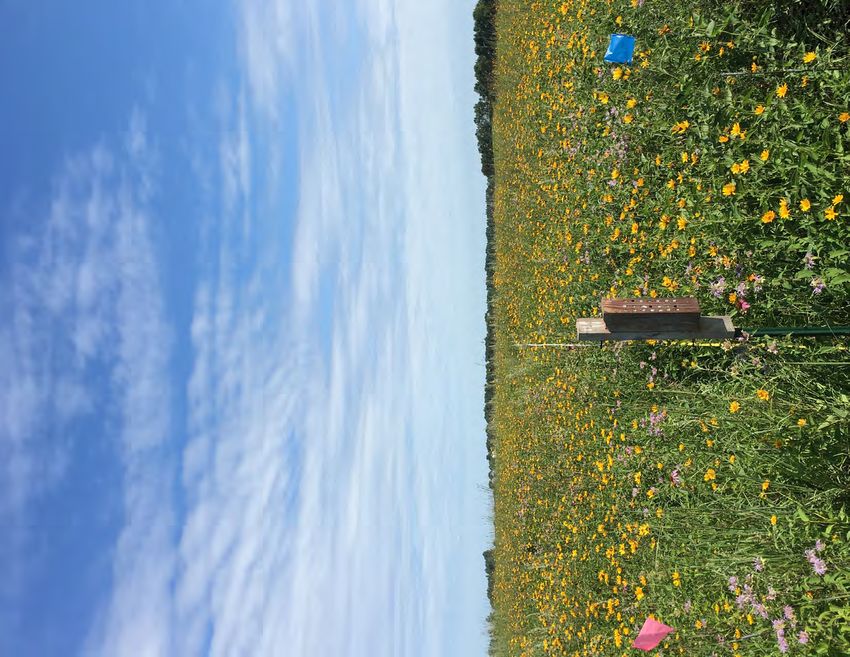
E, Conservation Reserve Program pollinator habitat in bloom. Photograph by Clint Otto, USGS.
F, Prairie onion (Allium stellatum) along the slope of a North Dakota hillside. Photograph by
Mary Powley, USGS. G, A researcher assesses a honey bee colony in North Dakota. Photograph by
Katie Lee, University of Minnesota. H, Honey bee foraging on alfalfa (Medicago sativa). Photograph
by Savannah Adams, USGS. I, Bee resting on woolly paperflower (Psilostrophe tagetina). Photograph
by Angela Begosh, Oklahoma State University. Front cover background and back cover, A USGS
research transect on a North Dakota Conservation Reserve Program field in full bloom. Photograph
by Mary Powley, USGS.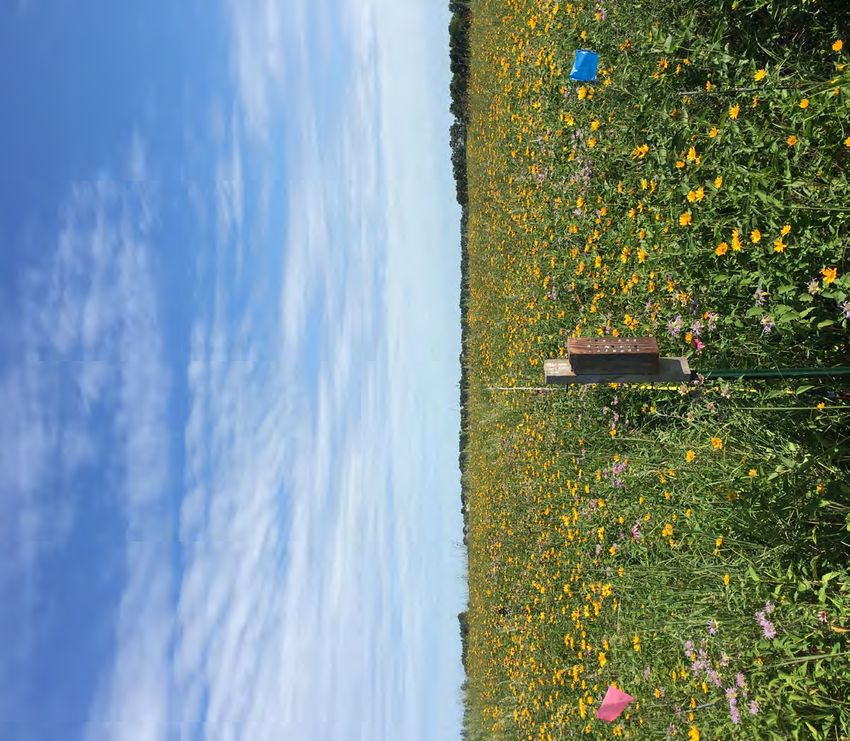
Forage and Habitat for Pollinators in the
Northern Great Plains—Implications
for U.S. Department of Agriculture
Conservation Programs

By Clint R.V. Otto, Autumn Smart, Robert S. Cornman, Michael Simanonok, and
Deborah D. Iwanowicz

Prepared in cooperation with the U.S. Department of Agriculture

Open-File Report 2020–1037

U.S. Department of the Interior
U.S. Geological Survey
U.S. Department of the Interior
DAVID BERNHARDT, Secretary
U.S. Geological Survey
James F. Reilly II, Director

U.S. Geological Survey, Reston, Virginia: 2020

For more information on the USGS—the Federal source for science about the Earth, its natural and living resources,
natural hazards, and the environment—visit https://www.usgs.gov or call 1–888–ASK–USGS.
For an overview of USGS information products, including maps, imagery, and publications, visit
https://store.usgs.gov/.

Any use of trade, firm, or product names is for descriptive purposes only and does not imply endorsement by the
U.S. Government.
Although this information product, for the most part, is in the public domain, it also may contain copyrighted materials
as noted in the text. Permission to reproduce copyrighted items must be secured from the copyright owner.

Suggested citation:
Otto, C.R.V., Smart, A., Cornman, R.S., Simanonok, M., and Iwanowicz, D.D., 2020, Forage and habitat for pollinators
in the northern Great Plains—Implications for U.S. Department of Agriculture conservation programs: U.S. Geological
Survey Open-File Report 2020–1037, 64 p., https://doi.org/10.3133/ofr20201037.

Associated data for this publication:
Otto, C.R.V., Cornman, R.S., and Iwanowicz, D.D., 2020a, Dataset—Molecular identification of honey bee
collected pollen in the Northern Great Plains, North America, 2015–2016: U.S. Geological Survey data release,
https://doi.org/10.5066/P9Z7DVY4.

Otto, C.R.V., Smart, A., and Simanonok, M., 2020b, Dataset—Plant and bee transects in the Northern Great Plains
2015–2018: U.S. Geological Survey data release, https://doi.org/10.5066/P9O61BCB.

ISSN 0196-1497 (print)
ISSN 2331-1258 (online)
iii

Acknowledgments
This study was supported by the U.S. Department of Agriculture (USDA)-Farm Service Agency
(16IAMRECRPHBTA1), USDA-Natural Resource Conservation Service (673A7514178), and
the U.S. Geological Survey. We thank Skip Hyberg and Chip Euliss for developing the idea
of conducting a large-scale analysis of pollinator health and forage in the region. We thank
Rich Iovanna, John Englert, and Mace Vaughan for their continued involvement in this
project and for guiding research objectives. Jeff Pettis and Wayne Esaias helped develop
the experimental research design. Jim Jones and Jack Housenger of the U.S. Environmental
Protection Agency generated supported for our pesticide residue analysis. This project would
not have been possible without the support of commercial beekeepers at Browning Honey
Company and Adee Honey Farms, and private landowners throughout the Northern Great Plains.
Zac Browning, Bret Adee, Kelvin Adee, and Mark Klose were especially supportive of our
research efforts. USDA staff at county offices and Farm Bill Biologists assisted our team with
locating private lands enrolled in USDA conservation covers. We thank Paul Halko and U.S. Fish
and Wildlife Service staff at Arrowwood National Wildlife Refuge for granting access to refuge
lands. Our project was enhanced through discussion with Haochi Zheng, Mia Park, Marla Spivak,
and Rufus Isaacs. John Englert, Rich Iovanna, Mace Vaughan, Gabriela Quinlan, Chris Taliga, and
Stacy Simanonok provided thoughtful reviews of this report.

We recognize the contribution of so many wonderful Northern Prairie Wildlife Research Center
team members associated with this research project. Savannah Adams, Ben Carlson, and
Jill Shaffer led multiple technicians and volunteers who worked diligently to collect research
data. Cali Roth assisted with site selection. Mary Powley designed the cover layout for this
report. James Weaver was instrumental in creating the plant-pollinator interaction database.
Thanks to all of you for making this a wonderful research project.
v

Contents
Acknowledgments����������������������������������������������������������������������������������������������������������������������������������������iii
Abstract�����������������������������������������������������������������������������������������������������������������������������������������������������������1
Introduction����������������������������������������������������������������������������������������������������������������������������������������������������1
Landscape Suitability for Supporting Honey Bees����������������������������������������������������������������������������������3
     Methods and Results���������������������������������������������������������������������������������������������������������������������������3
     Relevance to the U.S. Department of Agriculture���������������������������������������������������������������������������3
Honey Bee and Land-Use Pilot Study��������������������������������������������������������������������������������������������������������4
     Methods and Results���������������������������������������������������������������������������������������������������������������������������4
Land-Use Effects on Honey Bee Colony Health and Services���������������������������������������������������������������5
     Methods�������������������������������������������������������������������������������������������������������������������������������������������������5
     Results����������������������������������������������������������������������������������������������������������������������������������������������������5
     Relevance to the U.S. Department of Agriculture���������������������������������������������������������������������������5
     Future Work�������������������������������������������������������������������������������������������������������������������������������������������5
Genetic Analysis of Bee-Collected Pollen Across the Northern Great Plains������������������������������������9
     Methods�������������������������������������������������������������������������������������������������������������������������������������������������9
     Results��������������������������������������������������������������������������������������������������������������������������������������������������11
     Relevance to the U.S. Department of Agriculture�������������������������������������������������������������������������11
     Future Work�����������������������������������������������������������������������������������������������������������������������������������������15
Plant-Pollinator Interactions on Private Lands Enrolled in the Conservation Reserve
        Program or Environmental Quality Incentives Program����������������������������������������������������������15
     Methods�����������������������������������������������������������������������������������������������������������������������������������������������15
     Results��������������������������������������������������������������������������������������������������������������������������������������������������17
           Conservation Reserve Program����������������������������������������������������������������������������������������������17
           Environmental Quality Incentives Program���������������������������������������������������������������������������24
     Relevance to the U.S. Department of Agriculture�������������������������������������������������������������������������31
Floral Resource Limitations and Honey Bee Preference����������������������������������������������������������������������35
     Methods�����������������������������������������������������������������������������������������������������������������������������������������������35
     Results��������������������������������������������������������������������������������������������������������������������������������������������������36
           Colony Weight Change and Resource Dearth Periods��������������������������������������������������������36
           Plant Preference During Dearth Periods�������������������������������������������������������������������������������36
     Relevance to the U.S. Department of Agriculture�������������������������������������������������������������������������40
     Future Work�����������������������������������������������������������������������������������������������������������������������������������������40
The Pollinator Library—A Decision-Support Tool for Enhancing Pollinator Habitat������������������������41
     Future Work�����������������������������������������������������������������������������������������������������������������������������������������42
Summary�������������������������������������������������������������������������������������������������������������������������������������������������������43
References Cited�����������������������������������������������������������������������������������������������������������������������������������������44
Appendix 1. Bee Pollen Detection Data and Plant Taxa Information����������������������������������������������47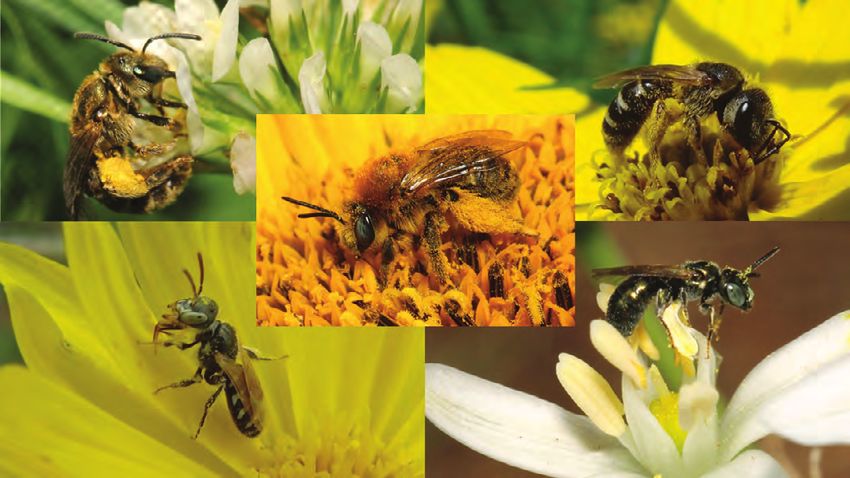
vi
Figures
1. Map showing the annual rate of change in the corn and soybean area around
18,363 honey bee apiaries from 2006 to 2014, North and South Dakota������������������������������4
2. Maps showing the study region land use in 2015–16; locations of apiaries in
North Dakota, South Dakota, and Minnesota; and two example North Dakota
apiaries�������������������������������������������������������������������������������������������������������������������������������������������6
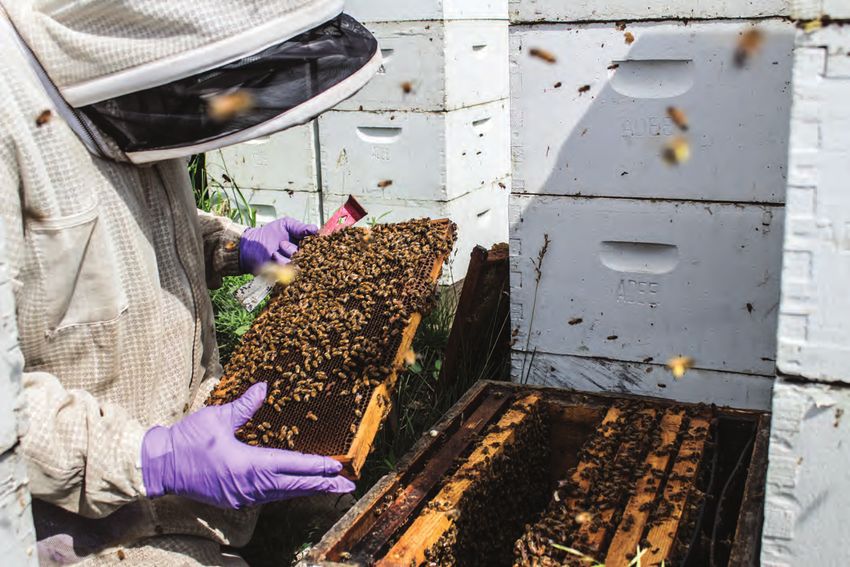
3. Photograph showing a U.S. Geological Survey biologist doing health
assessments on a honey bee colony in South Dakota, 2016�������������������������������������������������7
4. Graphs showing the relation between the area of agriculture and grassland
and the colony population change during the growing season in North Dakota,
South Dakota, and Minnesota in 2015–16���������������������������������������������������������������������������������8
5. Graph showing the relation between the area of agriculture surrounding honey
bee colonies in the summer and the sizes of those colonies during almond
pollination in California the subsequent spring�����������������������������������������������������������������������9
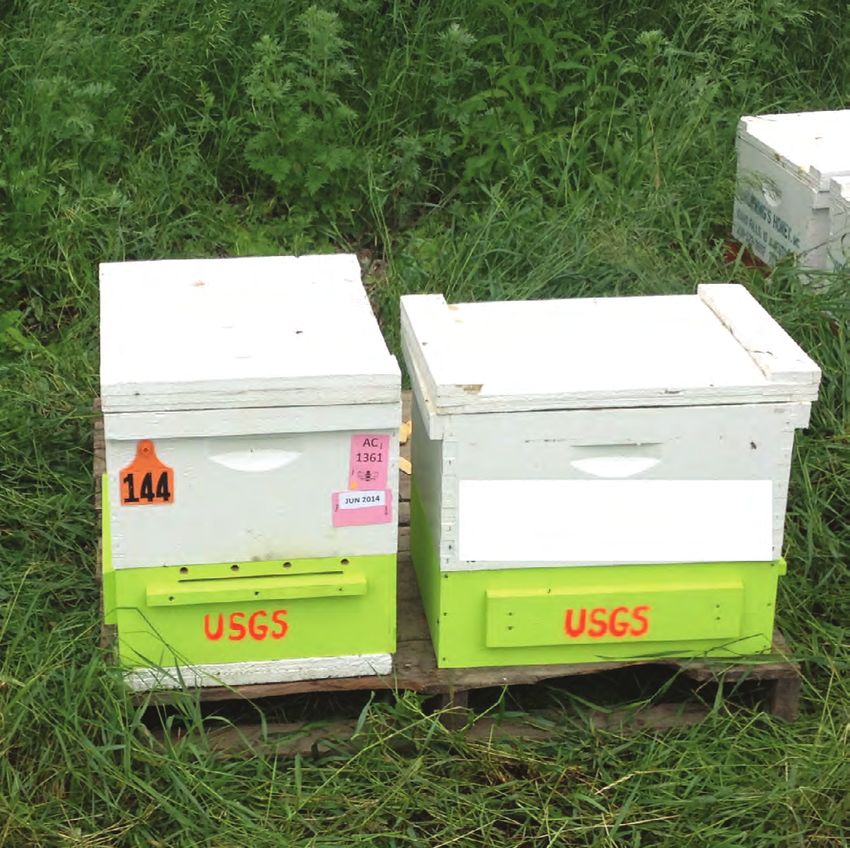
6. Photograph showing two honey bee colonies fitted with pollen traps�����������������������������10
7. Photograph showing a sample of bee pollen collected from a pollen trap before
homogenization���������������������������������������������������������������������������������������������������������������������������11
8. Graph showing the operational taxonomic units detected in 1,295 samples of
bee-collected pollen from North Dakota, South Dakota, and Minnesota from
2015 and 2016�������������������������������������������������������������������������������������������������������������������������������12
9. Graph showing the top 40 most commonly detected plant genera and species
across all dates for pollen samples collected from North Dakota apiaries in 2016��������14
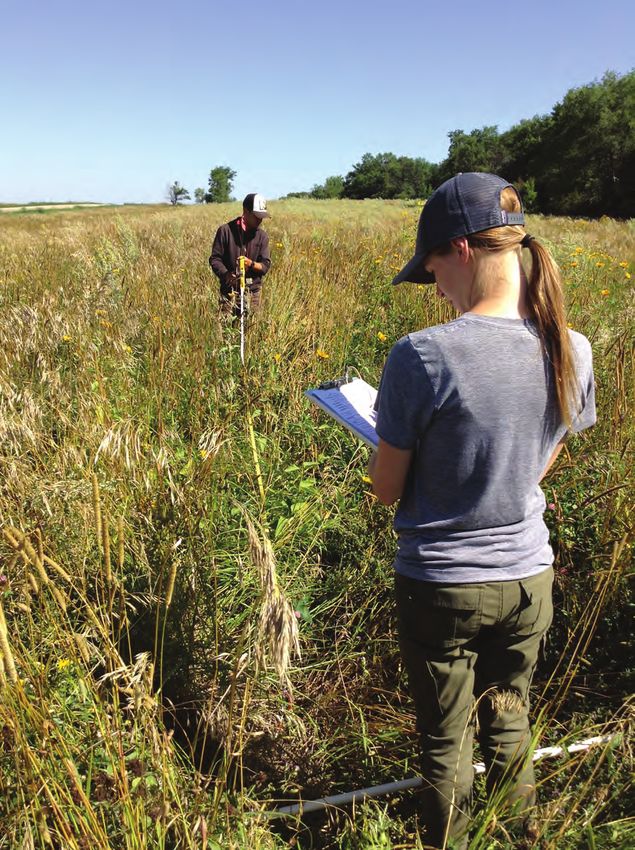
10. Photograph showing U.S. Geological Survey technicians conducting plant
and bee surveys on a field enrolled in the Environmental Quality Incentives
Program in 2017���������������������������������������������������������������������������������������������������������������������������16
11. Graph showing the top flowering plants observed blooming among all transects
on Environmental Quality Incentives Program fields, from June through
September, 2015–17��������������������������������������������������������������������������������������������������������������������18
12. Graphs showing the mean flowering stems per transect sampling event among
Conservation Reserve Program practices across the growing season, 2015–17�����������19
13. Graphs showing the flowering plant species richness per transect among
Conservation Reserve Program practices across the growing season, 2015–17�����������20
14. Graphs showing the number of honey bees observed per transect among
Conservation Reserve Program practices across the growing season, 2015–17�����������21
15. Graph showing the flowering plants with observed honey bee visitation among
all transects conducted on Conservation Reserve Program land, 2015–17���������������������22
16. Graph showing the wild bee flower visitations among all transects conducted
on Conservation Reserve Program land, 2016–17�����������������������������������������������������������������23
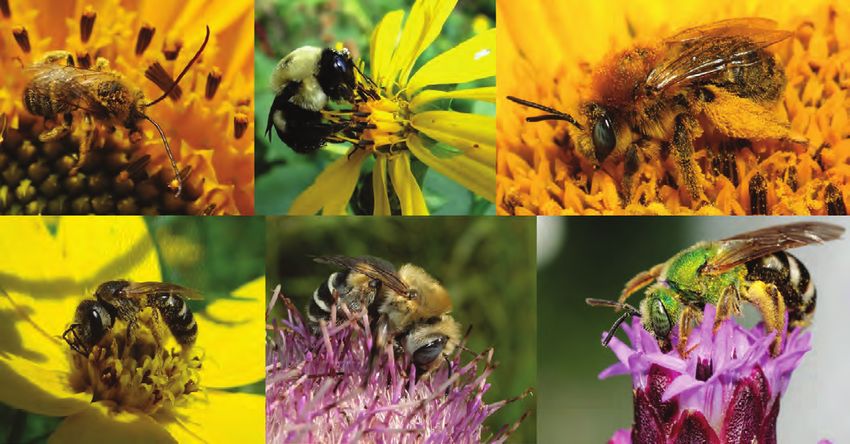
17. Photographs showing select wild bee species detected on private lands
enrolled in the Conservation Reserve Program from 2016 to 2017�������������������������������������24
18. Diagram showing wild bee and host-plant interaction networks for private
lands enrolled in the Conservation Reserve Program in North Dakota, South
Dakota, and Minnesota, 2016–17���������������������������������������������������������������������������������������������25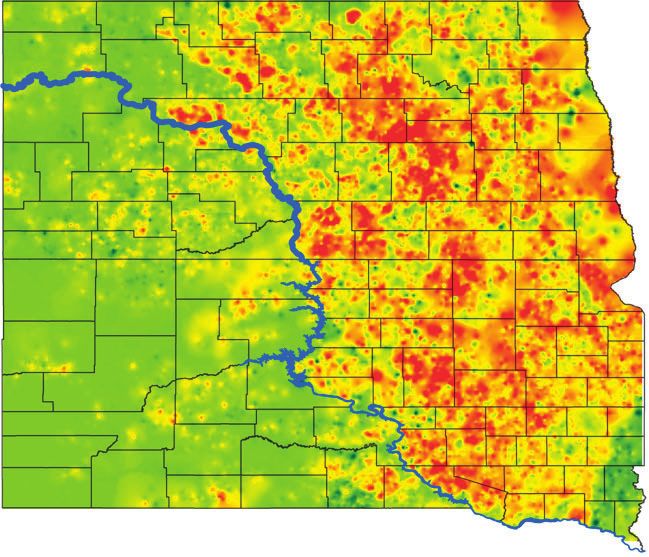
vii

   19.   Graph showing the top flowering plants observed blooming among all transects
         conducted on Environmental Quality Incentives Program fields, from June
         through September, 2015–17�����������������������������������������������������������������������������������������������������26
   20.   Graphs showing the mean flowering stems per transect sampling event among
         Environmental Quality Incentives Program practices across the growing
         season, 2015–17��������������������������������������������������������������������������������������������������������������������������27
   21.   Graphs showing the flowering plant species richness per transect among
         Environmental Quality Incentives Program practices across the growing
         season, 2015–17��������������������������������������������������������������������������������������������������������������������������28
   22.   Graphs showing the number of honey bees observed per transect among
         Environmental Quality Incentives Program practices across the growing
         season, 2015–17��������������������������������������������������������������������������������������������������������������������������29
   23.   Graph showing the flowering plants with observed honey bee visitation
         among all transects conducted on Environmental Quality Incentives Program
         lands, 2015–17�����������������������������������������������������������������������������������������������������������������������������30
   24.   Graph showing the flowering plants with observed wild bee visitation among all
         transects conducted on Environmental Quality Incentives Program lands, 2016–17�����32
   25.   Photographs showing select wild bee species detected on private lands
         enrolled in the Environmental Quality Incentives Program from 2016 to 2017�����������������33
   26.   Diagram showing wild bee and host-plant interaction networks for
         U.S. Department of Agriculture Environmental Quality Incentives Program in
         North Dakota, South Dakota, and Minnesota in 2016–17�����������������������������������������������������34
   27.   Photograph showing a bee researcher downloading data from a hive scale�����������������36
   28.   Graph showing the percentage of research apiaries where honey bee colonies
         lost weight during a 24-hour period in North Dakota, South Dakota, and
         Minnesota in 2015–17�����������������������������������������������������������������������������������������������������������������37
   29.   Screenshot showing the U.S. Geological Survey Pollinator Library website������������������42
   30.   Screenshot showing summary graphics provided by the updated version of the
         U.S. Geological Survey Pollinator Library�������������������������������������������������������������������������������43

Tables
    1.   Top-five flowering plant species and genera detected in 1,295 samples of bee
         pollen collected in North Dakota, South Dakota, and Minnesota from 2015
         and 2016����������������������������������������������������������������������������������������������������������������������������������������13
    2.   Wetland plant taxa detected in samples of honey bee-collected pollen from
         North Dakota, South Dakota, and Minnesota, 2015 and 2016���������������������������������������������13
    3.   Number of plant and bee transects performed on private lands enrolled
         in the Conservation Reserve Program in North Dakota, South Dakota, and
         Minnesota, 2015–17��������������������������������������������������������������������������������������������������������������������17
    4.   Flower counts, observed honey bee visits, preference ranking, and seed cost
         of plants detected on transects during the June nectar dearth period����������������������������38
    5.   Flower counts, observed honey bee visits, preference ranking, and seed cost
         of plants on transects during the September nectar dearth period����������������������������������39
viii

       Conversion Factors
       International System of Units to U.S. customary units

                Multiply                  By                   To obtain
                                       Length
        meter (m)                      3.281         foot (ft)
        kilometer (km)                 0.6214        mile (mi)
        kilometer (km)                 0.5400        mile, nautical (nmi)
        meter (m)                      1.094         yard (yd)
                                        Area
        square meter (m2)              0.0002471 acre
        hectare (ha)                   2.471         acre
        square kilometer (km2) 247.1                 acre
        square meter   (m2)          10.76           square foot (ft2)
        hectare (ha)                   0.003861      square mile (mi2)
        square kilometer   (km2)       0.3861        square mile (mi2)
                                        Mass
        kilogram (kg)                  2.205         pound avoirdupois (lb)

       Temperature in degrees Celsius (°C) may be converted to degrees Fahrenheit (°F) as follows:
                                                      °F = (1.8 × °C) + 32.

       Supplemental Information
       Some areas are supplemented with or given in acres because the U.S. Department of
       Agriculture often uses acres and pounds of pure live seed (PLS) as the primary units
       of measure.
ix
Abbreviations
CP–42 Conservation Practice 42, “Pollinator Habitat”
CRP Conservation Reserve Program
DNA deoxyribonucleic acid
EQIP Environmental Quality Incentives Program
EQIP–327 Environmental Quality Incentives Program conservation practice,
“327-Conservation Cover”
EQIP–512 Environmental Quality Incentives Program conservation practice, “512-Forage and
Biomass Planting”
EQIP–550 Environmental Quality Incentives Program conservation practice, “550-Range
Planting”
FSA Farm Service Agency
> greater than
< less than
NASS National Agricultural Statistics Service
NPWRC Northern Prairie Wildlife Research Center
NRCS Natural Resources Conservation Service
OTU operational taxonomic unit
PLS pure live seed
USDA U.S. Department of Agriculture
USGS U.S. Geological SurveyForage and Habitat for Pollinators in the Northern Great
Plains—Implications for U.S. Department of Agriculture
Conservation Programs
By Clint R.V. Otto,1 Autumn Smart,1,2 Robert S. Cornman,1 Michael Simanonok,1 and Deborah D. Iwanowicz1
Reserve Program and Environmental Quality Incentives
Abstract Program. In general, we found significant variability in floral
resources and pollinator utilization across USDA programs
Managed and wild pollinators are critical components and practices. On average, greater than 75 percent of honey
of agricultural and natural systems. Despite the well-known bee flower observations on private lands enrolled in a USDA
value of insect pollinators to U.S. agriculture, Apis mellifera conservation program were on non-native forbs, whereas
(Linnaeus, 1758; honey bees) and wild bees currently face 33 percent of wild bee flower observations were on non-native
numerous stressors that have resulted in declining health. forbs. Melilotus officinalis and Medicago sativa were the
These declines have engendered support for pollinator most visited by honey bees, wherease Medicago sativa and
conservation efforts across all levels of government, Helianthus maximiliani were the most visited by wild bees.
private businesses, and nongovernmental organizations. In Our analysis of nectar dearth periods in June and September
2014, the U.S. Department of Agriculture (USDA) and the for honey bees revealed that although Melilotus officinalis and
U.S. Geological Survey initiated an interagency agreement Medicago sativa were highly visited, less common native forb
to evaluate honey bee forage across multiple States in the species such as Ratibida columnifera, Agastache foeniculum,
northern Great Plains and upper Midwest. The long-term goal and Gaillardia aristata were preferred species. However,
of this study was to provide an empirical evaluation of floral these preferred species were relatively rare on the landscape
resources used by honey bees, and the relative contribution and are, therefore, unlikely to make up a sizable part of the
of multiple land covers and USDA conservation programs honey bee diet. In addition to our empirical results, we also
to bee health and productivity. Our multi-State analysis of showcase how the U.S. Geological Survey Pollinator Library,
land-use change from 2006 to 2016 revealed loss of grassland a decision-support tool for natural resource managers, can be
and increases in corn and soybean area in North and South used to design cost-effective seeding mixes for pollinators.
Dakota, representing a significant loss of bee-friendly land Collectively, the results of this research will assist USDA
covers in areas that support the highest density of summer
with maximizing the ecological impact and cost-effectiveness
bee yards in the entire United States. Our landscape models of their conservation programs on pollinators in the northern
demonstrate the importance of the Conservation Reserve
Great Plains.
Program in providing safe locations for beekeepers to keep
honey bees during the summer and highlights how land
use in the northern Great Plains has a lasting effect on the
health of honey bee colonies during almond pollination the Introduction
subsequent spring. Our multiseason, multi-State genetic
analysis of honey bee-collected pollen revealed Melilotus spp., European Apis mellifera (Linnaeus, 1758; honey bees)
Asteraceae, Trifolium spp., Fabaceae, Sonchus arvensis, and wild bees (that is, undomesticated, native bees) support
Symphyotrichum cordifolium, and Solidago spp. were the top agriculture and ecosystem function throughout the United
taxa detected; Melilotus spp. represented 42 percent of all States. Globally, insects pollinate 85 percent of all flowering
detected taxa. Symphyotrichum cordifolium, Solidago spp., plants (Ollerton and others, 2011). Insect pollination services
and Grindelia spp. were the top native forbs detected in in the United States are valued at $15 billion, annually
honey bee-collected pollen. We also conducted plant and (Calderone, 2012). Honey bees provide most of the U.S. crop
bee surveys on private lands enrolled in the Conservation pollination needs, a service valued at $12 billion, annually.
Annual losses of honey bee colonies of 30 percent or higher
have been consistently reported by U.S. beekeepers over
1U.S. Geological Survey. the past decade (for example, vanEngelsdorp and others,
2University of Nebraska-Lincoln. 2012, Spleen and others, 2013; Kulhanek and others, 2017).2 Forage and Habitat for Pollinators in the Northern Great Plains
Concurrent with elevated honey bee losses, emerging evidence an empirical evaluation of floral resources used by honey bees
suggest wild bee fauna are in jeopardy as well (Cameron and of the relative contribution of multiple land covers and
and others, 2011; Koh and others, 2016). Wild bees facilitate USDA conservation programs to bee health and productivity.
essential pollination of numerous crops and native wildflowers Although our USGS team collected data on multiple land-use
(Ollerton and others, 2011; Calderone, 2012). Declining bee types as part of our research project, the primary focus for this
populations place considerable strain on food security and report is the FSA’s Conservation Reserve Program (CRP) and
the U.S. beekeeping industry (Spivak and others, 2011). It NRCS’s Environmental Quality Incentives Program (EQIP).
is widely accepted that bee losses or declines do not have The scope of this research necessitated interdisciplinary
a single cause; however, plausible causal factors include collaboration and an integrated science approach. In 2014, our
parasites and diseases, pesticide exposure, and the interacting team of USGS scientists developed and modified monitoring
effects of land-use change, land conversion, and bee forage protocols for a regional pollinator assessment to be done from
loss (Goulson and others, 2015; Hellerstein and others, 2017; 2015 to 2017. Upon completion of the pilot study in 2014,
Spivak and others, 2017). USGS started a three-State research project to quantify bee
Loss of bee forage and land-use change, driven by forage and pollen diets. This report describes the status of
the expansion of commodity crop production, has been of the honey bee forage research by the USGS Northern Prairie
particular concern in the northern Great Plains region of Wildlife Research Center (NPWRC) under interagency
the United States where 30–40 percent of the commercially agreements 16IAMRECRPHBTA1 (FSA) and 673A7514178
pollinating national pool of honey bee colonies reside (NRCS). This final report highlights several key research areas
throughout the growing season, from June through October from May 2015 to September 2018 including the following:
(U.S. Department of Agriculture, National Agricultural 1. Bee health and productivity in relation to land use.
Statistics Service [USDA, NASS], 2017). Beekeepers have (See the “Landscape Suitability for Supporting Honey
transported their honey bee colonies to this region during the Bees,” “Honey Bee and Land-Use Pilot Study,” and
summer to not only make a honey crop, valued at $343 million “Land-Use Effects on Honey Bee Colony Health and
(USDA, NASS, 2017), but also to bolster the health of their Services” sections.)
colonies so they can survive the overwintering period and
the stresses associated with the migratory pollination circuit. 2. Pollen deoxyribonucleic acid (DNA)—What pollen
During the growing season in the northern Great Plains, do honey bees collect? (See the “Genetic Analysis
honey bees forage on nectar and pollen resources available of Bee-Collected Pollen Across the Northern Great
in the landscape; this foraging facilitates colony growth and Plains” section.)
productivity as well as sets the stage for overwintering success
and crop pollination the subsequent spring (Gallant and others, 3. Plant-pollinator interactions on private lands enrolled
2014; Durant, 2019). However, increasing acreages of row in the CRP and EQIP. (See the “Plant-Pollinator
crops, such as corn and soybeans, across the region over the Interactions on Private Lands Enrolled in the
past two decades have decreased the area of land suitable Conservation Reserve Program or Environmental
for supporting managed honey bee colonies (Hellerstein and Quality Incentives Program” section.)
others, 2017; Durant and Otto, 2019) and wild bees (Koh 4. Bee-flower interactions, resource availability, and
and others, 2016). As a result, core beekeeping areas in the honey bee floral preference. (See the “Floral Resource
northern Great Plains have substantially shifted toward land Limitations and Honey Bee Preference” section.)
use unfavorable for supporting managed honey bees and wild
pollinators alike (Evans and others, 2018). 5. The USGS Pollinator Library—A decision support tool
In response to concerns about declining pollinators for natural resource managers. (See the “The Pollinator
and bee forage loss, the USDA began a concerted effort to Library—A Decision-Support Tool for Enhancing
improve floral resource conditions in working landscapes. Pollinator Habitat” section.)
Within specific programs, the USDA also launched a series of We discuss the status of each core research area
practices and initiatives to bolster bee habitat, with a primary and highlight the relevance of USGS research to USDA
focus in the northern Great Plains and upper Midwestern program delivery. We also discuss opportunities for future
States. These practices and initiatives incentivized landowners investigations to improve conservation delivery of USDA
to enhance private lands in agricultural areas for pollinators. programs. Several of the deliverables established in the
In 2014, the USDA (Farm Service Agency [FSA] and Natural original USGS–USDA interagency agreement have already
Resources Conservation Service [NRCS]) and U.S. Geological been reported in peer-reviewed publications. For deliverables
Survey (USGS) initiated a co-funded, interagency agreement already published, we provide an executive summary of the
to evaluate USDA conservation programs and collect publication in this report and briefly discuss its relevance to
biological data needed for the USDA to improve forage for the USDA. Data figures from previous publications have been
honey bees and other pollinators throughout the northern reprinted in this report, with permission from the publishers.
Great Plains. The long-term goal of this study was to provideLandscape Suitability for Supporting Honey Bees 3
Landscape Suitability for Supporting probability of a site being used as a commercial apiary was
positively related to the area of grassland, alfalfa, wetland,
Honey Bees and CRP. Our models indicated that commercial beekeepers
favor CRP land when selecting locations to keep their honey
Loss of bee forage and habitat has been implicated bee colonies. For example, commercial beekeepers were
in pollinator declines (Goulson and others, 2015). Loss of 95 percent more likely to use apiary sites with >500 ha
forage lands for honey bees is of primary concern in the (1,235 acres) of CRP land surrounding them compared to sites
northern Great Plains, a region that supports about 40 percent with no CRP land nearby.
all U.S. honey bee colonies during the summer (Hellerstein We ran a series of landscape simulations to determine
and others, 2017). For the initial phase of our research, we how alterations to the CRP national acreage cap would affect
conducted multiple analyses to determine how land use and landscape suitability for supporting apiaries in the Dakotas
land-use change in the northern Great Plains affects landscape (Otto and others, 2018). Our models indicated that reducing
suitability for supporting commercial apiaries. the CRP cap to 19 M acres would reduce the number of
apiaries in the Dakotas that meet key bee forage criteria by
28 percent. However, increasing the national cap to 37 M
Methods and Results acres would increase the number of apiaries that met key bee
forage criteria by 155 percent. The benefits of the CRP can be
This work (Otto and others, 2016, 2018) has been
extended further by strategically locating USDA conservation
published in peer-reviewed journals, and below we provide
covers in areas of high apiary density.
an executive summary of the published work. Our research
to date has shown that predominant land-use trends over
the past decade in the northern Great Plains have shifted Relevance to the U.S. Department of Agriculture
decidedly toward intensive row crop production in parts
of the northern Great Plains that also contain a significant This represents the first regional assessment of how
presence of commercial beekeeping operators. In Otto and land-use change affects landscape suitability for managed
others (2016) we quantified changes in row crop and grassland honey bees. Although we were unable to incorporate EQIP
which totaled 18,363 registered apiary locations in North and enrollments in our analysis, our research suggested CRP lands
South Dakota between 2006 and 2014. We then developed were favored by beekeepers when selecting apiary locations.
beekeeper “habitat selection models” to identify land-cover Similar to past work that highlights the benefits of the CRP
and land-use features that affected beekeeper sites selection to waterfowl (Reynolds and others, 2001) and upland birds
in areas experiencing substantial land-use change (Otto and (Johnson and Igl, 1995), our pollinator research demonstrates
others, 2016). Our analysis indicated that corn and soybeans the importance of the CRP to managed honey bees and the
near registered apiaries in North Dakota and South Dakota commercial beekeeping industry. Our research indicated
(fig. 1) increased 1.2 million (M) hectares (ha; 3M acres). beekeepers were more likely to select an area to keep honey
This amounts to an increase of 9 ha (22.2 acres) of corn and bees if USDA conservation covers were present in the local
soybeans per apiary, annually. In general, the frontier of landscape. This is important considering that our research
corn and soybeans expanded west and northward across the has also revealed a pressing need for pollinator-friendly land
study region, into areas that support the highest density of covers in areas of high apiary density in the central parts of
registered apiaries. North Dakota and South Dakota. The models we developed
Concurrent with the increases in corn and soybeans, can be used by USDA to prioritize areas in the northern
we determined that CRP areas near registered apiaries Great Plains for conservation delivery for a variety of USDA
systematically decreased from 2006 to 2016 (Otto and others, programs. For example, figure 1 shows the counties in North
2018). The area of the Dakotas experiencing the highest rate Dakota and South Dakota that support the highest number
of land-use change was within the Prairie Pothole Region, of honey bee apiaries and that have also undergone the
which also contained the greatest number of registered highest rates of land-use change. Our models suggest these
apiaries. Average annual gains in corn and soybean area would be the most cost-effective areas to target for future
were four times greater among apiaries in the Prairie Pothole conservation plantings to support honey bees. By establishing
Region compared to apiaries west or south of the Missouri conservation covers in these areas, the USDA maximizes
River. Of the apiaries that had a high annual increase in corn the chance of providing forage for multiple apiaries, thereby
and soybeans (greater than [>] 30 ha), 98 percent were in the benefiting multiple beekeepers and their honey bees.
Prairie Pothole Region. Likewise, of the apiaries that had The cost-effectiveness of USDA conservation programs
a substantial annual decrease in grasslands (>10 ha loss), can be improved by focusing funding for conservation
81 percent were in the Prairie Pothole Region. Our beekeeper programs in areas that have undergone the greatest loss in
“habitat selection models” estimated the probability of a site pollinator-friendly land covers and support the highest density
being used as a commercial apiary was negatively related to of registered apiaries.
the area of row crops in the local landscape. Conversely, the4 Forage and Habitat for Pollinators in the Northern Great Plains
4 6 5 10 13 7 2
7
3 3 5
7 8 11 9
4
8 3
2 3
13 9 6
4 3 6 3 0
10
10
3 3 14 13 11 6 1
7 6
4 8 8 8 5
7 6 3
5 8 1 6 5 4
2 5 4 5
1 4 4
3 4 3 5
3 2 3 5
1 2 6
2 6
4 5 6
3 2 4
2 2 2 6 5 6
3
2 4 3 6 8 7 3 2
4
2 3 7 4 5 5 6 4
3
0 6 5 4 4 4
2 2 2 6 7 5 4 3 3
EXPLANATION
[The value within each county boundary represents
the average number of registered apiaries per
10,000 hectares]
Annual rate of change in corn and soybean area from 2006 to 2014
Decrease Increase
Figure 1. Annual rate of change in the corn and soybean area around 18,363 honey bee
apiaries from 2006 to 2014, North and South Dakota. Modified from Otto and others (2016); used
with permission.
Honey Bee and Land-Use Pilot Study Methods and Results
In the previous section we highlighted how recent In this section we provide an executive summary of
land-cover trends have affected landscape suitability for the 2014 pilot study that was published by Smart and others
supporting commercial apiaries. The studies referenced above (2017a). For the pilot study, biweekly pollen samples were
were based on geographic information system analyses and screened for 23 common insecticides, herbicides, fungicides,
remotely sensed data. Field studies in the northern Great and metabolites. Five insecticides in three classes (pyrethroid,
Plains are needed to better understand how honey bee health organophosphate, and neonicotinoid), eight fungicides, and
is affected by the land cover surrounding the colonies. In five herbicides comprised 63, 30, and 6 percent, respectively,
2014, the USDA requested that NPWRC develop a pilot study of the pesticide residues detected in honey bee-collected
to develop sampling methods for investigating land-cover pollen over the growing season. Neonicotinoids (clothianidin,
associations with bee health, forage, and nutrition. We imidacloprid, thiamethoxam) were detected only between
published the results of this pilot study (Smart and others, May and early July, whereas chlorpyrifos, an organophosphate
2017a) and used them to develop a three-State assessment insecticide, was detected in early July through mid-September.
of honey bee colonies across a distribution of row crop and Herbicides were detected in May through early July, and
grassland land covers in 2016 and 2017. In the pilot study we fungicides were detected in early July through early August.
also report on baseline pesticide exposure levels of honey bees These data provide a preliminary investigation into pesticide
throughout a growing season. This pesticide exposure analysis exposure profiles for honey bee colonies in the northern Great
fulfilled multiple deliverables established by the NRCS in the Plains. Additional details on pesticides detected in honey
2014 interagency agreement (673A7514178). bee-collected pollen are provided in Smart and others (2017a).Land-Use Effects on Honey Bee Colony Health and Services 5
Land-Use Effects on Honey Bee Colony slower rate throughout the growing season (fig. 4). Colonies
of a smaller population size in the autumn were also smaller
Health and Services for almond pollination the following spring (fig. 5); thus, the
beekeeper had a reduced per-colony rental fee for pollination
Results from the pilot study (Smart and others, 2017a) services and reduced potential for splitting large colonies. For
were used to inform the design of a three-state research example, we determined that apiaries in grassland landscapes
project. While the goals of this project were multi-faceted, generated $4,100 in additional revenue in colony splits and
one of our principle objectives was to investigate how land pollination service payments compared to those situated in
use affects honey bee colony size and pollination services row crop landscapes. This paper highlighted the downstream
elsewhere in the country. By quantifying how summer habitat effects of factors driving land-use decisions in the northern
in the northern Great Plains affects colony population size, Great Plains on the ability of beekeepers to grow robust
which in-turn affects beekeeper economics, we were able to honey bee colonies and support the pollination industry at a
quantify spatial subsidies—how different regions provide national scale.
ecosystem service values across the migratory range of a
species (Bagstad and others, 2019). Typically, the concept
of spatial subsidies has been applied to naturally migrating Relevance to the U.S. Department of Agriculture
species such as waterfowl (Bagstad and others, 2019), but here
Our colony health work shows the direct linkages
we extended this concept further to the migratory honey bee
between land cover in the northern Great Plains, bee health,
industry. We published the result of our three-State land-use
and pollination services rendered elsewhere in the United
assessment project in 2018 and provide an executive summary
States. Thus, almond growers and beekeepers in California
of the results in this section.
are partly subsidized by grasslands and USDA conservation
plantings in the northern Great Plains because these lands
Methods help to produce more robust honey bee colonies. Grassland
conservation programs can have a positive effect on honey bee
In Smart and others (2018) we selected 36 apiary colony health, which in turn benefits agricultural producers
locations across a grassland to row crop landscape gradient in outside the northern Great Plains.
North Dakota, South Dakota, and Minnesota (fig. 2). In 2015
and 2016 we did spring and fall colony health assessments at
each research apiary (fig. 3) to determine how within-season Future Work
colony growth was affected by land use surrounding the
Our published work demonstrated the linkage between
research apiaries. We also marked individual colonies and
grassland habitat and honey bee colony health. However, the
assessed their population size in California almond orchards
mechanism by which grasslands, and the forbs that bloom
the subsequent spring. Our hypothesis was that honey bee
there, confer nutrition to honey bee colonies is still unclear.
colonies in grassland landscapes would grow larger or more
Ongoing work by the USGS is investigating the physiological
rapidly during the summer and be larger during almond crop
mechanisms by which grasslands and other bee-friendly land
pollination the subsequent spring. In turn, larger colonies
covers affect worker bee nutritional physiology including
grown in grassland landscapes would generate additional
glycogen, total sugar, lipids, and protein levels in bees across
revenue for beekeepers through increased pollination service
the row crop agriculture to grassland gradient. Using these
payments and colony splits (that is, beekeepers separating a
nutritional biomarkers to infer land-use quality and predict
large colony into two small colonies).
colony population size will improve our understanding
of how honey bee colonies respond to changing land-use
Results conditions and allow us to better quantify the effect of USDA
conservation covers on honey bee colony health. Smart and
In Smart and others (2018) we demonstrated that a others (2019) provides valuable insight into how grasslands
greater presence of non-bee friendly agricultural crops (corn, confer nutrition to individual worker bees and how the
soy, and small grains) around apiaries in North Dakota, South improved health of individual bees culminates in improved
Dakota, and Minnesota resulted in colonies that grew at a colony health.6 Forage and Habitat for Pollinators in the Northern Great Plains
0 25 50 KILOMETERS
EXPLANATION
[Agriculture land use includes
corn, soybeans, and small grains.
Apiaries are at the center of each
red circle]
Study region
Land use
Agriculture
Bee crops
Grassland
Wetland
Open Water
Forest
0 2 4 KILOMETERS
Other
Figure 2. Study region land use in 2015–16; locations of apiaries in North Dakota, South Dakota, and Minnesota; and two example North Dakota apiaries.
Modified from Smart and others (2018); used with permission.Land-Use Effects on Honey Bee Colony Health and Services 7 Figure 3. U.S. Geological Survey biologist doing health assessments on a honey bee colony in South Dakota, 2016. Photograph by Sarah Scott, U.S. Geological Survey. rol20-0028_fig03
8   Forage and Habitat for Pollinators in the Northern Great Plains

                                                                 A                                                                   B
                                                           5.0                                                                5.0

                  Change in colony size, June−September
                                                           2.5                                                                2.5

                                                            0                                                                    0

                                                          −2.5                                                               −2.5

                                                          −5.0                                                               −5.0

                                                          −7.5                                                               −7.5
                                                                 0        1,000      2,000     3,000       4,000                     0         1,000     2,000     3,000   4,000
                                                                     Area agriculture (corn, soybeans, and                                       Area grass, in hectare
                                                                           small grains), in hectare

                                                                                                                EXPLANATION
                                                                                                       [Change in colony size was defined
                                                                                                       as the difference in adult population
                                                                                                       size (frames of bees) from June to
                                                                                                       September]

                                                                                                               95-percent confidence interval

                                                                                                               Regression line

                                                                                                               Apiary site

Figure 4. Relation between the area of, A, agriculture (corn, soybeans, and small grains) and, B, grassland and the colony population
change during the growing season in North Dakota, South Dakota, and Minnesota in 2015–16. Modified from Smart and others (2018);
used with permission.
Genetic Analysis of Bee-Collected Pollen Across the Northern Great Plains 9
15 specificity. In 2014, as part of an initial deliverable to USDA,
the USGS developed a high-throughput genetic barcoding
strategy to identify samples of bee-collected pollen (Cornman
and others, 2015). The techniques we developed provided us
with sufficient precision and taxonomic recovery to quantify
Mean frames of bees in almonds
pollen foraging patterns of individual honey bee colonies
10
throughout the growing season and to relate foraging patterns
to land cover surrounding the colonies (Smart and others,
2017b). Smart and others (2017b) determined Melilotus spp.,
Sonchus spp., Brassica spp., Grindelia spp., Helianthus spp.,
and Solidago spp., represented 62 percent of the bee pollen
5 collected by honey bees from six apiaries in North Dakota in
2010 and 2011. Genera containing plant species native to the
region, Amorpha spp., Alisma spp., Anemone spp., Dalea spp.,
and Monarda spp. represented 12 percent of bee-collected
pollen. In 2015, we expanded the scope of our pollen genetic
0
analysis to encompass North Dakota, South Dakota, and
0 1,000 2,000 3,000 4,000 Minnesota because the USDA had targeted those States
Area agriculture, (corn, soybeans, and for pollinator forage enhancement efforts. We highlight the
small grains), in hectare methods and results of this expanded work in the following
EXPLANATION “Methods” and “Results” sections.
[Change in colony size was defined
as the difference in adult population
size (frames of bees) from June to
September] Methods
We partnered with commercial beekeepers in the northern
95-percent confidence interval
Great Plains to collect samples of bee-collected pollen
Regression line from 36 apiaries across our study region (fig. 3). Smart and
Apiary site
others (2018) provided a complete list of apiaries included
in this study. From early June to mid-September our teams
Figure 5. Relation between the area of agriculture (corn, activated pollen traps (fig. 6) within each apiary every other
soybeans, and small grains) surrounding honey bee colonies week to collect pollen from foraging honey bees during a
in the summer and the sizes of those colonies during almond 72-hour period.
pollination in California the subsequent spring. Modified from Pollen samples were stored in a freezer at −20 degrees
Smart and others (2018); used with permission. Celsius before analysis. A subsample of pollen was dried
and homogenized to prepare for genetic sequencing (fig. 7).
Methodology for extracting, amplifying, and sequencing
Genetic Analysis of Bee-Collected pollen DNA are provided in Cornman and others (2015)
and Smart and others (2017b). DNA extraction was carried
Pollen Across the Northern out at USGS Leetown Science Center, Kearneysville, West
Great Plains Virginia. Operational taxonomic unit (OTU) reads were given
assignments based on taxonomic reference sequences in
Quantifying pollen diets of honey bees is important for the National Center for Biotechnology Information (NCBI,
improving bee nutrition and designing pollinator friendly https://www.ncbi.nlm.nih.gov/) database. The OTUs can
seeding mixes (Kleijn and Raemakers, 2008). Taxonomic be interpreted as a relative measure of the abundance of a
identification of bee-collected pollen allows researchers to particular plant DNA signature in a sample of bee-collected
quantify honey bee floral resource use across landscapes. pollen. We report taxonomic assignments for the most
Honey bee workers can fly as far as about 10 kilometers, commonly detected plant taxa across North Dakota, South
covering a 314 square kilometer area, in search of flowering Dakota, and Minnesota for 2015 and 2016. We also provide
plants harboring pollen and nectar (Seeley, 1995). Foraging State-specific forage calendars that show what pollen bees
honey bees, therefore, serve as useful data collectors for were collecting on a biweekly basis. We also considered an
quantifying and characterizing available floral resources on the analysis where all OTUs were pooled at the genus or familial
landscape. Quantifying bee forage at large scales has proven level; however, the results did not appreciably change, so we
challenging because taxonomic identification of bee-collected report results at the species, genus, or familial level (that is,
pollen has historically required highly specialized skill in lowest achieved taxonomic level). Data for this section are
light microscopy, takes considerable time, and may lack publicly available in Otto and others (2020a).10 Forage and Habitat for Pollinators in the Northern Great Plains Figure 6. Two honey bee colonies fitted with pollen traps. Photograph by Clint Otto, U.S. Geological Survey. rol20-0028_fig06
Genetic Analysis of Bee-Collected Pollen Across the Northern Great Plains   11

                                                                   spp., Taraxacum spp., and Hesperis spp.) plant pollen (fig. 9).
                                                                   Mid-season pollen consisted mostly of plants in Fabaceae (for
                                                                   example, Melilotus spp., and Trifolium spp.) and Brassicaceae
                                                                   (for example, Brassica spp.). During the late season,
                                                                   honey bees collected pollen from multiple asters including
                                                                   Sonchus arvensis, Symphyotrichum spp. and Solidago spp.
                                                                   Medicago sativa (alfalfa), an important nectar plant, made up
                                                                   just 0.001 percent of all OTU reads. Notable wetland plants
                                                                   detected in our analysis are listed in table 2.

                                                                   Relevance to the U.S. Department of Agriculture
                                                                         Pollen is the essential source of protein, lipids, vitamins,
                                                                   and minerals for bees; thus, including flowers in seed mixes
Figure 7. Sample of bee pollen collected from a pollen             that honey bees use as pollen sources supports honey bee
trap before homogenization. Photograph by James Weaver,            health, brood production, and immune system function. Our
U.S. Geological Survey.                                            multi-State, multi-season analysis of bee-collected pollen
                                                                   provides the USDA with a suite of potential plants that could
                                                                   be included in seed mixes to provide honey bees access to
Results                                                            pollen. Although most pollen collected by honey bees was
                                                                   from non-native plant species, we also detected numerous
      We analyzed 1,295 samples of bee-collected pollen,           native plant species and genera. Beekeepers have long sought
from early June to mid-September during 2015 and 2016.             patches of clover for honey production; our analysis shows
We detected 342 different plant taxa, including 148 unique         that Melilotus spp. and Trifolium spp. are also important
plant species (appendix 1). More than 64 percent of the            providers of pollen to honey bees. Although it is widely known
OTUs detected belonged to Melilotus spp., Asteraceae,              that Medicago sativa (alfalfa) is an important nectar plant
Trifolium spp., Fabaceae, Sonchus arvensis, Symphyotrichum         for honey bees, our genetic analysis indicates honey bees are
cordifolium, and Solidago spp. (fig. 8).                           reluctant collectors of M. sativa pollen. Thus, large plantings
      Melilotus spp. was the most commonly detected plant          of alfalfa may contribute to honey production within a colony
taxon across all States and years (42.6 percent of total OTUs).    but do little to support brood production without supplemental
Asteraceae constituted more than 5.0 percent of the OTUs           pollen from other sources. Conservation plantings where
detected in our analysis, but we were unable to achieve            alfalfa is the dominate forage plant for honey bees may not
species or genus resolution for these reads. Melilotus spp. was    provide bees with nutritious pollen for brood production.
consistently the top taxon across all States and years; however,         Based on data reported here, and by Smart and others
we did observe State and year differences across other top taxa    (2017b), it seems wetland plants serve as an understudied
(table 1). Although table 1 shows the most commonly detected       source of pollen for honey bee colonies. Honey bee and
plant taxa, it is important to note these taxa constituted         wetland plant associations unsurprisingly have not been
60–90 percent of the total OTUs detected; numerous other           reported because field researchers studying plant-pollinator
taxa constituted the remaining 10–40 percent OTU reads             interactions are more likely to sample foraging bees in
(appendix 1). Caution should be used when interpreting data        upland habitat than in wetlands. Indeed, all plant-pollinator
for taxa with exceptionally low OTU counts (less than [50 but stress the focus of these results    Science demonstrating the value of wetlands to pollinators
should be on commonly detected taxa.                               is limited; however, emerging science suggests these areas
      Across all States, the top-ranking, native forb genera       provide important forage for honey bees (Gallant and others,
and species included Symphyotrichum cordifolium (blue              2014; Otto and others, 2016) and nesting and forage resources
wood-aster), Solidago spp. (goldenrod), and Grindelia spp.         for native bees (Vickruck and others, 2019). Our pollen
(gumweed). Honey bee pollen collection changed considerably        analysis suggests conservation programs that protect or restore
throughout the growing season (fig. 9; appendix 1). From           wetlands in the Prairie Pothole Region will provide forage
June to mid-July, honey bees in North Dakota collected a           lands for honey bees. Enhancing the value of wetlands to
variety of woody (for example, Salix spp., Elaeagnus spp., and     pollinators can be achieved through management activities
Acer spp.), wetland (for example, Anemone canadensis and           that increased forb abundance within terrestrial buffers and
Sparganium eurycarpum), and upland (for example, Melilotus         even within the wetlands themselves.

 rol20-0028_fig07
12 Forage and Habitat for Pollinators in the Northern Great Plains
Caprifoliaceae
Lithospermum spp.
Poaceae
Alopecurus aequalis
Carduus acanthoides
Hydrophyllum tenuipes
Glycine spp.
Rhamnus spp.
Raphanus sativus
Brassicaceae
Taraxacum spp.
Helianthus annuus
Grindelia nana
Helianthus spp.
Trifolium hybridum
Alisma spp.
Lotus spp.
Lonicera spp.
Alopecurus spp.
Plant taxa
Hesperis sibirica
Salix spp.
Cirsium arvense
Sparganium eurycarpum
Arctium lappa
Sonchus spp.
Tephroseris spp.
Brassica nigra
Brassica spp.
Ambrosia trifida
Symphyotrichum spp.
Solidago spp.
Anemone canadensis
Grindelia spp.
Artemisia absinthium
Trifolium spp.
Symphyotrichum cordifolium
Sonchus arvensis
Fabaceae
Asteraceae
Melilotus spp.
0 10 20 30 40 50
Percentage of total
Figure 8. Operational taxonomic units detected in 1,295 samples of bee-collected pollen from North Dakota, South Dakota, and
Minnesota from 2015 and 2016.You can also read