Mellor, E. L., Cuthill, I. C., Schwitzer, C., Mason, G. J., & Mendl, M. (2020). Large Lemurs: Ecological, Demographic and Environmental Risk ...
←
→
Page content transcription
If your browser does not render page correctly, please read the page content below
Mellor, E. L., Cuthill, I. C., Schwitzer, C., Mason, G. J., & Mendl, M.
(2020). Large Lemurs: Ecological, Demographic and Environmental
Risk Factors for Weight Gain in Captivity. Animals, 10(8), [1443].
https://doi.org/10.3390/ani10081443

Publisher's PDF, also known as Version of record
License (if available):
CC BY
Link to published version (if available):
10.3390/ani10081443

Link to publication record in Explore Bristol Research
PDF-document

This is the final published version of the article (version of record). It first appeared online via MDPI at
https://www.mdpi.com/2076-2615/10/8/1443 . Please refer to any applicable terms of use of the publisher.

University of Bristol - Explore Bristol Research
General rights

This document is made available in accordance with publisher policies. Please cite only the
published version using the reference above. Full terms of use are available:
http://www.bristol.ac.uk/pure/user-guides/explore-bristol-research/ebr-terms/
animals
Article
Large Lemurs: Ecological, Demographic and
Environmental Risk Factors for Weight Gain
in Captivity
Emma L. Mellor 1, * , Innes C. Cuthill 2 , Christoph Schwitzer 3 , Georgia J. Mason 4 and
Michael Mendl 1
 1   Bristol Veterinary School, University of Bristol, Langford House, Langford, Bristol BS40 5DU, UK;
     mike.mendl@bristol.ac.uk
 2   School of Biological Sciences, University of Bristol, Life Sciences Building, 24 Tyndall Avenue,
     Bristol BS8 1TQ, UK; i.cuthill@bristol.ac.uk
 3   Dublin Zoo, Phoenix Park, Dublin 8, D08 WF88, Ireland; christoph.schwitzer@dublinzoo.ie
 4   Department of Animal Biosciences, University of Guelph, 50 Stone Road East,
     Guelph, ON N1G 2W1, Canada; gmason@uoguelph.ca
 *   Correspondence: em15953@bristol.ac.uk

 Received: 29 June 2020; Accepted: 12 August 2020; Published: 18 August 2020

 Simple Summary: Excessive body mass, i.e., being overweight or obese, is a health concern.
 Some lemur species are prone to extreme weight gain in captivity, yet for others a healthy body
 condition is typical. The first aim of our study was to examine possible ecological explanations for
 these species’ differences in susceptibility to captive weight gain across 13 lemur species. Our second
 aim was to explore demographic and environmental risk factors across individuals from the four
 best-sampled species. We found a potential ecological explanation for susceptibility to captive
 weight gain: being adapted to unpredictable wild food resources. Additionally, we also revealed one
 environmental and four demographic risk factors, e.g., increasing age and, for males, being housed
 with only fixed climbing structures. Our results indicate targeted practical ways to help address
 weight issues in affected animals, e.g., by highlighting at-risk species for whom extra care should be
 taken when designing diets; and by providing a mixture of flexible and fixed climbing structures
 within enclosures.

 Abstract: Excessive body mass, i.e., being overweight or obese, is a health concern associated with
 issues such as reduced fertility and lifespan. Some lemur species are prone to extreme weight gain in
 captivity, yet others are not. To better understand species- and individual-level effects on susceptibility
 to captive weight gain, we use two complementary methods: phylogenetic comparative methods to
 examine ecological explanations for susceptibility to weight gain across species, and epidemiological
 approaches to examine demographic and environment effects within species. Data on body masses
 and living conditions were collected using a survey, yielding useable data on 675 lemurs representing
 13 species from 96 collections worldwide. Data on species-typical wild ecology for comparative
 analyses came from published literature and climate databases. We uncovered one potential
 ecological risk factor: species adapted to greater wild food resource unpredictability tended to
 be more prone to weight gain. Our epidemiological analyses on the four best-sampled species
 revealed four demographic and one environmental risk factors, e.g., for males, being housed with
 only fixed climbing structures. We make practical recommendations to help address weight concerns,
 and describe future research including ways to validate the proxy we used to infer body condition.

 Keywords: obesity; body mass; fat storage; captive primates; animal welfare; zoo animals

Animals 2020, 10, 1443; doi:10.3390/ani10081443                                   www.mdpi.com/journal/animals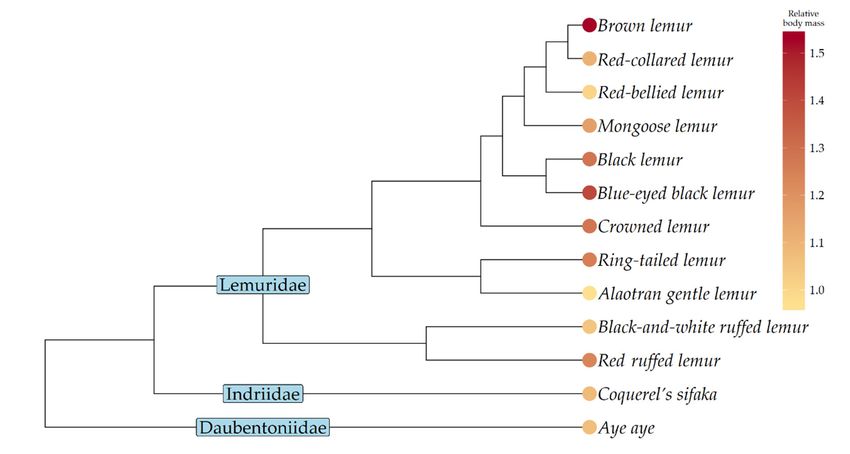
Animals 2020, 10, 1443                                                                                   2 of 32

1. Introduction
      Excessive body mass, i.e., being overweight or obese, is a health concern. Such conditions are
associated with fat-levels that may impair health [1], and problems such as diabetes, heart disease,
impaired reproduction, orthopaedic disorders, and cancers [2–7]. Methods of determining body
condition include weight-for-height (kg/m2 ) indices in humans (“body mass index”: 1) and other
primates (e.g., [8]), skinfold thickness (e.g., [9]), and visual body condition scoring systems (e.g., [10–12]).
Body mass is also used as a proxy for body fat: individuals ≥20–25% over the ideal are considered
obese (e.g., in humans, dogs, Canis lupus familaris, and cats, Felis catus: [7,13]). Positive energy balance,
i.e., calorific intake greater than expenditure, is central to weight gain [13,14] but is not the sole
factor. Energy balance is affected by environmental, e.g., diet and physical activity levels, and genetic
factors [13], e.g., obesity-risk varies between human [15] and non-human animal populations [6,14,16],
and is heritable (e.g., vervet monkeys, Chlorocebus pygerythrus: [17]).
      Lemuriformes (“lemurs”) are a primate infraorder native to Madagascar, and these species vary
in susceptibility to weight gain in captivity. For instance, a healthy body condition is typical of greater
bamboo, Prolemur simus, and red-bellied lemurs, Eulemur rubriventer [18,19]. Conversely, ring-tailed,
Lemur catta, and blue-eyed black lemurs, E. flavifrons, are prone to elevated body masses [18,19], and for
some species problems such as obesity are prevalent. For example, using a weight-based method
of inferring body condition, 46.5% black-and-white ruffed and red ruffed lemurs, Varecia variegata
and V. rubra, housed in European zoos were deemed obese (defined by the authors as ≥two standard
deviations from the wild mean weight: [20]). Similarly, of 902 zoo lemurs from 14 species 54% were
considered overweight or obese (likewise defined as ≥ two and ≥ four standard deviations from
species-typical wild mean weights, respectively: [18]). Furthermore, obesity can hinder breeding
programmes, and obese animals are unsuitable for wild reintroduction [21]—concerning for a taxonomic
group as threatened as lemurs (cf. [22]). Therefore, to improve health and promote conservation,
understanding the basis for some species’ susceptibility to weight gain is fundamental.
      Three aspects of species-typical ecology might explain species differences in susceptibility to weight
gain. The first relates to lemurs’ physiological and behavioural adaptations regarding fat-storage [23],
to buffer against future resource-restriction (i.e., “thrifty genotypes” sensu: [24]). Madagascar has
relatively poor soil quality and plant productivity, with a harsh and unpredictable climate, the severity
of which varies geographically [25]. Rainfall affects plant growth [26,27] and annual rainfall is
commonly used to infer primary productivity and thus food availability [28–30]. Annual rainfall varies
across Madagascar, e.g., northern areas have a very long dry season and the south receives very little
rainfall, unlike eastern areas [31–33]. Additionally, there are regional differences in between-year annual
rainfall, e.g., the north and south are especially variable; hypothesised to explain unpredictable fruit
availability [34]. The frequency and severity of droughts, cyclones and El Niño events also vary across
the island and between years—events which also restrict food resources [25,35–37]. Therefore, while all
lemur species naturally experience relatively poor and unpredictable food resources, this will be more
severe for some than others, according to where they reside on the island. Additionally, captive and
wild food quality likely differ. Commercial fruits especially are more energy- and sugar-rich than
wild equivalents—a mismatch cited in the excessive body masses observed in some captive lemurs
(e.g., [38,39]). In captivity, this mismatch combined with thrifty adaptations to naturally poor and/or
unpredictable food resources might leave certain species susceptible to weight gain.
      The second aspect of species-typical ecology that might explain species variation in captive
weight gain, is arboreality. Ring-tailed lemurs, for instance, are deemed “semi-terrestrial” [40],
aye ayes, Daubentonia madagascariensis, also spend time at ground-level [41], and grey mouse lemurs,
Microcebus murinus, hunt and occasionally nest on the ground [42]. However, other species are arboreal
specialists, such as ruffed lemurs [43], only coming to ground if absolutely required, e.g., to drink [44]
or to retrieve fallen young [45]. Across mammals, including lemurs, terrestrial species carry higher fat
stores than arboreal ones [46]. Arboreality imposes upper limits on how much body fat species develop,
as carrying excess weight imposes locomotive and agility costs [46–49]. Therefore, being naturally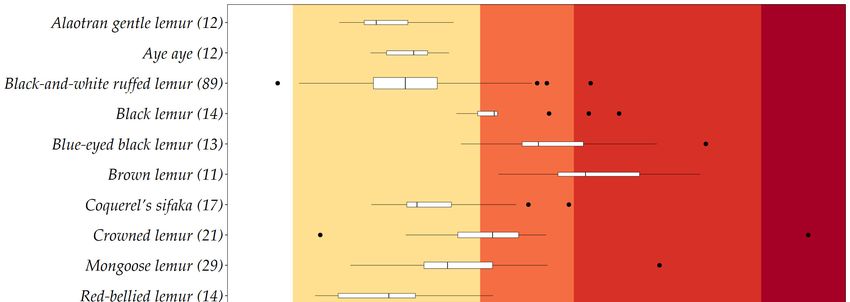
Animals 2020, 10, 1443                                                                               3 of 32

arboreal could be protective against captive weight gain, meaning such species should be less prone to
excessive body masses than those more terrestrial.
      Finally, predation risk could drive species differences in susceptibility to weight gain.
High predation pressure is associated with relatively smaller fat stores in birds, reptiles and mammals,
because carrying excess weight impedes escape [48–54]. To the best of our knowledge, there is no
evidence for such patterns in lemurs. However, lifespan in wild grey mouse lemurs was negatively
correlated with body mass, suggested to result from selective predation on larger individuals [55].
High wild predation risk, therefore, could explain why some species are less prone to weight gain even
when in captivity.
      In addition to species-typical ecology, an individual’s demographic profile and environment,
e.g., diet and physical activity, also affect body condition (e.g., [13]). Epidemiological approaches [56]
are useful in exploring such individual-level effects, having been successfully used to examine risk
factors for health and welfare problems across zoo [57], farm [58], and companion animals [59,60].
For captive lemurs, usable space and exercise opportunities (sensu [13]), the need to maintain body
temperature if housed outdoors (sensu [61]), use of contraceptives/neutering [14,19,62], amount of
fruit in the diet (cf. [38]), and activity levels (sensu [61]) are biologically relevant aspects that could
contribute to susceptibility to weight gain.
      Here, we use two complementary methods (cf. [63]) to better understand susceptibility to weight
gain in captive lemurs. We use phylogenetic comparative methods to test the hypotheses relating
species-typical ecology to captive weight gain described above, aiming to identify species-level effects,
i.e., ecological risk factors. We also use an epidemiological approach, and by comparing across
individuals we aim to identify individual-level effects, e.g., demographic and/or environmental risk
factors for captive weight gain.

2. Materials and Methods
    Ethical approval for outcome data collection was granted by the Faculty of Health Sciences
Research Ethics Committee of the University of Bristol (University Investigation Number: 37201).

2.1. Outcome Variable
     As reviewed above, there are several ways to determine body condition in primates, but most
require direct access and/or handling of animals (e.g., waist circumference measurements: [64]),
and none to-date have been tested and validated for use in lemurs. A practical alternative is to use
deviations from a species’ normal mass to infer body condition. Many zoos routinely weigh their
animals [65], and published values of lemur species-typical mean wild adult weights are available [66].
Comparisons between species-typical wild mean and captive representatives’ body masses have
already been used to infer body condition across several lemur species [18], and similar weight-based
methods of inferring body condition are used in other species (e.g., in humans, dogs, and cats [7,13,67].
We acknowledge, however, that using mass alone to infer body condition is limited because frame is
not accounted for (unlike, for example, body mass index: [1]); however, frame measurements are rarely
readily available for captive wild animals.
     Here, we use “relative body mass” as a proxy for body condition, i.e., the ratio between a
captive animal’s body mass and its species-typical wild mean (method after: [18], wild means
from: [66]). Relative body mass values correspond with the following body conditions (after [18]):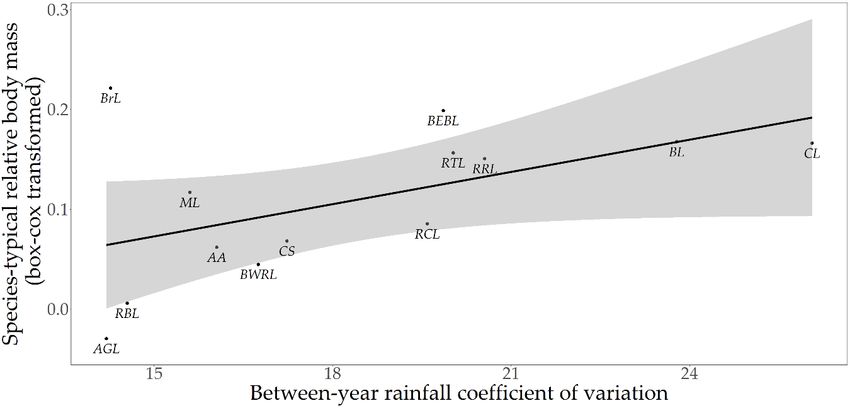
Animals 2020, 10, 1443                                                                               4 of 32

to reduce the effects of outliers and skew in the raw data: [68]). For epidemiological analyses of the
four best-sampled species, our outcome was individuals’ relative body masses.

2.2. Outcome Data Collection and Processing
       Data on body masses and corresponding living conditions of captive lemurs were collected
between August 2016–January 2018 mainly using an online survey made in Google Forms
(see Supplementary Materials File S1 for the questions). Participants could either provide body
mass values within the survey or provide Zoological Information Systems (ZIMS) Specimen Reports for
their lemurs. As the online survey was suitable for collections with ≤10 enclosures, larger collections
completed a tailored Excel spreadsheet containing the same questions. On request, the Duke Lemur
Center (www.lemur.duke.edu) kindly provided detailed copies of their most recent records of body
masses (an update of the dataset of [69]), and housing, feeding and enrichment routines of their lemurs.
       Using ‘species holding’ information from Species360 (then, the International Species Information
System [70]) we emailed or used zoo website contact forms to recruit zoos known to hold lemurs.
After initial contact, up to two further reminder requests were made. Zoos were classed as
non-participatory if no response was received after the third email, or if the zoo declined to participate.
The British and Irish Association of Zoos and Aquariums (BIAZA) Research Committee, the Association
of Zoos and Aquariums (AZA, North America) Prosimian Taxon Advisory Group (TAG), and the Zoo
and Aquarium Association (ZAA, Australasia) Primate TAG all supported our project.
       Raw online survey responses were downloaded for processing, and responses contained in
tailored Excel spreadsheets and the Duke Lemur Center’s data were added to this, resulting in records
from 1386 animals representing 22 species from 133 collections worldwide. Initially, we processed
these raw data into individual-level responses, combining responses from specific questions where
necessary to calculate our variables of interest, ready for calculation of species summary statistics for
the comparative analyses (see Table 1). A subset of these individual-level responses from the four
best-sampled species (Section 2.2.2) were used for epidemiological analyses. Note that the resulting
datasets contain missing data for some variables resulting in sample size differences.
       We excluded entries without body mass values, those from species-hybrids (because we were
interested in species effects), and females known to be pregnant (as their weights might over-estimate
their body condition). We calculated age at weighing from ZIMS Specimen reports or reported dates
of birth to determine which lemurs were adult; for the minority of animals lacking this information,
we accepted the respondents’ judgement of “adult”. Lemurs have a late “near-adult” growth period,
in which animals are sexually mature but not yet fully-grown [69]. After Zehr et al., [69] we therefore
excluded records from all but adult animals (defined by [69] as ≥twice the minimum dam age of
reproduction for lemurs housed at the Duke Lemur Center; see Appendix A Table A1 for these).
Wild fat-tailed dwarf lemurs, Cheirogaleus medius, and grey mouse lemurs undergo seasonal hibernation
or torpor, and naturally undergo programmed fattening (sensu [71]) prior to this [72,73], and captive
animals likewise demonstrate a similar pattern of annual weight fluctuations [74]. For these two
species, most of their representatives’ weights were taken immediately before their inactive periods
(i.e., when they were at their heaviest). Because their relative body masses would be biased upwards,
we excluded values from these two species from analyses. After these exclusions we were left with
records, including some on living conditions, for 691 animals from 20 species. Our last exclusion was
to remove species represented by
Animals 2020, 10, 1443 5 of 32
Table 1. Details of survey data processing. Individual-level variables are those used in the epidemiology analyses (n = number of animals with data), and species-level
are those used for comparative analyses (n = number of species with data). Note that a subset of the total available data, from the four best-sampled species, was used
for epidemiological analyses (see Section 2.2.2).
Comments Regarding
Definition Levels or Type Rationale Individual-Level Variable (n) Species-Level Variable (n)
Species-Level Variable
Outcome
For adults only, the ratio of the
most recent mass recorded Median relative body mass Median across
Continuous See Section 2.1 Relative body mass (544)
(grams) to its species-typical wild (13) individuals
mean (grams)
Husbandry
Type of climbing structures
within the enclosure(s)
We assumed fixed climbing
Fixed: climbing structures that are
structures require less physical Proportion with some
rigid and fixed into place, e.g., Fixed only Proportion across
effort to climb, and thus might Climbing structures (544) flexible climbing
platforms, bolted down logs Flexible and fixed 1 enclosures
contribute to large body masses, structures 2 (13)
Flexible: climbing structures that
than flexible structures (sensu [13])
are unstable and flexible, e.g.,
ropes, branches on a living tree
Contraceptive usage is associated
Yes Proportion calculated
with weight gain in primates Contraceptive use/neuter status Proportion given
Contraceptive use/neuter status No across animals of known
[19,62] and castration can cause (excluding “Unknown”s) (491) contraception/neutered (12)
Unknown contraceptive status
obesity in other taxa [14]
Used to infer quantity of exercise
space, assuming that less exercise,
Median across
Total area (m2 ) of the enclosure 3 Continuous and increased risk of weight gain, Enclosure area (469) Median enclosure area (13)
enclosures
occurs in smaller enclosures
(sensu [13])
Type of enclosure the animal is
Levels were ranked according to an
housed in.
Ordinally ranked: assumed increasing need for
Note: Animals with access to
Indoor only thermoregulation, and therefore Proportion of enclosures Proportion calculated
indoor and outdoor enclosures Enclosure type (544)
Indoor and outdoor energy expenditure (sensu [61]) which are indoors across enclosures
for all or part of the year, or any
Outdoor only indoor only < indoor and outdoor
combination of these were scored
< outdoor only
as ‘indoor and outdoor’Animals 2020, 10, 1443 6 of 32
Table 1. Cont.
Comments Regarding
Definition Levels or Type Rationale Individual-Level Variable (n) Species-Level Variable (n)
Species-Level Variable
Types of enrichment scored
according to their provision:
daily (5), two/three times per
week (4), weekly (3), monthly (2), We assumed a less enriched
less than monthly (1), never (0). environment represents fewer
Median across
Summed across for a maximum Counts activity opportunities, which Enrichment score (544) Median enrichment score (13)
enclosures
total score of 25 could contribute to weight gain
Enrichment types: (sensu [13])
Foraging-related, manipulable,
olfactory, audio/visual,
and training
Commercial, domesticated fruit
are more energy-rich than the
Proportion of the diet fed that is Proportion of the diet that is Median proportion of fruit in Median across
Continuous fruits wild lemurs consume, and
fruit fruit (529) the diet (13) enclosures
if fed in large amounts could
contribute to weight gain [38]
Demographics (epidemiological analyses only)
Older animals are at higher risk of
Age at weighing (days) Continuous Age (365) - -
weight gain in other primates [5]
Spring
In the wild, some species display
Summer
Season of weighing seasonal variation in body Season of weighing (544) - -
Autumn
masses, e.g., [77,78]
Winter
Risk of obesity and its related
Female
Sex health problems varies between Sex (544) - -
Male
the sexes across primates [79–81]
Ring-tailed lemur
Black-and-white Species differ in their
Species name ruffed lemur susceptibility to weight gain in Species name (544) - -
Red ruffed lemur captivity [18,19]
Mongoose lemur
1Only one enclosure featured flexible only climbing structures, so this was pooled into the ‘Flexible and fixed’ level for analysis. 2 For animals with both indoor and outdoor enclosures, if
one had flexible climbing structures but not the other they were recorded as ‘flexible’. 3 Summed across indoor and outdoor enclosures.Animals 2020, 10, 1443 7 of 32
2.2.1. Further Survey Processing for Comparative Analyses
For comparative analyses we calculated species summary statistics from the final individual-level
dataset (described in Table 1). As some species did not have ≥5 animals per sex (see Section 2.5.1),
we were unable to examine sex differences in comparative analyses (obesity and its related effects do
differ between the sexes across primates: [79–81]). For our outcome variable, we calculated the median
relative body mass of species’ representatives, this yielding species-typical median relative body mass.
Environment and living conditions also contribute to weight gain [13] and, should these covary
with our wild ecology predictors, could be confounds [63]. Therefore, using the information on living
conditions we collected in our survey, we calculated six husbandry variables (see Table 1) believed a
priori to likely influence body weight so we could later statistically control for their effects if necessary.
For these we calculated an appropriate summary statistic (a median or proportion; see Table 1).
2.2.2. Further Survey Processing for Epidemiological Analyses
Early exploratory analyses [74] revealed that four of our final 13 species had complete cases across
all variables enabling epidemiological analyses (n): ring-tailed lemurs (351), black-and-white ruffed
lemurs (89), red ruffed lemurs (75), and mongoose lemurs, Eulemur mongoz (29). We excluded records
from all other species. Because we were interested in possible sex differences, we also excluded any
animal of unknown sex (one animal). Maximum recorded captive lifespans of these four species
are similar and thus ages are directly comparable (i.e., mongoose lemur = 36.2 years; ring-tailed
lemur = 37.3 years; red ruffed lemur = 37.6 years; black-and-white ruffed lemur = 39.4 years [82]).
To boost sample sizes, we estimated some dates and corresponding seasons of weighing recorded as
“unknown” for the comparative analyses, by assigning the former as the 1st of the month that we
received weight records and using this to calculate the corresponding hemisphere-specific season
of weighing. For two ring-tailed lemurs with dates of birth but without dates of weighing, we also
used these estimated dates to calculate estimated age at weighing. Doing so resulted in them being
deemed sub-adult rather than adult as per the comparative analyses, thus excluding them from the
epidemiological analyses. Ring-tailed lemurs are adult from 978 days of age (cf. [69]). Being very close
to adulthood (929 and 936 days), including these individuals in the comparative analyses where they
just contributed to the species median is therefore likely to have minimal impact.
2.3. Comparative Analyses Predictor Variable Data Collation
For the 13 species featuring in the comparative analyses, we collated data on six wild ecological
predictor variables from published literature to test our hypotheses. See Table 2 for details and rationale
of wild ecological predictors and their calculations, and Table 3 for species-typical values.Animals 2020, 10, 1443 8 of 32
Table 2. Table describing predictor variables used to test our comparative hypotheses, their rationale, calculation, and predicted relationship with species-typical
median relative body mass. n = number of species with data.
Predicted
Hypothesis:
Relationship with
Susceptibility to Captive Predictor Variable (n) Rationale
Species-Typical
Weight Gain Relates to . . .
Relative Body Mass
Annual rainfall is commonly used in the primate literature to infer primary productivity [28–30],
because it directly affects plant growth [26,27] and thus food availability. We extracted the mean
(i) low productivity Annual rainfall (13) annual rainfall within each species’ native geographic range (from [83]) for years 1970–2000 (from Negative
[84]) at 1 km2 spatial resolution using QGIS (version: Maderia 3.4; QGIS Development [85]), taking a
median across range fragments for species with a fragmented range a .
We assumed that greater between-year variation in rainfall represents greater unpredictability in
primary productivity and, thus, food resource availability (cf. [26,27]). Using 0.5 × 0.5 gridded
values, within each species’ geographic range we calculated the mean total rainfall for every month
(ii) unpredictable food Between-year annual rainfall
between 1901–2016 (CRU version 4.01 [86]) in R (version 3.6.1 [87]) using the packages “maptools” Positive
resources coefficient of variation (13)
[88], “raster” [89] and “rgdal” [90]. By summing a given year’s monthly means we calculated annual
total rainfall values, then calculated the coefficient of variation of these CV = µσ × 100
Where σ is the standard deviation of annual total rainfall values, and µ is the mean of these values.
From descriptive terms in published literature, we categorised species’ ground use as “common”
(e.g., often, sometimes, regularly forages and/or nests on the ground) or “rare” (e.g., rarely, almost
never). Sources were: Mittermeier et al. [41], Garbutt [43], Macdonald [91]; and field studies of
Ground use, common v rare
native, free-living wild-born lemur populations identified during systematic literature searches in Common > rare
(11)
(iii) natural arboreality Web of Science and British Library’s EThOS Thesis Repository [92], using species’ scientific and
common names as terms. Using a species % scans at ground level (below), we also arbitrarily classed
species spending ≥10% scans at ground-level as ‘common’ b .
We used data from field studies identified in our systematic literature searches to calculate time
Ground time, % scans (8) spent at ground-level (% scans). For species with values from >1 study, we calculated the median Positive
value across studies.
The proportion of a species’ total length (head to tail tip) that is the tail (from [41,43]). Larger values
Relative tail length (13) Negative
correspond to relatively longer tails: an adaptation to arboreality across primates [93–95].
Data on direct predation pressure are rare, but broad taxonomic descriptions of predators (e.g.,
“raptors”) are described [41,43]. We assumed that being predated by an increasing number of
Predation score, different classes of species (i.e., mammals, birds, reptiles) likely represents increasing evolutionary
(iv) predation risk Negative
0–3 (13) investment in different predator-avoidance strategies by lemurs. We scored the maximum of 1 each
for reported mammalian, avian, and/or reptilian predation on a species, and summed across these
for a maximum possible score of 3 (from [41,43]).
a Note that while we could have also calculated annual rainfall values using data from CRU version 4.01 [86], our source here [84] provided these values at a finer, and thus preferred, scale.
b Descriptive terms and behavioural data showed good agreement in all but one case. As the study providing behavioural data of crowned lemurs’, Eulemur coronatus, ground-use (1% of
scans) was only 4 months long, we judged the field-guides to be more reliable and categorised its ground-used as ‘common’.Animals 2020, 10, 1443 9 of 32
Table 3. Details of species-typical variables used during comparative analyses. Acronyms are explained at the foot of the table. Species-typical outcome and husbandry
data processing and calculations are described in Section 2.2.1 and Table 1. Justification and calculation of species-typical wild ecology predictors are detailed in
Table 2. Dashes indicate data were not available for that species.
Species-Typical Outcome Species-Typical Wild Ecology Species-Typical Husbandry
Species Name Common Name
RBM n SD AR ARCV GU GT RTL PS MEA MEE MPF PFC PGC PHI
Daubentonia
Aye aye 1.07 12 0.07 2472.25 16.05 Common - 0.59 0 26.13 14 0.13 0.9 0 1
madagascariensis
Eulemur collaris Red-collared lemur 1.11 17 0.09 1445.59 19.59 Rare 2.5 0.57 2 38.05 18 0.29 1 0.15 0.20
Eulemur
Crowned lemur 1.28 21 0.24 1438.58 26.0 Common 1 0.56 2 72 15 0.24 1 0 0.17
coronatus
Eulemur
Blue-eyed black lemur 1.41 13 0.19 1706.97 19.86 Rare 0.6 0.61 2 49.10 14 0.29 0.89 0 0
flavifrons
Eulemur fulvus Brown lemur 1.53 11 0.16 1482.72 14.27 - - 0.46 2 12.95 18 0.25 0.86 0.45 0.14
Eulemur macaco Black lemur 1.29 14 0.13 1961.93 23.78 Rare 0.58 0.58 2 72.59 14.5 0.05 1 0.5 0.17
Eulemur mongoz Mongoose lemur 1.16 29 0.17 1481.21 15.60 Rare 1 0.59 2 36 18 0.33 1 0.14 0.24
Eulemur
Red-bellied lemur 1.01 14 0.15 1718.98 14.55 Rare - 0.56 2 102.25 13.5 0.29 0.83 0 0
rubriventer
Hapalemur
Alaotran gentle lemur 0.97 12 0.09 1151.84 14.20 Common - 0.50 2 20 17 0 1 0.08 0
alaotrensis
Lemur catta Ring-tailed lemur 1.25 351 0.24 701.21 20.03 Common 27 0.58 3 142.91 14 0.27 0.90 0.33 0.08
Propithecus
Coquerel’s sifaka 1.08 17 0.14 1527.47 17.23 Common - 0.54 0 14,188.39 14 0.01 1 - 0
coquereli
Varecia rubra Red ruffed lemur 1.24 75 0.22 2873.58 20.56 Rare 0.01 0.57 0 227.60 14 0.40 0.93 0.19 0.10
Varecia variegata Black-and white ruffed lemur 1.05 89 0.15 1869.95 16.75 Rare 1.1 0.54 0 144.79 14 0.29 0.97 0.12 0.05
Acronyms: Outcome variable: RBM: species-typical median relative body mass; n: number of individuals with outcome data; SD: standard deviation of species-typical median relative body
mass. Species-typical wild ecology predictor variables: AR: annual rainfall (mm); ARCV: between-year rainfall coefficient of variance; GU: ground use (common v rare); GT: ground time
(% scans); RTL: relative tail length (proportion of tail length to whole body length); PS: predation score (0–3). Species-typical husbandry variables: MEA: median enclosure area; MEE: median
enrichment score; MPF: median proportion of the captive diet that is fruit; PFC: proportion of enclosures with flexible climbing materials; PGC: proportion of captive animals known to be
given contraception/neutered. PHI: proportion of enclosures which were indoors.Animals 2020, 10, 1443 10 of 32
2.4. Predictors for Epidemiological Analyses
Details of husbandry and demographic predictor variables calculated from our survey and their
rationale are shown in Table 1.
2.5. Statistical Procedures
All analyses were performed in R version 3.6.1 [87].
2.5.1. Comparative Analyses
Prior to hypothesis-testing we made two types of confound check. First, we investigated
correlations between wild ecology predictor variables belonging to different hypotheses. Based on
these results, we made further checks during hypothesis-testing by including correlated predictors as
extra terms, to assess whether they altered interpretation of the focal predictor (in practice they never
did, so hypothesis-testing models are reported without them). Our second confound check was to assess
relationships between wild ecology predictor variables and the six species-typical husbandry variables
shown in Table 1. Correlated husbandry variable(s) were included in final hypothesis-testing models.
To control for species non-independence due to shared ancestry, we used phylogenetic generalised
least squares (PGLS) regressions [96,97] for all continuous outcomes [98], and phylogenetic logistic
regression models when ground-use was the outcome during between-predictor confound checks
(“phylolm” package: [99]). For comparative confound checks, we used a consensus lemur phylogenetic
tree (from [100]). Models were only run if data were available for ≥5 species, or ≥5 species per
level for categorical variables. Potential outliers were assessed on graphs and PGLS diagnostic
plots [98], and results reported with outliers if model assumptions were not violated, and they
did not have a studentised phylogenetic residual >±3 (e.g., [101]). Homogeneity of residuals was
checked on diagnostic plots, and normality assessed using a Shapiro-Wilk normality test—where
necessary transformations were applied to satisfy these. Pagel’s Lambda (λ), a measure of phylogenetic
signal [97,102,103], was estimated in PGLS models using maximum likelihood. The phylogenetic
logistic regression equivalent of λ is alpha (α), which is reported in relevant models.
To account for phylogenetic uncertainty, all final hypothesis-testing models were performed over
a tree block of 1000 alternative lemur phylogenetic trees (from [100]), and summarised as medians and
95% CIs. Results were considered significant at p < 0.05 and all p values are two-tailed.
2.5.2. Epidemiological Analyses
For epidemiological analyses, we used mixed effects models in ‘lmer40 [104] and ‘ordinal’ [105].
To account for variance explained by non-independence between animals sharing enclosures,
and enclosures within the same zoo, ‘enclosure’ was nested in ‘zoo’ as a random effect. Relative body
mass was natural log-transformed to better meet the requirements of linear modelling, as were age and
enclosure area because of their skew and hence leverage of high values. During hypothesis-testing,
outliers with studentised residuals >±3 (e.g., after: [101]) were removed (four animals) as their inclusion
meant that models’ residuals did not pass a Shapiro–Wilks normality test.
Being non-experimental data, the explanatory power of predictor variables (cf. Table 2 in [106])
was assessed by comparing Akaike information criterion (AIC) scores of models with and without
a focal predictor [107]. Models with lower AIC scores by ≥2 were judged as improvements [108].
If a focal predictor yielded a better fit to the data than a model without it, the model’s coefficients were
examined to interpret the relationship. For categorical predictor terms with >2 factors, we spilt the
dataset by that factor and re-ran the analysis to assess the relationship between the focal predictor and
relative body mass.
We first checked for relationships between predictors using all data available for each variable.
In all cases we used AIC scores to initially assess whether varying intercepts only or intercepts and
slopes provided the better fit [109], with the random effects structure mentioned above. LinearAnimals 2020, 10, 1443 11 of 32
mixed models were used when age and enclosure size were analysed as outcomes; generalised linear
mixed models (binomial family and logit link function) were used for contraceptive use/neutered
status and sex, and for when % fruit (gamma family and inverse link function) and enrichment score
(Poisson family and log link function) were analysed as outcomes; and cumulative link mixed models
(probit link function) [105] were used when the ordinally ranked enclosure type was an outcome.
Relationships between variables were confirmed if the full model with the predictor term was a
better fit to the data than null without it [110]. We ran additional models at the univariable stage of
hypothesis-testing (below) to assess if correlated predictors affected interpretation of focal predictors,
by including them as extra predictor terms (in practice they never did).
To enable model comparisons for hypothesis-testing, next we reduced our dataset to animals with
complete data across all variables. We followed a similar model-building approach to KilBride et al. [58],
although we evaluated interactions. Initially, we assessed univariable associations between predictors
and our outcome using the same linear mixed models and procedure already described (here, varying
intercepts and slopes never gave a better fit to the data than varying intercepts only). Predictors found
to have a univariable relationship with relative body mass, as determined by AIC, were taken forward
to the multivariable model-building stage.
Multivariable model building began with a model including all predictors with a univariable
association with relative body mass. We used a forwards multiple regression technique and by making
comparisons to the simplest version of this model (i.e., without any interactions), we checked for
improvements in model fit by progressively including interactions, stopping when additions did not
yield further improvements. This became our minimal adequate (baseline) model. Using this baseline
model, we reassessed predictor variables without a univariable association with relative body mass,
by sequentially added these into the baseline model, again checking for interactions, to see if they now
improved model fit (after: [58,111]). We continued until none of the remaining predictors resulted in
improvements, yielding our final minimal adequate model.
3. Results
3.1. Survey Response Rate and Descriptive Statistics
Of 359 zoos contacted 135 responded, representing a response rate of 38%. Of the 13 species in
our final comparative dataset, their sample sizes and species-typical relative body masses are shown in
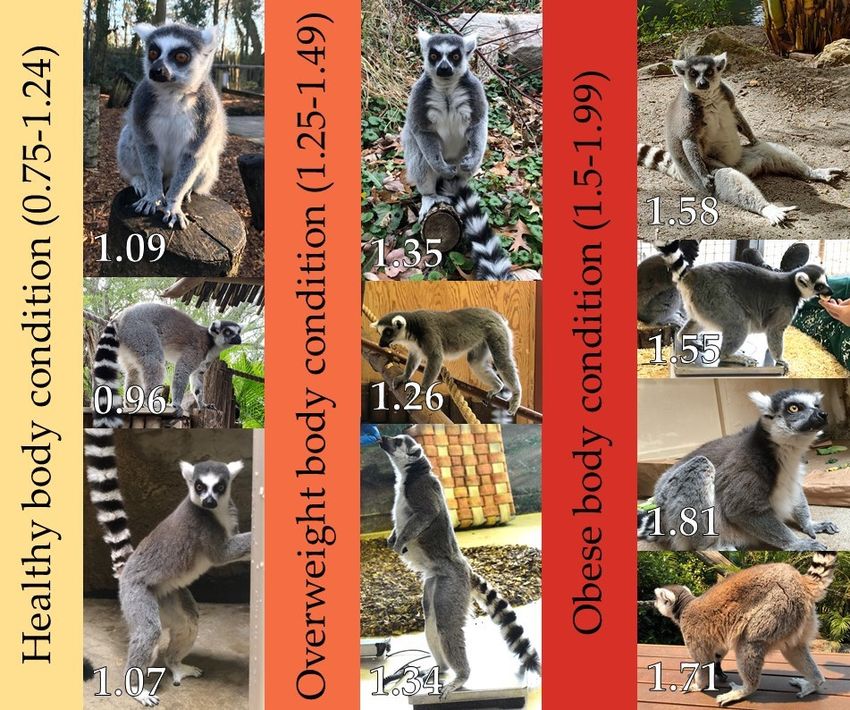
Table 3. Figure 1 provides a visual depiction of ring-tailed lemurs in different body conditions (note we
did not have images of those in underweight and morbidly obese conditions).
Boxplots of individuals’ relative body masses are shown in Figure 2, grouped by species. Across our
13 species, 0.30% of animals were underweight (species-typical relative body mass 2).
Species-typical median relative body mass values (indicated by vertical lines on the boxes of
Figure 2) of eight species corresponded with the healthy category: aye ayes, red-collared lemurs,
E. collaris, mongoose lemurs, red-bellied lemurs, Alaotran gentle lemurs, Hapalemur alaotrensis,
Coquerel’s sifaka, Propithecus coquereli, and black-and-white and red ruffed lemurs. Four species
were classed as being typically overweight: crowned lemurs, blue-eyed black lemurs, black lemurs,
E. macaco, and ring-tailed lemurs. One species, brown lemur, E. fulvus, was classed as obese.Animals 2020, 10, 1443 12 of 32
Animals 2020, 10, x 12 of 34
Figure 1. Images of different adult lemurs in one of three body conditions as deemed by their relative
Figure 1. Images of different adult lemurs in one of three body conditions as deemed by their relative
body masses: healthy, overweight, or obese. The number at the bottom of each image is that animal’s
body masses: healthy,
relative overweight,
body mass or obese.
at the time the Thewas
photograph number at the
taken. Sex bottom
of lemurs of each
(credits). image
Far left, is that animal’s
top: female
relative body mass at the time the photograph was taken. Sex of lemurs (credits).
(Lakeland Wildlife Oasis); middle: male (Nancy Nill, Palm Beach Zoo); bottom: female (Ashley Far left, top:
Ashcraft). Middle, top: male (Valerie Schultz, Smithsonian’s National Zoo);
female (Lakeland Wildlife Oasis); middle: male (Nancy Nill, Palm Beach Zoo); bottom: female middle: female (Śląski
Ogród Zoologiczny); bottom: male (Heidi Beal). Right, top: male (Nancy Nill, Palm Beach Zoo);
(Ashley Ashcraft). Middle, top: male (Valerie Schultz, Smithsonian’s National Zoo); middle: female
second from top: female (Śląski Ogród Zoologiczny); second from bottom: male (Debbie Fenton);
(Ślaski
˛ Ogród Zoologiczny); bottom: male (Heidi Beal). Right, top: male (Nancy Nill, Palm Beach Zoo);
bottom: male (Rebecca Lambert, Taronga Conservation Society).
second from top: female (Ślaski ˛ Ogród Zoologiczny); second from bottom: male (Debbie Fenton);
Animals
bottom: 3.2.male
2020, Comparative
10, x (RebeccaAnalyses: Results
Lambert, Taronga Conservation Society). 13 of 34
Figure 3 shows the phylogenetic tree of the 13 species featured in our comparative analyses, with
tip-points coloured according to species-typical median relative body mass values.
3.2.1. Comparative Analyses: Results of Confound Checks
All between-predictor confound checks are shown in Appendix Table A2. Two sets of between-
predictor check models were significant. Species that spend more time on the ground live in ranges
with low annual rainfall (t6 = −3.64, R2 = 0.69, λ = 0.51, p = 0.01), and vice versa (t6 = −9.31, R2 = 0.94, λ
= 0, p < 0.001). Species more heavily predated also live in ranges with low annual rainfall (t11 = −3.16,
R2 = 0.48, λ = 0.77, p = 0.01). Results of predictor-husbandry checks are also shown in Appendix Table
A3—no significant relationships between wild ecology predictors and species-typical husbandry
were found.
Figure
Figure Box-and-whisker
2. 2. Box-and-whiskerplotsplotsofofrelative
relative body mass
mass values
valuesofofindividual
individualadult
adult lemurs,
lemurs, from
from thethe
13 13
species
speciesfeaturing
featuringininour
ourcomparative
comparativeanalyses. Ring-tailedlemurs,
analyses. Ring-tailed lemurs,mongoose
mongooselemurs,
lemurs, black-and-white
black-and-white
ruffed
ruffed lemurs,
lemurs, andred
and redruffed
ruffedlemurs
lemursalso
alsofeatured
featured in our epidemiological
epidemiologicalanalyses.
analyses.Sample
Sample sizes areare
sizes
shown
shown inin parenthesisnext
parenthesis nexttotospecies’
species’ names,
names, and areare also
alsoare
areindicated
indicatedby bythe
therelative
relative width
widthof of
their
their
respective boxplot. Species’
respective boxplot. Species’ medians medians are indicated by vertical lines on the boxes; the extent
indicated by vertical lines on the boxes; the extent of the of the
boxes
boxes indicate
indicate theirinterquartile
their interquartileranges;
ranges; whiskers
whiskers represent
representvalues
valueswithin
within1.51.5times
times the interquartile
the interquartile
range; and outliers outside this are depicted as points. The healthy range
range; and outliers outside this are depicted as points. The healthy range (0.75–1.25) is (0.75–1.25) is shown
shown by by
yellow
yellow shading;
shading; overweightby
overweight byorange
orange(1.25–1.5);
(1.25–1.5); obese
obese by
by red
red (1.5–2);
(1.5–2);and
andmorbidly
morbidlyobeseobese (>2) byby
(>2) thethe
darker
darker red.
red.Figure 2. Box-and-whisker plots of relative body mass values of individual adult lemurs, from the 13
species featuring in our comparative analyses. Ring-tailed lemurs, mongoose lemurs, black-and-white
ruffed lemurs, and red ruffed lemurs also featured in our epidemiological analyses. Sample sizes are
Animals 2020, 10, 1443 13 of 32
shown in parenthesis next to species’ names, and are also are indicated by the relative width of their
respective boxplot. Species’ medians are indicated by vertical lines on the boxes; the extent of the
3.2. boxes indicateAnalyses:
Comparative their interquartile
Results ranges; whiskers represent values within 1.5 times the interquartile
range; and outliers outside this are depicted as points. The healthy range (0.75–1.25) is shown by
Figure 3 shows the phylogenetic tree of the 13 species featured in our comparative analyses,
yellow shading; overweight by orange (1.25–1.5); obese by red (1.5–2); and morbidly obese (>2) by the
withdarker
tip-points
red. coloured according to species-typical median relative body mass values.
Phylogenetictree
Figure3.3.Phylogenetic
Figure treeofof1313lemur
lemurspecies
speciesininour
ourcomparative
comparativeanalyses,
analyses,withwiththeir
theirspecies-typical
species-typical
medianrelative
median relativebody
bodymass
massvalues
valuesshown
shownasastip-points.
tip-points.TheThecolour
colourofofa aspecies’
species’tip-point
tip-pointrepresents
represents
its species-typical body condition: the healthy range (species-typical relative body
its species-typical body condition: the healthy range (species-typical relative body mass 0.75–1.25) mass 0.75–1.25)
is
is shown by yellow shading; overweight by orange (1.25–1.5); obese by red (1.5–2); and morbidly obese
shown by yellow shading; overweight by orange (1.25–1.5); obese by red (1.5–2); and morbidly obese
(>2) by the darker red.
(>2) by the darker red.
3.2.1. Comparative Analyses: Results of Confound Checks
3.2.2. Comparative Analyses: Results of Hypothesis-Testing
All between-predictor confound checks are shown in Appendix A Table A2. Two sets of
No aspect of wild
between-predictor ecology
check modelssignificantly predicted
were significant. species-typical
Species median
that spend more relative
time on body mass
the ground live in
(Table
ranges4);with
however, we didrainfall
uncover(t6 one trend.R2Species
= −3.64, = 0.69,that
λ = experience large
0.51, p = 0.01), between-year
vice versa (tvariation
low annual and 6 = −9.31,
R2 = 0.94, λ = 0, p < 0.001). Species more heavily predated also live in ranges with low annual rainfall
(t11 = −3.16, R2 = 0.48, λ = 0.77, p = 0.01). Results of predictor-husbandry checks are also shown in
Appendix A Table A3—no significant relationships between wild ecology predictors and species-typical
husbandry were found.
3.2.2. Comparative Analyses: Results of Hypothesis-Testing
No aspect of wild ecology significantly predicted species-typical median relative body mass
(Table 4); however, we did uncover one trend. Species that experience large between-year variation in
rainfall, and thus greater food resource unpredictability, tend to have larger species-typical relative
body masses (Figure 4; as the 95% CI values are identical [see Table 4], here we report median values
for each parameter: t11 = 2.04, R2 = 0.27, λ < 0.01, p = 0.07). To illustrate, black lemurs, crowned lemurs,
and ring-tailed lemurs are examples of species that experience relatively large between-year variation
in rainfall and, correspondingly, whose representatives are typically overweight in captivity.Animals 2020, 10, 1443 14 of 32
Table 4. Results of hypothesis-testing model results performed over a tree block of 1000 alternative
Lemuriform phylogenetic trees. Because values for upper and lower 95% confidence intervals were
identical to medians in all cases, here we provide median values for each parameter. CV = coefficient of
variation. Results were considered significant at p < 0.05, and trends (p < 0.10) are italicised. All p values
are two-tailed.
Hypothesis Wild Ecology Predictor Model Output [95% CIs]
(i) low productivity Total annual rainfall (mm) t11 = −0.10, R2 < 0.01, λ < 0.01, p = 0.92
Animals(ii) unpredictability
2020, 10, x Between-year rainfall CV t11 = 2.04, R2 = 0.27, λ < 0.01, p = 0.07 14 of 34
Ground use (some v rare) t10 = −0.59, R2 = 0.03, λ < 0.01, p = 0.57
in rainfall,
(iii)and thus greater food
arboreality resource
Ground timeunpredictability,
(% scans) tend to have
t6 = −0.31, R2 larger
= 0.02, species-typical
λ < 0.01, p = 0.76relative
body masses (Figure 4; as the 95% Relative tail length
CI values *
are identical t11 =
[see Table
−0.15, < 0.01,
4],R2here < 0.01,median
weλreport p = 0.89 values
for each parameter:
(iv) t11 = 2.04, R2Predation
predation risk = 0.27, λAnimals 2020, 10, 1443 15 of 32
3.3.3. Epidemiological Analyses: Multivariable Results
The baseline model with the three predictors found to have a univariable association with relative
body mass, is shown in Appendix A Table A6. Species × sex was a better fit to the data than a simpler
model without it (AIC = −211.93 v −216.09). Male mongoose lemurs have smaller mean relative body
masses, corresponding with healthy, than females, which are typically overweight (t6 = −2.76, p = 0.03);
whereas male ring-tailed lemurs have larger mean values than females, but both sexes are typically
overweight (t127 = 3.15, p < 0.01). Species and age both had main effects. Black-and-white ruffed lemurs
had smaller mean relative body mass values than ring-tailed lemurs (t146 = −5.11, p < 0.001) and red
ruffed lemurs (t4 = −3.94, p = 0.02), and relative body mass increased with age (t157 = 2.09, p = 0.04).
Sequentially adding predictors without a univariable relationship with the outcome into the
baseline model yielded the following (see Table 5). Males in enclosures featuring only fixed climbing
structures were on average obese, whereas those with flexible and fixed structures were typically
overweight (t157 = 3.04, p < 0.01). Females weighed in the winter had larger mean relative body masses,
and were normally overweight, than those weighed in spring (t178 = 3.30, p < 0.01) and summer
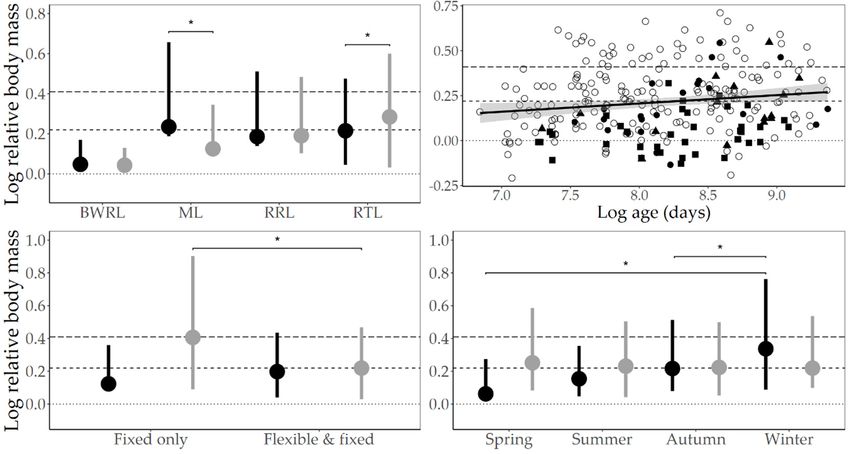
(t25 = 3.70, p < 0.01) which fell within the healthy range. See Figure 5 for visual representations of the
multivariable
Animals 2020, 10, results.
x 16 of 34
Figure 5.5.Relationships
Figure Relationships between
between relative
relative bodybodymassmass and species
and species × sex,
× sex, age, age, climbing
climbing structure
structure provision
×provision
sex, and ×season
sex, and season
× sex. Dotted× sex. Dotted horizontal
horizontal line the
line indicates indicates
point the point relative
at which at whichbody relative
massbody =1
mass = 1 (i.e., the captive animal is the same weight as its species-typical wild
(i.e., the captive animal is the same weight as its species-typical wild mean; 0 on the log-scale); the short mean; 0 on the log-
scale); the
dashed lineshort dashed
indicates line indicates
the overweight the overweight
threshold (≥1.25, orthreshold
0.22 on the (≥1.25, or 0.22
log-scale); and onthethelong
log-scale);
dashed line and
the long dashed
indicates the obese line indicates
threshold the obese
(≥1.5, or 0.41threshold (≥1.5, or On
on the log-scale). 0.41the
onthree
the log-scale).
plots withOn thebars,
error threepoints
plots
with error
indicate thebars,
mean points indicate
relative bodythe mass mean relative
value, body
and the mass value,
whiskers and the
the upper andwhiskers
lower 95% theconfidence
upper and
lower 95%differences
intervals; confidencebetween intervals; differences
groups between
are indicated groups
with are indicated
asterisks; withare
and females asterisks;
indicated andby females
black,
are indicated
males by grey.by Topblack,
Left:males
BWRL: by grey. Top Left: BWRL:
black-and-white ruffed black-and-white
lemur. ML: mongoose ruffedlemur.
lemur.RRL: ML: mongoose
red ruffed
lemur. RTL:
lemur. RRL:ring-tailed
red ruffedlemur. lemur.Male RTL:mongoose
ring-tailedlemurs
lemur.have
Male mongoose
smaller lemurs
relative bodyhavemasses smaller relative
than females
(t 6 = −2.76,
body massesp = 0.03),
than whereas
females (t6 =male
−2.76,ring-tailed
p = 0.03), lemurs
whereashavemalelarger valueslemurs
ring-tailed than females
have larger(t127 = 3.15,
values
< 0.01).
pthan femalesTop(tRight: Relative
127 = 3.15, bodyTop
p < 0.01). mass increases
Right: withbody
Relative age (tmass
157 = 2.09, p
increases = 0.04)
with across
age (t 157four
= lemur
2.09, p=
species (both log-transformed): black-and-white ruffed lemur = filled square;
0.04) across four lemur species (both log-transformed): black-and-white ruffed lemur = filled square; mongoose lemur = filled
triangle;
mongoose redlemur
ruffed=lemurfilled = filled circle;
triangle; ring-tailed
red ruffed lemurlemur = unfilled
= filled circle. The lemur
circle; ring-tailed shaded= areaunfilledshows the
circle.
95% confidence
The shaded arearegion.
shows the Bottom Left: Malesregion.
95% confidence housedBottom
in enclosures featuring
Left: Males housed fixed climbing structures
in enclosures featuring
only
fixed(versus
climbing flexible and fixed
structures onlystructures) have larger
(versus flexible relative
and fixed body mass
structures) havevalues
larger(t157 = 3.04,
relative bodyp < 0.01).
mass
Bottom Right: Females weighed in the winter had larger relative body masses
values (t157 = 3.04, p < 0.01). Bottom Right: Females weighed in the winter had larger relative body than those weighed in
spring (t
masses than = 3.30, p < 0.01) and
178 those weighed in spring (t178 =25summer (t = 3.70, p < 0.01).
3.30, p < 0.01) and summer (t25 = 3.70, p < 0.01).Animals 2020, 10, 1443 16 of 32
Table 5. Final model of predictors that explain relative body mass. Random effects were ‘enclosure’ nested in ‘zoo’. For each predictor, varying intercepts but common
slopes were found to be the best fit to the data. n = number of animals. AIC −216.08 = AIC value of the baseline model (the first four predictors are the baseline model
itself, hence they do not have AIC values). Coef. = coefficient. SE = standard error. df = degrees of freedom. 95% CILL = lower 95% confidence interval of the
coefficient; 95% CIUL = upper 95% confidence interval of the coefficient.
Comparisons to
Predictor Details Model Coefficients
Baseline Model
Predictor Variable Levels n AIC −216.08 Coef. 95% CILL 95% CIUL SE df t p
Black-and-white ruffed lemur 36 −0.22 −0.37 −0.08 0.08 157 −2.94Animals 2020, 10, 1443 17 of 32
4. Discussion
Our comparative study found no support for our hypotheses relating susceptibility to captive
weight gain to arboreality, predation risk, or low productivity. However, given our sample sizes were
small, likely reducing statistical power (n < 20; cf. [112]), we discuss the trend consistent with one
hypothesis. Lemurs for which native ranges have large between-year variation in annual rainfall,
and who are thus assumed to be adapted to greater food resource unpredictability, tended to have
larger relative body masses. They may therefore have “thrifty” adaptations that represent an ecological
risk factor for susceptibly to captive weight gain, pre-disposing such species to obesity and its related
health problems.
Our epidemiological analyses revealed four demographic and one environmental risk factor for
large relative body masses across four species. We confirmed species differences in average relative
body masses; found relative body mass to increase with age; and that for two species there was a
sex effect. Climbing structure provision influenced relative body masses across males of all species.
Males whose climbing structures were fixed had larger relative body masses than those housed
with some flexible climbing structures too. Additionally, for females there was a seasonal effect.
Next, we discuss findings from each study in turn. Based on these, we then make recommendations
for zoos managing these species, describe limitations of our study, and detail ideas for future research.
4.1. Comparative Study
Regarding species differences our results show some agreement with two previous multi-species
studies ([18]; note we used Terranova and Coffman’s [19] body mass values to calculate the typical
body condition of their lemurs ourselves), and our epidemiological analyses likewise confirmed
species differences (Table 5). Thus, of species common to all three studies, red-bellied lemurs and
black-and-white ruffed lemurs emerged as usually healthy, whereas blue-eyed black lemurs and
black lemurs are typically overweight. Mongoose lemurs provide the one instance of disagreement,
being typically healthy in our study but overweight in the previous two. This between-study difference
might reflect differences in data sources and measurement methods, or recent improvements in captive
diet and husbandry for this species (e.g., based on recommendations in: [38]).
How might “thrifty” adaptations to unpredictable wild food resources potentially increase
susceptibility to captive weight gain in lemurs? Lemurs have various attributes proposed to
facilitate survival in their native, and unpredictable, environment. These include increased
resting, food-switching (e.g., from fruit to leaves and flowers), reduced basal metabolic rates and
hibernation/torpor during lean periods, as well as seasonal breeding and weaning synchrony [25].
Therefore, lemurs are likely adapted to take advantage of plentiful food when available (cf. [25])
as, presumably, is the case in captive environments. Possibly, if food is delivered in two or three bouts
(meals) rather than encountered slowly over the course of a day as per wild food, this might promote
binge-eating. If captive food also tends to be energy-rich (cf. [38]) then our result might simply reflect
a constant state of positive energy imbalance and subsequent weight gain (sensu [13]).
As unpredictability is key to the potential ecological risk factor identified here, paradoxically,
for some species perhaps food unpredictability is being inadvertently signalled by captive feeding
regimes, leading to animals going into “thrifty” mode (e.g., increased resting, reduced basal metabolic
rate: [25]) ultimately resulting in weight gain. Food unpredictability, rather than greater access to
energy-rich food per se, is proposed to help explain why people from lower socioeconomic positions in
wealthy (but not poorer) countries are at most risk of being overweight or obese [113,114]. For these
people, it is the combination of food being sometimes perceived as unpredictable and, when accessible,
being energy-rich that might explain this effect [114]. A similar scenario could be relevant for some
captive lemurs too. Even if regularly provisioned daily, food provided in a small number of discrete
meals rather than being available ad libitum might signal unpredictability. This may be especially so for
animals in which eating just two or three times per day is likely at odds—a mismatch (cf. [115,116])—with
their foraging and eating behaviour during times of plenty in the wild. In humans, attempts to loseYou can also read