HazMapper: a global open-source natural hazard mapping application in Google Earth Engine - Natural Hazards and Earth System Sciences
←
→
Page content transcription
If your browser does not render page correctly, please read the page content below
Nat. Hazards Earth Syst. Sci., 21, 1495–1511, 2021
https://doi.org/10.5194/nhess-21-1495-2021
© Author(s) 2021. This work is distributed under
the Creative Commons Attribution 4.0 License.

HazMapper: a global open-source natural hazard mapping
application in Google Earth Engine
Corey M. Scheip1,2 and Karl W. Wegmann1,3
1 Department  of Marine, Earth, and Atmospheric Sciences, North Carolina State University, Raleigh, NC 27695, USA
2 North Carolina Geological Survey, Division of Energy, Mineral, and Land Resources,
Department of Environmental Quality, Swannanoa, NC 28778, USA
3 Center for Geospatial Analytics, North Carolina State University, Raleigh, NC 27695, USA

Correspondence: Corey M. Scheip (cmscheip@ncsu.edu)

Received: 2 April 2020 – Discussion started: 29 April 2020
Revised: 24 March 2021 – Accepted: 26 March 2021 – Published: 12 May 2021

Abstract. Modern satellite networks with rapid image acqui-        1   Introduction
sition cycles allow for near-real-time imaging of areas im-
pacted by natural hazards such as mass wasting, flooding,
and volcanic eruptions. Publicly accessible multi-spectral         Natural disasters such as landslides, wildfires, and volcanic
datasets (e.g., Landsat, Sentinel-2) are particularly helpful      eruptions are a primary mechanism of landscape change (Ko-
in analyzing the spatial extent of disturbances, however,          rup et al., 2010; Santi et al., 2013) while simultaneously caus-
the datasets are large and require intensive processing on         ing fatalities into the 21st century (Froude and Petley, 2018;
high-powered computers by trained analysts. HazMapper is           Petley, 2012; Auker et al., 2013; Holzer and Savage, 2013;
an open-access hazard mapping application developed in             Ashley and Ashley, 2008). As such, both Earth scientists and
Google Earth Engine that allows users to derive map and            emergency managers have a keen interest in understanding
GIS-based products from Sentinel or Landsat datasets with-         natural disaster occurrences and their spatial extent. Ongo-
out the time- and cost-intensive resources required for tra-       ing work to increase predictive capabilities for natural hazard
ditional analysis. The first iteration of HazMapper relies on      events (Goetz et al., 2015; Guzzetti et al., 2006) rely on the
a vegetation-based metric, the relative difference in the nor-     robust characterization (e.g., number or spatial distribution
malized difference vegetation index (rdNDVI), to identify ar-      of landslides) of modern-day events (Xu et al., 2016; Gallen
eas on the landscape where vegetation was removed follow-          et al., 2017).
ing a natural disaster. Because of the vegetation-based met-          Readily observable field evidence of only the largest or
ric, the tool is typically not suitable for use in desert or po-   most recent natural disasters typically persists in temperate
lar regions. HazMapper is not a semi-automated routine but         environments due to the constant regrowth cycle of vegeta-
makes rapid and repeatable analysis and visualization fea-         tion. Locating this field evidence and determining historical
sible for both recent and historical natural disasters. Case       patterns of natural disasters is a primary objective for many
studies are included for the identification of landslides and      agencies and communities (Paton and Johnston, 2001; Weg-
debris flows, wildfires, pyroclastic flows, and lava flow in-      mann, 2006; Brand et al., 2019). However, fieldwork is often
undation. HazMapper is intended for use by both scientists         inefficient and expensive compared to remote sensing meth-
and non-scientists, such as emergency managers and public          ods and it does a poorer job at temporally constraining nat-
safety decision-makers.                                            ural disasters. For example, the timing and extent of a se-
                                                                   ries of landsliding events over many years will be difficult
                                                                   and expensive to determine with field methods alone. In ad-
                                                                   dition, field-verified inventories of spatially extensive events
                                                                   may take many months to years before their completion. In
                                                                   this case, remote sensing methods may be able to temporally

Published by Copernicus Publications on behalf of the European Geosciences Union.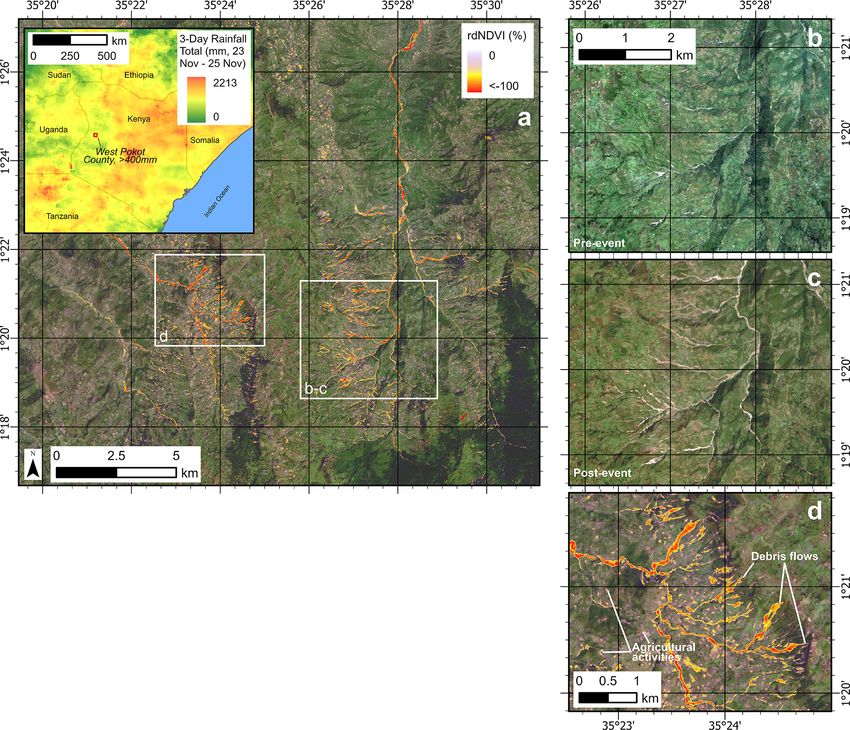
1496                      C. M. Scheip and K. W. Wegmann: HazMapper – global open-source natural hazard mapping

discern the cycle of events (Gold, 2004) and reduce the lag      sponse efforts for a large landslide disaster in the United
time between event occurrence and inventory development.         States, (e.g., 2014 Oso landslide, WA, or 2019 Montecito,
    The advent of rapid-repeat-cycle satellite datasets          CA, debris flows) can garner the attention and resources of
(e.g., multi-spectral, thermal) revolutionized the field of      local, state, and federal government agencies (Scholl and
remote sensing and our ability to observe landscape changes.     Carnes, 2017). In less affluent regions, however, response
These data have been utilized since the 1970s (e.g., Landsat)    efforts may be less intensive and timely, risking increased
to observe, monitor, and track landscape change (Lauer et al.,   loss of life. An overarching goal of HazMapper is to lever-
1997). In 2008, NASA began offering Landsat datasets for         age rapid scientific analysis and computing tools for global
free to the general public via the internet (Woodcock et al.,    natural hazard awareness. HazMapper is publicly accessible
2008), and by now, the entire archive is available online.       at https://hazmapper.org/ (last access: 29 April 2021).
Subsequent satellite networks and payloads (e.g., Moderate
Resolution Imaging Spectroradiometer – MODIS, Sentinel)
have improved capabilities, and increasingly advanced            2   Design principles
satellite networks continue to be developed (e.g., Hoffman
et al., 2016; Langhorst et al., 2019). Some traditional uses     Traditional GIS analysis consisting of downloading satellite
for satellite observations include identifying landslides and    images and processing on local machines has several lim-
debris flows (e.g., Tillery and Rengers, 2019), identifying      itations in the modern computing environment. These lim-
wildfire (e.g., Miller and Thode, 2007; Amos et al., 2019),      itations are exacerbated when attempting to perform spa-
volcanic monitoring (e.g., Cando-Jácome and Martínez-            tially expansive analysis, such as identifying far-field effects
Graña, 2019), identifying deforestation (e.g., Hansen et al.,    of a natural disaster (e.g., analyzing hundreds of kilometers
2013; Green and Sussman, 1990; USGS, 2019), identifying          around an earthquake’s epicenter for coseismic mass wast-
urban change and development (e.g., Masek et al., 2000;          ing). Further, the potential need to observe many pre- or
Schneider, 2012), and ecological monitoring and change           post-event images due to challenges such as cloud cover or
detection (e.g., Zhou et al., 2001; Meentemeyer et al., 2004),   atmospheric aerosols can hinder this workflow by requiring
among others.                                                    the analyst to repeat the data download–process routine. This
    Analysis of remote sensing data has traditionally been       fixed-extent processing routine inhibits the analyst from ex-
performed by trained analysts on high-powered computers,         ploring impacts without stopping analysis to download and
which can create a resource barrier for fiscally strained com-   process additional data.
munities or those without advanced training. Combining the          In the context of these limitations, HazMapper was devel-
open-access nature of these datasets with modern computa-        oped in Google Earth Engine because the platform provides
tional power available via cloud computing is a recent de-       some key advantages compared to traditional download–
velopment that has powerful implications for natural disaster    process routines. For example, the platform’s architecture
monitoring (Kirschbaum et al., 2019). Google Earth Engine        initiates geospatial processing updates as the user navigates
is a remote sensing data analysis platform designed to take      the map. Because of this feature, HazMapper can be used
advantage of Google’s infrastructure for data storage, access,   to quickly evaluate spatially expansive hazards by panning
processing, and visualization (Gorelick et al., 2017).           or zooming without downloading any data. The source code
    HazMapper (Hazard Mapper) is an open-access applica-         for HazMapper initiates data processing on remote servers
tion developed in Google Earth Engine for the rapid char-        without requiring any specialized or licensed software and
acterization of natural disasters tailored to both the scien-    can be performed on any internet-connected device. Typical
tific and the emergency management communities (Fig. 1).         processing times on HazMapper are less than 1–2 min, al-
HazMapper is useful for monitoring landscape change that         lowing users to adjust variables and visualization parameters
results in the removal or recovery of terrestrial vegetation     to rapidly assess the potential impact of natural hazards at
associated with a natural disaster or human activities. The      a specific location or across a region of interest and to test
platform is not currently suitable for use in non-vegetated      hypotheses about the spatial and temporal extent of a natu-
environments (e.g., polar, high-altitude, or desert regions).    ral hazard event. Google Earth Engine allows users to create
    While the underlying mathematics are not novel, HazMap-      public-facing applications (such as HazMapper), further in-
per democratizes multi-spectral satellite data processing for    creasing the accessibility of processing routines to specialists
the evaluation of natural hazards by leveraging the accessi-     in the field as well as to the scientifically curious public.
bility and computational power of Google Earth Engine. Se-          HazMapper is designed around user-input variables in a
lect case studies are discussed here and include both rainfall   graphical user interface (GUI). The user is able to modify
and seismically triggered mass wasting, wildfire, pyroclas-      the following variables: dataset selection (Landsat 7, Land-
tic flow, and landscape burial by lava flows resulting from a    sat 8, Sentinel-2), event date, pre-event time window, post-
fissure eruption. In the aftermath of large natural disasters,   event time window, maximum cloud cover for analysis, and
the level of emergency response can vary based on avail-         slope thresholds (Table 1). These variables can be updated
able resources for the region or country. For example, re-       throughout the use of the tool to aid in identifying hazard-

Nat. Hazards Earth Syst. Sci., 21, 1495–1511, 2021                              https://doi.org/10.5194/nhess-21-1495-2021
C. M. Scheip and K. W. Wegmann: HazMapper – global open-source natural hazard mapping                                                     1497

Figure 1. User interface of the HazMapper application in Google Earth Engine. Moving counterclockwise around the interface: (a) digi-
tization tools allow the user to digitize features of interest as points, lines, or polygons. (b) An example window allows users to explore
five curated examples. Data on this map show results from Example 1: November 2019 rainfall-triggered mass wasting, West Pokot County,
Kenya. (c) Users can display rdNDVI (relative difference in the normalized difference vegetation index) results from a single point by click-
ing at a location on the map. The displayed result is in the format “(latitude, longitude), rdNDVI result.” (d) The parameters window allows
users to select the various input values, as further explained in Table 1 and Sect. 4.2 of the Discussion. This panel also contains the Download
button, which initiates the population of download links as seen in E. The Update Map button will restart data processing following user
modification of the event parameters. (e) Download links for the resulting datasets allows users to save data directly to their local disk for
further analysis and processing as desired. If any digitized geometries are present, a digitized-geometries link will allow users to save a
Google Earth-compatible keyhole markup language (KML) file. (f) The Layers pane contains four consistent layers, including a hillshade
DEM, the greenest composite pre- and post-event pixel images, and the rdNDVI image. Users can choose to turn on/off each layer as well as
to adjust the layer transparency. (g) The default basemaps available in Google Earth Engine include satellite imagery with or without labels
and a standard borders map with or without terrain data. Notice that the URL reflects current HazMapper parameters. URLs are automatically
updated during use of the app. This design feature facilitates sharing of finds in HazMapper among colleagues by simply copying and pasting
the URL into an email or instant message chat screen, for example.

stricken locations. The basemap options are Google’s global               a disaster. Additionally, tropical regions of elevated rainfall
terrain or satellite imagery. The resulting data layers are dis-          and topography, thus typical of mass wasting or flooding haz-
played in a layers pane, available for toggle and transparency            ards, may experience cloud cover for a substantial portion of
adjustment.                                                               the annual climate cycle.
   Traditional remote-sensing-based landslide mapping is                     To overcome potentially opaque atmospheric conditions
performed by analysts observing change in aerial pho-                     that might be caused by aerosols including water vapor
tographs (e.g., Malamud et al., 2004; Wegmann, 2006;                      (clouds), smoke, mineral matter (dust), or anthropogenic pol-
Abancó et al., 2020). This method relies on single pre- and               lution (smog), HazMapper capitalizes on a technique within
post-event scenes and is hampered when unfavorable atmo-                  Google Earth Engine to generate and perform calculations on
spheric conditions exist. In the immediate aftermath of natu-             a greenest-pixel composite (Fig. 2). The compositing method
ral hazards that are initiated atmospherically (e.g., rainfall-           utilizes data from many images, reducing artifacts present
triggered mass wasting) or volcanically (e.g., eruptions), it is          from clouds and other aerosol particles in a given single im-
not uncommon for imagery to be obscured by clouds or ash                  age. The greenest-pixel composite is a single composite or
plumes, respectively. In cases of tropical or subtropical cy-             tiled image generated from all images within the user-defined
clones, cloud cover may persist for days to weeks following               pre- and post-event window that records the pixel with the

https://doi.org/10.5194/nhess-21-1495-2021                                        Nat. Hazards Earth Syst. Sci., 21, 1495–1511, 2021
1498                          C. M. Scheip and K. W. Wegmann: HazMapper – global open-source natural hazard mapping

Table 1. HazMapper input variables, definitions, and examples.

       Input variables          Definition                                                                    Example
       Dataset                  Dataset to use for analysis, currently Landsat 7, Landsat 8, or Sentinel-2    Sentinel-2 (10 m) 2015+
       Event date               Date of storm, earthquake, weather event, etc.                                9 December 2016
       Pre-event window         The number of months to use for observing the greenest pixel-by-pixel         12
                                conditions prior to the event
       Post-event window        The number of months to use for observing the greenest pixel-by-pixel         3
                                conditions following the event
       Maximum cloud            The maximum percentage of a scene obscured by clouds and still used           30
       cover                    in the analysis; the cloud-cover percent is embedded in the metadata for
                                each Landsat or Sentinel scene
       Slope threshold          A minimum topographic slope value in degrees, less than which will be         0.01
                                omitted from the data visualization; this is helpful to remove water bodies
                                like lakes and adjacent oceans in coastal regions

                                                                             HazMapper relies on a relative difference in the NDVI
                                                                          technique (rdNDVI, Eq. 2). Instead of differencing true-
                                                                          color composites (i.e., red–green–blue bands), HazMapper
                                                                          exploits changes in surface vegetation by developing and dif-
                                                                          ferencing an NDVI band from the greenest-pixel composite
                                                                          images:
                                                                                                                     !
                                                                                         NDVIpost − NDVIpre
                                                                          rdNDVI =       p                               × 100,         (2)
                                                                                           NDVIpre + NDVIpost

                                                                          where NDVIpre and NDVIpost are the NDVI images of the
                                                                          pre- and post-event greenest-pixel composites, respectively.
                                                                             The results of the processing routine indicate a normalized
                                                                          percentage of the NDVI gained or lost. The normalization
                                                                          parameter includes NDVIpre to account for pixels that had a
                                                                          low NDVI value before the event (e.g., existing mass-wasting
                                                                          scars, urban areas). The metric follows Norman and Christie
                                                                          (2020), who propose this method for addressing fractional
Figure 2. Suggested HazMapper workflows, including a branching            pixels, where the NDVI signal response of vegetation is not
point to share the URL or continue with analysis. Workflow cul-           consistent across a single pixel (e.g., both forest and grasses)
minates in downloading geographic tagged image file format (Geo-          and the non-linear responsiveness of the NDVI. Results may
TIFF) files suitable for input into a GIS for advanced analysis or        exceed ±100 %. rdNDVI results of < −100 % are possible
visualization functions. If the user digitizes key areas of interest      due to the ability of VIR to increase to greater than the NIR
or hazards such as mass-wasting processes, burn, or inundation ex-        value, causing a polarity change of the NDVI. Results illus-
tents, these can be exported as KML files for sharing or viewing in
                                                                          trate areas of the landscape that have either gained (increase
Google Earth.
                                                                          in NDVI pixel values) or lost (decrease in NDVI pixel val-
                                                                          ues) vegetation across the event as constrained by the pre-
highest normalized difference vegetation index (NDVI) re-                 event-window and post-event-window date ranges. For visu-
sult, or the “greenest” pixel (Eq. 1).                                    alization purposes, HazMapper applies a color scale within
                                                                          the domain of −50 % to +50 %, simplifying the analysis to

              NIR − Red
                                                                         highlight areas with vegetative loss or gain. Additionally, an
NDVI =                    ,                                      (1)      inspector tool allows a user to click anywhere within the map
              NIR + Red
                                                                          domain, upon which a latitude–longitude coordinate pair and
where NIR is the near-infrared response and Red is the visi-              the rdNDVI pixel value will be returned interactively to the
ble red response.                                                         user.

Nat. Hazards Earth Syst. Sci., 21, 1495–1511, 2021                                         https://doi.org/10.5194/nhess-21-1495-2021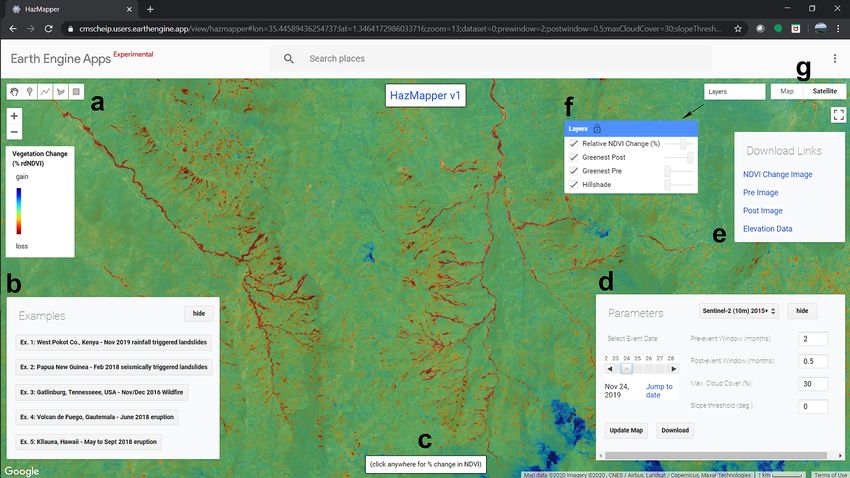
C. M. Scheip and K. W. Wegmann: HazMapper – global open-source natural hazard mapping 1499
The three resulting data layers (greenest-pixel composite events but to showcase various applications of a rdNDVI
from pre- and post-event and rdNDVI) and a Shuttle Radar cloud-computing method.
Topography Mission (SRTM)-derived 30 m resolution hill-
shade layer (for areas between 60◦ N and 60◦ S latitude) are 3.1 Mass wasting
added to the standard Google Earth Engine layer pane. These
layers can be toggled on/off and their transparency modified Landslide events are a primary contributor to topographic
with a slider to help with visualization. erosion and landscape evolution (Korup et al., 2010), make
Digitization of areas of interest from the map domain, for available significant rock-bound and organic (soil and above-
example, debris flow initiation sites, landslide extents, or po- ground biomass) carbon for global biogeochemical cycling
tential wildfire burn areas, can be recorded using Google’s (Hilton et al., 2008), and caused at least 55 997 non-seismic
default mapping tools. Points, lines, and polygons may be landslide fatalities between 2004–2016 and billions (USD) in
digitized in one or multiple layers. During download from global losses and damaged-infrastructure costs (Froude and
HazMapper, these digitized geometries can be saved as a Petley, 2018; Emberson et al., 2020; Kirschbaum et al., 2015;
keyhole markup language (KML) file for viewing in Google Petley, 2012). In the United States alone, annual losses to
Earth or sharing among an emergency response team or be- mass-wasting events exceed USD 3 billion (Spiker and Gori,
tween research colleagues. 2003; Burns, 2007).
HazMapper includes an example panel in the lower left A significant amount of research has been performed on
of the tool, pointing the user to five real-world natural hazard remotely detecting mass-wasting events such as debris flows,
case studies (Fig. 1). The panel is intended to serve as a learn- debris slides, or rock slides (Kirschbaum et al., 2019; Am-
ing platform for new users to work with curated examples to atya et al., 2019; Mondini et al., 2011; Lu et al., 2019; Huang
explore these events. et al., 2020; Tsai et al., 2010; Yang et al., 2013). Pixel-based
Additional sharing of HazMapper results is made avail- or object-oriented analysis (OOA) methods rely on charac-
able via the use of variable tags within the URL. During us- terizing change to the Earth surface via multi-spectral satel-
age of the tool, URL tags for the required event parameters lite imagery and correlating these changes to mass-wasting
are updated. Sharing of the updated link with a colleague events (e.g., Lu et al., 2019). Recognizing that in forested
or research partner allows that person to open HazMap- areas, landslides denude the landscape of vegetation, NDVI
per to the same viewport and updates the map function to change detection methods have been used for identifying
the same event parameters. For the case studies discussed landslides in many mid-latitude regions (Huang et al., 2020;
here, we have utilized the North Carolina State University Tsai et al., 2010; Mondini et al., 2011; Lu et al., 2019; Yang
Go Links URL service. For example, https://go.ncsu.edu/ et al., 2013).
hazmapper-kenya (last access: 29 April 2021) directs the user
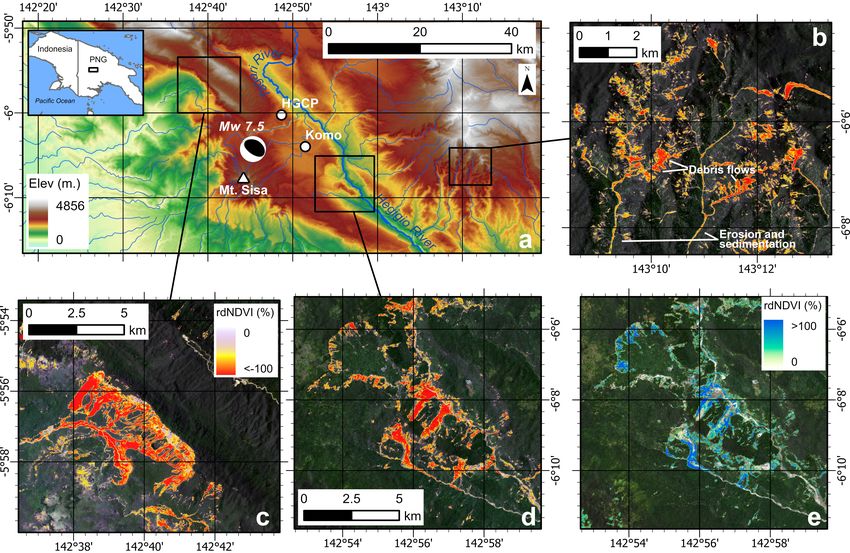
3.1.1 Rainfall-triggered debris flows, West Pokot
to the curated example of rainfall-triggered debris flows lo-
County, Kenya, 23 November 2019
cated in West Pokot County, Kenya, in November 2019 (see
Sect. 4.1.1). All case studies discussed in this paper are avail- In middle to late November 2019, regions in eastern Africa
able pre-loaded from the HazMapper launch screen, under experienced many days of intense rainfall. West Pokot
the “Show Examples” tab, or as direct URL links (see “Code County, Kenya, located in the rugged terrain of the East
and data availability”). African Rift valley in western Kenya (Fig. 3), received more
Data download is an important component of HazMapper. than 400 mm of rainfall within the period 23–25 November
This function allows for further analysis of processing re- (Huffman et al., 2014). This rainfall event triggered failures
sults, including incorporation into emergency operation map- of steep, soil-mantled hillslopes along the western rim of the
ping platforms and advanced scientific analysis or visualiza- East African Rift valley (Elgeyo Escarpment), initiating fa-
tion. The user can download the (1) rdNDVI image, (2) pre- tal debris flows that destroyed homes, agricultural fields, and
event and (3) post-event greenest-pixel composite images, infrastructure.
(4) elevation and hillshade images derived from the global As early as 4 December 2019 (11 d following the mass-
30 m SRTM dataset, and/or (5) any user-digitized geome- wasting event), Sentinel-2 images with limited cloud cover
tries delineating points or areas of interest. Raster data layers were available, and HazMapper was utilized to locate the
are distributed in geographic tagged image file format (Geo- debris flows (Fig. 3; see Supplement). In addition to the
TIFF) and digitized geometries in KML. location of debris flows, the rdNDVI also captured ripar-
ian vegetation loss and sedimentation along the banks of
lower-gradient rivers as they drained the mountainous ter-
3 Results – case study examples rain where the mass wasting occurred. Agricultural harvest-
ing and planting activities are also apparent in the rdNDVI
The five curated examples included in the example panel results, evident by their position on low-relief terrain outside
(lower left of tool) are discussed herein. The intent of these of the drainage channels (Fig. 3D).
case studies is not to provide an exhaustive analysis of the
https://doi.org/10.5194/nhess-21-1495-2021 Nat. Hazards Earth Syst. Sci., 21, 1495–1511, 2021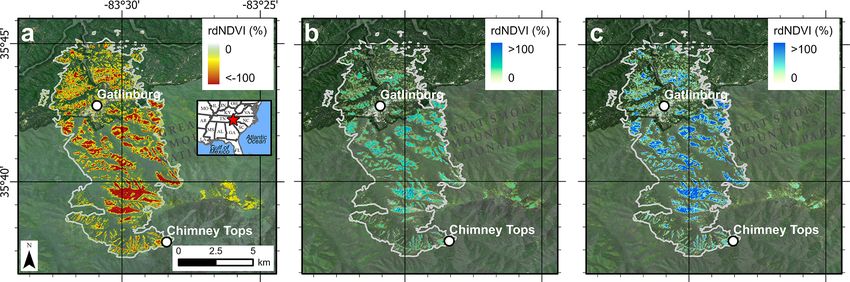
1500                        C. M. Scheip and K. W. Wegmann: HazMapper – global open-source natural hazard mapping

Figure 3. rdNDVI change detection images and greenest-pixel composites following the 23 November 2019 rainfall-induced mass-wasting
event in West Pokot County, Kenya. See inset map for location and 3 d rainfall totals from storm, courtesy of NASA Integrated Multi-
satellitE Retrievals for GPM (IMERG) program. Parameters – dataset: Sentinel-2; event date: 23 November 2019; pre-window: 2 months;
post-window: 0.5 months; maximum cloud cover: 30 %; slope threshold: 0◦ . West Pokot County received > 400 mm of rain in the 72 h
period 23–25 November, triggering landslides, debris flows, and floods during the heaviest rainfall on 23 November. (a) rdNDVI illustrates
hillslope and low-order stream channel disturbance, leading to debris flows on the upper slopes and vegetation loss and sedimentation along
river channels flowing toward the north and northwest. Landscape change is easier to interpret with rdNDVI compared to observations
based only on pre- and post-event color images (b and c). Base image is post-event. (b) Pre-event greenest-pixel composite image showing
relatively green vegetative cover across landscape. (c) 0.5-month post-event greenest-pixel composite illustrates reduction in vegetation in
landslide and debris flow tracks and along-river trunk channel. This reduction in vegetation is noted by negative rdNDVI values as seen in
(a). (d) Close-up detail of negative rdNDVI values associated with mass wasting. Rectilinear patches of negative rdNDVI values in western
area of (d) illustrate agricultural clearing or harvest activities across the event parameters. In mass-wasting applications, further use of
slope thresholding and interpretation based on landscape morphology will reduce these undesired rdNDVI artifacts. User interpretation of
output rdNDVI polygon areas is always warranted in order to minimize unwanted artifacts. Panels (b) and (c) have the same map scale.
Panels (a) and (d) have the same rdNDVI color scale. rdNDVI and greenest-pixel composite data exported from HazMapper, available at
https://go.ncsu.edu/hazmapper-kenya (last access: 29 April 2021).

Nat. Hazards Earth Syst. Sci., 21, 1495–1511, 2021                                       https://doi.org/10.5194/nhess-21-1495-2021
C. M. Scheip and K. W. Wegmann: HazMapper – global open-source natural hazard mapping                                      1501

3.1.2   Seismically triggered mass wasting, Southern              aftershocks. Future research should consider utilizing these
        Highlands, Papua New Guinea, Mw 7.5, 25                   time-stamped change detection images to understand the
        February 2018                                             progression of failures during an earthquake sequence.
                                                                     While identifying vegetation loss for locating geohazards
On 25 February 2018, a Mw 7.5 earthquake struck the South-        is a key characteristic of a mass-wasting event response,
ern Highlands of Papua New Guinea (PNG) along the Papuan          identifying subsequent vegetation recovery can serve as a
Fold and Thrust Belt (Wang et al., 2019), triggering thou-        proxy for the reduction in associated hazard (Shen et al.,
sands of mass-wasting events, damming the Tagari River, and       2020). Simple modifications to event parameters in HazMap-
impacting numerous communities across the region. Over a          per, for example by changing the “event date” to a time after
span of 2 months, five aftershocks of Mw > 6 struck the same      the occurrence of the disturbance event, can aid in observing
region (Wang et al., 2019). Nearly 3 years after the event, a     vegetation recovery in landslide scars, suggesting establish-
published mass-wasting inventory is not available. Fatalities     ment and growth of early successional species like grasses
from coseismic mass wasting can be up to an order of mag-         and shrubs (Fig. 4D). These stabilizing root masses buttress
nitude greater than fatalities resulting from the earthquake      further soil loss and erosion and, thus, decrease the associ-
itself (Budimir et al., 2014). The 2018 Papua New Guinea          ated downslope sediment transport from the zone of mass
earthquake and associated mass wasting resulted in at least       wasting.
160 fatalities (Wang et al., 2019), but the individual con-
tributions (e.g., building collapse, burial by hillslope mass     3.2     Wildfire
movements) are not well understood on account of this event
occurring in a rural and remote part of the country.
                                                                  Wildfire experts have been utilizing multi-temporal, multi-
   Seismic shaking is a primary triggering mechanism for
                                                                  spectral imagery to evaluate burn extents following wildfires
mass movement mobilization on steep mountain terrain. Co-
                                                                  since at least the launch of the Landsat thematic mapper pro-
seismic mass wasting, therefore, strongly influences ero-
                                                                  gram in 1984 (Keeley, 2009; Miller and Thode, 2007; Cocke
sional budgets of mountain belts (Hovius et al., 1997; Keefer,
                                                                  et al., 2005). Multi-spectral indices such as the popular nor-
1994; Korup et al., 2010; Hilton et al., 2008). Keefer (2002)
                                                                  malized burn ratio (NBR) and its derivatives (e.g., difference,
has demonstrated an empirical relationship based upon a
                                                                  relative difference) are widely employed to assess ecosystem
global dataset between the moment magnitude of a main-
                                                                  impacts following a wildfire (Miller and Thode, 2007; Cocke
shock and the maximum distance from the epicenter that
                                                                  et al., 2005). Discussion and debate about the most appro-
seismically induced landslides are likely to be observed for
                                                                  priate multi-spectral index to utilize for understanding fire
the entire earthquake sequence (including aftershocks). For
                                                                  impacts in wildland fire science are ongoing (Keeley, 2009;
this Mw 7.5 earthquake, the corresponding predicted maxi-
                                                                  Miller and Thode, 2007; Escuin et al., 2008; Amos et al.,
mum distance is approximately 300 km. HazMapper was uti-
                                                                  2019). The rdNDVI technique (Eq. 2) utilized in HazMapper
lized to rapidly assess regions within several tens of kilo-
                                                                  is one such index (Norman and Christie, 2020).
meters from the epicenter, and hundreds of slides and flows
were located (Fig. 4). Additional mass wasting was noted
when expanding the analysis window to the predicted 300 km        3.2.1    Chimney Tops 2 fire, Tennessee, USA,
maximum distance based on the earthquake magnitude. Fur-                   November 2016
thermore, we noted possible coseismic slides and flows as
far as several hundred kilometers west of the epicenter in the    In the autumn of 2016, the southern Appalachian Mountains
Maoke Mountains of Indonesia. Mass wasting is common              experienced drought conditions that contributed to dozens of
in the region, and these events could have unique triggers        wildfires that totaled some 75 000 acres (30 351 ha; Andersen
(e.g., rainfall triggered). However, restricting pre- and post-   and Sugg, 2019). Originating within Great Smoky Mountains
event time windows to as little as 2 months bracketing the        National Park (GRSM), the Chimney Tops 2 fire was first dis-
Mw 7.5 mainshock demonstrates consistent timing with the          covered on 23 November 2016 (National Park Service, 2017;
25 February 2018 earthquake.                                      Jiménez et al., 2018). The fire initially ignited on top of the
   Due to difficulties in ascertaining high-temporal-             north spire of Chimney Tops inside GRSM (Guthrie et al.,
resolution sequences of mass-wasting events following             2017). Unexpected wind conditions facilitated the rapid ex-
seismic shaking, it is typically difficult to determine if par-   pansion of the fire perimeter, and fires were noted inside the
ticular events were triggered by just the mainshock or also       city limits of Gatlinburg, Tennessee, 10 km from the igni-
by aftershocks. Thus, research to date has focused on earth-      tion point, by 28 November (National Park Service, 2017;
quake sequences, inclusive of all associated shaking (e.g.,       Guthrie et al., 2017). The Chimney Tops 2 fire burned some
Keefer, 2002). HazMapper allows researchers to temporally         17 000 acres (6880 ha) before eventually merging with other
constrain landscape change and, in certain circumstances,         eastern Tennessee wildfires (Guthrie et al., 2017). Impacts
may be useful for understanding hillslope failure sequences       from the fire included 14 fatalities, 14 000 evacuations, over
for large earthquakes that may include landslide-inducing         2500 structures lost, and an estimated USD 2 billion in dam-

https://doi.org/10.5194/nhess-21-1495-2021                                 Nat. Hazards Earth Syst. Sci., 21, 1495–1511, 2021
1502 C. M. Scheip and K. W. Wegmann: HazMapper – global open-source natural hazard mapping
Figure 4. rdNDVI change detection images and greenest-pixel composites following a landsliding event triggered by the Mw 7.5 earthquake
on 26 February 2018 in the Southern Highlands of Papua New Guinea (PNG). Inset map shows location within the country. Parameters for
(a–d) – dataset: Sentinel-2; event date: 25 February 2018; pre-window: 12 months; post-window: 9 months; maximum cloud cover: 30 %;
slope threshold: 0.05◦ . (a) Elevation map for the Southern Highlands of PNG with epicenter (focal mechanism) plotted. HGCP is Hides
Gas Conditioning Plant, an ExxonMobil liquefied natural gas facility. Komo is the nearest large town, and Mt. Sisa is a stratovolcano to the
south. (b–d) Select areas with high mass-wasting density. Base images are the pre-event greenest-pixel composite, and (b–d) have the same
rdNDVI color scale. (e) Recovery change detection image illustrating increases in vegetation within areas of previous mass wasting. These
increases in vegetation are expected to increase root mass and provide a stabilizing effect for exposed soils. Parameters – dataset: Sentinel-2;
event date: 26 August 2018; pre-window: 6 months; post-window: 6 months; maximum cloud cover: 30 %; slope threshold: 0.05◦ . rdNDVI
and greenest-pixel composite data exported from HazMapper, available at https://go.ncsu.edu/hazmapper-png (last access: 29 April 2021).
age, and it was the largest wildland fire in recorded history in ery monitoring via remote sensing data is not a novel ap-
the park (National Park Service, 2017; Guthrie et al., 2017). proach (Chen et al., 2014; Cuevas-González et al., 2009);
HazMapper was utilized to observe vegetation loss and, however, the rapidity of observing the recovery via an open-
by proxy, the severity and burn extent (Fig. 5). In addition access remote-processing and cloud-based platform is, to our
to the simple fire perimeter, the HazMapper method also il- knowledge, novel.
lustrates burn severity by way of the rdNDVI, highlighting
that the most severe burn, as indicated by greater-percent rd- 3.3 Volcanic eruptions
NDVI decreases, occurred along ridges and upper elevations,
consistent with typical wildland fire behavior (Teie, 2018). Between 1600 and 2010 CE, 533 volcanic events have re-
Following the identification of vegetation loss, subsequent sulted in at least 278 880 fatalities (Auker et al., 2013).
post-fire vegetative re-greening of the landscape is depicted The number of fatalities each year attributable to volcanic
as the rdNDVI increases. Figure 5B and C illustrate recov- events is increasing with time (Auker et al., 2013), suggest-
ery between the first and second growing seasons following ing that as a species, we are not overcoming the danger asso-
the fire (2017 to 2018) and from the first through the third ciated with volcanic hazards. Volcanologists began using re-
growing seasons (2017 to 2019), respectively. Forest recov- mote sensing tools, particularly multi-spectral satellite data,
as early as the mid-1980s to monitor volcanic heat signa-
Nat. Hazards Earth Syst. Sci., 21, 1495–1511, 2021 https://doi.org/10.5194/nhess-21-1495-2021C. M. Scheip and K. W. Wegmann: HazMapper – global open-source natural hazard mapping 1503
Figure 5. rdNDVI change detection images of vegetation loss and recovery during and following the Chimney Tops 2 fire that impacted
Gatlinburg, Tennessee, USA, and surrounding communities in November–December 2016 (see location map to right). (a) rdNDVI illustrates
vegetative loss during the fire. Gray line is the 6936 ha (17 140 acres) published extent of the burn (USGS, 2020). Note the preferential
vegetative loss (burn) along ridgetops. Base image is pre-event. Parameters – event date: 13 December 2016; pre-window: 12 months;
post-window: 9 months. (b) Change detection image of rdNDVI illustrating vegetative recovery between the first (2017) and second (2018)
growing seasons following the fire. Base image is post-event. Parameters – event date: 13 December 2017; pre-window: 12 months; post-
window: 12 months. (c) Vegetative recovery (rdNDVI) between the first (2017) and third (2019) growing seasons following the fire. Note
the general pattern of continuation and expansion of re-greening of the landscape, indicated by generally higher rdNDVI values (blues).
Base image is post-event. Parameters – event date: 13 December 2017; pre-window: 12 months; post-window: 24 months. For all panels –
dataset: Sentinel-2; maximum cloud cover: 30 %; slope threshold: 0◦ . rdNDVI and greenest-pixel composite data exported from HazMapper,
available from https://go.ncsu.edu/hazmapper-chimneytops (last access: 29 April 2021).
tures as precursors to eruptive activity (Rothery et al., 1988). lope hazards (Naismith et al., 2019). The 3–5 June 2018
More recently, synthetic aperture radar data aid in monitoring sub-Plinian eruption generated pyroclastic flows in excess of
ground deformation associated with magmatic intrusions or 11 km in length, resulted in hundreds of fatalities, and de-
eruptions (Hooper et al., 2004). The MODIS multi-spectral stroyed the rural community of San Miguel Los Lotes (Par-
sensor is commonly used to monitor thermal characteristics dini et al., 2019; Naismith et al., 2019).
and to detect volcanic eruptions (Wright et al., 2002); how- HazMapper was utilized to observe landscape change fol-
ever, its variable 250-to-1000 m pixel size inhibits the use of lowing the 3–5 June 2018 Volcán de Fuego eruption (Fig. 6).
the platform for adequately identifying many downslope haz- Summit effects of the eruption are observed via HazMap-
ards associated with eruptions. Downslope hazards may in- per, as well as pyroclastic flows down the west, south, and
clude lava flows, ballistic projectiles, pyroclastic flows, and east flanks of the stratovolcano for up to 11 km. Due to
lahars (Blong, 1984). Following eruptions, HazMapper’s use Fuego’s consistent eruptive activity and loose, steep, vol-
of 30 m Landsat or 10 m Sentinel-2 data is well suited to canic sediments, vegetation is generally sparse near the sum-
identifying the spatial extent of these hazards, which may be mit (Fig. 6B). However, as indicated by the rdNDVI results,
only meters to tens of meters wide (e.g., a lahar track) and loss of the limited vegetation was evident in 30 m Landsat
may travel many kilometers from the volcano. data. Pyroclastic flows from the 3–5 June 2018 eruption are
evident in the main valleys draining away from the volcano.
3.3.1 Pyroclastic flows – Volcán de Fuego, Antigua, Riparian vegetation loss and sedimentation was noted for
Guatemala, 3 June 2018 > 60 km to the south-southwest from the volcano, and in one
case, this impact was observed as far as the confluence with
Volcán de Fuego is a subduction zone stratovolcano located the Pacific Ocean (Fig. 6A).
in southwestern Guatemala, near the city of Antigua. Since
1524, Fuego has produced 51 eruptions with a volcanic ex- 3.3.2 Effusive lava flows – lower east rift zone (LERZ),
plosivity index ≥ 2 (Global Volcanism Program, 2013). The Kı̄lauea Volcano, Hawaii, USA, May–September
volcano is renowned for its consistent low-intensity Strom- 2018
bolian eruptions punctuated by larger, more violent, sub-
Plinian eruption cycles (Naismith et al., 2019). The most re- Kı̄lauea is a basaltic shield volcano built from lavas derived
cent eruptive cycle of Fuego, ongoing since 2015, consists from deep-mantle-driven processes. The magma feeding the
of an increase in paroxysmal eruptions and resulting downs- volcano is distributed through a network of shallow rift struc-
https://doi.org/10.5194/nhess-21-1495-2021 Nat. Hazards Earth Syst. Sci., 21, 1495–1511, 20211504 C. M. Scheip and K. W. Wegmann: HazMapper – global open-source natural hazard mapping Figure 6. rdNDVI change detection images and greenest-pixel composites following the 3–5 June 2018 volcanic eruption of Volcán de Fuego 40 km southwest of Guatemala City, Guatemala. White triangle denotes summit. Parameters – dataset: Landsat 8; event date: 3 June 2018; pre-window: 12 months; post-window: 3 months; maximum cloud cover: 30 %; slope threshold: 0.05◦ . (a) rdNDVI across the event illustrates loss of vegetation on upper flanks of the volcano summit and influence of pyroclastic flows on volcano flanks and downstream areas. San Miguel Los Lotes is a small community on the southeastern flanks of Volcán de Fuego that was heavily impacted during the eruption, including at least 25 fatalities. Note significant riparian vegetation loss in channels flowing south to southwest away from volcano. Base image is post-eruption. (b–d) Close-up detail of Volcán de Fuego. (b) Pre-eruption greenest-pixel composite image of volcano. Note the limited vegetation near the summit. (c) Detailed image of volcano summit post-eruption greenest-pixel composite. A typical color composite pre-post comparison can be performed to locate areas impacted by the eruption and resulting pyroclastic flows, however, rdNDVI as shown in (d) provides a more rapid approach to identifying impacted areas and adds additional detail such as riparian vegetation loss that is more difficult to observe in a standard (RGB) color image comparison. (d) rdNDVI of the volcano following the eruption with notable observations annotated. Panels (b–d) have the same scale. Panels (a) and (d) use the same rdNDVI color scale. rdNDVI and greenest-pixel composite data exported from HazMapper, available at https://go.ncsu.edu/hazmapper-fuego (last access: 29 April 2021). Nat. Hazards Earth Syst. Sci., 21, 1495–1511, 2021 https://doi.org/10.5194/nhess-21-1495-2021
C. M. Scheip and K. W. Wegmann: HazMapper – global open-source natural hazard mapping 1505
tures and was pooled in a lava lake at its summit until com-
mencement of the 2018 eruptive sequence. Eruptive charac-
teristics have varied through time including a combination
of periods of summit and/or rift eruptions and caldera col-
lapse, infill, and overflow (Holcomb, 1987). The most recent
2018 caldera collapse–rift eruption sequence was well cap-
tured by a dense array of scientific instrumentation and so-
cial networking, adding significant information to our present
understanding of the Kı̄lauea complex (Neal et al., 2019).
The 2018 event culminated in the inundation of 35.5 km2
of Hawaii’s Big Island and the destruction of hundreds of
homes. Fortunately, there are no known fatalities from the
event, likely due to the slow-moving nature of the eruption
and the significant resources applied during the disaster man-
agement response efforts.
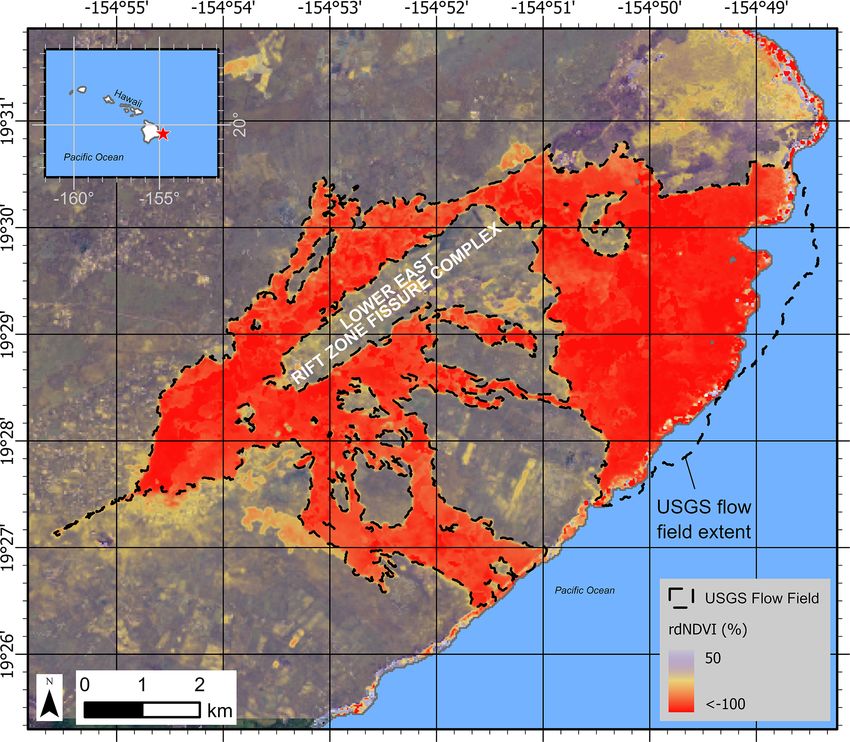
HazMapper was utilized to observe surface changes within
the lower east rift zone (LERZ) following the cessation of the
rift flank eruption sequence (Fig. 7). Utilizing 30 m Landsat
data, the observed vegetation loss extending east and south-
Figure 7. rdNDVI change detection images and greenest-pixel com-
east from the LERZ approximates the published flow field
posites following 3 May–4 September 2018 lower east rift zone
from the 2018 eruption (Hawaiian Volcano Observatory staff, eruption of Kı̄lauea Volcano, Hawaii, USA. Parameters – dataset:
2018). Efforts to utilize HazMapper to monitor the advance Landsat 8; event date: 4 September 2018; pre-window: 12 months;
of the lava flows were hindered due to persistent cloud cover post-window: 6 months; maximum cloud cover: 30 %; slope thresh-
and volcanic gas emissions during the eruption. Addition- old: 0.05◦ . rdNDVI across the event illustrates loss of vegetation.
ally, the east-southeast extents of the lava flows generated Base image is post-eruption. Dashed black line is the published
additional landmass off the coast of Hawaii, but with no veg- extent of the lava flow field (Hawaiian Volcano Observatory staff,
etation to lose, this landscape change was not detected using 2018) for comparison to the HazMapper result. Notice the addi-
HazMapper. tional landmass added to the island by the eruption that is encap-
The 2018 Kı̄lauea eruption response benefited from sig- sulated by the lava flow perimeter polygon. Because there was no
nificant resource application by way of the existing Hawai- vegetation in this area before and after the eruption, the rdNDVI
method does not account for the new landmass. In future analy-
ian Volcano Observatory and the associated resources of the
ses, however, we expect to be able to identify vegetation growth on
US federal and Hawaii state governments and associated sci- the landmass. rdNDVI and greenest-pixel composite data exported
entific and resource protection agencies. This example, there- from HazMapper, available at https://go.ncsu.edu/hazmapper-lerz
fore, is highlighted to perform a first-order comparison of the (last access: 29 April 2021).
kind of results available with HazMapper, a free and open-
access toolset, to an on-the-ground effort with significant fi-
nancial, personnel, equipment, and computing resources and
attention (Fig. 7). For eruptions with less global attention tomated nor a semi-automated routine. The platform does
or in more remote regions, remote sensing results like those not predict where landslides have occurred or what areas
available with HazMapper alone may approximate lava flow were burned during a wildfire, for example. Instead, the plat-
inundation extents, guiding future response efforts or scien- form computes a very simple vegetation-based metric, which
tific research around the event. Furthermore, the utilization of in many cases can be indicative of a natural disaster. As
a consistent analysis platform between many eruptions may such, no accuracy assessments or omission–commission er-
aid in volcanic research globally. rors are included in the case studies presented here. HazMap-
per does, however, provide a solid platform for the develop-
ment and use of future semi-automation routines for various
4 Discussion natural disasters. Augmentation and testing of user-driven
semi-automation techniques utilizing machine learning for
4.1 Limitations landslide identification in HazMapper are in the developmen-
tal stage and will be discussed in a future paper.
In the era of big data and cloud computing, a utility like The underlying datasets in HazMapper allow users to con-
HazMapper increases the pace at which researchers can eval- strain the timing of an event to ≥ 5 d (Sentinel-2) or ≥ 16 d
uate global natural hazards. However, as with any analysis (Landsat). Imagery is typically available on Google Earth
platform, limitations exist. The most important limitation of Engine (GEE) within approximately 24 h of collection by the
HazMapper, at present, is that the platform is neither an au- satellite. Recognizing that during natural disasters, commu-
https://doi.org/10.5194/nhess-21-1495-2021 Nat. Hazards Earth Syst. Sci., 21, 1495–1511, 20211506 C. M. Scheip and K. W. Wegmann: HazMapper – global open-source natural hazard mapping
nity impacts can undergo many developments in this time tions to Earth Engine. We intend to monitor these activities
frame, differences in pre- and post-event images may require and update the HazMapper application as needed to mesh
some interpretation and cannot provide a day-by-day account with future changes to Earth Engine.
of ground conditions. This must be considered in the context
of alternative approaches, however. Traditional remote sens- 4.2 Use of the event parameters
ing studies often rely on single pre- and post-event images.
In these cases, it is an assumption of the analyst that the im- The event parameters window is designed to allow flexibil-
pacts occurred during the event being studied. For example, ity in analysis for various natural disaster types, geographies,
if a landslide is present in a post-event single image but not and objectives. The combination of the GUI layout and URL
a pre-event single image, it is often assumed that the land- updating is designed to promote rapid analysis of events with
slide occurred during the particular event under consideration different parameter combinations to best understand the nat-
(e.g., Huang et al., 2020; Lu et al., 2019). ural disaster. Event parameters are defined in Table 1, and
The timing of suitable datasets for an initial evaluation details regarding their usage are provided here:
of disaster impacts will depend on the timing of an event
– Dataset. This parameter allows the user to determine
relative to acquisition schedules of the Sentinel-2 or Land-
which dataset (Landsat 7, Landsat 8, or Sentinel-2) to
sat platforms, atmospheric conditions (e.g., cloud cover dur-
use for analysis. The coarser resolution of the Landsat
ing or following a rainfall-triggered mass-wasting event or
sensors (30 m) compared to the Sentinel sensors (10 m)
smoke from long-burning wildfires), and seasonal consider-
is faster to process and is suitable for analysis of larger
ations. Acquisition schedules are publicly available for both
regions (e.g., Sect. 3.3.2). The higher-resolution Sen-
platforms and can be used in conjunction with HazMapper to
tinel sensors are more applicable for identifying smaller
help responders understand when suitable datasets may be-
features, such as narrow debris flow tracks). Landsat 7 is
come available. Even if the imagery is not clear (e.g., cloudy,
included in HazMapper to allow analysis of events that
obscured by aerosols), performing the analysis generally
occurred as early as 1999. Following the May 2003 scan
takes seconds and, because of the URL-update feature, pro-
line corrector (SLC) mirror failure, individual Land-
vides a URL that can be saved offline and re-executed when
sat 7 images exhibit striping; however, the greenest-
new data are posted. Events that occur in the winter in tem-
pixel compositing methods of HazMapper can be lever-
perate environments can be difficult to discern because there
aged to mitigate these artifacts. By extending window
is minimal healthy green vegetation to lose during a disaster.
lengths, these gaps are filled with data from subsequent
In these cases, observing change in the pre- and post-event
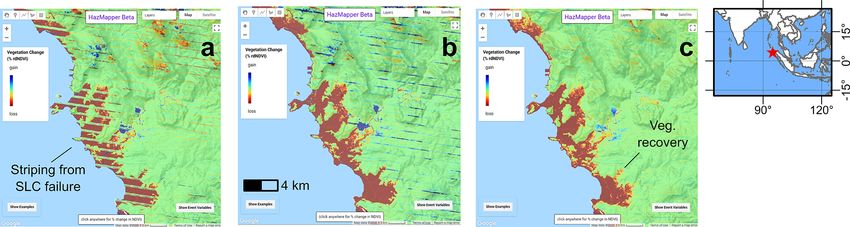
overpasses. As an example, Fig. 8 evaluates erosion,
color composite images may be helpful; however, analysis
vegetation removal, and sedimentation along a coast-
following the spring green-up of the landscape will often pro-
line of Indonesia following the 2004 Sumatra–Andaman
vide a more complete understanding of impacts.
seismogenic tsunami. A short-window-length (1-month
HazMapper only accesses datasets publicly hosted within
pre- and post-event) analysis is obscured by striping.
the Google Earth Engine Data Catalog. While many re-
By extending the window lengths, these artifacts are re-
searchers have the funding to pursue the use of datasets ac-
duced.
quired on a near-daily basis (e.g., from Planet Labs, Inc.),
HazMapper currently does not have a mechanism for ingest- – Event date. The event date is intended for demarcating
ing these data. the pre- and post-event periods for which to perform the
Two final limitations relate to the spatial extent of process- rdNDVI calculation. Generally this is a known value
ing and data downloads. Even with the large amounts of com- from the literature or news reports. However, by com-
putational power available with the platform, continental- bining this field with imagery acquisition schedules, this
scale analysis is typically not feasible. Long wait times for parameter can also be used to determine the date of a
data or their failure to load in HazMapper commonly results natural disaster. Date estimates can only be made within
when the user is trying to evaluate too large an area. Zoom- the margin of error that is approximated by the sen-
ing in will initiate reprocessing and data will usually begin to sor’s acquisition, (e.g., within 5 d if using Sentinel-2 or
load. Similarly, current external user downloads (e.g., users within 16 d if using Landsat).
of the application) are limited to 32 MB by Google. This
is approximately 400 km2 with Sentinel-2 (10 m pixel size) – Window lengths. Window lengths are measured in
data. HazMapper utilizes the entire view extent within the months and can be altered to capture more or fewer
user’s browser window when the download routine is initial- data before or after an event. This is useful when bal-
ized. If the area is larger than ∼ 400 km2 , the download win- ancing the need for cloud-free imagery with a level of
dow may not appear. If this occurs, the user should zoom in confidence in the timing of impacts from a natural dis-
to a larger scale. aster. For example, a small window length will allow
With all of these limitations, it is important to recognize the user to be confident in the timing of the natural
that Google is regularly making improvements and modifica- disaster impacts. For vegetation loss studies, this con-
Nat. Hazards Earth Syst. Sci., 21, 1495–1511, 2021 https://doi.org/10.5194/nhess-21-1495-2021C. M. Scheip and K. W. Wegmann: HazMapper – global open-source natural hazard mapping 1507
Figure 8. rdNDVI change detection images illustrate coastal erosion, vegetation removal, and sedimentation following the 26 December 2004
tsunami in Indonesia resulting from the Sumatra–Andaman earthquake. Parameters – dataset: Landsat 7; event date: 26 December 2004;
maximum cloud cover: 100 %; slope threshold: 0.01◦ . Pre-windows: 1, 2, and 12 months; post-windows: 1, 2, and 12 months for (a), (b),
and (c), respectively. rdNDVI across the event illustrates tsunami inundation zone and resulting loss in vegetation. Striping in the data from
the scan line corrector failure in Landsat 7 is evident in a short-look window (e.g., 1 month, a), but these artifacts are reduced by increasing
the pre- and post-event windows (b, c). By 12-month pre- and post-event periods (c), the striping is significantly reduced in results; however,
vegetative recovery is also present in this longer post-event cycle that captures the first growing season following the tsunami. This example
is accessible at https://go.ncsu.edu/hazmapper-indonesia-tsunami (last access: 29 April 2021).
fidence is driven by the pre-event window length. This 4.3 Further applications
is because of the greenest-pixel compositing technique,
which always identifies the maximum-NDVI conditions HazMapper may be useful in many other types of studies
in the given analysis window. For example, the pre- beyond those described here. For example, vegetation can be
event window length in the Kenya debris flow exam- a proxy for decreasing hazard following large mass-wasting
ple (Sect. 3.1.1, Fig. 3) temporally constrains the de- events (Shen et al., 2020; Yunus et al., 2020). By altering
bris flows to have occurred within the 2-month period the parameters in HazMapper, this regrowth can be tracked
preceding the event date of 23 November 2019 (±5 d, and quantified, e.g., Fig. 4D. Additional applications include
consistent with the acquisition rate of Sentinel-2). Com- characterizing agricultural or logging operations (including
bining this result with news reports, interviews, or other tracking illegal operations), monitoring controlled burns and
local knowledge of the region can increase confidence the growth of early successional species, or biological blight
that the major debris flow swarm imaged in HazMapper monitoring.
was a result of the 23 November 2019 storms.
4.4 Future work
– Maximum cloud cover. The intent of this parameter is to
increase processing speed by omitting any images with There are several anticipated development opportunities for
cloud cover greater than the parameter value. For exam- HazMapper. Principal among these is the development of
ple, if the user is confident there will be images with hazard-specific platforms to provide more focused analysis
very low cloud cover, a value such as 30 % maximum for various hazard types. For example, a mass-wasting plat-
cloud cover will only perform the cloud filtering and form could incorporate pixel segmentation, consideration of
NDVI calculations on those images with cloud-cover developed areas, and slope thresholds. Further research into
parameters of less than 30 %. This will also yield the the application of HazMapper in arid or snow-covered en-
cleanest results, because even the cloud filters utilized vironments, including the consideration of snow-related in-
in Earth Engine can result in some peripheral noise in dices (i.e., normalized difference snow index, NDSI), is on-
the composite or NDVI images. going and may be helpful for detecting mass-wasting events
in non-vegetated, high-latitude, or high-elevation regions. A
– Slope threshold. This minimum slope value for analysis wildfire platform can be expanded to include burn-specific
is used to mask out areas of low slope during the visual- indices such as the NBR. And for all platforms, various
ization process. This can be very useful to remove water change detection methods (e.g., shortwave infrared differ-
bodies (e.g., lakes, oceans) which are often noisy and encing) should continue to be evaluated. Radar data bring
can distract from rdNDVI targets. Similarly, this can be exciting opportunities, and as radar processing routines be-
used to mask out low-slope areas, like wide valley bot- come available within GEE, they should be leveraged (e.g.,
toms, while processing an area for mass-wasting events. Handwerger et al., 2020).
https://doi.org/10.5194/nhess-21-1495-2021 Nat. Hazards Earth Syst. Sci., 21, 1495–1511, 2021You can also read