THE IMPACT OF GPS AND HIGH-RESOLUTION RADIOSONDE NUDGING ON THE SIMULATION OF HEAVY PRECIPITATION DURING HYMEX IOP6 - WCD
←
→
Page content transcription
If your browser does not render page correctly, please read the page content below
Weather Clim. Dynam., 2, 561–580, 2021
https://doi.org/10.5194/wcd-2-561-2021
© Author(s) 2021. This work is distributed under
the Creative Commons Attribution 4.0 License.

The impact of GPS and high-resolution radiosonde nudging on the
simulation of heavy precipitation during HyMeX IOP6
Alberto Caldas-Alvarez1 , Samiro Khodayar1,2 , and Peter Knippertz1
1 Department Troposphere Research, Institute of Meteorology and Climate Research (IMK-TRO), Karlsruhe Institute
of Technology, Karlsruhe, P.O. Box 3640, 76021 Karlsruhe, Germany
2 Meteorology and Pollutant Dynamics Area, Mediterranean Centre for Environmental Studies (CEAM),

Valencia, 46980, Spain

Correspondence: Alberto Caldas-Alvarez (alberto.caldas-alvarez@kit.edu)

Received: 15 January 2021 – Discussion started: 18 January 2021
Revised: 9 April 2021 – Accepted: 28 April 2021 – Published: 8 July 2021

Abstract. Heavy precipitation is one of the most devastat-       cies in the numerics and physics, unable to convert the mois-
ing weather extremes in the western Mediterranean region.        ture excess into sufficient precipitation. Nudging GPS and
Our capacity to prevent negative impacts from such extreme       high-resolution soundings corrects atmospheric humidity but
events requires advancements in numerical weather predic-        even further reduces total precipitation. This case study also
tion, data assimilation, and new observation techniques. In      demonstrates the potential impact of individual observations
this paper we investigate the impact of two state-of-the-        in highly unstable environments. We show that assimilat-
art data sets with very high resolution, Global Position-        ing a low-resolution sounding from Nîmes (southern France)
ing System (GPS)-derived zenith total delays (GPS-ZTD)           while precipitation is taking place induces a 40 % increase in
with a 10 min temporal resolution and radiosondes with           precipitation during the subsequent 3 h. This precipitation in-
∼ 700 levels, on the representation of convective precipi-       crease is brought about by the moistening of the 700 hPa level
tation in nudging experiments. Specifically, we investigate      (7.5 g kg−1 ) upstream of the main precipitating systems, re-
whether the high temporal resolution, quality, and coverage      ducing the entrainment of dry air above the boundary layer.
of GPS-ZTDs can outweigh their lack of vertical informa-         The moist layer was missed by GPS observations and high-
tion or if radiosonde profiles are more valuable despite their   resolution soundings alike, pointing to the importance of pro-
scarce coverage and low temporal resolution (24 to 6 h). The     file information and timing. However, assimilating GPS was
study focuses on the Intensive Observation Period 6 (IOP6)       beneficial for simulating the temporal evolution of precipita-
of the Hydrological cycle in the Mediterranean eXperiment        tion. Finally, regarding the scale dependency, no resolution is
(HyMeX; 24 September 2012). This event is selected due to        particularly sensitive to a specific observation type; however,
its severity (100 mm/12 h), the availability of observations     the 2.8 km run has overall better scores, possibly as this is the
for nudging and validation, and the large observation im-        optimally tuned operational version of COSMO. Future work
pact found in preliminary sensitivity experiments. We sys-       will aim at a generalization of these conclusions, investigat-
tematically compare simulations performed with the Con-          ing further cases of the autumn 2012, and the Icosahedral
sortium for Small-scale Modeling (COSMO) model assim-            Nonhydrostatic Model (ICON) will be investigated for this
ilating GPS, high- and low-vertical-resolution radiosound-       case study to assert whether its updates are able to improve
ings in model resolutions of 7 km, 2.8 km, and 500 m. The        the quality of the simulations.
results show that the additional GPS and radiosonde obser-
vations cannot compensate for errors in the model dynam-
ics and physics. In this regard the reference COSMO runs
have an atmospheric moisture wet bias prior to precipitation
onset but a negative bias in rainfall, indicative of deficien-

Published by Copernicus Publications on behalf of the European Geosciences Union.
562                                           A. Caldas-Alvarez et al.: The impact of GPS and high-resolution radiosonde

1   Introduction                                                 al. (2017) find a good impact on precipitation forecasts from
                                                                 assimilating constructed humidity profiles reaching the up-
In the western Mediterranean heavy precipitation events          per free troposphere. Federico et al. (2019) show that assim-
(HPEs) cause fatalities and large economic losses every year     ilating derived humidity profiles from radar reflectivity and
(Petrucci et al., 2018). Many of these events occurs dur-        lighting data induces a moist bias possibly due to the inabil-
ing autumn, since this is the time when large-scale sys-         ity of the system to correctly redistribute the humidity into
tems (northerly troughs, extratropical cyclones) coincide        shallower vertical layers. This is one of the reasons why, to
with large mesoscale moisture transports, advected with the      date, radiosondes have remained the backbone of DA sys-
southerly flow (Toreti et al., 2010; Pinto et al., 2013; Dayan   tems (Kwon et al., 2018). Radiosondes can supplement the
et al., 2015; Gilabert and Llasat, 2017). This creates the       lack of vertical information of GPS observations but at the
propitious humidity and instability conditions for convec-       expense of a coarser temporal resolution (in best cases, ev-
tive systems that get triggered due to orography, wind con-      ery 6 h) and lower spatial coverage (∼ 30 stations in western
vergence, or thermodynamic processes (Ricard et al., 2012;       Europe). To bring the best value from radiosonde assimila-
Khodayar et al., 2016). The representation of such events        tion, targeted observations can help sample atmospheric con-
is still a challenge for current numerical weather prediction    ditions at the right place and time, e.g. in regions upstream
(NWP) models. The relatively short temporal and spatial          of areas prone to heavy precipitation (Campins et al., 2013).
scales of convective phenomena, from minutes to less than        In this regard, a higher number of levels per sounding can
a day and from 100 to 102 km (Markowski and Richardson,          bring potential improvement, already assessed for validation
2010), make it challenging to forecast accurately where and      purposes (Benjamin et al., 2010).
when an HPE will develop. One of the identified sources of          Past modelling and observational studies demonstrated
error is the misrepresentation of the spatial distribution of    that a good account of the spatial distribution of atmospheric
atmospheric moisture. Current models have shown a large          moisture is crucial for the representation of convective inten-
sensitivity of convective precipitation to small differences     sities (Keil et al., 2008; Lintner et al., 2011; Honda et al.,
in moisture distribution (Lintner et al., 2017; Virman et al.,   2015; Schumacher et al., 2015; Schlemmer and Hoheneg-
2018). Hence, it is hoped that using sub-kilometre resolution    ger, 2015; Lintner et al., 2017; Virman et al., 2018). Con-
and sub-hourly frequencies in atmospheric models and data        sensus exists that a moist planetary boundary layer (PBL)
assimilation (DA) systems can lead to substantial improve-       is needed for convective triggering and maintenance (Lee
ments for HPE prediction.                                        et al., 2018). However, the dependency on moisture at the
   DA is a key ingredient to the initial value problem of        lower free troposphere (LFT) is less established. Dry mid-
NWP (Bauer et al., 2015), as the frequent assimilation of        levels can lead to a faster organization of mesoscale clus-
high-quality observations helps adjust the NWP model to-         ters through stronger cold pools (Zuidema et al., 2017) but
wards the true atmospheric state. Recent advancements in         also reduce the strength of connective updraughts through
observation systems and high-performance computing have          entrainment of drier air. Several authors have highlighted the
brought progress for DA of new observations (Carlin et al.,      important role of mid-level moisture in aiding the transition
2017; Kwon et al., 2018; Borderies et al., 2019; Federico et     from shallow to deep moist convection (Lintner et al., 2011;
al., 2017; Mazzarella et al., 2017). GPS measurements of         Neelin et al., 2009; Bernstein et al., 2016; Zhuang et al.,
ZTDs are an especially interesting observation type, since       2018; Khodayar et al., 2018), as a sufficiently moist LFT
they can sample the integrated water vapour (IWV) amount         prevents excessive entrainment (Honda et al., 2015), helps
at minute temporal resolution (Bock et al., 2016). Past pub-     convection penetrate possible intrusions, and maintains the
lications have shown improvements of GPS data for screen-        buoyancy of the rising parcels.
level temperature and humidity (Mile et al., 2019; Mascitelli       In addition to DA, convection-permitting model resolu-
et al., 2019), lower to middle tropospheric moisture (Singh      tion has brought important advancements in the simulation
et al., 2019; Bastin et al., 2019; Caldas-Alvarez and Khoda-     of heavy precipitation (Chan et al., 2012; Prein et al., 2015;
yar, 2020), and 24 h precipitation (Hdidou et al., 2020; Four-   Coppola et al., 2018; Meredith et al., 2020). However, the
rié et al., 2021). The advantages of this product are that it    question regarding how fine model resolutions should be, be-
has high temporal resolution, that it is all-weather (provides   yond the kilometre scale, in the so-called grey zone (Barthlott
IWV estimates in cloudy as well as clear-sky situations), that   and Hoose; 2015) is still open. Several papers have found im-
is has large accuracy (Bock et al., 2016, 2019; Jones et al.,    provements from using model resolutions of 1.5 km or higher
2019), and that it has a dense coverage over European coun-      (Kendon et al., 2012; Martinet et al., 2017; Bonekamp et al.,
tries. However, being an integrated quantity, GPS measure-       2018 and Lovat et al., 2019), whereas others found no sig-
ments bear no information of the vertical distribution of hu-    nificant gain (Chan et al., 2012; Panosetti et al., 2016; Lee et
midity (Guerova et al., 2016). This deficit can be decisive      al., 2019). A possible reason is the fact that the appropriate
in some situations since sufficient moisture even in shallow     settings for running current models at such high resolutions
atmospheric layers can make the difference between con-          are not yet ready. In this context it is interesting to assess the
vective triggering or suppression. For example, Davolio et

Weather Clim. Dynam., 2, 561–580, 2021                                               https://doi.org/10.5194/wcd-2-561-2021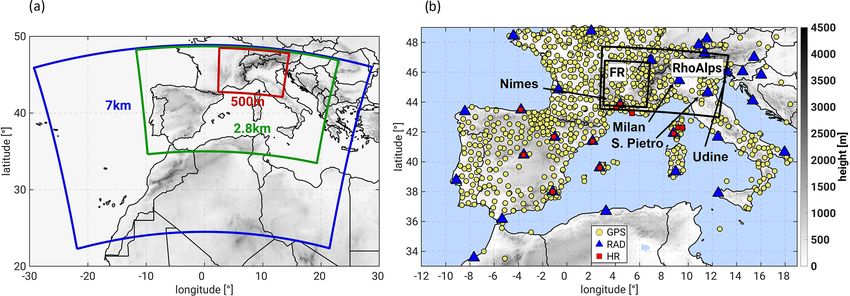
A. Caldas-Alvarez et al.: The impact of GPS and high-resolution radiosonde                                                563

sensitivity of the impact of new observations such as GPS        the assimilated variable in the nudging experiments, which
and high-resolution soundings to model resolution.               is proportional to the IWV. The data set used in this paper
   Assessing the capabilities of current NWP systems for         has a temporal resolution of 10 min, has an outstanding spa-
heavy precipitation is one of the aims of HyMeX, an inter-       tial coverage over all south-western European countries (see
national project aiming at a better understanding of the hy-     Fig. 1b), and was produced using the GIPSY/OASIS II v6.2
drological cycle in the Mediterranean (Ducrocq et al., 2014).    software (Bock et al., 2016). It enjoys a very high quality
The Special Observation Period 1 (SOP1) between 1 Septem-        due to its data-screening procedure, including range and out-
ber and 5 November 2012 provides an unprecedented col-           lier checks for mean ZTD and its standard deviation, as well
lection of data that are used in this study for assimilation,    as ambiguity and daily number checks. Compared against
validation, and process understanding. The event we focus        the product from the Network of European Meteorological
on occurred on 24 September 2012, during Intensive Obser-        Services (EUMETNET) Global Navigation Satellite System
vation Period 6 (IOP6), and brought precipitation amounts        (GNSS) Water Vapour Programme (E-GVAP), the HyMeX
of over 100 mm in 12 h to southern France, the Alps, the         data set shows no significant biases (Bock et al., 2016).
Gulf of Genoa, and north-eastern Italy (Hally et al., 2014;         HyMeX, also provides an IWV data set with 1 h resolu-
Ribaud et al., 2016). This HPE showed a negative impact          tion, derived from the ZTD estimations (Fig. 1b). We employ
of GPS DA in preliminary assimilation tests, related to an       this IWV data set for comparison against our simulations.
overall reduction of atmospheric moisture and precipitation      The mean temperature and surface pressure values at the
amount (between −40 % and −10 % depending on model               GPS station locations, which are needed for the IWV deriva-
resolution). Given this unexpected result, we will investi-      tion, were obtained from a product provided by the Techni-
gate here in more detail which characteristics of the GPS        cal University of Vienna and Application of Research to Op-
DA were detrimental for the representation of precipitation.     erations at Mesoscale – western Mediterranean (AROME-
To do so, we will systematically assess the impact of nudg-      WMED) operational analysis, respectively. A validation of
ing GPS, operational soundings, and high-resolution sound-       the IWV product against operational radiosondes showed a
ings using Consortium for Small-scale Modeling (COSMO)           good performance, with biases of less than 1.5 mm for the
simulations with – for this case unprecedentedly fine – grid     whole HyMeX period (Bock et al., 2016).
spacings of 7 km, 2.8 km, and 500 m. The employed nudg-
ing scheme (Schraff and Hess, 2012) is well suited for such      2.1.2   The operational and the HyMeX high-resolution
studies (Federico et al., 2019; Bastin et al., 2019) and com-            soundings
pares well against other DA schemes (Schraff et al., 2016).
The employed methods will be outlined in Sect. 2. Section 3      Operational atmospheric sounding data are provided by
discusses the meteorological situation during IOP6 and the       Météo-France and the HyMeX database teams through the
model runs used as reference. Section 4 presents the results     HyMeX-MISTRALS web repository (https://mistrals.sedoo.
of the data impact studies. Conclusions are given in Sect. 5.    fr/HyMeX/, last access: 23 June 2021). The data set con-
                                                                 sists of atmospheric soundings during the period 1995–2017,
                                                                 covering the western Mediterranean countries (blue triangles
                                                                 in Fig. 1b), operated by national and regional European at-
2     Data and methods
                                                                 mospheric weather institutions and distributed through the
                                                                 Global Telecommunication System (GTS). The soundings
2.1     Observations
                                                                 have 30 vertical levels on average and have been validated
2.1.1    GPS-derived zenith total delays (ZTD) and               against GPS measurements with good agreement. Deviations
         integrated water vapour (IWV)                           of only ±3 % in IWV were found by Bock et al. (2016) for
                                                                 the soundings.
The GPS data set used for the nudging was specifically pro-         In addition, we employed the unique high-resolution
duced for the HyMeX project, merging measurements from           soundings of the HyMeX SOP1 in the nudging experi-
25 European national and regional networks commonly post-        ments. These were conducted at locations upstream of ar-
processed for the first time to cover the period Septem-         eas prone to heavy precipitation (red markers in Fig. 1b).
ber 2012 to March 2013 (Bock et al., 2016). GPS measure-         They have a much finer vertical resolution with over 700
ments provide information of the total delay endured by the      levels up to 300 hPa. We employed soundings from 12 sta-
microwave signals emitted by GPS satellites in the zenith        tions over France (continental and Corsica) and Spain. Mo-
direction (zenith total delay; ZTD). These are expressed in      dem M10 sondes were launched at Ajaccio (Corsica), Nîmes,
units of millimetres, accounting for the excess length of the    and Barcelona; Graw sondes, operated by the Karlsruhe In-
optic path introduced by the refractivity of the Earth’s atmo-   stitute of Technology, were launched at Corte (Corsica); and
sphere (Businger et al., 1996). The contribution to the delay    Vaisala sondes were launched in southern France and Spain.
due to the interaction with water vapour molecules is called
the “wet” delay and can be obtained from the ZTD. This is

https://doi.org/10.5194/wcd-2-561-2021                                            Weather Clim. Dynam., 2, 561–580, 2021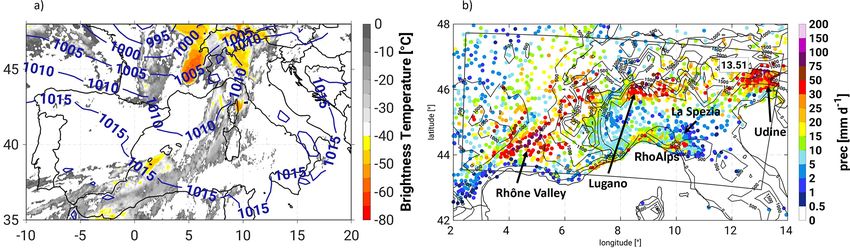
564                                           A. Caldas-Alvarez et al.: The impact of GPS and high-resolution radiosonde

2.1.3   Meteosat Second Generation (MSG) brightness               2.2   The COSMO model
        temperature
                                                                  COSMO uses the non-hydrostatic, thermo-hydrodynamical
Brightness temperature is an estimation of the radiation emit-    equations in a limited area approach (Schättler et al., 2016),
ted by a surface, converted to temperature through Planck’s       considering the wind components, temperature, pressure per-
law, assuming a black body. It provides a clue of the height      turbation, the cloud water content, and the specific humid-
of cloud tops and is especially useful for deep penetrating       ity as prognostic variables. Optionally, also cloud ice, snow,
convective clouds. In this paper we use the All-Sky Radi-         and graupel can be considered (Schättler et al., 2016). The
ances product, obtained by the Spinning Enhanced Visible          model levels are based on a height coordinate that follows the
and InfraRed Imager (SEVIRI) instrument aboard the Me-            terrain. The rotated grid is an Arakawa C type with Lorenz
teosat Second Generation satellite constellation. In particu-     vertical grid staggering. The dynamical solver is a second-
lar, the infrared (IR) channel IR10.8 is used for detection of    order leapfrog time-split scheme following Skamarock and
organized convective systems. The data are accessible upon        Klemp (1992). COSMO includes physical parameterizations
registration at https://www.eumetsat.int/website/home/Data/       for the processes that are not explicitly represented. The grid-
DataDelivery/index.html (last access: 23 June 2021).              scale cloud and precipitation parameterization uses a bulk
                                                                  scheme continuity model including water vapour, cloud wa-
2.1.4   Rain gauges (RG) and Multi-Source                         ter, cloud ice, rain, snow, and graupel as water species. Con-
        Weighted-Ensemble Precipitation (MSWEP)                   vection is parameterized using the Tiedtke scheme (1989), a
                                                                  bulk-mass-flux formulation dependent on mass, heat, mois-
The RG data set used for validation in this paper is avail-
                                                                  ture, and momentum fluxes, including a cloud model, sim-
able for accumulation periods of 1, 6, or 24 h; has a dense
                                                                  ulating processes such as condensation/deposition, evapora-
coverage of Spain, France, Italy, and Croatia; and has on av-
                                                                  tion within the updraught, and evaporation below cloud base.
erage over 4000 stations active per sampled hour. The data
                                                                  The radiation scheme follows the Ritter and Geleyn descrip-
set is made available by Météo-France by means of the MIS-
                                                                  tion (1992) and is applied with a lower temporal frequency
TRALS/HyMeX repositories. The version used for this study
                                                                  and lower resolution than that of the rest of the model to re-
is V4, which includes high-resolution measurements from
                                                                  duce computational costs. The soil model is the Terra Multi-
Italy and Croatia as compared to older versions. Several qual-
                                                                  Layer (ML) model that is based upon the two-layer scheme
ity checks are included in this version, such as consistency
                                                                  by Jacobsen and Heise (1982). Finally, the surface data use
validations among the different accumulation periods, re-
                                                                  the GLOBE data set (Hastings et al., 2000) with a 1 km res-
moval of duplicates, and dismissal of blacklisted stations.
                                                                  olution adequately interpolated (extrapolated) to the scale of
   The MSWEP product is used for validation of our model
                                                                  the different resolutions used (7 km, 2.8 km, and 500 m).
results. We use version V2.1 with a temporal resolution of
                                                                     One of the main assets of COSMO is its flexibility to
3 h and a spatial resolution of 0.1◦ during 1979–2015. We ex-
                                                                  be used with different horizontal resolutions, each of which
amine the period 22–25 September 2012. A full description
                                                                  requires specific configuration settings. For finer spatio-
of the data set can be found in Beck et al. (2017). MSWEP
                                                                  temporal scales, more processes are explicitly resolved at the
is a gridded precipitation data set merging satellite, reanaly-
                                                                  expense of higher computational costs. In this work we em-
sis, and gauge-based estimates, utilizing, among others, the
                                                                  ploy horizontal grid spacings of 7 km, 2.8 km, and 500 m.
Climate Prediction Center morphing technique (CMORPH),
                                                                  The most relevant differences between the 7 and the 2.8 km
Precipitation Estimation from Remotely Sensed Information
                                                                  set-ups are (a) the increase in levels from 40 to 50, (b) the re-
using Artificial Neural Networks (PERSIANN), Tropical
                                                                  duction of time step from 60 to 20 s, and (c) the use of only a
Rainfall Measuring Mission (TRMM), ERA-Interim (reanal-
                                                                  shallow convection parameterization scheme in 2.8 km. The
ysis), and Climate Prediction Center (CPC) and Global Pre-
                                                                  formulation of the latter is analogous to the deep scheme,
cipitation Climatology Centre (GPCC; gauge) observations.
                                                                  except for the reduced vertical extent of clouds (limited to
The MSWEP product shows a good correlation with the in-
                                                                  1p = 250 hPa; Baldauf et al., 2011) and the neglection of
dependent FLUXNET gauge network with median values
                                                                  dynamic entrainment (Doms et al., 2011). This scheme is in-
of 0.65 for the Pearson correlation coefficient. Root-mean-
                                                                  active in sub-kilometre simulations, i.e. in our 500 m simula-
square error (RMSE) median values were of 4.5 mm d−1 ,
                                                                  tion. Other changes are (a) a further increase in vertical levels
showing better results than the TRMM TMPA 3B42 or
                                                                  to 80, (b) a time step of 2s, and (c) the use of a 3D turbulent
WFDEI-CRU data sets (Beck et al. 2017). We selected this
                                                                  kinetic energy (TKE) diagnostic closure for the turbulence
precipitation data set for model validation given it profits
                                                                  parameterization. In the 7 and 2.8 km configurations, the clo-
from the combined value of satellite precipitation products
                                                                  sure of the turbulence parameterization scheme is 1D in that
as well as RG.
                                                                  it neglects all horizontal fluxes in the so-called boundary-
                                                                  layer approximation (Doms et al., 2011). In the 3D TKE clo-
                                                                  sure case, the vertical shear production term can come from
                                                                  local sources as well as from advection, and the pressure cor-

Weather Clim. Dynam., 2, 561–580, 2021                                                https://doi.org/10.5194/wcd-2-561-2021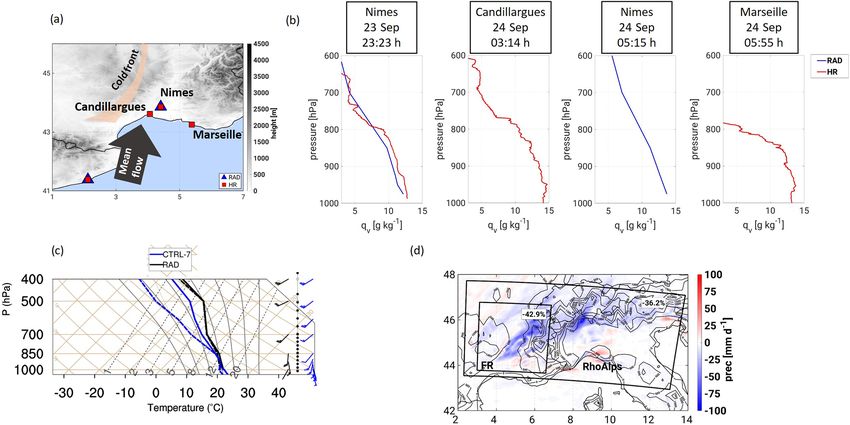
A. Caldas-Alvarez et al.: The impact of GPS and high-resolution radiosonde                                                       565

relation term is explicitly calculated, which is especially use-     and representativeness of the observation. At the exact time–
ful over complex terrain (Goger et al., 2018).                       space location of the observation wxy , wz and wt are set to
                                                                     1.
2.2.1   The COSMO nudging scheme                                        The temporal spreading is controlled by the nudging co-
                                                                     efficient, which is set to 6.10−4 s−1 ; this corresponds to an
The DA method used in this work is the nudging scheme                e-folding decay of 30 min. For radiosondes the assimila-
(Schraff and Hess, 2012). Nudging is an empirical DA                 tion time window is set between −3 and +1 h. The vertical
method consisting of relaxing the model’s prognostic vari-           spreading weight follows a Gaussian in height differences,
ables towards the observations. This is done by adding a term       accounting for the hydrostatic relation and the ideal gas law
to the modelled numerics and physics (F ϕ mod , x, t ) for a         (Eq. 2). Where g is the gravitational acceleration, R is the gas
given prognostic variable (ϕ) at a location (x) and time (t)         constant, Tv is the virtual temperature of the observations,
that depends on the difference between the observation (k)           1z is the height difference between model and√observations,
and the model (ϕkobs −ϕ mod (xk , t)); thetemporal, spatial,
                                                             and    and ln pc is the correlation scale, equal to 1/ 3. More de-
                                              P
quality weighting factors (Wk (x, t) = wk / j wj ·wk ), de-          tails can be found on the models documentation (Schraff and
pending in turn on a relative weight for each observation type       Hess, 2012).
(wj ); and a coefficient with units of frequency (Gϕ ) – see
                                                                                  −[g/RTv | · 1z] 2

Eq. (1). The nudging is performed at each model time step            wz = exp                                                     (2)
when observations are available.                                                       ln pc
 ∂                                  X                                 Horizontally, the spreading is performed using a second-
   ϕ (x, t) = F ϕ mod , x, t + Gϕ ·       Wk (x, t)                  order autoregressive function of the distance between the ob-
∂t                                      k
             h                      i                                servation location and the target point (1r) divided by corre-
            · ϕkobs − ϕ mod (xk , t)                           (1)   lation scale (s); see Eq. (3). The values of s range between 58
                                                                     and 100 km, depending on the model level for radiosondes,
   In this work, we nudge atmospheric specific humidity              and are reduced by 45 % for GPS data to avoid conflicting
(GPS and radiosondes), temperature (radiosondes), and wind           neighbouring observations, given its larger surface coverage
(radiosondes). These are the quantities assimilated opera-           (Schraff and Hess, 2012), The correlation scale is invariant
tionally at forecasting centres from GPS and radiosonde mea-         under resolution changes as in its operational set-up. The im-
surements (Kwon et al., 2018). The nudging scheme is espe-           pact of adapting s to different model resolutions is not inves-
cially suited for these experiments, since it corrects the at-       tigated here, as this would be out of the scope of the paper.
mospheric fields during run time, with the same frequency            However, further testing of different values of the correlation
as the sampling of observations. Additionally, it has shown          scale for higher resolutions is advised to address any poten-
good results in analysing humidity fields, especially at upper       tial conflicts of assimilated observations with for example an
levels (Schraff et al., 2016; Bastin et al., 2019), and is com-      increased resolution of the model’s orography.
putationally less expensive than other schemes (variational
                                                                     wxy = (1 + 1r/s) · e−1r/s                                   (3)
schemes or hybrid schemes) given its simplicity (Guerova et
al., 2016).                                                             To assimilate GPS data, COSMO converts the ZTD infor-
                                                                     mation into IWV (see Sect. 2.1.1) utilizing simulated sur-
Nudging of GPS and radiosondes                                       face pressure at the station (ps ) and mean temperature (Tm )
                                                                     at run time from the assigned grid point. Given IWV is not
The COSMO nudging scheme only allows the assimilation of
                                                                     a prognostic variable, a specific humidity profile needs to be
prognostic variables. In the case of the radiosondes, COSMO
                                                                     constructed (qvmod ). This is done by means of an iterative pro-
reads profiles of temperature, wind, and humidity, assign-
                                                                     cess that scales the IWV simulated at that location and time
ing all observations to a grid point in model space. Given
                                                                     (IWVmod ) with that of the observation (IWVobs ). The profile
that the grid points cannot correctly represent wavelengths
                                                                     is constructed at the different model levels according to
of 21x or less, the assignment is performed with no interpo-
lation in the horizontal direction (Schraff and Hess, 2012).                            IWVobs
                                                                                           i+1
The observations are averaged over each model layer for              qvmod  = qvmod ·            .                               (4)
                                                                        i+1      i
                                                                                        IWVmod
                                                                                           i
temperature and wind and interpolated to the representa-
tive height of each model level for humidity. Therefore, the            The process continues until the IWV error is lower than
higher the number of vertical model levels, the more the as-         0.1 % or after 20 iterations (Schraff and Hess, 2012). In the
similation will profit from higher vertical resolution in the        remainder of the process the constructed profile is treated in
radiosondes. The impact of the analysis increments on the            the same way as the one derived from radiosondes with the
neighbouring grid points is controlled through lateral (wxy ),       exceptions that (a) no vertical weights are needed, since the
vertical (wz ), and temporal weights (wt ) through the equa-         profile is constructed over model levels directly, and (b) tem-
tion wk = wxy · wz · wt · εk , where εk accounts for the quality     porally, GPS data are interpolated linearly given their minute

https://doi.org/10.5194/wcd-2-561-2021                                                   Weather Clim. Dynam., 2, 561–580, 2021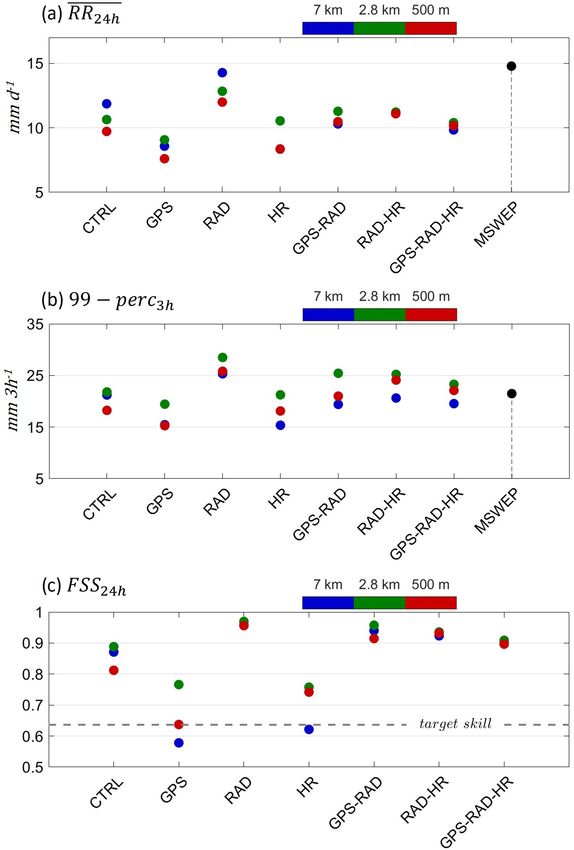
566                                           A. Caldas-Alvarez et al.: The impact of GPS and high-resolution radiosonde

temporal resolution. Both for radiosonde and GPS observa-        the sample of all 3-hourly precipitation intensities at each
tions, the nudging scheme sequentially carries out quality       grid point during the day of precipitation, i.e. for eight time
checks for new input observations. These checks consist of       steps during 24 September 2012.
dismissal of observations with large biases; bias corrections,
e.g. humidity biases in Vaisala soundings; and gross error       2.4.2   Temporal correlation
checks to truncate the range of the observations within real-
istic limits.                                                    In Sect. 4.1, we validate the precipitation temporal cor-
                                                                 relation of the different simulations against observations
2.3     Experimental set-up                                      (MSWEP). To this end, we calculate the Pearson correlation
                                                                 coefficient between the model’s spatially averaged precipita-
We run 3 d simulations between 22 September 2012                 tion (mod) and that of the observations (obs) as in Jolliffe and
00:00 UTC and 25 September 2012 00:00 UTC. We simulate           Stephenson (2011) for 3-hourly aggregates during the day of
this period with COSMO, using three horizontal resolutions       precipitation (24 September 2012).
of 7 km, 2.8 km, and 500 m in a one-way nesting strategy
(Fig. 1a). Integrated Forecasting System (IFS) simulations                      P24 h
from the European Centre for Medium-Range Weather Fore-                            i   modi − mod obsi − obs
                                                                 rmod,obs = q                    q
                                                                                               2 P24 h           2 ,        (5)
casts (ECMWF) with a resolution of 25 km force the 7 km                      P24 h
                                                                                    modi − mod
                                                                              i                     i=1 obsi − obs
runs, which in turn force the 2.8 km ones, and finally these
force the 500 m simulations. The following rationale guides
the nudging experiments. The study period is run in all three    where the sums run for all eight time steps (i) of the 3-hourly
resolutions as pure forecast runs (named CTRL-7, CTRL-           aggregates during 24 September 2012. The spatial averag-
2.8, CTRL-500), which are used as references to compare          ing is performed over the investigation area RhoAlps, where
against simulations nudging GPS, operational radiosondes         only land points are considered due to the lack of data of
(RAD, ∼ 20 levels) and high-resolution radiosondes (HR,          MSWEP over the sea; all simulations are coarse-grained to
∼ 700 levels), and all possible combinations between them        the MSWEP resolution.
(see Table 1), in all three resolutions. The nudging is per-        For its interpretation it should be noted that the forecasting
formed continuously processing new observations as soon as       efficiency of Pearson’s correlation coefficient is non-linear,
they are available for the time step under integration. This     i.e. small improvements of rmod,obs for values closer to 1 im-
implies that the average frequency for nudging of GPS is         ply larger forecasting efficiency than improvements of the
10 min and between 6 and 12 h for radiosondes. We use al-        same extent for values closer to 0 (Jacques et al., 2018).
most 1000 GPS stations, 32 RAD sounding stations and 12
HR stations (Fig. 1b). All simulations of the same resolution    2.4.3   Fractions skill score (FSS)
are forced with the same boundary conditions. For instance,
all 500 m simulations are forced by CTRL-2.8. This is done       The FSS provides an estimate of the agreement in the fraction
to ensure that the different impacts observed in the simula-     of surface affected by precipitation between observations and
tions are due to the use of different observations and not       simulations. After coarse-graining the simulations to the res-
from different forcing data. A total of 21 simulations were      olution of the observations (MSWEP, 0.1◦ ), each grid point
performed (see Table 1). The study focuses on two investiga-     within the investigation area (both for observations and sim-
tion areas, the Cévennes alpine area in southern France (FR)     ulations) is given a value of 1 if precipitation is larger than
and the north-western Mediterranean basin (RhoAlps); see         20 mm d−1 and 0 to the remainder grid points. We selected
Fig.1b. The extension of FR has been selected for study of       this precipitation threshold to be able to have defined precip-
local instability, moisture, and wind conditions influencing     itation structures within the investigation area (Roberts and
convective activity over the area. RhoAlps covers the exten-     Lean, 2008; Skok and Roberts, 2016). We obtain the frac-
sion of the four main heavy precipitation foci (see Fig. 2b).    tions of area, affected by precipitation in the model (fmod )
                                                                 and the observations (fobs ) for moving sub-boxes. The frac-
2.4     Verification metrics                                     tions are computed as the ratio of the number of grid points
                                                                 with value 1 (nprecip ) divided by the total number of grid
2.4.1    99th percentile of 3-hourly precipitation               points (ntot ), of the moving sub-boxes (f = nprecip /ntot ). The
         aggregates                                              size of the sub-boxes is defined by the Neighbour Length
                                                                 (N). We choose the maximum possible N to guarantee the
We validate extreme precipitation intensity simulated by         largest skill of the forecast. The maximum N is defined by
COSMO against MSWEP. To this end we upscale COSMO’s              the number of grid points in the shortest dimension of the
grid to the MSWEP spatial resolution (0.1◦ ). Then we obtain     investigation area. In our case this is the latitude dimension
3-hourly precipitation aggregates for the grid points within     (nlat = 42). N has to fulfil the condition nlat = 2N − 1, hence
the investigation area. The 99th percentile is obtained from     the neighbour length (N ) of the moving boxes is 20. The FSS

Weather Clim. Dynam., 2, 561–580, 2021                                               https://doi.org/10.5194/wcd-2-561-2021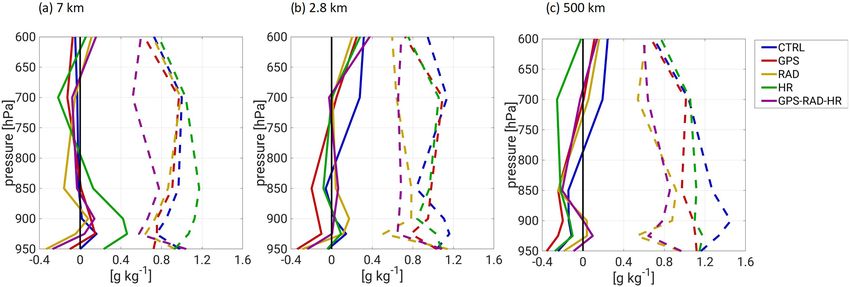
A. Caldas-Alvarez et al.: The impact of GPS and high-resolution radiosonde 567
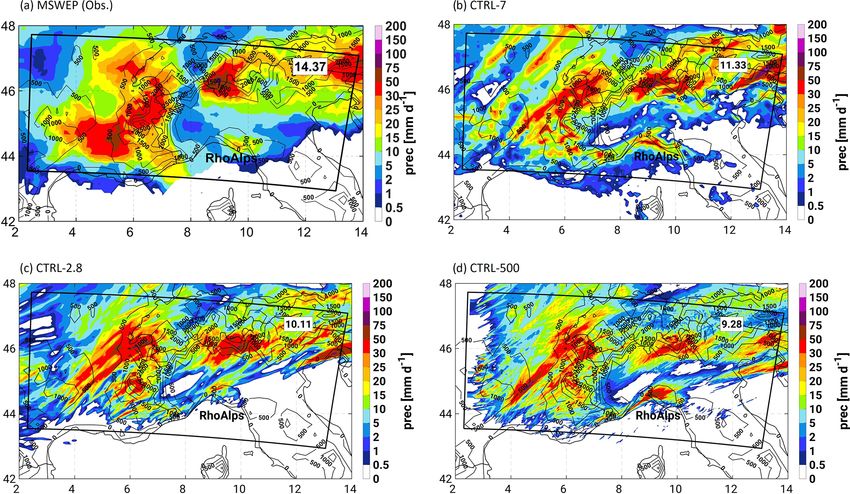
Figure 1. (a) Nested simulation domains for the different resolutions. (b) Spatial distribution of nudged measurements, GPS, operational
radiosondes (RAD) and high-resolution soundings (HR), and investigation domains FR and RhoAlps (boxes).
Table 1. Summary of simulations nudging radiosondes and GPS observations. In total 18 simulations with nudging plus three control runs
were performed. The simulations with combined nudging of observations maintain the same assimilation frequency and number of levels for
the different observations. The resolution of the GLOBE orography data set is 1 km. The TERRA-ML model is used for the soil–atmosphere
interactions parameterizations.
is computed as shown in Eq. (6). 2.4.4 Root-mean-square error (RMSE) and mean bias
(MB)
1 PM
(fmod − fobs )2
FSS = 1 − P i=1
M
P2 , (6) The validation of IWV and specific humidity simulated with
1 M 2 2
M i=1 fmod + i=1 fobs COSMO is quantified through the RMSE and MB (Eqs. 7
and 8) in Sect. 4.2, where i is the running index for all avail-
where M is the number of moving sub-boxes. Equation (6) able observations (N):
corresponds to what is defined in Roberts and Lean (2008)
as asymptotic fractions skill score (AFSS). This asymp- r
1 XN
totic value is reached when the number of neighbours is RMSE = i
(modi − obsi )2 , (7)
N
the largest. It provides the largest skill of the verification
1 XN
and if there is no bias between the model and the observa- MB = (modi − obsi ) . (8)
N i
tions AFSS equals one. On the other hand the lower limit
of the model’s skill is defined by the target FSS defined as
FSStarget = 0.5 + fobs /2 and is denoted by a dashed line in 3 The HyMeX IOP6 (24 September 2012)
Fig. 5c. Below this threshold the forecast has no skill.
In the night of 24 September 2012 several mesoscale con-
vective systems (MCSs) were active over southern France,
the Alps, and the Italian gulfs of Genoa and Venice (Hally
https://doi.org/10.5194/wcd-2-561-2021 Weather Clim. Dynam., 2, 561–580, 2021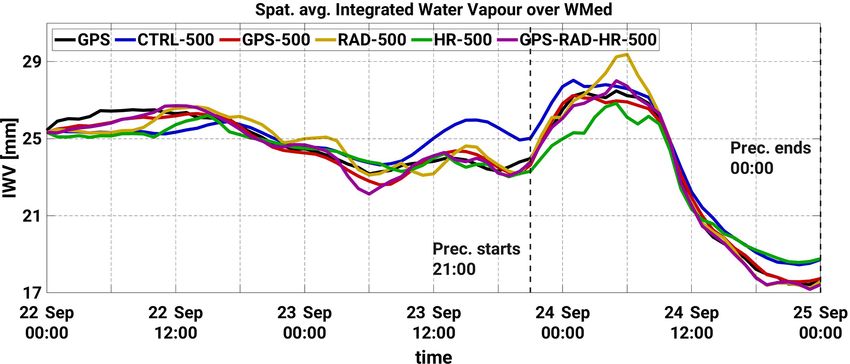
568 A. Caldas-Alvarez et al.: The impact of GPS and high-resolution radiosonde
et al., 2014; Ferretti et al., 2014). Over the course of 12 h, 4 Impact of GPS, operational RADs, and HR
RG recorded totals as large as 100 mm over Montélimar, radiosonde nudging
the Swiss Alps, and at the Austrian–Italian border (Fig. 2b).
In total four regions can be characterized by heavy precip- 4.1 Precipitation
itation: the Rhône valley (France), Lugano (Switzerland),
La Spezia (Italy), and Udine (Italy). The synoptic situation The different observation types impact precipitation inde-
was dominated by an upper-level trough situated over west- pendently of the model resolution. Figure 4, analogously to
ern Europe and a surface low to the north-west of Ireland Fig. 3, shows the spatial distribution of 24-hourly aggregated
during the night of 23 September 2012 (Hally et al., 2014; rainfall. In this case only the 500 m resolution is shown given
Taufour et al., 2018). The associated cold front moved over the similarities with the results from the coarser resolutions
southern France, the Alps, and north-eastern Italy in the (7 and 2.8 km) that are provided in the Supplement.
course of 18 h, as the surface low moved from Ireland to the Nudging GPS data induces a reduction of precipitation,
Baltic Sea. A squall line developed over southern France at most strongly over the western slope of the Alps and Lugano,
00:00 UTC on 24 September 2012 (Fig. 2a), reaching its ma- decreasing precipitation from 50 to 15 mm, and over the
ture phase at 03:00 UTC and splitting into two smaller MCSs Udine region, with a reduction of from 50 to 10 mm (Fig. 4a).
at 05:00 UTC (Ribaud et al., 2016). The MCSs moved from No shifting of the location of maxima occurs as no dynamic
north-western to north-eastern Italy after midday (Pichelli impacts like changes in the wind direction and intensity seem
et al., 2017; Fig. 2a). The cyclonic circulation swept in air to be introduced by the GPS nudging (not shown). This
from the Mediterranean over the Gulf of Lion, the Gulf of agrees with previous studies showing a weak impact of as-
Genoa, and up to Venice through the Adriatic Sea (Hally et similating thermodynamic profiles through latent heat nudg-
al., 2014). The additional low-level moisture supported the ing on horizontal wind (Jacques et al., 2018). Nudging RAD
unstable conditions needed for convective development and observations brings an increase in precipitation, both in in-
fed the active systems until their decay after 20:00 UTC on tensity and extension (Fig. 4b). The areas most affected are
24 September 2012. located to the east of the Rhône valley, over Lugano, and
COSMO is able to represent the event, capturing the four Udine with up to 150 mm, well above the 50 mm simulated
main precipitation spots and the main features such as the in CTRL-500.. Nudging HR soundings brought, overall, a
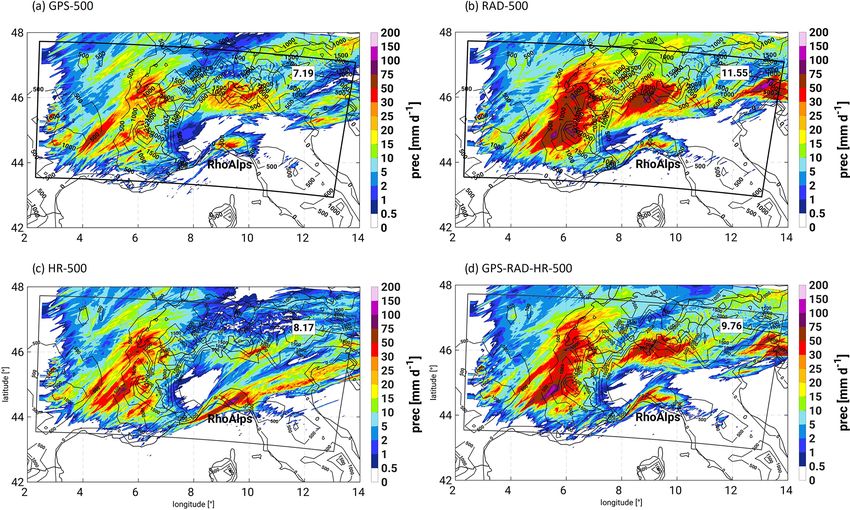
squall line addressed by Hally et al. (2014). To demonstrate marked decrease in precipitation amount over Lugano (Alps)
this, Fig. 3 represents the spatial distribution of 24-hourly and Udine, compared to CTRL. Intensities over these two
aggregated rainfall simulated by COSMO (Fig. 3b–d) and spots are as low as 10 mm in the HR-500 simulation (Fig. 4c).
observed by MSWEP (Fig. 3a). Overall, the MSWEP pre- This is not the case, however, for HR-2.8. Finally, combin-
cipitation product represents well the event over the area, ing all observation types for nudging (GPS–RAD–HR-500,
albeit with an underestimation over Liguria and an overes- Fig. 4d) yields a structure similar of that of the RAD simu-
timation north of the Rhône valley and over the Alps, com- lations but with a weaker precipitation increase (Fig. 4b). It
pared to RG. Regarding COSMO, the precipitation intensi- is worth mentioning the existence of model artefacts in the
ties stay within the observed range despite a tendency for eastern part of the domain (Fig. 4d, for instance), which evi-
underestimating the 24-hourly aggregations (Figs. 2b and 3). dence the difficulties of dynamically downscaled simulations
Irrespective of resolution, COSMO struggles to represent the in initializing the microphysical species at the boundaries.
observed amounts as large as 100 mm. Differences also oc- This, however, does not affect the conclusions of this study.
cur in the precipitation structure and location with some de- In the following we validate the assessed impact of the
pendency on the model resolution. CTRL-7 (Fig. 3b) shows different observation types quantitatively by comparing pre-
the location of the convective line over FR shifted towards cipitation observations (MSWEP) against the COSMO simu-
the Alps and a too narrow and intense precipitation structure lations. The use of MSWEP (resolution of 0.1◦ ) is motivated
over the Udine maximum. CTRL-2.8 (Fig. 3c) shifts the pre- by the fact that it is a gridded product needed for the valida-
cipitation maxima over FR northward and splits the Udine tion of precipitation correlation and structure. We validate for
maximum into two: one over Udine and the other one over 24 September 2012 over investigation area RhoAlps, the spa-
the Gulf of Venice. Finally CTRL-500 (Fig. 3d) represents tially averaged 24-hourly aggregated precipitation (Fig. 5a),
a narrower convective line over FR with a better agreement the 99th percentile of 3-hourly aggregated rainfall intensi-
with observations and, as CTRL-2.8, a split maximum over ties (Fig. 5b), and the FSS (Fig. 5c). How these metrics are
north-eastern Italy. computed is introduced in Sect. 2.4. For the verification,
all COSMO results have been coarse-grained to the native
MSWEP grid.
Figure 5a confirms that all CTRL runs underestimate pre-
cipitation amount by about 4 mm. CTRL-7 shows the best
result, since CTRL-2.8 and CTRL-500 emphasize more lo-
calized precipitation structures, which after spatial averaging
Weather Clim. Dynam., 2, 561–580, 2021 https://doi.org/10.5194/wcd-2-561-2021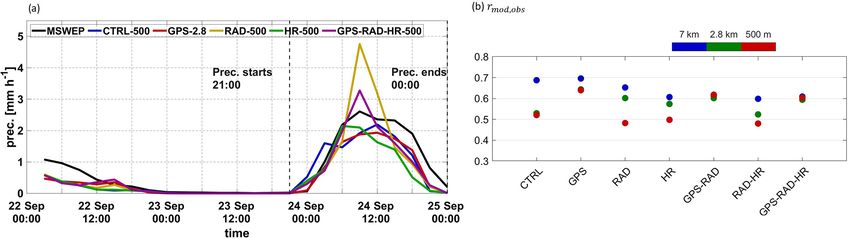
A. Caldas-Alvarez et al.: The impact of GPS and high-resolution radiosonde                                                          569

Figure 2. Synoptic overview of IOP6. (a) Brightness temperature of the MSG-SEVIRI instrument (MSG-0 degree, all-sky radiances, https:
//www.eumetsat.int/, last access: 23 June 2021) and isolines of mean sea level pressure simulated by COSMO (7 km) on 24 September 2012 at
06:00 UTC. (b) 24-hourly accumulated precipitation from the HyMeX RG data set. The dark boxes FR and RhoAlps denote the investigation
areas.

Figure 3. Spatial distribution of daily precipitation during 24 September 2012 00:00 UTC to 25 September 00:00, estimated by the MSWEP
v2.1, 3-hourly, 0.1◦ (a) and simulated by CTRL-7 (b), CTRL-2.8 (c), and CTRL-500 (d). The labels within the RhoAlps box show the values
of the spatial averages used in Fig. 5a for validation of the precipitation totals.

contribute less to the final total. The simulations with nudged        ern Alps and Switzerland. Nudging HR, similarly to GPS, re-
GPS data further reduce the precipitation amount, worsen-              duces the 24-hourly precipitation, resulting in worse scores.
ing the values in the comparison against observations for all          In this regard the higher vertical resolution of HR did not
resolutions with averages of approximately 8 mm only. The              bring added value for this case study, compared to RAD.
sole simulation able to increase the precipitation amount suf-         Finally, the combination of several observation types brings
ficiently is RAD, with values between 15 and 12 mm. This,              counteracting effects for all resolutions, dominated by drying
as seen in Fig. 3b, is due to larger precipitation over the west-      induced by GPS and HR. Also noteworthy is the fact that for

https://doi.org/10.5194/wcd-2-561-2021                                                   Weather Clim. Dynam., 2, 561–580, 2021
570                                            A. Caldas-Alvarez et al.: The impact of GPS and high-resolution radiosonde

Figure 4. As Fig. 3 but for GPS-500 (a), RAD-500 (b), HR-500 (c), and GPS–RAD–HR-500 (d). The analogous analyses using the 7 and
2.8 km grids are shown in the Supplement.

GPS, GPS–RAD, HR, RAD–HR, and GPS–RAD–HR, the                      tion, which is consistent for all resolutions. RAD improves
most suitable resolution is 2.8 km.                                the representation of the precipitation structure (FSS ≈ 0.95)
   In Fig. 5b, the analysis of 99th percentile intensities shows   due to the wider rain areas over Switzerland and the Rhône
that CTRL represents intensities of extreme precipitation          valley and the eastward shift to the western side of the Alps
comparable to those of MSWEP. This implies that for this           (Fig. 4b). HR also shows no added value for the improvement
case a good simulation of extreme precipitation intensities        of precipitation area. Combined observations (GPS–RAD–
did not imply a good prediction of the 24-hourly aggregates        HR) show little scale dependency and an improvement for
(Fig. 5a). CTRL-7 and CTRL-2.8 show similar intensities,           the structure thanks to the impact of RAD. For this metric
but CTRL-500 has somewhat lower rates (by ∼ 5 mm). A               the 2.8 km grid shows the best value.
plausible explanation is the use of a 3D closure for the turbu-       To understand the temporal evolution of the event, Fig. 6a
lence scheme (see Table 1). Verrelle et al. (2015) showed that     shows spatially averaged precipitation over the investigation
a 3D closure for the turbulence scheme induces larger hori-        area RhoAlps. Precipitation as measured by MSWEP starts
zontal diffusion in the area of the cloud base reducing con-       on 23 September at 21:00 UTC (black line in Fig. 6a), over
vective intensity. GPS shows weak extreme precipitation in-        the western part of the RhoAlps domain, reaching a steady
tensities for all resolutions, with the best results for GPS-2.8   maximum of 3 mm h−1 in the spatial averages between 06:00
(20 mm). On the contrary, RAD shows a large increase with          and 18:00 UTC of 24 September (MSWEP; black colour).
3-hourly precipitation intensities in the order of 27 mm. The      The convective decay is effective after 18:00 UTC where the
HR simulations show weak precipitation (between 16 and 23          last cells over the Italian–Slovenian border start to reduce
mm), analogously to the underestimation of 24 h sums shown         their intensity. All simulations (colour lines in Fig. 6a) cap-
in Fig. 4a and c. Regarding the combined observations (GPS–        ture the event with a good representation of its initiation
RAD–HR), the use of RAD increases the precipitation inten-         hour but simulate its decay between 3 and 2 h earlier. As in
sities to more realistic values.                                   Fig. 4, only the results for the 500 m resolution are shown.
   Finally, the FSS analysis (Fig. 5c) shows a good perfor-        The analogous results for the 7 and 2.8 km grid are given in
mance of the CTRL runs (FSS ≈ 0.85). Nudging GPS re-               the Supplement, which show a similar response to the differ-
duces the FSS score due to the excessive precipitation reduc-      ent observation types. CTRL-500 (blue), GPS-500 (red), and

Weather Clim. Dynam., 2, 561–580, 2021                                                https://doi.org/10.5194/wcd-2-561-2021
A. Caldas-Alvarez et al.: The impact of GPS and high-resolution radiosonde                                                     571

                                                                   CTRL-500, with a correlation of up to 0.9 against MSWEP,
                                                                   due to a better location of precipitation variations at each grid
                                                                   point related to its more similar resolution to that of the ob-
                                                                   servations (∼ 11 km). Nudging GPS data improves the tem-
                                                                   poral representation of precipitation of COSMO for all grid
                                                                   types (Fig. 6b). This is related to a smoother representation of
                                                                   the precipitation increase between 03:00 and 06:00 UTC and
                                                                   a flatter curve in contrast to other observation types (Fig. 6a).
                                                                   This is possibly due to the ability of the GPS nudging to
                                                                   improve the representation of the arrival of moisture and
                                                                   consequent increase, associated with precipitation initiation.
                                                                   RAD and HR bring little improvement, with even some de-
                                                                   terioration for RAD-7. HR also brings some improvement
                                                                   due to a good representation of the timing of convective de-
                                                                   cay. Combining the different observation types (GPS–RAD–
                                                                   HR) brings a mixed impact (improvement by GPS and HR,
                                                                   worsening by RAD), which conceals the dependency on the
                                                                   model resolution used (r = 0.82).
                                                                      We conclude from the previous analysis that (a) only RAD
                                                                   brings an improvement to the simulation of precipitation;
                                                                   (b) GPS and HR excessively reduce the simulated precipi-
                                                                   tation, which could be related to model errors in COSMO;
                                                                   (c) GPS brings added value in simulating the timing of the
                                                                   event; and (d) there is overall little dependency on model res-
                                                                   olution

                                                                   4.2   Atmospheric moisture

                                                                   Large moisture amounts were advected with the south-
                                                                   westerly to south-easterly flow up the Rhône valley during
                                                                   23 September 2012. Figure 7 shows the evolution of spa-
Figure 5. (a) Accumulated precipitation amount during 24 Septem-   tially averaged hourly IWV from the 500 m COSMO sim-
ber 2012, spatially averaged over RhoAlps, for COSMO and           ulations and GPS. For the following assessment we applied a
MSWEP. (b) The 99th percentile in millimetres per 3 h over the     correction to IWV for height differences between the model
investigation area RhoAlps during 24 September 2012. (c) FSS of
                                                                   surface and the station altitude following Bock and Parra-
24 h precipitation amount.
                                                                   cho (2019). The correction is based on an empirical lin-
                                                                   ear relationship between IWV biases and height differences
                                                                   (dh) following the equation dIWV/IWV = −4 × 10⁻⁴ · dh.
HR-500 (green) show for most of the event’s duration a spa-        Grid points with surface height differences larger than 500 m
tially averaged intensity lower than MSWEP (between 0.5            are dismissed. The average impact of these corrections does
and 1 mm h−1 ), explaining the differences in the 24-hourly        not exceed 1 % of IWV. The results for 2.8 and 7 km can
aggregations (Figs. 4 and 5). Only the simulations including       be found in the Supplement. The highest GPS-IWV amount
the operational soundings, RAD-500 (yellow) and GPS–HR–            (27 mm; black line in Fig. 7, underneath the coloured lines)
RAD-500 (purple), show a precipitation increase in agree-          persists for 12 h over the study region starting on 24 Septem-
ment with the spatial distributions (Figs. 4b, d, and 5). The      ber at midnight. CTRL-500 (blue line in Fig. 7) reproduces
temporal evolution shows that a precipitation increase occurs      the IWV temporal evolution fairly well until 10:00 UTC on
after 24 September 06:00 UTC and reaches 4.5 mm h−1 for            23 September, when a period of considerable overestimation
the former and 3 mm h−1 for the latter. In Sect. 4.3 we anal-      (+ 2 mm) begins, lasting until 05:00 UTC, well after convec-
yse the causes of the vast moisture increase in RAD.               tive precipitation had started. After 10:00 UTC, CTRL-500
   To provide a quantitative score of the agreement in the         matches better with the GPS-IWV observations. An overes-
temporal evolution of precipitation between observations           timation of IWV by COSMO has already been assessed by
(MSWEP; black line in Fig. 6a and the simulations; coloured        previous studies (Caldas-Alvarez and Khodayar, 2020) and
lines), Fig. 6b shows the temporal correlation for the spatially   was also shown for the non-hydrostatic model AROME in
averaged 3-hourly aggregations (as presented in Fig. 6a; see       Bastin et al. (2019). Nudging GPS (red line in Fig. 7) reduces
Sect. 2.4.2). CTRL-7 performs better than CTRL-2.8 and             the IWV overestimation until 06:00 UTC on 24 September.

https://doi.org/10.5194/wcd-2-561-2021                                               Weather Clim. Dynam., 2, 561–580, 2021
572 A. Caldas-Alvarez et al.: The impact of GPS and high-resolution radiosonde
Figure 6. Temporal evolution of spatially averaged precipitation (a) and temporal correlation validation of the precipitation temporal evolu-
tion (b). All simulations have been coarse-grained to the MSWEP spatial resolution (0.1◦ ). Spatial averages are performed for 3-hourly data.
The corresponding results of (a) for the 7 and 2.8 km simulations can be found in Figs. S3a and S4a of the Supplement.
MB is obtained as the MOD-OBS differences (Sect. 2.4).
The results show that assimilating the GPS observations re-
duces RMSE and MB compared to CTRL (Table 2). Nudg-
ing RAD shows likewise a reduction of RMSE and MB in
the convection-permitting grids (2.8 km and 500 m). This is,
however, not seen for 7 km. Finally, the corrections induced
in GPS–RAD–HR are dominated by the influence of the GPS
measurements.
The fact that the GPS and HR observations improve the
IWV representation, but generate too little precipitation, is
Figure 7. Temporal evolution of spatially averaged IWV for the
indicative of errors in the model’s numerics and physics for
simulations with the 500 m grid. IWV is obtained through interpola-
this case study. The results suggest that COSMO struggles
tion to the location of the GPS stations, applying a height correction
following Bock and Parracho (2019). The corresponding results for to turn its excessive moisture content into precipitation, thus
the 7 and 2.8 km simulations can be found in Figs. S3b and S4b of leaving the atmosphere too humid.
the Supplement. To understand how IWV errors are distributed in the ver-
tical profile, Fig. 8 shows the MB (straight lines) and RMSE
(dashed lines) of specific humidity between COSMO and
This observation type brings the best agreement with obser- four operational radiosondes of the RAD data set (Nîmes,
vations throughout the complete event. This is as expected, Milan, San Pietro, and Udine; see Fig. 1b). All four stations
provided that the GPS-IWV observations are not indepen- are in the lowlands (height < 100 m) to avoid biases due to
dent from the assimilated GPS-ZTDs. Nudging RAD (yel- surface height differences. Although this comparison is not
low) also corrects the IWV overestimation until 05:00 UTC done against an independent data set, it provides valuable
24 September. However, an abrupt IWV increase takes place information of the vertical levels at which the nudging of
after 05:00 UTC on 24 September, with differences up to the different observations has the largest impact. Further-
2 mm against observations lasting for about 5 h. Nudging HR more, given that both the operational and the special high-
(green) corrects the IWV overestimation until the beginning resolution HyMeX radiosondes were used in the nudging
of the event (21:00 UTC 23 September) but excessively dries experiments, no other vertical humidity profiles with high-
the investigation area until 24 September 18:00 UTC. Nudg- accuracy were available for an independent comparison dur-
ing all observation types together (GPS–RAD–HR; purple) ing this period.
corrects the IWV overestimation until 21:00 UTC on 23 CTRL-7 (Fig. 8a, blue) shows a MB within acceptable val-
September 2012 (purple line in Fig. 7). ues (between −0.2 and 0.2 g kg−1 ). Similar RMSE and MB
The temporal evolution in Fig. 7 has shown (a) the correc- values are found for GPS-7 (red) and RAD-7 (yellow), but
tion of the moisture overestimation by all observation types the latter with a slightly more negative MB (−0.2 g kg−1 )
and (b) the relationship between IWV fluctuations and the throughout the complete profile, indicating a drier model at
timing of heavy precipitation over the RhoAlps area. To pro- the selected four low-height stations. HR-7 (green) shows
vide a quantitative assessment of the moisture representation the largest deviations both for RMSE (up to 1.2 g kg−1 at
in COSMO for this event, Table 2 shows the time averaged 850 hPa) and MB, with an overestimation below 950 hPa and
RMSE (left) and MB (right) between the COSMO simula- an underestimation above. GPS–RAD–HR-7 (purple) has the
tions and the GPS measurements at the station locations. The best MB and RMSE (∼ 0.6 g kg−1 ), demonstrating the added
Weather Clim. Dynam., 2, 561–580, 2021 https://doi.org/10.5194/wcd-2-561-2021A. Caldas-Alvarez et al.: The impact of GPS and high-resolution radiosonde 573
Table 2. Root-mean-square error (RMSE; left) and mean bias (MB; right) of spatially and temporally averaged IWV between GPS and
COSMO (22 September to 25 September 00:00 UTC) over RhoAlps. The averages are obtained from hourly IWV values, at the GPS station
locations. The COSMO simulations have been coarse-grained to a common grid of 8 km grid spacing for this comparison. And a height
correction on model data based on Bock and Parracho (2019) has been applied.
RMSE [mm] |MB [mm] CTRL GPS RAD HR GPS–RAD–HR
7 km 0.79 | 0.18 0.27 | 0.05 0.94 | −0.46 0.88 | 0 0.39 | 0.06
2.8 km 1.11 | 0.52 0.27 | 0.02 0.87 | −0.46 0.71 | −0.06 0.37 | −0.01
500 m 0.94 | 0.4 0.33 | −0.1 0.63 | 0.09 0.8 | −0.25 0.39 | −0.14
value of combining these observation types. The 2.8 km reso- the valley preconditions the HPE. Once precipitation starts,
lution (Fig. 8b) shows a somewhat different vertical distribu- the Nîmes RAD sounding at 05:15 UTC (hereafter referred
tion of specific humidity for CTRL-2.8 (blue) with an over- to as Nîmes_0515) measured 6.5 g kg−1 of specific humid-
estimation of the MB between 800 hPa and 600 hPa up to ity at 700 hPa (Fig. 9b). Compared to other soundings (ei-
0.3 g kg−1 . GPS-2.8 (red) shows similar values of the RMSE, ther operational or high-resolution) released in the area
compared to its CTRL counterpart. The vertical gradient of (Fig. 9b), Nîmes_0515 measured between 1.5 and 2.5 g kg−1
MB is similar to CTRL-2.8 although somewhat drier in GPS- more specific humidity. For example, over Candillargues at
2.8, in agreement with the IWV reduction assessed in Fig. 7 03:14 UTC on 24 September specific humidity at 700 hPa
and Table 2. This leads to the largest MB being found in the was 5 g kg−1 , and over Marseille at 05:55 UTC it was lower
PBL (∼ −0.2 g kg−1 ) in GPS-2.8 (Fig. 8b; red). RAD-2.8 than 4 g kg−1 . This implies that after its assimilation, specific
(yellow) has very good MB (0.2 g kg−1 ) and RMSE values humidity at that level was considerably increased due to this
(0.8 g kg−1 ), as expected, given the dependence on the ob- one particular sounding. To demonstrate this aspect Fig. 9c
servations in this comparison. This influence can also be seen shows that the reference runs of COSMO (CTRL-7 in blue)
for the good scores of GPS–RAD–HR-2.8 (purple). For the at that time over Nîmes have a 700 hPa level 1.5 g kg−1 drier
500 m resolution (Fig. 8c), CTRL-500 (blue) shows an un- than the observation. Hence the correction of humidity at that
derestimation of moisture in the PBL and an overestimation level after 05:15 UTC is crucial for the precipitation increase
above 800 hPa, up to 0.2 g kg−1 . The impact of the different observed for RAD.
observation types is analogous to that observed in the 2.8 km The Gaussian horizontal spreading of information induced
simulations with the exception of HR-500 (green; Fig. 8c). by the nudging scheme (Schraff and Hess, 2012) and the
The previous assessment leads to the conclusions that transport of humidity with the south-westerly mean flow
(a) COSMO misrepresents the humidity vertical gradient for causes much wetter mid-levels over the Rhône valley and
this case study (too wet between 500 and 850 hPa), which over the western Alps. This impact was similar for all res-
was also found for another case study of the HyMeX pe- olutions. To demonstrate quantitatively this impact, Fig. 9d
riod in Caldas-Alvarez and Khodayar (2020); and (b) nudg- shows relative precipitation differences in percent (%) be-
ing GPS did not help improve the representation of the ver- tween the RAD-7 simulation and an auxiliary RAD-7 sim-
tical humidity gradient, as the correction at each level is ap- ulation where the Nîmes_0515 sounding is dismissed. The
plied based on the first guess. The latter explanations imply results show that the contribution to precipitation of the
that COSMO should have simulated stronger convective up- Nîmes_0515 sounding is a 40 % increase spatially averaged
draughts to generate more precipitation at the surface and over the whole domain and up to 70 % downstream of Nîmes.
larger transport of moisture from the PBL to the LFT in the The large impact of the Nîmes_0515 sounding gives im-
CTRL and GPS simulations. portant clues as to whether GPS systems were able to com-
pensate for radiosondes for this case study. With no means
4.3 The relevance of the Nîmes 05:00 UTC sounding to measure the vertical distribution of humidity, GPS strug-
gles to bring the expected improvement in precipitation rep-
The good scores shown by RAD in the precipitation evalu- resentation. The reason why other soundings close to Nîmes
ation (Fig. 5) and the large increase in IWV and precipita- in time and space did not measure such a large humidity
tion are worth an in-depth analysis of the impact of RAD on amount at 700 hPa is still unknown. The large spatial het-
the humidity distribution and convective processes responsi- erogeneity of this variable might have played a decisive role,
ble for the remarkable precipitation increase. Figure 9 sum- and its undersampling has already been identified as a fac-
marizes relevant information about the impact of RAD on tor limiting heavy precipitation simulation (Khodayar et al.,
humidity and precipitation. Between 23 and 24 September, 2018). Unfortunately, no other humidity observations exist
before the arrival of the cold front, vast moisture amounts for that time and location (lidar, pressurized balloons, or
were transported up the Rhône valley by the south-westerly dropsondes). Another possible explanation is an ascent of
circulation (arrow in Fig. 9a). The moisture gathering up
https://doi.org/10.5194/wcd-2-561-2021 Weather Clim. Dynam., 2, 561–580, 2021You can also read