Stratospheric aerosol layer perturbation caused by the 2019 Raikoke and Ulawun eruptions and their radiative forcing - ACP
←
→
Page content transcription
If your browser does not render page correctly, please read the page content below
Atmos. Chem. Phys., 21, 535–560, 2021
https://doi.org/10.5194/acp-21-535-2021
© Author(s) 2021. This work is distributed under
the Creative Commons Attribution 4.0 License.

Stratospheric aerosol layer perturbation caused by the
2019 Raikoke and Ulawun eruptions and their radiative forcing
Corinna Kloss1 , Gwenaël Berthet1 , Pasquale Sellitto2 , Felix Ploeger3,4 , Ghassan Taha5,6 , Mariam Tidiga1 ,
Maxim Eremenko2 , Adriana Bossolasco1 , Fabrice Jégou1 , Jean-Baptiste Renard1 , and Bernard Legras7
1 Laboratoire   de Physique et Chimie de l’Environnement et de l’Espace,
CNRS UMR 7328, Université d’Orléans, Orléans, France
2 Laboratoire Interuniversitaire des Systèmes Atmosphériques, UMR CNRS 7583, Université Paris-Est Créteil,

Université de Paris, Institut Pierre Simon Laplace (IPSL), Créteil, France
3 Forschungszentrum Jülich GmbH, Institute of Energy and Climate Research (IEK-7), Jülich, Germany
4 Institute for Atmospheric and Environmental Research, University of Wuppertal, Wuppertal, Germany
5 Universities Space Research Association, Greenbelt, MD, USA
6 NASA Goddard Space Flight Center, Greenbelt, MD, USA
7 Laboratoire de Météorologie Dynamique, CNRS UMR 8539,

ENS-PSL/Sorbonne Université/École Polytechnique, Paris, France

Correspondence: Corinna Kloss (corinna.kloss@cnrs-orleans.fr)

Received: 10 July 2020 – Discussion started: 7 August 2020
Revised: 4 November 2020 – Accepted: 24 November 2020 – Published: 15 January 2021

Abstract. In June 2019 a stratospheric eruption occurred at    −0.05 (all-sky). Compared to the Canadian fires (2017), Am-
Raikoke (48◦ N, 153◦ E). Satellite observations show the in-   bae eruption (2018), Ulawun (2019) and the Australian fires
jection of ash and SO2 into the lower stratosphere and an      (2019/2020), the highest sAOD and radiative forcing values
early entrainment of the plume into a cyclone. Following the   are found for the Raikoke eruption.
Raikoke eruption, stratospheric aerosol optical depth (sAOD)
values increased in the whole Northern Hemisphere and trop-
ics and remained enhanced for more than 1 year, with peak
values at 0.040 (short-wavelength, high northern latitudes)    1   Introduction
to 0.025 (short-wavelength, Northern Hemisphere average).
Discrepancies between observations and global model simu-      Severe volcanic eruptions can inject a significant amount
lations indicate that ash may have influenced the extent and   of sulfur-containing species and, potentially, ash material
evolution of the sAOD. Top of the atmosphere radiative forc-   directly into the UTLS (Upper Troposphere–Lower Strato-
ings are estimated at values between −0.3 and −0.4 W m−2       sphere). In the UTLS, secondary sulfate aerosols are formed
(clear-sky) and of −0.1 to −0.2 W m−2 (all-sky), comparable    by conversion of sulfur dioxide (SO2 ) to particles. Because of
to what was estimated for the Sarychev eruption in 2009. Al-   the limited potential of dry and wet deposition in the UTLS,
most simultaneously two significantly smaller stratospheric    these particles (sulfate aerosols in particular, but also fine ash
eruptions occurred at Ulawun (5◦ S, 151◦ E) in June and        particles, when present) have a long lifetime. Additionally,
August. Aerosol enhancements from the Ulawun eruptions         sulfate aerosols are reflective and effectively scatter short-
mainly had an impact on the tropics and Southern Hemi-         wave radiation back to space, thus producing a net cooling
sphere. The Ulawun plume circled the Earth within 1 month      effect on the climate (Kremser et al., 2016). The extent of the
in the tropics. Peak shorter-wavelength sAOD values at 0.01    impact on the global stratospheric composition and climate,
are found in the tropics following the Ulawun eruptions        from a volcanic eruption, depends on various parameters: (1)
and a radiative forcing not exceeding −0.15 (clear-sky) and    chemical composition and concentration of the plume, (2)
                                                               geographical location of the erupting volcano, (3) injection

Published by Copernicus Publications on behalf of the European Geosciences Union.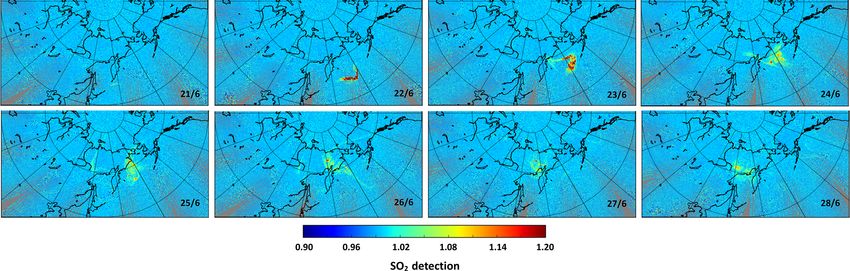
536          C. Kloss et al.: Stratospheric aerosol layer perturbation caused by the 2019 Raikoke and Ulawun eruptions

altitude, and (4) dynamical situation at the time and loca-         clusions about the same volcanic eruption. Furthermore, for
tion of the injection. (1) The sulfur burden in the plume de-       the Sarychev eruption several re-estimations during the past
termines the resulting sulfate aerosol formation and domi-          decade yield different numbers between 0.8 and 1.5 Tg for
nates the climate impact (Kremser et al., 2016). Whether the        the injected SO2 burden (Clarisse et al., 2012; Jégou et al.,
initial plume contains ash or not can modify the chemical           2013; Höpfner et al., 2015; Günther et al., 2018), which in
and microphysical evolution pathways and aerosol forma-             itself indicates the complexity and the uncertainty that goes
tion/evolution and can alter related dynamical features (ra-        along with a single eruption.
diative balance including local diabatic heating) (Robock,             Ten years after the Sarychev eruption, in 2019 another
2000; Vernier et al., 2016). (2) A tropical volcano produc-         eruption similar in location, time of year and load of injected
ing sulfate material into the UTLS usually has a larger ge-         aerosol precursors took place at Raikoke (48◦ N and 153◦ E)
ographical impact than a similarly sized eruption at higher         on 21/22 June 2019. At almost the same time, the volcano
latitudes. From the tropical lower stratosphere air masses          at Ulawun erupted on 26 June and 3 August 2019 (5◦ S and
have the potential to be transported over very long distances,      151◦ E) and two stratospheric fire events occurred in Alberta,
in both hemispheres and up to higher latitudes, within the          Canada (June), and Siberia (July).
Brewer–Dobson circulation (BDC) (Butchart, 2014; Jones                 This study aims at a first description of the complex situa-
et al., 2017). (3) The aerosol lifetime of a plume is also con-     tion in the UTLS around the Raikoke and Ulawun eruptions.
nected with the injection altitude relative to the tropopause. A    We investigate the injection, global transport and climate im-
higher injection altitude results in a longer potential transport   pact of the 2019 eruptions at Raikoke and Ulawun.
within the BDC and a longer sedimentation time, which leads            Section 2 gives an overview of both volcanoes and some
to a longer potential lifetime of the formed or pre-existing        key information on the presented eruptions. In Sect. 3, we in-
aerosol. (4) The dynamical situation around the plume (cy-          troduce the data sets, models and their respective setup. The
clones, anticyclones, jets, etc.) can modify the transport path-    early phase of the injected Raikoke plume and the global
ways and, in some cases, lead to a fast transport/distribution      transport of the Raikoke and Ulawun plumes are analyzed
(Fairlie et al., 2014; Wu et al., 2017).                            in Sect. 4, and the resulting climate impact is estimated in
   The Pinatubo (15.13◦ N, 120.35◦ E) eruption in June 1991         Sect. 5. Finally conclusions are drawn.
is the most recent example of a volcanic eruption with a
global climate influence. Up to around 20 Tg of SO2 was in-
jected into the lower stratosphere (Bluth et al., 1992), which      2     Raikoke and Ulawun eruptions in 2019
caused a global mean surface temperature drop of nearly
                                                                    2.1    Raikoke
0.4 ◦ C (Thompson et al., 2009), although its amplitude has
been debated and revised (Canty et al., 2013; Wunderlich            The Raikoke volcano on the Kuril Islands in the western
and Mitchell, 2017). Since then, no volcanic eruption with          Pacific Ocean (48.29◦ N, 153.25◦ E) is known for its rel-
a comparable impact on the climate has occurred. However,           atively frequent explosive activity (last documented erup-
even without major (Pinatubo-like) stratospheric eruptions          tions in 1924 and 1778) (NASA, 2019). Crafford and Venzke
it has been shown that, during the past 2 decades, moder-           (2019) state that a series of paroxysmal eruptions occurred
ate eruptions substantially increased the amount of strato-         at Raikoke between 21 (18:00 UTC) and 22 (05:40 UTC)
spheric aerosols (Vernier et al., 2011; Solomon et al., 2011;       June 2019. Some first crude estimations with IASI/Metop-
Ridley et al., 2014). Some prominent “moderate-sized” vol-          B data indicate SO2 altitudes in the range between 10 and
canic eruptions during the last decade were recorded, in            16 km on 23 June (Aeris, 2018). Hedelt et al. (2019) show
particular at Kasatochi on 7 August 2008 in southwestern            plume altitudes ranging from 6–8 km up to 18 km altitude
Alaska (52.17◦ N, 175.51◦ E), Sarychev on 15 June 2009 on           with TROPOMI observations on 23 June and from 11 to
the Kuril Islands (48.1◦ N, 153.2◦ E) and Nabro on 12/13            20 km altitude the following day. Sentinel5P/TROPOMI ob-
June 2011 in the Afar Triangle between Ethiopia and south-          servations indicate an SO2 injected mass of around 1.35 Tg
ern Eritrea (13.37◦ N, 41.47◦ E). The eruption at Kasatochi         in the Raikoke plume from 23 June (Carn, 2019a). Airplanes
produced an initial SO2 injection of 0.7–2.2 Tg (Kristiansen        flying over the North Pacific had to be redirected (Crafford
et al., 2010; Krotkov et al., 2010; Günther et al., 2018). The      and Venzke, 2019).
SO2 burden injected from the Sarychev eruption into the
UTLS was originally calculated at 1.2 ± 0.2 Tg (Haywood             2.2    Ulawun
et al., 2010). After Pinatubo, the Nabro eruption was consid-
ered the largest single injection of SO2 into the UTLS, with        The Ulawun volcano in Papua New Guinea (5.05◦ S,
1.3–2 Tg (e.g., Clarisse et al., 2012; Sawamura et al., 2012).      151.33◦ E) was identified as 1 of the 16 “decade volcanoes”
   An accurate description of such stratospheric volcanic           by the International Association of Volcanology and Chem-
eruptions is challenging. Fromm et al. (2014) raise aware-          istry of the Earth’s Interior (IAVCEI) and is therefore known
ness of some limitations in data quality, but conflicting in-       as one of the most potentially destructive volcanoes on Earth
jection sequence information can also lead to different con-        (Cas, 2019). Two eruptions occurred during summer 2019,

Atmos. Chem. Phys., 21, 535–560, 2021                                                  https://doi.org/10.5194/acp-21-535-2021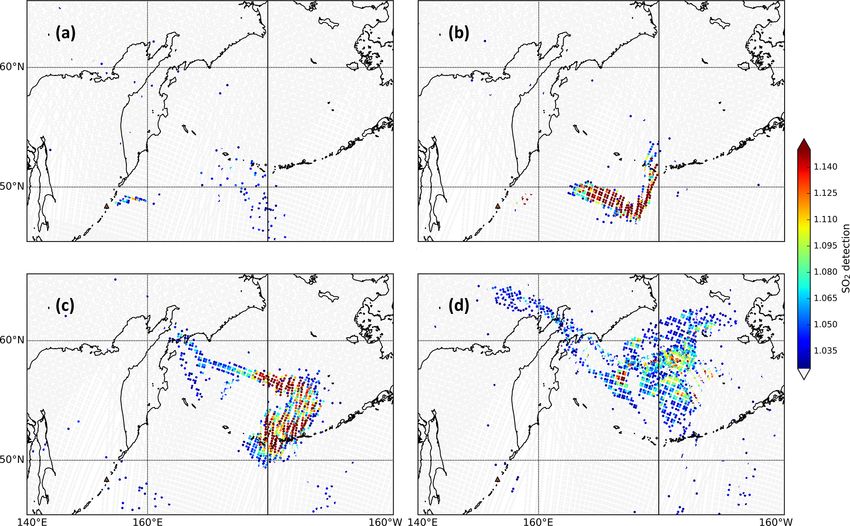
C. Kloss et al.: Stratospheric aerosol layer perturbation caused by the 2019 Raikoke and Ulawun eruptions                     537

on 26 June and 3 August. Injection altitudes of SO2 are iden-      lar occultation measurements are provided for various wave-
tified between 13 and 17 km with IASI/Metop-B data for the         lengths: 384, 449, 521, 676, 756, 869, and 1020 nm. Mea-
first eruption on 26 June. For the second and larger eruption,     surements have been provided since June 2017 between
IASI/Metop-B data indicate SO2 altitudes of around 14–             60◦ S and 60◦ N on a 0.5 km vertical grid from 0.5 (or cloud
17 km for 3 and 4 August (Aeris, 2018). For the first eruption     top) to 40 km altitude. The vertical resolution is ≈ 1 km. Sim-
Sentinel5P/TROPOMI data suggest a SO2 load of ≈ 0.14 Tg            ilarly to OMPS, the tropopause information is included in the
of the plume, while the second one was a bit larger and data       data set from the MERRA-2 reanalysis. We use the data ver-
suggest ≈ 0.2 Tg of SO2 (Carn, 2019b). With its tropical lo-       sion 5.1. Chen et al. (2019) find good agreement between
cation, the eruptions at Ulawun have the potential to have an      SAGE III/ISS and OMPS data. In particular, after the erup-
impact on the lower stratosphere of both hemispheres within        tion at Ambae a small discrepancy (< ±10 %) was found.
the BDC, once injected into the UTLS (Butchart, 2014; Jones        As a solar occultation instrument, SAGE III/ISS provides
et al., 2017). Ulawun remained in an active phase with ob-         30 measurements per day. This relatively low sampling rate
served ash plumes in October 2019 up to 3 km altitude (Ben-        (e.g., compared to OMPS) limits the interpretability of the
nis and Venzke, 2019). By February 2020 only water vapor           finer transport features analyzed with SAGE III/ISS. How-
plumes were observed and the Alert Level remained at Stage         ever, the better vertical resolution and observations at mul-
1 (Sennert, 2020).                                                 tiple wavelengths compared to OMPS bring an added value
                                                                   when spatiotemporally averaged data are used for the radia-
                                                                   tive forcing calculations. The wavelength dependence, for
3     Methods                                                      example, can be used to extract information on the aerosol
                                                                   size distribution via the Angström exponent.
3.1    OMPS

The Ozone Mapping Profiler Suite Limb Profiler (OMPS-              3.3   Himawari
LP) is onboard the Suomi National Polar-orbiting Partnership
satellite that was launched in October 2011. It was originally     Himawari-8 is a geostationary satellite at 140◦ E from the
designed for height-resolved atmospheric ozone observations        Japanese Space Agency providing measurements of tempera-
(Loughman et al., 2018; Bhartia and Torres, 2019). Aerosol         ture, clouds, precipitation and aerosol distribution since 2015
extinction measurements at 675 nm are provided from 10 to          (launched in 2014). It has an expected lifetime of 8 years and
40 km altitude on a 1 km vertical grid. Three slits separated      will be replaced afterwards by Himawari-9. It observes the
horizontally by 4.25◦ result in three measured profiles at each    area of East Asia and the western Pacific (Da, 2015). We use
point in time separated by 250 km of the tangent points at the     the brightness temperature (BT) observations from the 16-
Earth’s surface. The vertical resolution is ≈ 1.6 km. Here, we     channel multispectral imager from the Clear Sky Radiance
use the aerosol extinction profile measurements from 2017          product (Uesawa, 2009). The data have a spatial resolution at
onwards of the NASA OMPS data product version 1.5 (Rault           a sub-satellite point of 2 km for the infrared channels (0.46–
and Loughman, 2013). A near-global coverage is produced            13.3 µm). For the interpretation of the results in this study,
within 3–4 d. Tropopause values are included in the data set       we use the operational Eumetrain RGB recipes (Eumetrain,
from the MERRA-2 (Modern-Era Retrospective analysis for            2020), which allows the discrimination between clouds, ash
Research and Applications, Version 2) forward processing           and SO2 , thanks to the combination of the infrared channels
(Randles et al., 2017; Gelaro et al., 2017). To avoid remov-       at 8.5, 10.4 and 12.3 µm. The Dust RGB product performs
ing enhanced aerosol layers that are mistakenly identified as      better for volcanic plumes than the Ash RGB product at large
clouds, we use the unfiltered OMPS data set. The influence         viewing angles. Thus, the Dust RGB product is used to de-
of stratospheric clouds for the interpretation of this transport   scribe the first phases of dispersion of the Raikoke plume.
study about the Australian fire plume is expected to be neg-
ligible and not further analyzed. With its high sampling rate,     3.4   IASI
we use the OMPS data set to study the global transport of the
respective volcanic plumes in the lower stratosphere.              The Infrared Atmospheric Sounding Interferometer (IASI)
                                                                   is a Fourier transform spectrometer (Clerbaux et al., 2009),
3.2    SAGE III/ISS                                                operating between 645 and 2760 cm−1 (3.62 to 15.5 µm)
                                                                   spectral range onboard the MetOp-A/B/C spacecraft series
As part of an ongoing instrumental series, a Stratospheric         since 2006/2012/2018, respectively. The instrument provides
Aerosol and Gas Experiment instrument flies onboard the In-        global coverage every 12 h, thanks to its circular footprints
ternational Space Station (SAGE III/ISS). It is a solar and        of 12 km radius spaced by 25 km at nadir and a swath of
lunar occultation instrument, providing, among other param-        2200 km. The IASI has the relatively high apodized spec-
eters, vertical profile observations of ozone, water vapor,        tral resolution of 0.5 cm−1 . While its primary target is the
nitrogen dioxide and nitrogen trioxide concentration, and          monitoring of meteorological parameters (surface tempera-
aerosol extinction. Aerosol extinction values from the so-         ture, temperature, humidity profiles and cloud information),

https://doi.org/10.5194/acp-21-535-2021                                               Atmos. Chem. Phys., 21, 535–560, 2021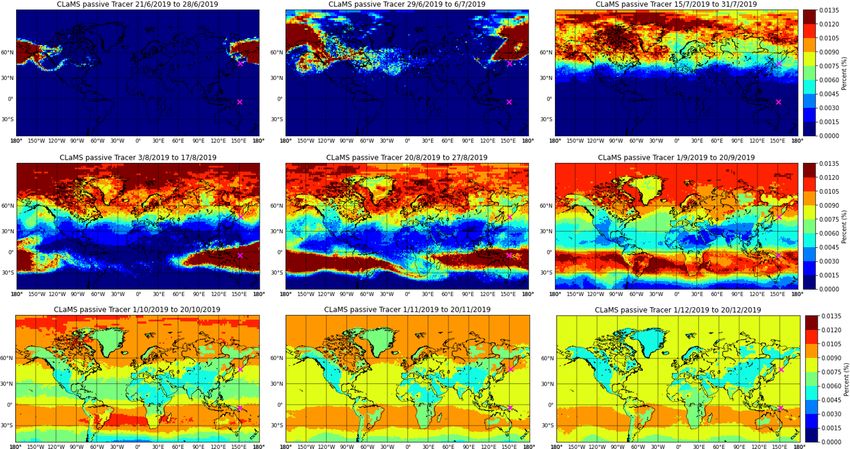
538         C. Kloss et al.: Stratospheric aerosol layer perturbation caused by the 2019 Raikoke and Ulawun eruptions

IASI also provides high-quality information on trace gas pa-       ful laser source (65 mW instead of 25 mW formerly). The
rameters and particles, including gases and particles emitted      size distributions have been converted to 675 nm extinction
by volcanoes (e.g., Clarisse et al., 2013; Carboni et al., 2016;   with the Mie scattering theory, assuming spherical particles
Ventress et al., 2016; Guermazi et al., 2020).                     with a refractive index corresponding to stratospheric sulfu-
   In this work, we exploit the high spectral resolution of        ric acid particles. Only size classes below 1 µm have been
IASI to resolve one absorption line of SO2 to provide a quick      used to avoid spurious effects (i.e., local enhancements in
estimate of SO2 detection in volcanic plumes (i.e., without        the calculated extinction value) resulting from the transient
the use of a detailed and computationally demanding inver-         presence of micrometric particles. As a result, only a partial
sion algorithm, e.g., based on radiative transfer model-based      extinction has been derived. In this study, we use LOAC ob-
spectral fitting). We define the following parameter:              servations during balloon ascent from France (Ury, 48.34◦ N,
                                                                   2.60◦ E) from 11 measurement flights, i.e., 22 March 2019,
DSO2 = R(ν2 )/R(ν1 ).                                       (1)    8 and 29 August 2019, 16 September 2019, 11 and 30 Oc-
R(ν) represents the radiance observed from IASI at                 tober 2019, 20 November2019, 3 December 2019, 7 Jan-
wavenumber ν. The two values ν1 = 1129.25 cm−1 and ν2 =            uary 2020, 6 February 2020, and 6 March 2020. For the
1130.25 cm−1 represent two spectrally close wavenumbers,           transformation from aerosol concentration to extinction for
the first at the center of a SO2 absorption line and the sec-      the stratospheric aerosol optical depth (sAOD) comparisons
ond outside. Figure 1 shows a case of simulated IASI spectra       with satellites, only size classes below 1 µm are used because
with and without SO2 (all other parameters in the simula-          of artifacts, which appear for size classes above 1 µm.
tions of the IASI spectra are the same, e.g., surface temper-
ature, temperature and humidity profiles, gaseous absorbers        3.6   Transport simulation with CLaMS
and aerosol profiles). The two selected wavenumbers ν1 and
ν2 are highlighted to show their extreme position (ν1 at the       The Chemical Lagrangian Model of the Stratosphere
approximate center and ν2 outside the absorption feature) in       (CLaMS) is a Lagrangian chemistry transport model. The
one isolated SO2 absorption line, which is not affected by the     model transport is based on 3D forward trajectories and an
absorption of water vapor or other extra-SO2 species. From         additional parameterization of small-scale mixing (McKenna
the definition of Eq. (1) and Fig. 1 it is possible to see that    et al., 2002; Pommrich et al., 2014). The transport is driven
values of DSO2 larger than 1.0 are linked to spectra where         by the ERA-5 meteorological data (Hersbach et al., 2020). As
SO2 is detected. It is important to stress that DSO2 is purely     CLaMS uses an isentropic vertical coordinate in the strato-
a qualitative detection parameter and is not to be taken as a      sphere, vertical transport in the model is driven with the re-
quantitative retrieval of the SO2 concentration even if linked     analysis total diabatic heating rate.
to the latter. This parameter is only useful in case of strong        Here, we perform CLaMS passive transport simulations
SO2 anomalies, like the one generated by the Raikoke erup-         for both volcanic eruptions. Chosen boxes in space and time
tion, and for the analysis of relatively large-scale dispersions   are filled with a passive tracer and monitored in terms of
of SO2 -rich plumes.                                               dynamical behavior for the following months. The initial-
                                                                   ization box for Raikoke was chosen for 23–24 June 2020,
3.5   LOAC in situ measurements                                    163◦ E–170◦ W, 49–62◦ N and 335–460 K potential tempera-
                                                                   ture. For the Raikoke eruption the box was chosen according
The Light Optical Aerosol Counter (LOAC) is an optical par-        to Hedelt et al. (2019). IASI/Metop-B data from Aeris (2018)
ticle counter suitable for tropospheric and stratospheric ob-      show similar injection altitudes (see Sect. 2). The Ulawun
servations of aerosol concentration (Renard et al., 2016). It      transport was initialized on 3–4 August 2019, 137–178◦ E,
is light and compact enough for in situ measurements us-           10◦ S–5◦ N and 350–385 K potential temperature, according
ing weather balloons. It provides particle number concentra-       to IASI/Metop-B data.
tions for 19 sizes in the 0.2–50 µm size range, with an un-           Note that the CLaMS model analysis has certain limita-
certainty of ±20 % for concentrations higher than 1 particle       tions. As a consequence of choosing a box shape for the ini-
per cm3 ; the uncertainty increases to about ±30 % for sub-        tialization of the simulations, many of the presented trajecto-
micron particle concentrations higher than 1 particle per cm3      ries do not exactly originate from the actual plume position.
and to about ±60% for concentrations smaller than 10−2 par-        However, we want to emphasize that the CLaMS simulations
ticles per cm3 . The raw LOAC concentrations are corrected         in this study are purely to be taken as a rough idea of the
in terms of sampling efficiency for observations during bal-       transport from the respective initialization boxes.
loon ascent (Renard et al., 2016), the sampling being domi-
nated by sub-isokinetic conditions and the divergence of the       3.7   UVSPEC radiative forcing calculations
flow field at the inlet entrance. LOAC V1.5 data used in this
study have been improved in comparison with LOAC V1.2              We use the UVSPEC (UltraViolet SPECtrum) radiative
presented in Renard et al. (2016), resulting in reduced stray      transfer model as implemented within the LibRadtran pack-
light and a higher signal-to-noise ratio with a more power-        age (Mayer and Kylling, 2005) (http://www.libradtran.org/

Atmos. Chem. Phys., 21, 535–560, 2021                                                 https://doi.org/10.5194/acp-21-535-2021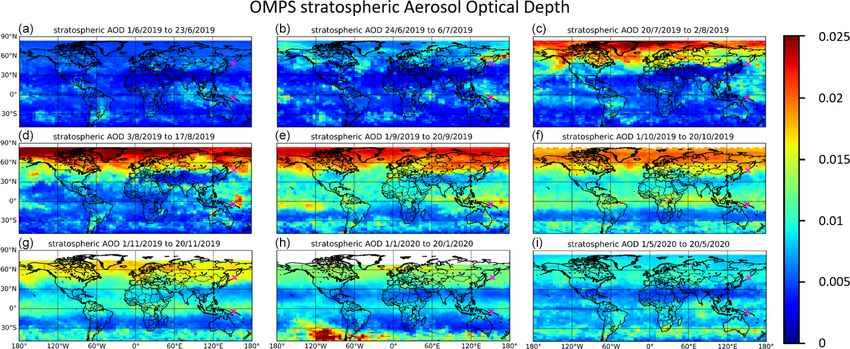
C. Kloss et al.: Stratospheric aerosol layer perturbation caused by the 2019 Raikoke and Ulawun eruptions                       539

Figure 1. Simulated IASI spectra with (black) and without (red) SO2 and a zoom of the SO2 absorption line used to define the DSO2
parameter of Eq. (1).

doku.php, last access: 8 January 2021). With UVSPEC, the             ground conditions, i.e., without volcanic aerosols (details on
daily-average (equinox-equivalent) regional shortwave sur-           the spatiotemporal identification of the background are given
face and top-of-the-atmosphere (TOA) radiative forcing (RF)          in Sect. 5). For both setups (background and volcanically per-
are estimated. The RF estimations are based on radiation flux        turbed) we carry out multiple runs with varying solar zenith
simulations in the spectral range from 300 to 3000 nm, with          angles (SZAs). Finally, the daily-average shortwave TOA ra-
a 0.1 nm spectral resolution. The radiative transfer equation        diative forcing is calculated by integrating the SZA-averaged
is parameterized and solved as follows. (1) The solar flux           upward diffuse irradiance for the background scenario over
spectra used to drive the simulations are taken from Kurucz          the whole shortwave spectral range. The shortwave surface
(Kurucz, 1994). (2) Vertical profiles of temperature, pres-          radiative forcing is calculated with the SZA-averaged down-
sure, humidity and gas concentration come from the clima-            ward global irradiance with aerosols minus the background
tological standards of the Air Force Geophysics Laboratory           scenario, integrated over the whole spectral range.
(AFGL). Mid-latitude standard profiles are used for simu-
lations of the Raikoke plume, while tropical standard pro-           3.8   WACCM model
files are used for Ulawun. (3) The molecular absorption is
parameterized with the LOWTRAN band model (Pierluissi                Model simulations were performed using the global CESM1
and Peng, 1985) (as adopted from the SBDART code). We                (Community Earth System Model 1) using its Whole At-
consider a fixed wavelength-independent value of 0.1 for the         mosphere Community Climate Model (WACCM) module
surface reflectivity. This is intended to represent an average       linked to the CARMA (Community Aerosol and Radiation
value for the main surfaces underneath the dispersed plume:          Model for Atmospheres) module, involving the sulfur cycle
ocean, and bare and vegetated soil. It is important to mention       with a sectional aerosol scheme (English et al., 2011). Land,
that the surface reflectance can be significantly larger for ice-    sea ice, and rivers were active modules, whereas oceans were
and snow-covered surfaces; RF estimations can be quite sen-          prescribed. The spatial resolution was a longitude–latitude
sitive to the surface reflectance (Sellitto et al., 2016). (4) The   grid of 144 points by 96, respectively (i.e., approximately
radiative transfer equation is then solved with the SDISORT          2◦ resolution) and over 88 levels of altitude ranging from the
method (the pseudo-spherical approximation of the discrete           ground to approximately 150 km altitude with approximately
ordinate method – DISORT). The volcanically perturbed                20 levels in the troposphere. Specified dynamics were used,
simulations are carried out by adding average SAGE III/ISS           with a nudging towards the Modern-Era Retrospective anal-
profile observations of the volcanic aerosol extinction co-          ysis for Research and Applications 2 (MERRA-2) meteoro-
efficient (details on the spatiotemporal identification of the       logical data (Randles et al., 2017; Gelaro et al., 2017) at ev-
volcanic perturbations are given in Sect. 5). As a baseline,         ery time step (30 min) with a weight factor of 0.1 towards the
SAGE III/ISS aerosol extinction profiles are taken for back-         analysis, for temperature and wind fields. Anthropogenic sur-

https://doi.org/10.5194/acp-21-535-2021                                                 Atmos. Chem. Phys., 21, 535–560, 2021
540 C. Kloss et al.: Stratospheric aerosol layer perturbation caused by the 2019 Raikoke and Ulawun eruptions
Table 1. Characteristics of the model setup accounting for volcanic 4 Results
injections of SO2 . The injections have been initialized between
18:00 and 00:00 UTC. 4.1 Injection and early dispersion of the Raikoke
plume
Volcano Date and time SO2 mass Injection altitude
range
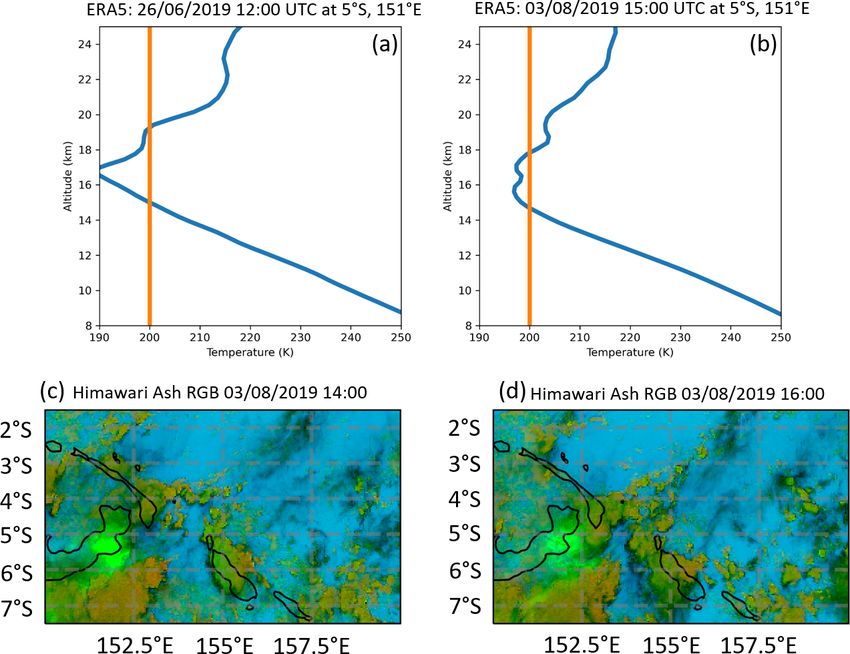
Using a similar method to Kloss et al. (2020), we attempt
Raikoke 21–22 June 2019 1.5 Tg 9–16 km an estimation of the injection height using Himawari in-
Ulawun 26 June 2019 0.14 Tg 16–17 km frared brightness temperature information at the moment of
Ulawun 3 August 2019 0.30 Tg 17–18 km the main eruption and coincident temperature profiles from
ERA5 reanalyses. The brightness temperature of the plume
core (not shown) exhibits a plateau at about 225 K within a
few hours after the eruption. However, the exact injection al-
face emissions were prescribed for SO2 using the MACCity titude could not be identified due to the fact that the temper-
data set (e.g., Diehl et al., 2012). Carbonyl sulfide (OCS) was ature profile in the area of the Raikoke is quasi-isothermal
prescribed using data from Kettle et al. (2002). The simula- in the altitude range between 10 and 24 km (see support-
tion presented in this study deals with a multi-annual model ing material, Fig. A1a). Thus, a univocal attribution of the
experiment starting on 1 January 2013 using the CESM1 plume top height at the time of the main eruption is not
initial atmosphere state file at that date. The Raikoke and possible using this method. With the exception of an over-
Ulawun eruptions have been simulated by injecting a vol- pass at around 49◦ N that intersected only a narrow tail of
canic SO2 mass burden into model grid boxes corresponding the volcanic plume at around 16–17 km altitude, there are
to the locations of the volcanoes (Raikoke 48◦ N and 153◦ E, no CALIOP intersections of the core plume during the early
Ulawun 5◦ S and 151◦ E), over 6 h, spread evenly between stage. An OMPS aerosol extinction profile, which was ob-
a certain altitude range for each eruption (see Table 1 for a served on 22 June 2019 02:26 UTC at 49◦ N and 154◦ E, dis-
summary of the model setup) following the method of Mills plays an enhanced aerosol signal at ≈ 14 km altitude (sup-
et al. (2016). The chosen SO2 burden of 1.5 Tg for Raikoke porting material Fig. A1b) that is compatible with previous
is in fairly good agreement with Muser et al. (2020), who estimates (e.g., Muser et al., 2020). A sequence of Himawari-
calculate 1.37 ± 0.07 × 10⁹ kg with TROPOMI and estimate 8 infrared observations at 20 min intervals has been used to
1–2 × 10⁹ kg with HIMAWARI data. The model’s 2.5◦ lon- produce a GIF (GIF in the supporting material), which dis-
gitude × 1.875◦ latitude grid resolution means that the vol- plays the complex pattern of plumes of gas and ash emitted
canic plumes are initially too diluted in the model compared by the successive explosions. The exact estimation of the in-
to reality. This is nevertheless a typical methodology used jection altitude is evidently complicated. For the first Ulawun
in the literature (e.g., Lurton et al., 2018). The timing and eruption we estimate an injection altitude between 15 and
injection altitude of the SO2 emissions are based on infor- 19 km and for the second between 15 and 18 km, with Hi-
mation provided by the SSiRC (Stratospheric Sulfur and its mawari brightness temperature and the corresponding ERA5
Role in Climate) community (SSiRC, 2018), Sect. 2, and the temperature profile (Fig. A2). These differ from the estima-
results shown in Sect. 4.1. This SSiRC information relies tion derived from IASI (Sect. 2). CALIOP data (not shown)
on SO2 satellite retrievals from IASI (Clarisse et al., 2012), exhibit plumes up to 18 km for the first eruption and 18.5 km
OMI (Ozone Monitoring Instrument, Theys et al., 2015), and for the second eruption. The initial evolution of the Raikoke
MLS (Krotkov et al., 2008). Uncertainties and discrepan- plume is shown with the Himawari Dust RGB images start-
cies in injection altitude (Sects. 2 and 4.1) have motivated ing from 21 June 19:00 UTC (Fig. 2). The Dust RGB product
us to find compromise values for the selected input parame- is used instead of the Ash RGB product because it is more
ters in the model (see Table 1). The OMPS aerosol extinction sensitive for large satellite viewing angles, which is the case
profile shortly after the Raikoke eruption shown in Fig. A1 for the region of interest for Raikoke. This product is based
supports the chosen altitude range of 9–16 km. The CESM1 on the stronger absorption of ashes at 12 µm than at 10.4 µm,
(WACCM) atmospheric chemistry scheme includes a com- while it is the opposite for ice and liquid water and on the
prehensive sulfur cycle and key stratospheric nitrogen (NOy ) absorption by SO2 at 8.7 µm. It depends a lot on the size
and halogenated and hydrogenated (in particular HOx rad- distribution of aerosols and ice crystals and provides only
icals) compounds. The formation and microphysics of sul- qualitative information (Millington et al., 2012). This plume
furic acid aerosol particles simulated by the CARMA mod- is initially composed of ash (reddish colors in Fig. 2), with
ule are described in detail in English et al. (2011). Following also some evidence of SO2 (yellow and bright green colors in
Lurton et al. (2018), aerosol extinctions have been derived at Fig. 2). The remaining brownish and blueish colors indicate
550 nm and integrated above the tropopause to yield a sAOD. the presence of water- and ice-dominated clouds associated
In our study, the Raikoke and Ulawun eruptions are simu- with the volcanic plume. Over 22 June, the plume disperses
lated by WACCM from a pure sulfate point of view; i.e., ash eastward of the volcano and separates into an ash-dominated
emissions are not included. component in the south and a SO2 -dominated component in
Atmos. Chem. Phys., 21, 535–560, 2021 https://doi.org/10.5194/acp-21-535-2021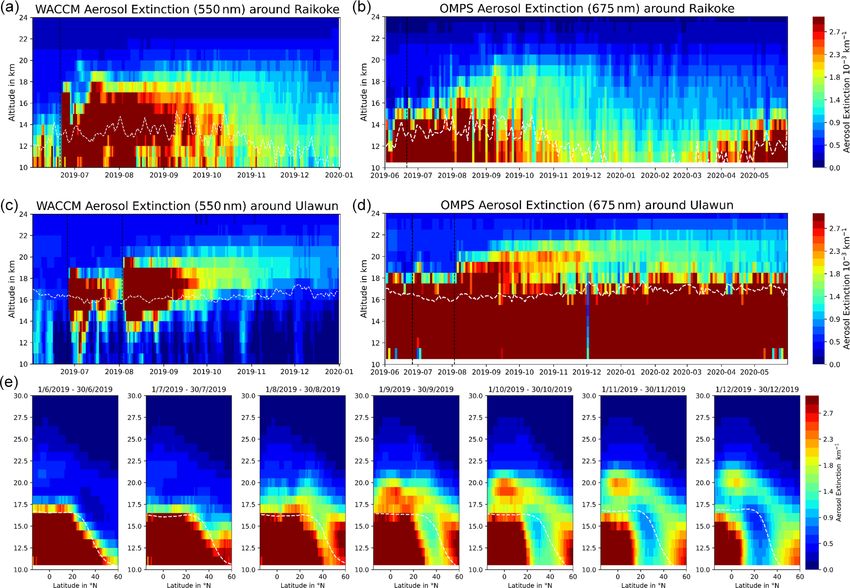
C. Kloss et al.: Stratospheric aerosol layer perturbation caused by the 2019 Raikoke and Ulawun eruptions                               541

Figure 2. Himawari Dust RGB images from 21 June 2019 to 28 June 2019, over the region of Raikoke. Red: ash; bright green: SO2 ; yellow:
mixture of SO2 and thin ash; greenish: thick and thin mid-level clouds or cirrus clouds; brown: thick and high ice clouds; blue: humid low-
level air; pink to violet: dry low-level air. The contour lines are plotted for the Montgomery potential on the potential temperature surface
340 K and indicate the mean atmospheric circulation. The image frame is expanded from the first panel to the last to follow the dispersion of
the plume.

the north (see the two upper rows of Fig. 2). In the follow-             tion of the Aleutian low which was exceptionally strong for
ing days, the ash plume is rapidly diluted or sediments and              this summer period. As a consequence, the confined plume
cannot be further followed. The SO2 plume instead persists               remains compact and exhibits a number of dense patches
and, from 23 June, stops moving eastward to wrap upon itself             and filaments that are well defined in the Himawari images,
and get trapped for several days within the cyclonic circula-            reaching locations as far as Alaska and central Russia, as vis-

https://doi.org/10.5194/acp-21-535-2021                                                       Atmos. Chem. Phys., 21, 535–560, 2021
542 C. Kloss et al.: Stratospheric aerosol layer perturbation caused by the 2019 Raikoke and Ulawun eruptions
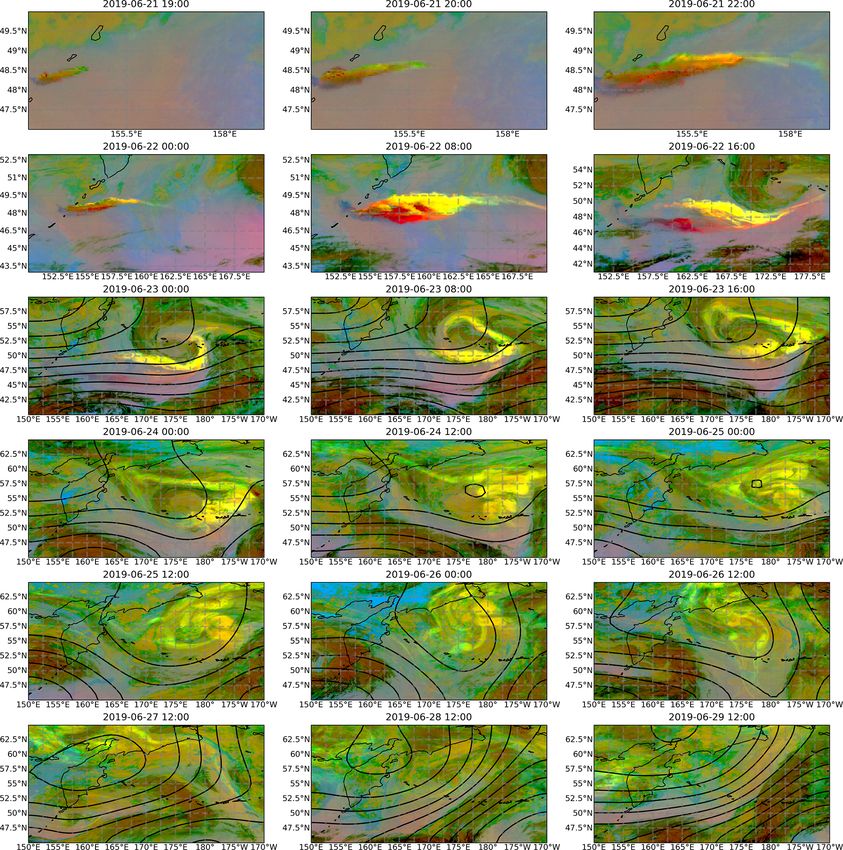
Figure 3. IASI SO2 detections DSO2 for the morning overpasses (about 09:00 LT) (a) for 22, (b) 23, (c) 24, and (d) 25 June 2019.
ible from IASI DSO2 observations (in the supporting material pact on the stratospheric aerosol layer properties and radia-
Fig. A3). CALIOP sections of these patches on 25 and 26 tive balance.
June (not shown) exhibit aerosol plumes up to 15.5 km. We The initial injection and early plume dispersion during the
find no confirmation of the rise to 22 km within a few days first week, seen in Figs. 2 and 3 with Himawari and IASI ob-
reported in the modeling study of Muser et al. (2020). After servations, are not as evident looking at the global view from
25 June, the SO2 plume gets more diluted and is converted to OMPS (Fig. 4a). A blind stage like this for observational data
sulfate aerosols. The presence of a compact SO2 plume, af- was also found after the Sarychev eruption (Haywood et al.,
ter ash removal, is supported by the strong detection of SO2 ; 2010). Figure 4b shows a first clear enhancement north of the
i.e., DSO2 values significantly larger than 1.0 are obtained Raikoke location spreading towards the east during the first
with the high-spectral-resolution observations of IASI, start- week of July (more than 1 week after the initial injection).
ing from 23 June 2019, at about 09:00 UTC (morning over- This enhancement of the aerosol extinction is most likely
pass, Fig. 3b). The intensity of the DSO2 detection parameter due to the conversion of the SO2 plume to sulfate aerosols
decreases in the following days (Fig. 3c and d), as the plume (i.e., longitude dispersion occurred faster than the conver-
dilutes and a part of the SO2 converts to sulfate aerosols. sion to H2 SO4 ). Enhanced sAOD values in Fig. 4b further
west (i.e., above Europe) can be attributed to the plume from
the Alberta fires in Canada from June 2019 (Jenner, 2019).
4.2 The global dispersion of the Raikoke and Ulawun During the following weeks and months the sAOD increases
plumes with OMPS observations and WACCM throughout all longitudes north of the Raikoke location. In
simulations August (Fig. 4d) the AOD is increased by around a factor
of 5 compared to prior Raikoke conditions in Fig. 4a, reach-
ing values larger than 0.025 for the integrated sAOD (cal-
After the first atmospheric processing following the injection
culated from the tropopause upwards). Starting from August
in the UTLS, including the entrainment into the storm dis-
an increase in AOD is also evident south of the Raikoke loca-
cussed in Sect. 4.1, the Raikoke plume entered the global,
tion. Even in the mid latitudes and tropics an enhanced signal
lower stratosphere. To study the global, stratospheric distri-
is visible in Fig. 4d and e. This might result from an effi-
bution of the enhanced aerosol layer during the year follow-
cient transport within the horizontal circulation of the Asian
ing the Raikoke eruption in June 2019, we use the OMPS-
monsoon anticyclone (AMA). This is supported by the fact
LP aerosol extinction observations for 1 year following the
that no aerosol enhancement is visible within the AMA core
eruption (Figs. 4 and 5a) combined with WACCM simula-
(Fig. 4c and d). A mixing from the aerosol plume from the
tions (Fig. 5b and c). We investigate the possible interaction
second Ulawun eruption (3 August) is possible as well. From
between the Raikoke and Ulawun perturbations and their im-
Atmos. Chem. Phys., 21, 535–560, 2021 https://doi.org/10.5194/acp-21-535-2021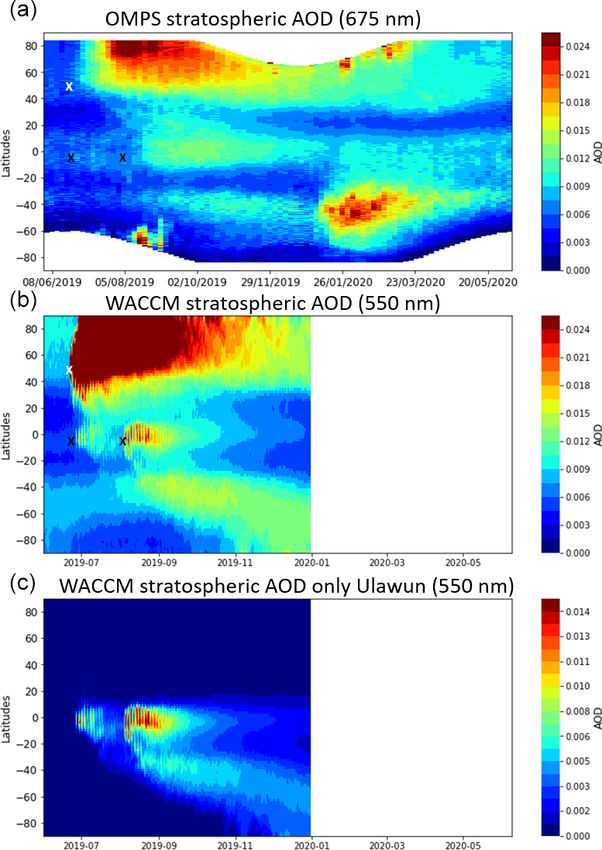
C. Kloss et al.: Stratospheric aerosol layer perturbation caused by the 2019 Raikoke and Ulawun eruptions                        543

Figure 4. Global OMPS (at 675 nm) sAOD averaged over the indicated time frames (a–i: June 2019 to May 2020). The locations of Raikoke
and Ulawun are indicated with magenta crosses. White areas in the north are not covered by OMPS measurements.

July to October (Fig. 4c–f) the transport barrier of the AMA         We attribute enhanced sAOD values from August 2019 on-
leads to a low bias of sAOD values (i.e., air masses with            wards south of 30◦ S, which are clearly separated from the
increased aerosol do not pass into the area of the AMA).             increased values in the tropics, to a horizontal tropopause
From September 2019 to May 2020 AOD values systemati-                crossing, originating from the Ulawun eruptions (further dis-
cally decrease as the downwelling of the lower branch of the         cussed below). During the end of 2019/beginning of 2020
BDC in the NH (Northern Hemisphere) intensifies and due to           historically severe wildfires occurred in Australia. Through
wet/dry deposition once aerosols are back in the troposphere.        the formation of pyro-convection a significant part of smoke
However, values remain elevated compared to prior Raikoke            particles was injected into the stratosphere (Khaykin et al.,
conditions even nearly 1 year after the eruption (Fig. 4i).          2020; Ohneiser, 2020). Most of the enhanced AOD in the SH
Elevated AOD values in the NH in January 2020 (Fig. 4h)              in Fig. 4h and i originates from those fires, likely mixing with
point to polar stratospheric clouds related to the strong Arctic     the remaining enhanced aerosol signature from the Ulawun
stratospheric vortex in winter 2020 (Lawrence et al., 2020).         eruptions. While in this study we focus on the complex sit-
   Other than for Raikoke, OMPS detects elevated aerosol             uation of the global transport of the Raikoke and Ulawun
extinction values already during the days following both             aerosol plumes in the tropics and NH, the global impacts
Ulawun eruptions. Figure 4b and d show enhanced sAOD                 of the Australian fires have mostly been in the lower strato-
values during the 2 weeks following each eruption. The sec-          sphere in the SH (Southern Hemisphere). They pose a unique
ond Ulawun eruption gives a higher AOD signal in terms of            example of stratospheric perturbation from an extreme wild-
spatial extent and maximum value (by a factor of around 2,           fire event and should be investigated in a separate study.
Fig. 4b and d). The aerosol plume from the first Ulawun erup-           Another representation of the horizontal distribution and
tion (23 June) mostly propagates eastwards at the Equator            evolution of sAOD (latitude–time Hovmöller plots, averaged
(Fig. 4b and c). The plume from the second eruption was              over all longitudes) is presented in Fig. 5a for OMPS obser-
distributed in both directions in the tropics (east and west,        vations and Fig. 5b and c for the WACCM simulations. While
Fig 4d). The eastward transport dominates, which depends             OMPS observations show a clear increase of AOD only
on the vertical distribution of the aerosol and the phase of         around 1 month after the eruption north of the Raikoke po-
the QBO (quasi-biennial oscillation) (Lee and Smith, 2003).          sition (48◦ N), WACCM already gives a strong signal during
During October and November (Fig. 4f and g) the tropical             the initial injection (Fig. 5b). During the first few months (un-
stratosphere is enhanced with increased aerosol extinction           til October) WACCM sAOD values are significantly larger.
values. We estimate a circling of the Earth in the tropics of        These deviations may be due to different reasons. In part,
the second Ulawun eruption in the vicinity of 1 month. The           this depends on the different wavelengths of OMPS observa-
tropical background aerosol 1 month after the Ulawun erup-           tions and WACCM outputs: 550 nm for WACCM and 675 nm
tions is increased by a factor of around 3, reaching sAOD            for OMPS. The lack of ash emissions in the WACCM sim-
values as high as 0.02, in a very limited latitude range. In         ulations also causes different dynamics of sulfate aerosols
May 2020 the AOD signal in the tropics remains enhanced.             formation. This is a well-known effect in volcanic erup-

https://doi.org/10.5194/acp-21-535-2021                                                  Atmos. Chem. Phys., 21, 535–560, 2021
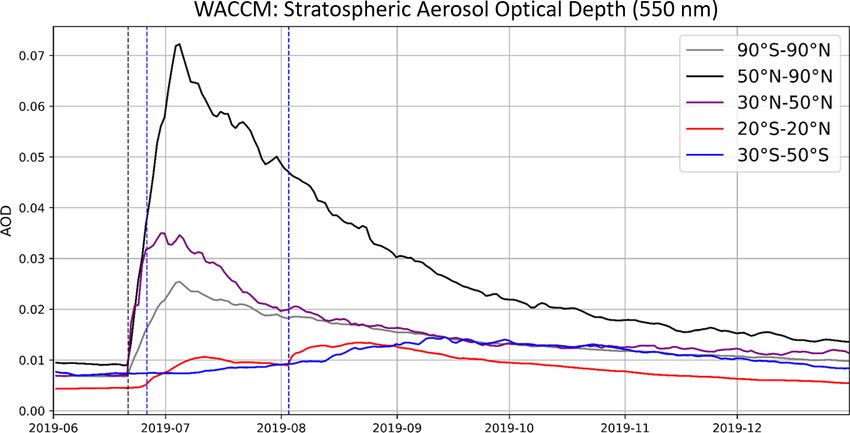
544          C. Kloss et al.: Stratospheric aerosol layer perturbation caused by the 2019 Raikoke and Ulawun eruptions

Figure 5. Latitude/time global distribution of the longitude-averaged sAOD. (a) For OMPS observations and (b) the integrated stratospheric
column for the WACCM simulation for both eruptions and (c) for the Ulawun-only WACCM simulations. Crosses symbolize the position
and timing of the eruptions, white for Raikoke and black for Ulawun. The WACCM sAOD is shown here for sulfate only, i.e., with no
condensation of water, to eliminate the signature of PSCs in the winter hemisphere, which would likely mask the signature of the plume
closer to the pole.

tion modeling, and similar deviations between limb observa-            bations after the first eruption and more significantly elevated
tions and modeling of sulfate aerosol plumes build-up have             values after the second eruption. Like for the Raikoke erup-
been observed, e.g., for the Sarychev eruption (Haywood                tion, WACCM shows immediate and stronger signals dur-
et al., 2010, see their Fig. 5). Furthermore, the AOD values           ing the weeks following the eruptions, but decreasing faster.
from the model simulation seem to decrease faster (October–            While for OMPS observations a significant impact (sAOD
December 2019) than for OMPS. For both Ulawun eruptions                around 0.01) of the second Ulawun eruption is still apparent
(26 June and 3 August), OMPS data show some AOD pertur-                in the tropical stratosphere by the end of the year 2019, in the

Atmos. Chem. Phys., 21, 535–560, 2021                                                      https://doi.org/10.5194/acp-21-535-2021
C. Kloss et al.: Stratospheric aerosol layer perturbation caused by the 2019 Raikoke and Ulawun eruptions                     545

model comparable values are found in October. By the end of        not determines the chemical evolution, dynamics and aerosol
2019 the sAOD has values down to 10 times smaller than for         load. The WACCM simulations can therefore only be seen
OMPS. The model shows a faster decrease. Using the mod-            as a pure sulfate point of view with the associated limita-
eling capabilities, we have isolated the impact of the Ulawun      tions. Furthermore, the determination of the altitude range
plumes (Fig. 5c) to analyze the possible cross-impact of the       of the plume injection is very challenging. The injection al-
Ulawun eruptions in the northern regions, which are already        titude in WACCM is based on satellite observations. How-
affected by the Raikoke eruption and, vice versa, to detect        ever, as discussed in Sect. 4.1, the exact determination of
a possible impact of the Raikoke plume in the tropics and          the injection altitude is impossible, at least for the specific
SH. As described for Fig. 4 the AOD enhancement start-             atmospheric conditions during the Raikoke eruption. The
ing from July 2019 at 40◦ S is clearly separated from the          plume dispersion and its chemical/microphysical evolution
Ulawun impact on the tropical stratosphere and can result          depend strongly on the initial injection altitude (Lachatre
from a horizontal tropopause crossing of the aerosol plume         et al., 2020). Any information about the SO2 injection alti-
towards the south (Fig. 5a). This hypothesis is confirmed          tude cannot be derived from ash because different altitude
by the model simulation in Fig. 5b and c, where only vol-          levels can be reported for SO2 and ash (Vernier et al., 2016).
canic sources of stratospheric aerosols are considered. How-       The same goes for timing and burden of the plume injec-
ever, it has to be noted that WACCM simulations reveal el-         tion. Here, we assume an evenly distributed injection (ver-
evated sAOD values in the SH originating from the Raikoke          tically and time-wise), which is a necessary simplification
eruption (see also Fig. B1). Such a feature is not confirmed       of reality where pulses in injection altitude and magnitude
with CLaMS passive air mass tracer simulations (not shown).        are inevitable. The sulfate burden injected was taken from
For an accurately defined altitude level of tropopause cross-      the SSiRC community based on the IASI data set, which
ing more analysis would be needed, which goes beyond the           agrees well with estimations from Muser et al. (2020) with
scope of this study. A similar enhancement due to tropopause       1.37 ± 0.07 × 10⁹ kg from TROPOMI and 1–2 × 10⁹ kg for
crossing in the north from the Ulawun plume would possi-           Himawari-8. It can be assumed that different instruments and
bly interfere with the interpretation of the global distribution   models with different setups will come up with varying val-
of the Raikoke plume. However, the Ulawun-only simula-             ues for the burden (as seen after the Sarychev eruption, e.g.,
tion of Fig. 5c indicates that very limited to no transport of     Günther et al., 2018; Kristiansen et al., 2010; Krotkov et al.,
the Ulawun plume occurred to the north via an horizontal           2010). The issue of different models and instruments lead-
tropopause crossing. Because the influence of the Ulawun           ing to different scientific conclusions is addressed in Fromm
eruption on the SH seen by OMPS is well reproduced by the          et al. (2014). Other aerosol sources (e.g., from other, minor
model, we trust this conclusion. However, a transport dur-         volcanic eruptions or dust) are not included in the model.
ing the winter months (November/December/January) also             For OMPS, we use the full, non-filtered data set of aerosol
towards the north within the BDC, as seen following the            extinction values. Hence, cloud signatures are potentially in-
Ambae eruption in 2018 (Kloss et al., 2020), is likely. Even       cluded in the observations, but excluded for the WACCM
though such a feature is not clearly visible in OMPS obser-        simulation. Furthermore, the sampling of any observational
vations (Figs. 4 and 5a), we believe that an already enhanced      instrument compared to that of a global model is not compa-
aerosol layer in the north (following the Raikoke eruption)        rable. The WACCM global simulations are performed twice
masks this transport towards the north in the winter months.       a day while OMPS reaches a global coverage every ≈ 3 d.
By the end of the year, WACCM simulations in Fig. 5b and           The sampling bias could be prevented by sampling WACCM
c show low sAOD values, which is why the model data po-            data according to the OMPS orbit. However, while this bias
tentially miss this feature as well. Consequently, we cannot       can mean that very local features are missed by OMPS, it
rule out that Ulawun air masses have interfered with the evo-      cannot explain time delays on the order of weeks. Despite
lution of the Raikoke plume. Figure 5b shows higher sAOD           these differences, the general dynamics of sulfate aerosol for-
values in the tropics and SH compared to Fig. 5c. Hence,           mation/removal, from observations and simulation, is rather
the Raikoke eruption had a significant impact on the tropical      consistent in terms of the impacted latitude bands.
stratosphere. The sAOD for the respective Raikoke WACCM
simulation is presented in the supporting material (Fig. B1).      4.3   The global distribution of the Raikoke and Ulawun
As also seen in Fig 4h, the enhanced aerosol signature start-            plumes with a passive air mass tracer
ing from the end of 2019 in the SH is attributed to the aerosol
plume of the Australian wildfires 2019–2020.                       A complementary overview of the dynamics of both vol-
   Discrepancies between the model output and OMPS ob-             canic plumes, once injected into the UTLS, is given using an
servations are expected, especially following the Raikoke          air mass origin tracer with CLaMS (Fig. 6). We choose two
eruption, for the following reasons. WACCM does not ac-            initialization boxes in space and time corresponding to the
count for ash particles. In a recent study by Muser et al.         rough respective injection locations of the volcanic plumes.
(2020) a burden of 0.4–1.8 × 10⁹ kg is estimated for ash par-      For the Raikoke eruption the initialization box is chosen ac-
ticles (with a diameter < 32 µm). Whether ash is included or       cording to observations by Hedelt et al. (2019) (at 11–18 km,

https://doi.org/10.5194/acp-21-535-2021                                               Atmos. Chem. Phys., 21, 535–560, 2021
546          C. Kloss et al.: Stratospheric aerosol layer perturbation caused by the 2019 Raikoke and Ulawun eruptions

Figure 6. Mean column air mass fraction from the Raikoke and Ulawun plumes, calculated from integrating the passive CLaMS air mass
tracers over all vertical levels. The two main eruptions (Raikoke 21 June and Ulawun 3 August) are equally included. Initialized boxes are
selected according to Himawari and IASI observations. The Raikoke eruption is initialized from 23–24 June, 163◦ E–170◦ W, 49–62◦ N and
335–460 K. The Ulawun eruption is initialized from 3 to 4 August, 137–178◦ E, 10◦ S–5◦ N and 350–385 K. The magenta cross symbols
indicate the locations of the two volcanoes.

335–460 K, from 163◦ E to 170◦ W and 49–62◦ N for 23 to                nostic of the air mass transport from the volcano region (ini-
24 June 2019). This is equivalent to the position of the plume         tialization box).
during the storm entrainment (see Figs. 2 and 3). For sim-                Once initialized after the Raikoke eruption, the air mass
plicity, we ignore the minor impact of the first Ulawun erup-          tracer is transported towards the east, which is consistent
tion (from 26 June). For the larger eruption at Ulawun (3              with OMPS observation (see Fig. 4). By mid-July (roughly
August), we define a rough injection box from 137–178◦ E,              within 3 weeks after the eruption), the plume tracer has cir-
10◦ S–5◦ N from 14 to 17 km altitude, 350–385 K, on 3 and 4            cled the Earth at latitudes mostly north of the Raikoke loca-
August 2019. After initialization, the tracer is advected pas-         tion. At the beginning of July the main bulk of the air mass
sively during the subsequent months. This simulation is a              tracer remains west of the Atlantic Ocean, with only a min-
simple way of illustrating the plume’s global transport in the         imal impact above southern Europe (Fig. 6, second panel).
UTLS throughout the weeks following the respective erup-               Therefore, the sAOD enhancement above northern Europe
tions, integrated over all altitudes. The simulation cannot            observed by OMPS in Fig. 4b does likely originate from
be taken for quantitative estimations for the following rea-           other sources than Raikoke (e.g., from forest fires in Alberta,
sons. First, the chosen initialization is given in a box shape,        Canada). The plume air mass transport is qualitatively con-
whereas the real injection does not appear in the shape of a           sistent with OMPS observations, as by the end of July (Fig. 4)
box. Therefore, many trajectories in this simulation do not            enhanced AOD values are apparent throughout all longi-
necessarily correspond to an actual plume air parcel during            tudes, mostly north of the Raikoke position. For the CLaMS
injection. Second, in this simulation we use a passive tracer,         simulation a clear signal of the tracer is visible around the
with no chemical/microphysical processes being taken into              area of the AMA from end-July until mid-September, which
account. Finally, the injected burden and related quantitative         is also consistent with OMPS data (Fig. 4c–e). By mid-
factors are not accounted for in the CLaMS simulations, as             August a small percentage of the initialized Raikoke tracer
the Raikoke and Ulawun air mass tracers are equally repre-             has reached the tropics in the CLaMS simulations. Such a
sented. However, as CLaMS transport is driven by the newest            transport can also be seen from OMPS and WACCM data in
reanalysis (ERA5), the simulation provides a reliable diag-            Fig. 5a and b in July/August 2019 (with sAOD values below
                                                                       0.01 for OMPS). As seen for OMPS data, the plume tracer

Atmos. Chem. Phys., 21, 535–560, 2021                                                      https://doi.org/10.5194/acp-21-535-2021
C. Kloss et al.: Stratospheric aerosol layer perturbation caused by the 2019 Raikoke and Ulawun eruptions 547
initialized according to the second Ulawun eruption is trans- The panel series in Fig. 7e shows, in a similar manner to
ported eastwards and westwards, with a dominating compo- what is shown in Chouza et al. (2020) (in their Fig. 7, using
nent towards the east. The CLaMS air mass tracer suggests a CALIOP data), the vertical distribution of mean aerosol ex-
circling of the Earth in the tropics within less than 1 month tinction OMPS values averaged over all longitudes for each
(which agrees with OMPS data; cf. Sect. 4.2). Already during month from June to December 2019. Following the Raikoke
the first month after the Ulawun eruption in August, the sim- eruption, a clear enhanced aerosol extinction signal is visi-
ulation with CLaMS suggests that an overlapping of air mass ble north of the Raikoke location (48◦ N), rising from ≈ 16
tracers for the Raikoke and Ulawun eruptions is possible in to 17.5 km from July to August (≈ 1.5 km per month: ≈
the tropics. Starting from September the air mass tracer for 0.3 mm s−1 ). A clear rise up to altitudes at around 25/26 km
the Ulawun eruption remains largely in the tropics (between from the Raikoke plume as discussed in Chouza et al. (2020)
0 and 30◦ S), slowly expanding towards the north and south. is not apparent in Fig. 7e. Slightly enhanced aerosol extinc-
Even though CLaMS simulations neither take any chemi- tion values following the Ulawun eruption appear in the trop-
cal/microphysical processes into account nor possible lifting ics in August at above 17 km. The Ulawun plume remains
due to aerosol–radiation dynamics (suggested to play a cru- largely in the tropics and rises within the ascending branch
cial role for the Raikoke eruption in Muser et al., 2020), com- of the BDC (≈ 1 km per month: ≈ 0.4 mm s−1 from Septem-
parisons show that the horizontal passive tracer distribution ber to December).
from the ClaMS simulation illustrates the effect of passive
transport for plume dispersal. 4.5 In the context of other recent events (2017–2020)
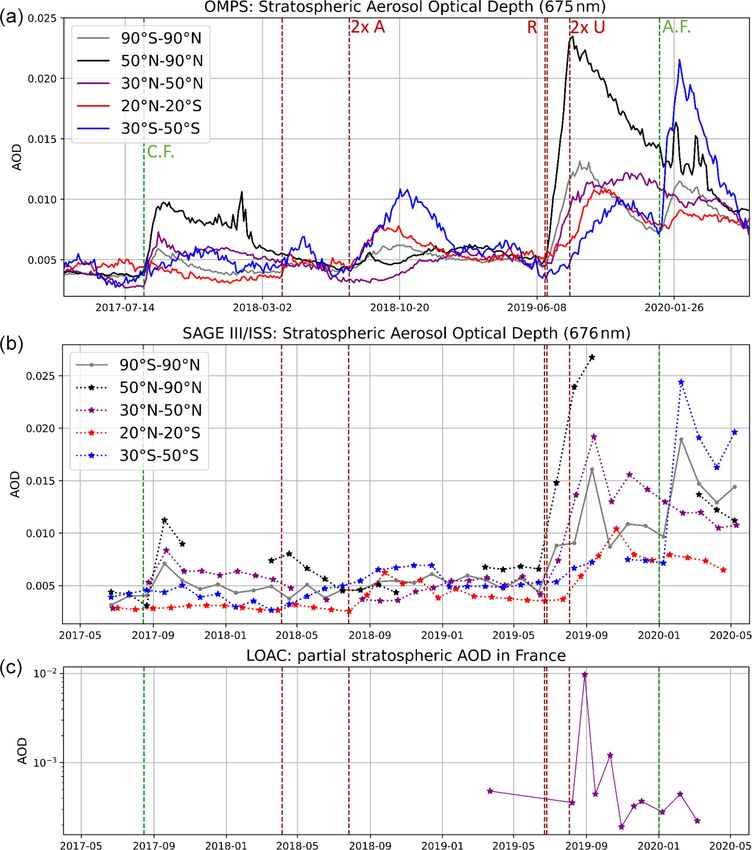
4.4 Vertical distribution Figure 8 shows mean sAOD estimations for OMPS,
SAGE III/ISS and in situ LOAC observations from France.
Figure 7 shows the vertical distribution of aerosol extinc- The mean sAOD from the OMPS and SAGE III/ISS aerosol
tion values and its evolution, around the location of the vol- extinction observations are at 675 and 676 nm, respectively.
cano. The initial injection phase after the Raikoke eruption The dense sampling, reaching high latitudes from OMPS,
is more evident for the WACCM simulation than for OMPS gives confidence in the representation of the overall AOD
observations (Fig. 7a and b). In the model, the aerosol plume evolution (Fig. 8a). While we present 3 d averages for the
rises from around 15 to 20 km altitude during the month OMPS data set, we calculate 30 d averages for SAGE III/ISS
following the eruption, while OMPS shows maximum alti- to account for the much sparser sampling of SAGE III/ISS.
tude values of the aerosol plume rise with a slower rate from The timing and total value of sAOD enhancements for
around 15 to 22 km altitude (1.5 km per month). The approx- OMPS and SAGE III/ISS (Fig. 8a and b) following the
imate descending rate in OMPS data, from November 2019 Canadian wildfires in 2017, the Ambae eruptions in 2018
to February 2020, of around 2 km per month reflects a contri- and the Raikoke/Ulawun eruption in the different latitude
bution from both sedimentation processes and the descend- bands agree very well. Observed peak sAOD values by
ing branch of the BDC. Increasing aerosol extinction values SAGE III/ISS are by ≈ 10 % higher than OMPS values for
in spring 2020 around the tropopause are a recurrent seasonal most latitude bands, which is consistent with the difference
feature, independent of Raikoke perturbation. of ±10 % found by Chen et al. (2019) following the Am-
For the August eruption of Ulawun, both WACCM and bae eruption. Peak values in the 30–50◦ N latitude band
OMPS show a plume rising up to 19 km (first eruption) and are significantly higher following the Raikoke eruption for
20 km (second eruption), directly after the respective erup- SAGE III/ISS values, which is likely due to the sparse sam-
tions (Fig. 7c and d). A subsequent transport to ≈ 21 km in pling. Compared to the sAOD impact of the Canadian fires
the area around the volcano is also shown in observations and in 2017, the Raikoke eruption led to 2.5 times higher AOD
reproduced in the model. One month after the eruption, the peak values north of 50◦ N (for OMPS and SAGE III/ISS
signal of the dispersed plume is at higher altitudes in the ob- data in Fig. 8a and b). Particular sAOD enhancements from
servations than in the model. This can potentially reflect an the two stratospheric fire events in 2019 (Alberta in June
underestimation of the amount of SO2 initially injected in the and Siberia in July) are not visible. The Raikoke plume has
model. As seen in Fig. 5, OMPS reveals increased aerosol likely mixed with the plumes of the fire events, however,
extinction values even 10 months after the second Ulawun compared to Raikoke the fire signature is small. The impact
eruption, while WACCM values seem almost back at back- of the Ulawun eruption on the tropical sAOD from OMPS
ground conditions within 5 months. The large differences be- is by a factor of around 1.5 higher than what was observed
tween OMPS observations and the WACCM simulation seen for Ambae (factor of 1.8 with SAGE III/ISS data). For the
in the troposphere can be explained by clouds and other tro- past 3 years, including the impact of the Canadian fires, Am-
pospheric sources of aerosols, which are not included in the bae eruption and Australian fires on the sAOD, the Raikoke
model. We focus on the transport in the lower stratosphere and Ulawun eruptions have had the highest impact on NH
rather than the troposphere; therefore, those differences are sAOD levels. Even 1 year after the eruptions, AOD values
of no interest in this study. at latitudes higher than 50◦ N are elevated and comparable
https://doi.org/10.5194/acp-21-535-2021 Atmos. Chem. Phys., 21, 535–560, 2021You can also read