A Lagrangian study of the contribution of the Canary coastal upwelling to the nitrogen budget of the open North Atlantic - Biogeosciences
←
→
Page content transcription
If your browser does not render page correctly, please read the page content below
Biogeosciences, 18, 303–325, 2021
https://doi.org/10.5194/bg-18-303-2021
© Author(s) 2021. This work is distributed under
the Creative Commons Attribution 4.0 License.

A Lagrangian study of the contribution of the Canary coastal
upwelling to the nitrogen budget of the open North Atlantic
Derara Hailegeorgis1 , Zouhair Lachkar1 , Christoph Rieper2,3 , and Nicolas Gruber2
1 Centerfor Prototype Climate Modeling, New York University Abu Dhabi, Abu Dhabi, UAE
2 Environmental  Physics, Institute of Biogeochemistry and Pollutant Dynamics, ETH Zurich,
Universitätstrasse 16, 8092 Zurich, Switzerland
3 Experimental Oceanography, Institute of Oceanography, University of Hamburg,

Bundesstrasse 53, 20146 Hamburg, Germany

Correspondence: Zouhair Lachkar (zouhair.lachkar@nyu.edu)

Received: 27 January 2020 – Discussion started: 4 February 2020
Revised: 14 October 2020 – Accepted: 28 October 2020 – Published: 15 January 2021

Abstract. The Canary Current System (CanCS) is a major             fold enhancement of the offshore transport of water and ni-
eastern boundary upwelling system (EBUS), known for its            trogen in the first 400 km. Much of this water and nitro-
high nearshore productivity and for sustaining a large fishery.    gen stems from upwelling at quite some distance from the
It is also an important but not well quantified source of nitro-   capes, confirming the capes’ role in collecting water from
gen to the adjacent oligotrophic subtropical gyre of the North     along the coast. North of Cape Blanc and within the first
Atlantic. Here, we use a Lagrangian modeling approach to           500 km from the coast, water recirculation is a dominant
quantify this offshore transport and investigate its timescales,   feature of offshore transport. This process, likely associated
reach and contribution to the fueling of productivity in the       with mesoscale eddies, tends to reduce the efficiency of off-
offshore regions. In our Lagrangian model, we release nearly       shore transport. The Canary upwelling is modeled to sup-
10 million particles off the northwestern African coast and        ply around 44 and 7 mmol N m−2 yr−1 to the North Atlantic
then track all those that enter the nearshore region and upwell    Tropical Gyral (NATR) and the North Atlantic Subtropical
along the coast between 14 and 35◦ N. We then follow them          Gyral East (NASE) Longhurst provinces, respectively. In the
as they are transported offshore, also tracking the biogeo-        NATR, this represents nearly half (53 ± 26 %) of the esti-
chemical transformations, permitting us to construct biogeo-       mated total new production, while in the NASE, this fraction
chemical budgets along the offshore moving particles. The          is small (4 ± 2 %). Our results highlight the importance of
three-dimensional velocity field as well as the biogeochemi-       the CanCS upwelling as a key source of nitrogen to the open
cal tracers and fluxes are taken from an eddy-resolving con-       North Atlantic and stress the need for improving the repre-
figuration of the Regional Ocean Modeling System (ROMS).           sentation of EBUS in global coarse-resolution models.
Our Lagrangian model analysis reveals a very intense off-
shore transport of nitrogen, with about 20 %–40 % in the
form of organic nitrogen. The transport varies greatly along
the coast. Even though the central CanCS (21–28◦ N) trans-         1   Introduction
ports the largest amount of water offshore, its offshore trans-
port of nitrogen is somewhat smaller than that in the south-       Over the last 3 decades, several studies have highlighted the
ern CanCS (14–21◦ N), primarily because of the higher ni-          importance of the coastal ocean in the global carbon cycle
trogen content of the upwelling waters there. Around one-          (e.g., Walsh, 1991; Wollast, 1998). For instance, it has been
third of the total offshore transport of water occurs around       estimated that continental margins contribute nearly half of
major capes along the CanCS. The persistent filaments as-          the globally integrated oceanic primary production, although
sociated with these capes are responsible for an up to 4-          they only occupy about 10 % of the world ocean surface
                                                                   (Jahnke et al., 1990; Walsh, 1991; Smith and Hollibaugh,

Published by Copernicus Publications on behalf of the European Geosciences Union.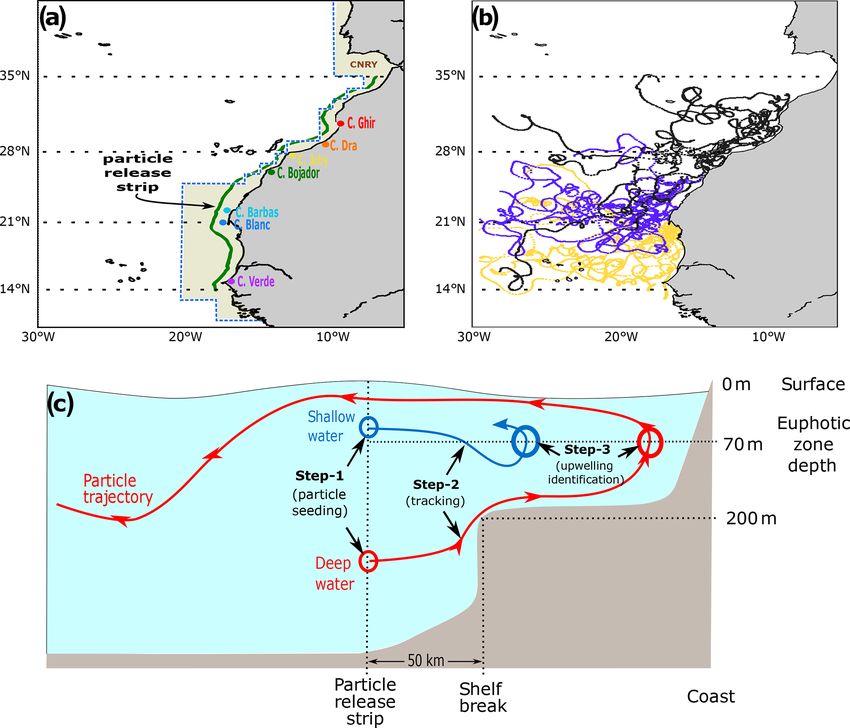
304                                   D. Hailegeorgis et al.: A Lagrangian study of the contribution of the Canary coastal

1993; Muller-Karger et al., 2005; Liu et al., 2010). The          ing eddies and filaments develop in different parts of the
coastal ocean is not only highly productive but is also a ma-     CanCS and contribute to the offshore transport of the coastal
jor source of nutrients and organic matter to the open ocean      waters (Lovecchio et al., 2018).
(Liu et al., 2000, 2010; Lovecchio et al., 2017; Frischknecht        The quantification of their contribution to the lateral export
et al., 2018). Eastern boundary upwelling systems (EBUSs),        is challenging due to their fast and complex spatiotemporal
in particular, are known to be an important source region for     dynamics, whose appropriate in situ sampling goes beyond
the open ocean. Owing to their intense upwelling that brings      the ability of current observing systems. High-resolution
nutrients from the thermocline into sunlit near-surface wa-       coupled physical–biogeochemical models provide an av-
ters, these systems are among the most productive ecosys-         enue to overcome this challenge. Yet, the number of high-
tems in the world, sustaining 30 % of global fish catch (Pauly    resolution model-based studies that addressed and quantified
and Christensen, 1995; Carr, 2001; Hansell, 2002; Chavez          the coastal–open-ocean exchange in the CanCS remains lim-
and Messié, 2009). A high fraction of the upwelled nutri-         ited (e.g., Fischer and Karakaş, 2009; Lachkar and Gruber,
ents and the organic matter formed from them tends to be          2011; Pastor et al., 2013; Auger et al., 2016; Lovecchio et
laterally exported into the adjacent subtropical gyres. These     al., 2017, 2018). In one of the most detailed model-based
gyres are particularly receptive, as they have low nutrient       studies conducted so far, Lovecchio et al. (2017) examined
conditions (oligotrophic), and have been shown to be net het-     the export of organic carbon from the CanCS using a cou-
erotrophic based on observational data (Duarte and Agustí,        pled physical–biogeochemical ocean model with a telescopic
1998; Del Giorgio and Duarte, 2002). Yet, the question of         grid that covers the whole Atlantic Ocean while maintain-
whether and how far into the open ocean the additional input      ing a high resolution along the coast of northwestern Africa.
of organic and inorganic matter can increase in situ respira-     They demonstrated that about a third of the organic carbon
tion and new production (NP) remains a subject of a long and      produced along the northwestern African coast is transported
unresolved debate (Smith and Hollibaugh, 1993; Duarte and         offshore, with some of it well beyond 1500 km from the
Agustí, 1998; Liu et al., 2010; Lovecchio et al., 2017).          coast, contributing substantially to the net community pro-
   Located along the northwestern African coast, the Canary       duction there. In a follow-up study, Lovecchio et al. (2018)
Current System (CanCS) constitutes the EBUS of the North          showed that much of this transport is driven first by filaments
Atlantic subtropical gyre (Barton et al., 1989; Pelegri et al.,   (in the first 100 km from the coast) and then later taken over
2005a, 2006). The CanCS is composed of the Canary Cur-            by westward-propagating mesoscale eddies. However, these
rent (CC) and the Canary Upwelling Current (CUC). The CC          authors focused on the transport of organic carbon only and
represents the eastern boundary current of the North Atlantic     so did not estimate the contribution of the Canary upwelling
subtropical gyre. It flows parallel to the Moroccan coast         to the offshore export of nutrients into the open ocean and the
and merges with the westward North Equatorial Current             implications this might have for the biogeochemistry of the
(NEC) around Cape Blanc (21◦ N) (Barton, 1987; Hernán-            North Atlantic Ocean. Furthermore, the Eulerian approach
dez-Guerra et al., 2005). The CUC is a nearshore surface          used by Lovecchio et al. (2017, 2018) does not allow for the
jet associated with the coastal upwelling front, which flows      identification of waters that upwell at the coast and the track-
equatorward along the northwestern African coast (Pelegri         ing of their trajectories after they enter the open ocean.
et al., 2006). The Cabo Verde frontal zone, between Cape             Here, we aim to close this gap and investigate the con-
Blanc and the Cabo Verde archipelago, is dominated by             tribution of the upwelling waters to the nitrogen budget of
a permanent cyclonic circulation with a poleward bound-           the open North Atlantic, thereby considering the transport of
ary current, the Mauritanian current (MC), which extends          both organic and inorganic forms of nitrogen. To this end, we
at depth beyond Cape Blanc as a slope undercurrent typical        use a Lagrangian approach to quantify the offshore reach, the
of eastern boundary upwelling systems (Barton et al., 1989;       spatial structure and the dominant timescales of the offshore
Arístegui et al., 2009). Upwelling is permanent along most        transport of upwelled waters by tracking all open-ocean wa-
of the Moroccan coast (21–35◦ N), albeit with weaker inten-       ters that upwell along the coastal region of the CanCS. La-
sity and stronger seasonality north of 26◦ N (Cropper et al.,     grangian approaches have a long and rich history in the study
2014). South of Cape Blanc, upwelling is present essentially      of dynamical systems, especially in the atmosphere (Lin et
in late fall and winter (October–March). Upwelled waters          al., 2012) but also in the ocean (Van Sebille et al., 2018),
have different nutrient contents depending on their respec-       as they present a number of advantages relative to the much
tive sources. North of Cape Blanc, the relatively nutrient-       more commonly used Eulerian approach, especially in the
impoverished North Atlantic Central Waters (NACW) feed            context of offshore transport. By taking the moving parti-
most of the upwelling (Mason et al., 2012). In contrast, wa-      cle as a frame of reference, the Lagrangian tracking of water
ters upwelling south of Cape Blanc have a higher nutrient         masses is much better suited to analyze the connectivity be-
content, as they are fed by the nutrient-richer South At-         tween the coastal and the open-ocean regions. Furthermore,
lantic Central Waters (SACW) brought by the MC (Schütte           the Lagrangian method can be used to derive conditional
et al., 2016; Kounta et al., 2018; Glessmer et al., 2009; Peña-   statistics where subsets of particles that fulfill certain crite-
Izquierdo et al., 2015). Intense mesoscale structures, includ-    ria are analyzed. This is useful for instance here to restrict

Biogeosciences, 18, 303–325, 2021                                                     https://doi.org/10.5194/bg-18-303-2021

D. Hailegeorgis et al.: A Lagrangian study of the contribution of the Canary coastal                                         305

the analysis of offshore transport to upwelling particles only.   phytoplankton, zooplankton, two pools of detritus and a dy-
By not only tracking waters through the appropriate seeding       namic chlorophyll-to-carbon ratio. The two classes of detri-
of Lagrangian particles but also tabulating the biogeochemi-      tus represent, respectively, fast-sinking large organic matter
cal transformations along the pathways, we can also establish     particles and slow-sinking small particles. The small parti-
Lagrangian budgets. This permits us to develop a holistic per-    cles can coagulate with phytoplankton to form large detritus.
spective of the pathways taken by nutrients and carbon along      In the water column, small and large detritus are remineral-
their journey from the ocean’s interior through upwelling and     ized to ammonium at rates of 0.03 and 0.01 d−1 , respectively.
then their offshore transport to their ultimate fate of being     Sinking particulate organic matter that reaches the seafloor is
exported to depth again (Frischknecht et al., 2018). Such an      also remineralized to ammonium at a rate of 0.003 d−1 (Gru-
analysis of the origin, transformation and fate is impossible     ber et al., 2006).
to undertake when using an Eulerian point of view. However,          The model domain covers the region from 10 to 42◦ N
a Lagrangian approach also comes with a number of disad-          in latitude and from 30 to 6◦ W in longitude with a grid
vantages. Perhaps the most important one is the difficulty to     resolution of 1/20◦ . This corresponds to a mesh size of
fully take into account subgrid mixing that is associated with    about 5 km, which is sufficient for fully resolving mesoscale
the model treatment of unresolved physics.                        processes. The vertical grid consists of 32 layers with en-
   Previous studies have used the Lagrangian approach to          hanced resolution near the surface. The bathymetry is derived
study different aspects of the CanCS. For instance, Brochier      from the ETOPO2 file provided by the National Geophysical
et al. (2011) conducted a ROMS-based Lagrangian exper-            Data Center (Smith and Sandwell, 1997), and a minimum
iment to study the transport of ichthyoplankton (fish eggs        bathymetry of 50 m is set. We use a monthly climatologi-
and larvae) due to filaments between the western African          cal forcing based on the Comprehensive Ocean–Atmosphere
coast and the Canary Islands. Mason et al. (2012) used a La-      Data Set (COADS) (da Silva et al., 1994a, b) for surface heat
grangian approach to characterize the source waters of up-        and freshwater fluxes. Surface temperature and salinity are
welling in the CanCS between 31 and 35◦ N. Yet, these stud-       restored to COADS observations using kinematic-heat and
ies were limited to specific regions of the CanCS and did         freshwater-flux corrections following Barnier et al. (1995).
only partially sample coastal upwelling there. Here we sub-       Wind stress is derived from the QuikSCAT-based Scat-
stantially expand on these previous efforts by sampling and       terometer Climatology of Ocean Winds (Risien and Chelton,
tracking all open-ocean waters that upwell along the west-        2008). The initial and lateral boundary conditions for temper-
ern African coast between 14 and 35◦ N and quantifying the        ature, salinity and nitrate are derived from the World Ocean
offshore export of water, nutrients and organic matter. We        Atlas (WOA) 2009. Other ecological tracers are initialized
also investigate the kinetics and the structure of this off-      uniformly to arbitrary low values. Currents at the boundaries
shore transport and explore the role of water recirculation       are derived from temperature and salinity data using geostro-
and capes in enhancing both coastal upwelling and offshore        phy together with Ekman transport in the upper 40 m. The
export. Finally, we examine the contribution of the CanCS         model starts from rest and is spun up for 9 years. We then
upwelling to the nitrogen budget of the open North Atlantic.      run it for 3 more years, on which we carry out the analysis,
                                                                  and store these outputs at a daily frequency.
                                                                     The model was evaluated by confronting its outputs to a
2     Methods                                                     wide array of in situ and satellite-based observations (see the
                                                                  Supplement for full details). We find that despite some local
2.1    Models and configuration                                   biases and discrepancies with observations, the model gener-
                                                                  ally shows good skill in reproducing the large-scale features
We use a CanCS configuration of the Regional Ocean Model-         of the circulation and the productivity of the Canary Current
ing System (ROMS)-AGRIF (http://www.croco-ocean.org/,             region (Figs. S1 and S2). More importantly, it reproduces the
last access: 1 January 2018) similar to that used by Lachkar      strength and structure of the Canary coastal upwelling and
et al. (2016). ROMS solves the primitive equations and            captures the observed vertical structure of nitrate and organic
has free-surface and terrain-following vertical coordinates       matter (Figs. S3 to S17). Overall, this CanCS-only ROMS
(Shchepetkin and McWilliams, 2005). We use a rotated-             setup has similar strengths and weaknesses as the telescopic
split third-order upstream biased operator for the advec-         grid setup employed by Lovecchio et al. (2017, 2018). We
tion of momentum and material properties (Marchesiello et         will discuss the potential impact of the model limitations on
al., 2009). The non-local K-profile parameterization (KPP)        our results in the discussion section.
scheme is used to represent the subgrid vertical mixing
(Large et al., 1994). The biogeochemical model is a nutrient–     2.2   Lagrangian experiment
phytoplankton–zooplankton–detritus (NPZD) model based
on nitrogen (Gruber et al., 2006). It uses a system of ordinary   The Lagrangian particle-tracking experiment is performed
differential equations representing the time evolution of the     offline with Ariane (Blanke and Raynaud, 1997; http://
following state variables: nitrate (NO−                     +
                                        3 ), ammonium (NH4 ),     stockage.univ-brest.fr/~grima/Ariane/, last access: 1 Jan-

https://doi.org/10.5194/bg-18-303-2021                                                     Biogeosciences, 18, 303–325, 2021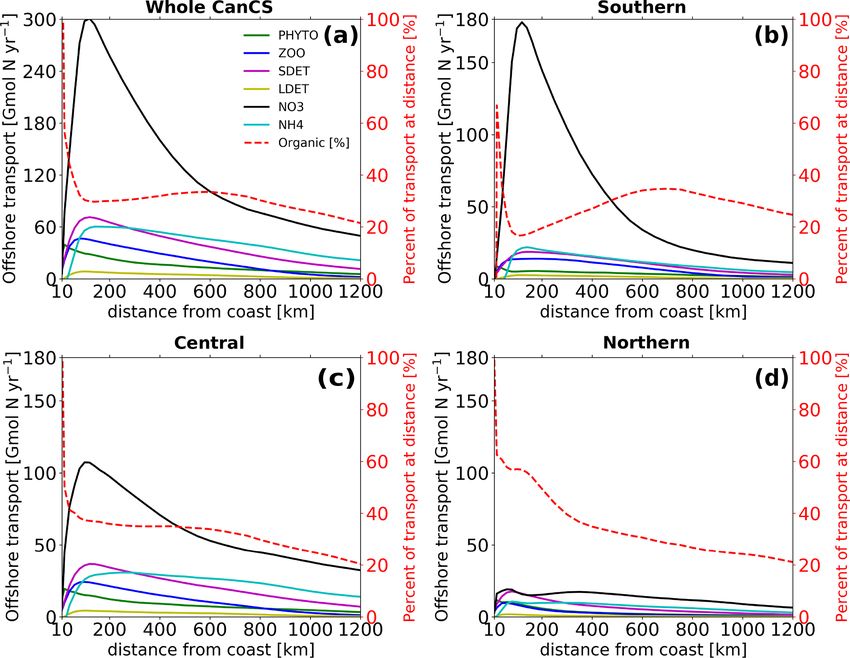
306                                       D. Hailegeorgis et al.: A Lagrangian study of the contribution of the Canary coastal

Figure 1. (a) The model domain stretches from 30 to 6◦ W and from 10 to 41◦ N. The solid green line indicates the limit of the coastal strip
where particles are released at each vertical layer proportionally with the onshore water volume transport. The black dotted lines partition
the domain into the three latitudinal subregions: the southern CanCS (14–21◦ N), the central CanCS (21–28◦ N) and the northern CanCS
(28–35◦ N). The yellow-shaded area corresponds to the portion of the Longhurst Canary Coastal Province (CNRY) that lies within the model
domain. The location of the seven capes studied in Sect. 5.1 is shown here in different colors. (b) A plot of sample trajectories of 10 randomly
selected particles in our Lagrangian experiment from each of the southern (golden), central (blue) and northern (black) subregions. (c) A
schematic of the Lagrangian sampling of upwelling particles. In step 1, particles are released when open-ocean water enters the coastal strip.
Based on their depth when released, we term particles to be of a shallow (< 70 m) or deep (> 70 m) source. In step 2, the trajectories of the
particles are tracked for up to 2 years. In step 3, upwelling particles are identified as those that cross the 70 m depth while at the coast.

uary 2018) using ROMS daily output. Ariane tracks water                   Fig. 1b). This region extends in a north–south direction a to-
particles based on the velocity output of the model. In this              tal of 3185 km and covers most of the western African coast
experiment, Ariane runs based on the model output of zonal                component of the Canary Current Coastal Province (CNRY)
and meridional velocities (Ariane internally computes verti-              of Longhurst (2007) (Figs. 1a and S18). The Lagrangian ex-
cal velocities from the continuity equation). Ariane analyti-             periment requires three steps: (i) particle seeding based on
cally computes streamlines of particle trajectories across grid           water flow volume into the coastal region, (ii) particle track-
walls by assuming a steady-state flow. The data points for                ing and (iii) selection of particles (see Fig. 1c). Only the se-
successive days are used as piecewise steady flow where the               lected particles will be further analyzed for our Lagrangian
velocity is assumed to be static for each day and not inter-              budgets. In the first step, we seed particles along a coastal
polated between different days. The velocity at a given point             strip that sits offshore of our coastal upwelling region, i.e.,
inside the regular cells of the model is computed by linearly             the region between 14 and 35◦ N (Fig. 1a). The particle re-
interpolating the velocity at opposite faces of a cell. Ariane’s          lease strip is set at 50 km westward of the 200 m isobath
computation of particle trajectories does not account for the             along the coast, which ensures sampling coastal upwelling
subgrid vertical mixing in the model.                                     occurring over the continental shelf and at the shelf break
   With our Lagrangian experiment we aim to study trajecto-               (Fig. 1c). This results in a coastal upwelling region with a
ries of open-ocean water masses that enter the coastal region             width that varies from less than 60 km near 27◦ N, where
and upwell between 14 and 35◦ N (see sample trajectories in               the continental shelf is narrowest, to more than 160 km near

Biogeosciences, 18, 303–325, 2021                                                                https://doi.org/10.5194/bg-18-303-2021
D. Hailegeorgis et al.: A Lagrangian study of the contribution of the Canary coastal                                           307

25◦ N, where the shelf is widest. The seeding of particles          while the southern subregion has the smallest upwelling
is done with Ariane based on the onshore water flow vol-            (13 000 km3 yr−1 ).
ume into the coastal region, where each particle is tagged             Most of the upwelling stems from deeper waters, i.e., wa-
with the corresponding initial transport. We limit the maxi-        ters that enter our analysis region below 70 m; 85 % of the
mum transport a particle is associated with to 0.01 Sv (1 Sv =      tracked particles and 88 % of the associated water volume
106 m3 s−1 )., which limits the maximum volume assigned to          follow that path (termed “deep source”). The remaining up-
one particle to 0.864 km3 . Through a daily particle release        welling stems from waters that enter the region within the
for 1 year at each cell along the particle release strip, a total   euphotic zone and then are transported below 70 m before
of 9 888 387 particles are released. By the end of the seeding      upwelling (here termed “shallow source”) (Fig. 1c). This
phase for each particle, we have its location, time of release      fractional distribution varies little between subregions. But
and associated water volume. In the second step, particles are      the upwelling zonal distribution differs strongly between the
tracked for 720 d since their release until they leave the simu-    three CanCS subregions (Fig. S20). These differences are re-
lation’s domain. Along each particle’s trajectory, its latitude,    flected in the median upwelling distances being 64.1, 37.1
longitude and depth are saved daily along with biogeochem-          and 41.1 km in the southern, central and northern subregions,
ical tracers. Note that around 4.2 %, 0.37 % and 0 % of the         respectively (Table 1).
particles released in the southern, central and northern subre-        Most of this variability has to do with the variability
gions, respectively, leave the domain southward or northward        of offshore Ekman-transport- and curl-driven upwelling be-
within 1 year of their release. Assuming the ocean to be an in-     tween the three subregions. For instance, the central subre-
compressible fluid and its velocity field to be non-divergent,      gion has strong year-round coastal upwelling, whereas up-
the volume transport is conserved. We quantify the amount           welling tends to be strong only in the summer season in
of nutrients carried by each particle to a given location as        the northern subregion (Pelegri and Benazzouz, 2015). Sim-
the product of its associated volume and the concentration          ilarly, the Ekman-driven upwelling in the southern subre-
of the tracer associated with the particle when it reaches that     gion is restricted to the winter and spring (Pelegri and Be-
location. Finally, tracked particles that enter the coastal re-     nazzouz, 2015; Capet et al., 2017). There are distinct dif-
gion and cross upwards of 70 m depth, the average depth of          ferences also with regard to the wind-curl-driven upwelling
the euphotic zone in the Canary coastal region, are identi-         between the three subregions. Indeed, the wind stress curl
fied as upwelled particles. Since only particles that enter the     is predominantly downwelling-favorable in the northern and
coastal area and upwell there are followed, our experiment          central subregions and upwelling-favorable in the southern
disregards wind-stress-curl-driven upwelling that occurs in         subregion. This enhances upwelling in the southern region,
the open ocean and can locally be important, particularly in        particularly in the open ocean, but its effect is only par-
the southern subregion of Lovecchio et al. (2017). From all         tially sampled in the present study given our focus on the
tracked particles, 352 873 (3.57 %) upwell, which form the          coastal region. Other inter-regional variations may also stem
basis for our analyses.                                             from the design of the experiment. For instance, our ex-
   Previous studies have shown subregional differences              periment identifies limited coastal upwelling south of Cape
within the CanCS in the circulation patterns, mesoscale ac-         Blanc and between Cape Barbas and Cape Bojador because
tivity, seasonality of upwelling, biology and subsurface nu-        their bathymetry is shallower than the 70 m upwelling depth
trient concentration (Arístegui et al., 2009; Lovecchio et al.,     criterion used here. Furthermore, the upwelling strip is rela-
2017; Pelegri and Benazzouz, 2015). We thus separately              tively narrow in the northern subregion because of the nar-
characterize the trajectories of waters that upwell in three        rower shelf, thus limiting the offshore spread of coastal up-
latitudinal subregions of the upwelling domain. These sub-          welling there (Fig. S19).
regions cover southern (14–21◦ N), central (21–28◦ N) and              Finally, the upwelling patterns of water and nitrogen have
northern (28–35◦ N) parts of the CanCS (Fig. 1a).                   a few important differences. The southern subregion has
                                                                    the lowest upwelling water volume yet the strongest up-
                                                                    welling flux of nitrogen (Fig. 2). This is primarily due to the
3   Upwelling patterns                                              shallower nutricline associated with a shallower thermocline
                                                                    there as well as the higher nutrient content of the South At-
Our Lagrangian analysis reveals an annual upwelling of              lantic Central Waters (SACW) that feed upwelling south of
offshore-derived waters of nearly 80 000 km3 (see Table 1).         Cape Blanc. Conversely, the weakest upwelling-driven nitro-
This is about 25 km3 of water per year per kilometer of             gen flux is in the northern subregion (Table 1 and Fig. 2).
coastline or 0.8 m3 s−1 per meter of coastline. The strongest
upwelling occurs in the central CanCS, with a particu-
larly strong peak around Cape Bojador (27◦ N) (Fig. 2a).
This subregion alone is responsible for more than half of
the total upwelling (40 705 km3 yr−1 ). The northern subre-
gion contributes about 25 000 km3 yr−1 to the upwelling,

https://doi.org/10.5194/bg-18-303-2021                                                       Biogeosciences, 18, 303–325, 2021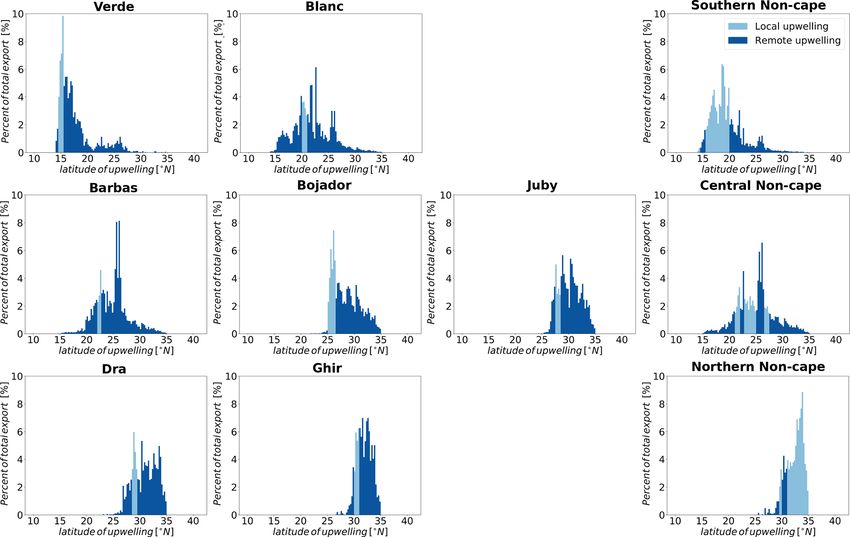
308                                     D. Hailegeorgis et al.: A Lagrangian study of the contribution of the Canary coastal

Table 1. The annual number of upwelling particles and their associated water and nitrogen, the median distance of upwelling to the coast
and the net transport of water to 400 and 1000 km from coast (as percent of upwelling volume) in the three subregions as well as the entire
CanCS region in our experiment.

                                   Particles        Water              N            Median     To 400 km    To 1000 km
                                     (yr−1 )   (km3 yr−1 )    (Gmol yr−1 )    distance (km)          (%)           (%)
                  Southern           51 275         13 179             338             64.1            95             78
                  Central           162 304         40 705             210             37.1            93             69
                  Northern          139 294         25 038              87             41.1            72             33
                  Whole CanCS       352 873         78 922             635              43           86.3             59

Figure 2. (a, b) Annual upwelling (a) water volume and (b) nitrogen zonally integrated across the coastal upwelling region (between the
coast and 50 km westward of the 200 m bathymetry). (c, d) Annual upwelling (c) water volume and (d) nitrogen with distance from the coast
in the whole CanCS upwelling domain (14–35◦ N). Light- and dark-blue segments represent contribution by deep and shallow sources of
water, respectively.

4     Offshore transport                                                gion reach 200 km offshore in 3 months, and it takes more
                                                                        than 4 months for half of them to reach that distance. At
4.1    Reach and timescales of offshore transport                       larger distances from the coast (beyond 400 km), the offshore
                                                                        transport becomes fastest for particles that upwelled in the
Over the whole CanCS, the water offshore transit times (the             southern subregion with nearly 80 % of particles reaching
median particle’s travel time to traverse a given offshore in-          1200 km in 2 years, while only 70 % and 30 % of particles
terval) are longer in the nearshore region and decrease as              upwelling in the central and northern subregions reach that
we go further away from the coast (Fig. 3). Large differ-               distance in 2 years. This can also be seen in the water resi-
ences in the offshore transport timescales exist between the            dence times being shortest for the central subregion particles
three CanCS subregions. In the first 200 km from the coast,             up to 400 km and for the southern subregion particles beyond
the offshore transport is fastest for particles upwelled in the         400 km (Table S1).
central subregion and slowest for those in the northern sub-
region (Figs. 3 and S23). Indeed, in the central subregion,             4.2   Net offshore transport
80 % of the upwelling particles reach 200 km in 3 months
and 50 % reach that distance in 2 months only. In contrast,             Integrated over the whole analysis domain from 10 to
less than 30 % of particles upwelling in the northern subre-            41.5◦ N, the CanCS exports over 70 000 km3 yr−1 of water

Biogeosciences, 18, 303–325, 2021                                                             https://doi.org/10.5194/bg-18-303-2021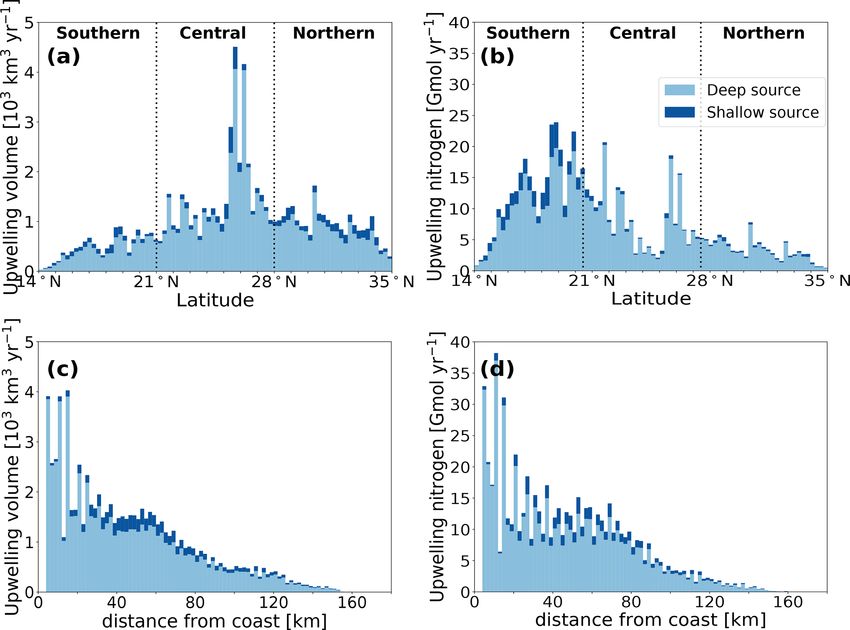
D. Hailegeorgis et al.: A Lagrangian study of the contribution of the Canary coastal                                               309

                                                                       creasing exponentially further offshore, although with a rel-
                                                                       atively long decay length scale such that at a distance of
                                                                       1200 km, the offshore export of nitrogen still amounts to
                                                                       100 Gmol yr−1 .
                                                                          Although offshore water transport was minimal for the
                                                                       southern CanCS particles, this subregion is responsible for
                                                                       the greatest offshore export of nitrogen (nearly half of the
                                                                       offshore export of nitrogen by the whole CanCS region at this
                                                                       distance). This is a direct consequence of the large upwelling
                                                                       flux of nitrogen (Table 1 and Fig. 4b). This pattern reverses
                                                                       further offshore. Beyond 200 km from the coast, the offshore
                                                                       transport of nitrogen associated with the central subregion
                                                                       upwelling exceeds that originating from both the southern
                                                                       and northern subregions. At all distances past 600 km, the
                                                                       central subregion contributes over half of the nitrogen off-
                                                                       shore export by the entire CanCS. At these distances, the ni-
Figure 3. A plot of median transit times for particles to traverse     trogen transport of waters stemming from the central subre-
subsequent intervals of distance from the coast for the three sub-     gion is at least twice as large as that from the southern subre-
regions in the CanCS. The first point shows the transit time from      gion and 4 times as large as that from the northern subregion.
particles’ upwelling to distances reaching 200 km. The error bars
                                                                          The magnitude of the offshore transport of nitrogen at any
indicate the 10 percentile distributions above and below the median
                                                                       distance from the coast depends both on the volume of off-
transit times. Only particles that traverse the whole distance range
are considered.                                                        shore transport and how efficiently nitrogen is stripped from
                                                                       the waters by biological productivity and the resulting or-
                                                                       ganic nitrogen is exported to depth. It is thus instructive to
                                                                       assess the specific forms of nitrogen being transported off-
toward the open North Atlantic (Fig. 4a). The maximum                  shore.
offshore transport is reached at close to 150 km from the
shore at around the edge of the coastal upwelling area. It             4.3   Nitrogen allocation
is around 150 km because at closer distances to the coast
(< 100–150 km), upwelled volume is only partially sampled,             In the nearshore 50 km, phytoplankton is very efficient in
while further distances (> 100–150 km) are never reached               taking up the inorganic nitrogen that is being upwelled and
by a proportion of particles because of recirculation retain-          fixing it into organic forms of nitrogen (Fig. 5a). This re-
ing them close to the coast and alongshore transport export-           sults in nearly 100 % of the offshore transported nitrogen
ing some particles out of the model domain. Beyond this                being in the form of organic nitrogen. But as additional ni-
maximum, the transport decreases gradually as the number               trogen is being supplied from below, the fraction of the up-
of particles reaching farther offshore distances within the 2-         welled nitrogen that gets consumed decreases rapidly with
year integration period declines. But even at a distance of            increasing offshore distance. Furthermore, some of the fixed
1200 km from the coast, the offshore transport still amounts           organic nitrogen is lost through sinking so that beyond the
to 40 000 km3 yr−1 .                                                   nearshore 50 km region, inorganic nitrogen in the form of
   There are substantial differences between the different             nitrate dominates the nitrogen pool at all distances from
subregions. The central subregion of the Canary system is              the coast (Fig. 5a). Beyond 300 km, ammonia is the second
responsible for over half of the entire net offshore trans-            largest pool. Overall, organic nitrogen contributes only 30 %
port of water from the CanCS at any distance from the coast            to the total nitrogen pool. Within the organic nitrogen pool,
(Fig. 4a). The offshore transport associated with the north-           small detritus contributes the most to the offshore transport,
ern subregion upwelling is initially very strong but decreases         while the contribution of phyto- and zooplankton is much
sharply thereafter so that beyond 800 km, it becomes the               smaller and that of the large detritus particles is essentially
weakest of all three regions. Reduced coastal upwelling and            negligible.
low offshore transport efficiency (i.e., the ratio of offshore            Given its dominance in terms of the total offshore trans-
transport volume at a given distance to upwelling volume)              port, the southern subdomain is also the main region de-
explain this pattern (Table 1, Fig. 4a). The southern subre-           termining the whole CanCS pattern of nitrogen allocation
gion is associated with the smallest offshore transport of wa-         (Fig. 5b). In this southern subdomain, the fraction of organic
ter up to 800 km offshore due to its small coastal upwelling           nitrogen is particularly low, being only 20 % at the peak of
volume.                                                                the offshore transport. With increasing distance, the fraction
   Around 150 km from the coast, the nitrogen transport                increases to 30 %. This indicates a much further offshore ex-
reaches values as large as 500 Gmol yr−1 at 200 km, de-                tension of the conversion of inorganic nutrients to organic

https://doi.org/10.5194/bg-18-303-2021                                                           Biogeosciences, 18, 303–325, 2021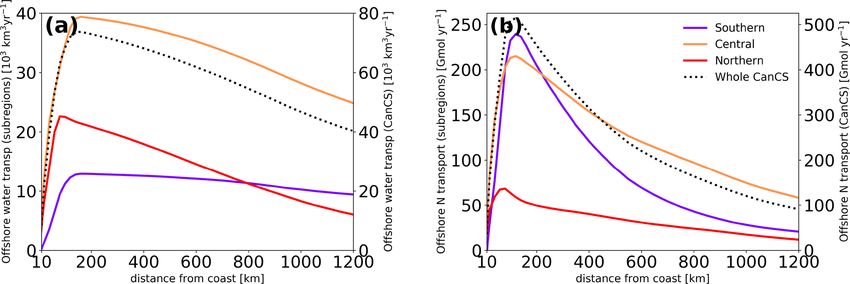
310                                        D. Hailegeorgis et al.: A Lagrangian study of the contribution of the Canary coastal

Figure 4. Net offshore transport of (a) water and (b) nitrogen as a function of the distance to the coast in the three subregions (left axis) as
well as the entire CanCS (right axis) in our experiment.

Figure 5. The net offshore transport of each pool of nitrogen (phytoplankton, zooplankton, small and large detritus, nitrate, and ammonium)
as a function of the distance to the coast in the three subregions (left axis). The fraction of organic nitrogen (in %) in the net offshore transport
of nitrogen at each distance from the coast is shown on the right axis.

matter in this domain. The central domain has a nitrogen al-                 ration and remineralization. Ammonia tends to accumulate,
location pattern that is similar to that of the whole CanCS                  partially aided by its non-sinking nature, making this an im-
(Fig. 5c), while the transport in the northern subdomain is                  portant part of the offshore transport. In contrast, the very
not only weak but also the least dominated by the offshore                   small contribution by the large detritus is largely a conse-
transport of nitrate (Fig. 5d).                                              quence of its rapid export to depth (see also Gruber et al.,
   The different offshore gradients exhibited by the differ-                 2006).
ent pools of nitrogen can be largely explained by their po-
sition in the cycling of nitrogen within the euphotic zone                   4.4    Vertical and horizontal structure
and their susceptibility to sinking. Nitrate, being the domi-
nant form of nitrogen being upwelled, comes first, followed                  Upwelled particles that are transported offshore are also sub-
by phytoplankton, zooplankton and small detritus. The latter                 ject to vertical circulation that distributes them vertically
two contribute then to the formation of ammonia by respi-                    (Figs. 6 and S25). Subduction may potentially slow down
                                                                             offshore transport, since velocities deeper in the water col-

Biogeosciences, 18, 303–325, 2021                                                                   https://doi.org/10.5194/bg-18-303-2021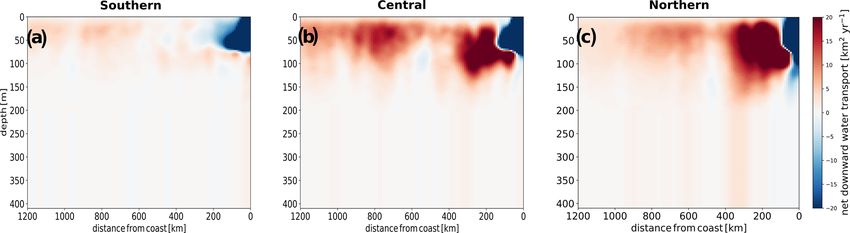
D. Hailegeorgis et al.: A Lagrangian study of the contribution of the Canary coastal                                          311

umn are smaller. However, subduction can also increase the        the instability of the upwelling front and its interaction with
efficiency of offshore transport by minimizing the depletion      eddies can play a crucial role in transporting upwelling wa-
of nitrogen in surface waters.                                    ters across the front against the mean density gradient. These
   For the northern and central subregions, upwelling par-        filaments have been shown to be associated with a high ex-
ticles are subject to moderate subduction at around 100 to        port of organic material and nutrients into the open ocean,
200 km from the coast (Fig. 6). In the southern subregion,        particularly in the nearshore. Àlvarez-Salgado et al. (2007)
however, upwelling particles are subject to very little subduc-   suggested the contribution of filaments to the transport of car-
tion, while a strong open-ocean upwelling maintains them          bon off Iberia and northwestern Africa to be 2.5 to 4.5 times
near the surface. Similarly to the water volume transport,        larger than the export driven by Ekman transport. Lovecchio
subduction of nitrogen is strongest in the northern subre-        et al. (2018) estimate that coastal filaments are responsible
gion and weakest in the southern subregion (Fig. S22). The        for 80 % of the offshore transport in the first 100 km off-
stronger downward advective transport occurring in the cen-       shore. Coastal filaments can occur anywhere on the coast
tral and northern subregions is due to a strong negative wind     in the CanCS, but previous studies have shown that capes
stress curl in these subregions, which is absent in the south-    can facilitate their formation (Meunier et al., 2010; Troupin
ern subregion (Lovecchio et al., 2017). Furthermore, persis-      et al., 2012). Lovecchio et al. (2018) demonstrated that in
tent filaments associated with prominent capes in the central     their analyses, 25 % of the time, the filaments were associ-
and northern subregions may contribute to enhanced subduc-        ated with capes. Many filaments originating at capes are so
tion of upwelling water and nutrients there (Lovecchio et al.,    persistent and well known that they have been named after
2018).                                                            the cape, such as the Cabo Verde filament (Capet et al., 2017;
   The offshore transport of organic nitrogen is smaller in       Ndoye et al., 2017), the Cape Ghir filament (Troupin et al.,
magnitude than that of inorganic nitrogen and is mostly lim-      2012; Pelegri et al., 2005b) and the exceptionally large and
ited to the near surface in all subregions (Figs. 7, S22 and      extensive Cape Blanc–Cape Barbas filament that occurs at
S27). In contrast, the transport of inorganic nitrogen shows a    the confluence of the Canary and Mauritanian currents (Van
subsurface secondary maximum at between 50 and 100 m in           Camp et al., 1991; Barton et al., 2004). Enhanced transport
addition to the surface maximum (Figs. 7 and S22). Our anal-      can also be seen at other capes such as Cape Bojador, where
ysis highlights the two opposing effects of subduction in not     a persistent filament extending up to 500 km offshore can be
only slowing offshore transport speeds but also reducing bi-      observed (figure not shown).
ological uptake (and nitrogen loss due to sinking) and hence         Here, we explore how areas around the major capes that
helping maintain high nitrogen content by upwelled water.         are favorable to strong filamentary activity affect upwelling
   The convergence of the Canary Coastal Current flowing          and offshore export of water and nitrogen. These are Cabo
from the north and the Mauritanian current flowing from the       Verde (14.5–15.5◦ N) and Cape Blanc (20–21◦ N) in the
south leads to a strong offshore transport of nitrogen around     southern subregion; Cape Barbas (22–22.75◦ N), Cape Bo-
Cape Blanc (21◦ N) (Figs. 7 and S27). The nitrogen (both          jador (25–26.5◦ N) and Cape Juby (27.5–28.5◦ N) in the cen-
organic and inorganic) channeled through the confluence of        tral subregion; and Cape Dra (28.5–29.5◦ N) and Cape Ghir
the two currents originates predominantly from waters up-         (30–31◦ N) in the northern subregion (Fig. 1a and Table S2).
welling in the central and southern subregions, with a small      Previous studies of the Canary upwelling mostly stressed the
contribution from particles upwelling in the northern subre-      role of filaments in locally enhancing offshore transport re-
gion. This is consistent with the finding of Lovecchio et al.     gardless of the source of upwelling. Similarly, we find an en-
(2017), who – using a Eulerian approach – also found the          hancement of offshore transport of upwelled particles in the
Cabo Verde front to be a major channel of export of coastal       first 200 km from the coast within the latitudinal range of all
waters and of the associated nitrogen into the open ocean. Al-    capes except Cabo Verde and Cape Juby (Fig. 8). Transport
though integrated vertically and averaged in time, the pattern    at latitudes of Cape Blanc, Cape Barbas, Cape Dra and Cape
of offshore transport captures a spatially averaged manifesta-    Ghir is larger than at the non-cape latitudes as far as 1000 km
tion of mesoscale eddies in latitudinally alternating offshore–   from the coast. We further separately consider the enhance-
onshore corridors known as striations (Davis et al., 2014).       ment of offshore transport associated with (i) enhanced local
                                                                  upwelling around the capes and (ii) increased export of non-
                                                                  locally upwelled water at each cape, i.e., the export of waters
5     Mechanisms of transport                                     that upwelled far away from the capes but are then trans-
                                                                  ported along the coast toward the cape, from where they are
5.1    Enhancement of offshore transport around capes             exported toward the open ocean.
                                                                     The offshore transport of water upwelled around Cape Bo-
The coastal upwelling front associated with the strong den-       jador in the central subregion and Cape Dra and Cape Ghir in
sity gradient formed at the transition zone between the up-       the northern subregion is 20 % to 30 % larger than that orig-
welling waters and the open-ocean waters limits the offshore      inating from non-cape areas (per coastal length) (Fig. S28).
transport. Yet, the cold coastal filaments that emerge from       Increased offshore transport of nitrogen due to increased lo-

https://doi.org/10.5194/bg-18-303-2021                                                      Biogeosciences, 18, 303–325, 2021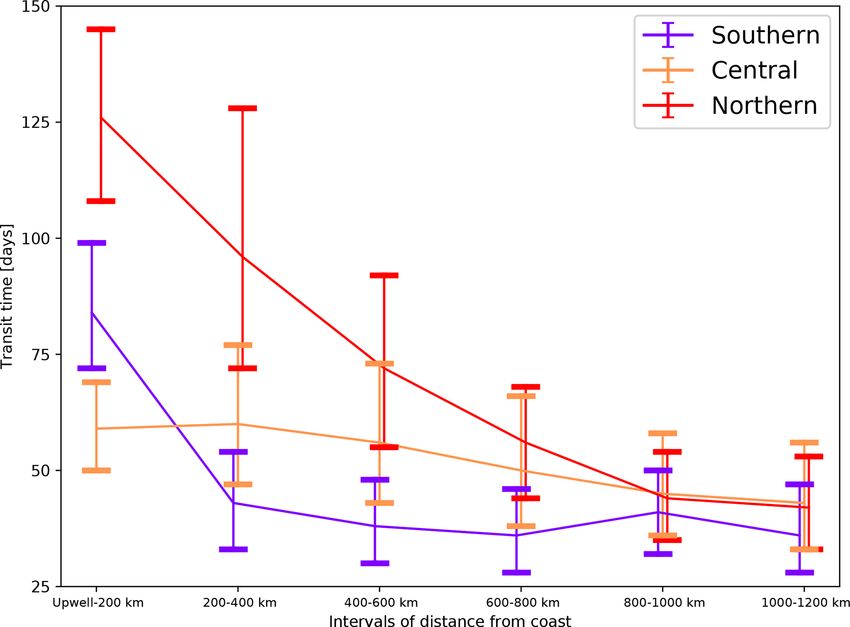
312 D. Hailegeorgis et al.: A Lagrangian study of the contribution of the Canary coastal
Figure 6. Meridionally integrated net downward transport of water in the (a) southern, (b) central and (c) northern subregions. All values are
in km3 of water per km of offshore distance per year.
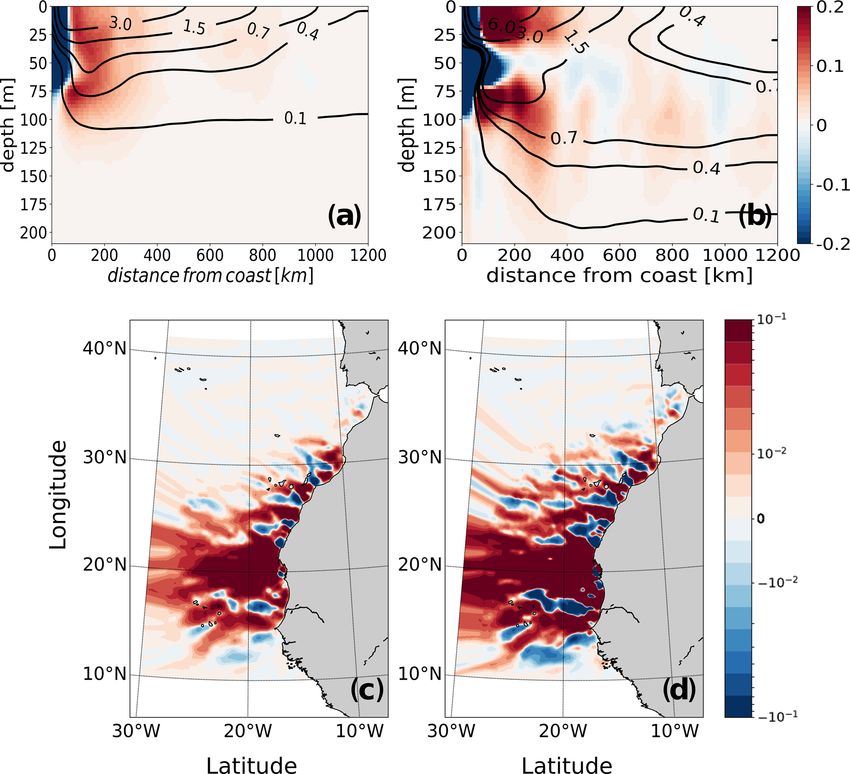
Figure 7. Analysis of the structure of the offshore transport of nitrogen: (a, b) offshore sections of the meridionally integrated net downward
and offshore transports of (a) organic and (b) inorganic nitrogen in the upper 200 m as a function of the distance to the coast. Positive
(red) and negative (blue) shadings represent net downward and net upward transports (in Gmol N km−1 yr−1 ), respectively, and contours
correspond to the offshore transport (in Gmol N m−1 yr−1 ). The fluxes were meridionally integrated throughout the domain. (c, d) Maps
of the vertically integrated offshore transport of (c) organic and (d) inorganic nitrogen, where positive (red) and negative (blue) shadings
represent net offshore and onshore transports, respectively (in Gmol N km−1 yr−1 ).
cal upwelling is seen only in Cape Dra and Cape Ghir out Cape Blanc, Cape Barbas and Cape Ghir are highly effi-
of the seven capes examined (Fig. 8). Cape Bojador does not cient in exporting non-locally upwelled waters to the open
show enhanced local nitrogen upwelling (although a slight ocean (Fig. S29). Cape Blanc’s enhancement of offshore ex-
enhancement is shown in its offshore export). port of nitrogen by non-local upwelling compared to the
non-cape part of the central subregion is 350 %–400 % in
Biogeosciences, 18, 303–325, 2021 https://doi.org/10.5194/bg-18-303-2021D. Hailegeorgis et al.: A Lagrangian study of the contribution of the Canary coastal 313 Figure 8. Enhancement of net offshore transport of nitrogen by capes. (a, b, c) Transport within the latitudinal span of each cape or non-cape area. Transport occurring within each latitudinal span is considered at any distance from the coast irrespective of the location of upwelling or coastal export. (d, e, f) Transport associated with locally upwelled water in each cape or non-cape coast. (g, h, i) Transport associated with non-locally upwelled water at each cape or non-cape area. Note that the transport is normalized by coastal length (divided by the length of the coast at the respective cape or non-cape area). the first 400 km then constantly increases further offshore to Pelegri and Benazzouz, 2015; Auger et al., 2016; Lovecchio reach a 935 % enhancement at 1200 km. Similarly, Cape Bar- et al., 2017). The ability of capes to facilitate offshore export bas shows an enhancement of non-local upwelling of about of coastal water through their interaction with alongshore ad- 200 % for all distances from the coast, while Cape Ghir vection has also been previously documented (Meunier et shows a 250 % enhancement from 100 to 800 km offshore al., 2010; Troupin et al., 2012). With the exception of Cape (Fig. 8). Non-locally upwelled waters that are transported Blanc and Cape Barbas, most capes export offshore water offshore around major capes represent more than 30 % of the that mostly first upwells north of their latitude (Fig. 9). In the total offshore transport at all distances from the coast (Figs. 4 central and northern subregions, this is primarily due to the and 8). Indeed, most of the water and nitrogen exported off- southward offshore flow by the Canary Current. In the south- shore around major capes is non-locally upwelled (Table 2). ern subregion, both the Canary and Mauritanian currents are Each cape also sources more of its export from non-local up- important sources for coastal upwelling, particularly during welling than any of the non-cape coastal areas. Non-local winter (Klenz et al., 2018). This is visible in the northern upwelling accounts for over 75 % of the nitrogen export in source of upwelling that leaves the coast at all capes in this all capes except Cabo Verde and Cape Bojador, while it ac- subregion and the southern source of upwelling that leaves counts for a minority of the source of non-cape parts of the the coast at Cape Blanc and Cape Barbas (Fig. 9). We con- coast except in the central subregion (Table 2). clude that capes such as Cape Blanc and Cape Barbas act to The analysis of the source waters for particles exported concentrate and export non-locally upwelled waters and that around the major capes reveals a strong alongshore transport this effect is much more important than the occurrence of of upwelled particles that connects upwelling between differ- enhanced local upwelling at the capes. ent coastal regions (Fig. 9). This is consistent with previous studies that found strong meridional alongshore advection of nutrients (Carr and Kearns, 2003; Pelegri et al., 2006; Me- unier et al., 2010; Troupin et al., 2012; Pastor et al., 2013; https://doi.org/10.5194/bg-18-303-2021 Biogeosciences, 18, 303–325, 2021
314 D. Hailegeorgis et al.: A Lagrangian study of the contribution of the Canary coastal
Table 2. The first two columns show the daily contribution of local and non-local upwelling to nitrogen that leaves the coastal region at each
cape (in Mmol N km−1 ) per km of coastal length. The last two columns show the contribution of local upwelling (in %) to total nitrogen and
water exported at each cape or non-cape coast.
Cape or non-cape area Local N Non-local N Local N Local water
(Mmol N km−1 ) (Mmol N km−1 ) (%) (%)
Verde 12.5 32.8 27.6 21.7
Blanc 35.1 233.0 13.1 11.5
Non-cape (southern) 393.7 220.7 64.1 59.3
Barbas 8.9 83.3 9.6 8.0
Bojador 17.7 41.7 29.8 26.5
Juby 2.4 14.6 13.9 10.5
Non-cape (central) 115.1 200.7 36.5 33.5
Dra 1.1 5.4 17.1 14.1
Ghir 3.1 11.9 20.7 20.3
Non-cape (northern) 12.5 2.6 82.7 87.3
Figure 9. Latitude of upwelling of nitrogen exported at each cape or non-cape coast.
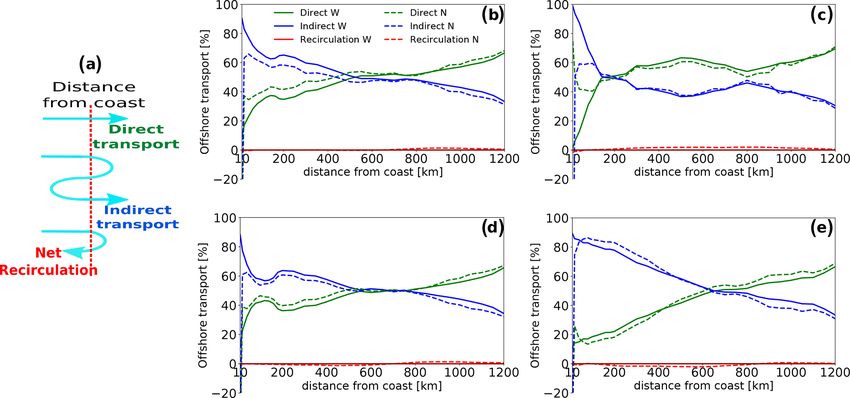
5.2 Role of recirculation or closer to the coast (an even number of crossings). We
term them “indirect transport” and “net recirculation”, re-
spectively (Fig. 10a).
Particles that are transported offshore past a certain distance It is worth noting that only direct and indirect transport
can return back to that same distance or never cross it again. contribute to the net offshore transport of water, while net
We term the transport associated with the latter “direct trans- recirculation does not (although it may slightly contribute to
port”. Particles that cross the same distance multiple times transport of nitrogen) (Fig. 10). The sum of direct and indi-
can end up further offshore (an odd number of crossings)
Biogeosciences, 18, 303–325, 2021 https://doi.org/10.5194/bg-18-303-2021D. Hailegeorgis et al.: A Lagrangian study of the contribution of the Canary coastal 315 Figure 10. (a) Schematic showing the three types of offshore transport trajectories. (b, c, d, e) Contribution (in %) of direct transport (green), indirect transport (blue) and net recirculation (red) to the total net offshore transport of water (solid) and nitrogen (dashed) at each distance to the coast in the entire CanCS region (b) as well as the southern (c), central (d) and northern (e) subregions. Note that the net recirculation has no contribution to net offshore water transport but contributes slightly to the net offshore transport of nitrogen. rect transports adds up to give the net transport of water to port contributes by up to 65 % and 80 % to the total offshore each distance, while the sum of all three represents the total transport of water in the central and northern subregions, re- volume of water that has reached each distance at any point spectively. For the transport of nitrogen, the share of the in- during the experiment. In the nearshore region, the meander- direct transport at the same distance is 60 % and 85 % in the ing of the Canary Current as well as the coastal upwelling two subregions. cell can cause upwelling particles to recirculate closer to the The importance of the indirect transport of upwelled wa- coast (Mittelstaedt and Hamann, 1981; Mittelstaedt, 1983; ters in the central and northern subregions can be linked to Estrade et al., 2008). But the leading cause of recirculation in the prominent role played by mesoscale eddies there. Indeed, the open ocean is the ubiquitous presence of mesoscale struc- eddies with a length scale of 100 to 300 km are known to tures, particularly eddies (Barton and Arístegui, 2004; Mason be important at these latitudes (Mittelstaedt, 1991). These et al., 2011, 2012; Schütte et al., 2016; Capet et al., 2017; include a recurrent cyclonic eddy south of Cape Juby and Ndoye et al., 2017; Kounta et al., 2018). Therefore, contrast- the cyclonic and anticyclonic eddies entrained by the Ca- ing the direct and indirect components of the transport can be nary Archipelago, forming the so-called Canary Eddy Cor- used to gauge the relative importance of the mesoscale eddies ridor (CEC), which is located at 22–29◦ N (Arístegui et al., and current meandering in the offshore transport. 1994; Piedeleu et al., 2009; Sangrá et al., 2009). This region Examining the three components of the offshore transport of long-lived westward-propagating eddies is known to con- in the three subregions reveals that the direct and indirect tribute strongly to the offshore transport of organic matter components virtually explain all the transport of water and and carbon (Sangrá et al., 2009). Yet, the transport pathway nitrogen at all latitudes and distances from the coast. Yet, of upwelling from the southern subregion has also been pre- important differences exist between the three subregions in viously shown to feature significant eddy activity (Schütte et terms of the relative importance of these two forms of trans- al., 2016; Capet et al., 2017; Ndoye et al., 2017; Kounta et port (Fig. 10). For the southern subregion particles, direct al., 2018). transport contributes by a large share to the total transport of The prominence of water recirculation in the central and water and nitrogen at all distances except in the first 200 km northern subregions – materialized by the dominance of the offshore, where the indirect transport dominates. In contrast, indirect transport – up to 600–800 km offshore is consistent for particles upwelled in the central and northern subregions, with the longer cross-shore transit times characterizing these the direct transport has a greater share to transport only latitudes (Figs. 3 and S30). This suggests that recirculation past 700 km offshore, while the indirect transport dominates acts to slow down the offshore transport and may explain the closer to the coast. The relative importance of indirect trans- less efficient offshore transport of water upwelling from these port is particularly strong between 100 and 400 km in these regions (Fig. 4a). two subregions. For instance, at 200 km the indirect trans- https://doi.org/10.5194/bg-18-303-2021 Biogeosciences, 18, 303–325, 2021
316                                    D. Hailegeorgis et al.: A Lagrangian study of the contribution of the Canary coastal

6   Potential contribution to the open-ocean nitrogen              upwelling source seems to exceed contributions from N2 fix-
    budget                                                         ation, atmospheric deposition and meridional transfer in the
                                                                   NATR province. In the NASE province, the upwelling con-
The strong export of nutrients and organic matter from the         tribution is larger than the N2 fixation but weaker than the
CanCS to the oligotrophic open ocean fuels new produc-             atmospheric deposition and the meridional transfer (Table 3).
tion (NP) and contributes to heterotrophy there. Here we
quantify this contribution in the North Atlantic Tropical
Gyral (NATR) and the North Atlantic Subtropical Gyral              7   Comparison with previous studies
East (NASE) provinces as defined by Longhurst (2007) (see
                                                                   Many previous studies reported higher estimates of POC
Fig. S18). The Lagrangian approach allows for the isolating
                                                                   (particulate organic carbon) offshore export in several por-
of the contribution of the upwelling particles to the transport
                                                                   tions of the CanCS (e.g., García-Muñoz et al., 2004, 2005;
of nitrogen into the NATR and NASE provinces, adjacent to
                                                                   Alonso-González et al., 2009; Santana-Falcón et al., 2016;
the CanCS (see Fig. S18). We calculate the net offshore trans-
                                                                   Lovecchio et al., 2017) (more in Table S4). Our lower off-
port of nitrogen in the top 100 m at the precise boundaries be-
                                                                   shore transport estimates may at least partially result from
tween each CanCS subregion and each Longhurst province.
                                                                   our Lagrangian approach that focuses on coastally upwelled
   New production (NP) is estimated from the net primary
                                                                   water only, disregarding non-upwelling waters and open-
production (NPP) and the available estimates of the f ratio
             NP                                                    ocean upwelling. Furthermore, restricting the analysis to up-
(f ratio = NPP   ) in the literature. Since new production and
                                                                   welling particles in our study limits offshore flux to near-
export production (EP) are numerically the same in a system
                                                                   surface waters, as most upwelled waters remain at very shal-
in steady state (Dunne et al., 2007), we also use estimates
                            EP                                     low depth (see the Supplement for more detail).
of the e ratio (e ratio = NPP  ). For NPP, we use the vertically
                                                                      Previous model-based studies of the Benguela and Cali-
generalized production model (VGPM) estimates, based on
                                                                   fornia coastal upwelling systems suggest other EBUSs may
sea color data from 1997 to 2017, as well as a carbon-based
                                                                   also significantly contribute to the nitrogen budget of adja-
productivity model (CbPM) by Westberry et al. (2008) to de-
                                                                   cent open oceans (Table S5). For instance, Gutknecht et al.
rive NPP for each province. We also use an in situ estimate of
                                                                   (2013) found significant net offshore transport of nitrogen in
NPP for the NATR made by Tilstone et al. (2009) based on
                                                                   the Benguela Current System (BenCS), with organic nitro-
carbon-14 uptake (Table 3). We use estimates of the f ratio
                                                                   gen exceeding inorganic nitrogen at far offshore distances.
from Laws et al. (2000) (see their Plate 3) as well as previ-
                                                                   They estimated the contribution of the BenCS in the top 50 m
ous estimates of the e ratio from Henson et al. (2011) and
                                                                   amounts to 100 ± 40 mmol N m−2 yr−1 to the adjacent South
Siegel et al. (2014). The derived f -ratio values are typically
                                                                   Atlantic Subtropical Gyral province according to the classi-
low and vary from 4 % in the NATR according to Henson et
                                                                   fication by Longhurst (2007) (Gutknecht et al., 2013). This
al. (2011) to 15 % in the NASE following Laws et al. (2000)
                                                                   contribution, however, is likely overestimated, since results
(Table 3).
                                                                   in the highly productive Walvis Bay area (22–24◦ S) were
   The southern, central and northern coastal upwelling sub-
                                                                   linearly extrapolated to the whole BenCS. Frischknecht et al.
regions in our study have total upwellings of 282.3, 200.9
                                                                   (2018) also found high offshore export of both organic and
and 79.2 Gmol N yr−1 , respectively. A total of 563, 358 and
                                                                   inorganic nitrogen from the productive central region of the
32 Gmol N yr−1 reach the upper 100 m of the NATR and the
                                                                   California Current System (CalCS) to the open ocean as far
NASE, respectively. When normalized by the area of each
                                                                   as 500 km from the coast (Table S5). The efficiency of off-
province, the CanCS upwelling source corresponds to 44 and
                                                                   shore transport of organic matter and dissolved inorganic ni-
7 mmol N m−2 yr−1 for the NATR and NASE, respectively
                                                                   trogen in the top 100 m between 100 and 500 km is almost
(Table 3). Most of the upwelled nitrogen exported to the
                                                                   identical between their study of the CalCS and the present
NATR originates from the central (46.5 %) and southern sub-
                                                                   study of the CanCS.
regions (43 %), whereas the nitrogen upwelled in the north-
ern subregion dominates (76.7 %) the nitrogen supplied to
the NASE. Hence, the nitrogen transported (in the top 100 m)       8   Implications and caveats
from the Canary coastal upwelling to the NATR and NASE
provinces represents 27 %–79 % and 2 %–5 % of their total          Our Lagrangian approach identified waters upwelling along
new production, respectively (Table 3).                            the northwestern African coast and characterized the kinet-
   Finally, the contribution of the Canary upwelling also          ics, structure and timescale of their offshore transport. Using
appears significant in comparison to other major sources           a Lagrangian approach allowed us to assess the reach and fate
of new nitrogen to the oligotrophic open North Atlantic            of coastally upwelled nitrogen far from the coast as well as
Ocean such as N2 fixation (Luo et al., 2012; Moore et al.,         study its biogeochemical transformation along particle tra-
2009; Fernández-Castro et al., 2015), atmospheric deposition       jectories. Our estimate of offshore export of organic nitro-
(Duce et al., 2008) and net meridional transfer through Ek-        gen and carbon by upwelling is lower than the estimate by
man divergence (Williams and Follows, 1998). Indeed, the           Lovecchio et al. (2017), at all distances from the coast (Ta-

Biogeosciences, 18, 303–325, 2021                                                      https://doi.org/10.5194/bg-18-303-2021
You can also read