CORE INDICATORS AND MONITORING FRAMEWORK - MOBILISEYOURCITY
←
→
Page content transcription
If your browser does not render page correctly, please read the page content below

Core Indicators and
Monitoring Framework

 Supported by Implemented by Part of

2

 For more information:
 MobiliseYourCity Secretariat, Brussels
 www.MobiliseYourCity.net
 email: Contact@MobiliseYourCity.net

 Title: Core Indicator and Monitoring Framework
 Printed and distributed: May 2019
 Authors: Urda Eichhorst, Daniel Bongardt, Levent Saran (GIZ),
 Tristan Morel (MobiliseYourCity Secretariat)
 Contributors: Benjamin Fouchard, Damien Verry (Cerema), Markus Delfs (MobiliseYourCity
 Secretariat), Réda Souirgi (AFD), André Eckermann (GIZ), Marcel Braun (Rupprecht Consult), Henrik
 Gudmundsson (CONCITO)

 Copyright:
 This publication is subject to copyright of the MobiliseYourCity Partnership and its Contributing Part-
 ners and authors. Partial or total reproduction of this document is authorised for non-profit pur-
 poses, provided the source is acknowledged.

 Disclaimer:
 The content presented in this document represents the opinion of the authors and is not necessarily
 representative of the position of the individual partners of MobiliseYourCity or the United Nations
 Framework Convention on Climate Change (UNFCC).

 May 2019
Context of the Publication This publication has been developed within the MobiliseYourCity Partnership in collaboration with the project “Advancing climate strategies in rapidly motorising countries”, funded by the German Federal Ministry for the Environment, Nature Conservation, Building and Nuclear Safety. MobiliseYourCity is a partnership for integrated urban development planning in emerging and devel- oping countries under the UN Marrakesh Partnership for Global Climate Action. MobiliseYourCity sup- ports and engages local and national partner governments in improving urban mobility planning & finance by providing a methodological framework and technical assistance, through capacity building, and by enabling access to funding at both local and national levels. Particular attention has been paid to the methodological and advisory frameworks related to National Urban Mobility Policies and/or Programs (NUMPs) and Sustainable Urban Mobility Plans (SUMPs) that serve as the basis for the pro- motion of investments and development of attractive mobility services. MobiliseYourCity is a multi-donor action, jointly co-financed by the European Commission’s Direc- torate-General for International Cooperation and Development (DG DEVCO), the French Ministry of Ecological Transition and Solidarity (MTES), the French Facility for Global Environment (FFEM), and the German Federal Ministry for the Environment, Nature Conservation, Building and Nuclear Safety (BMUB). The initiative is implemented by its founding partners ADEME, AFD, CEREMA, CODATU, and GIZ. Besides contribution to the international climate process, MobiliseYourCity contributes to the UN’s Agenda 2030, specifically Sustainable Development Goal (SDG) 11: Make cities inclusive, safe, resilient and sustainable. The objectives Enable transformational changes towards more inclusive, livable, and efficient cities. Foster more comprehensive, integrated and participatory urban mobility planning (local & na- tional levels). Target reduction of transport-related GHG emissions in participating cities (>50% until 2050). Link planning with agreement on investments and optional use of financial assistance. Make use of innovative planning techniques and digitalization, and promote state-of-the-art mo- bility and transport technologies. 3
4

 Contents
 1. Introduction 5

 2. Overview 7
 2.1. Impact Indicators 7
 2.2. Investment Indicators 8
 2.3. Aggregated Monitoring on Partnership Level 9
 2.4. Application of the Core Indicator and Monitoring Framework to NUMPs 10
 2.5. Availability & Collection of Input Data – Guideline Erreur ! Signet non défini.

 3. Impact Indicator 1: Transport Related GHG Emissions 12
 3.1. Definitions 14
 3.2. Calculation & Aggregation 19
 3.3. Data Availability & Collection 20

 4. Impact Indicator 2: Access to Public Transport 28
 4.1. Definitions 28
 4.2. Calculation & Aggregation 29
 4.3. Data Availability & Collection 30

 5. Impact Indicator 3: Road Safety 33
 5.1. Definitions 33
 5.2. Calculation & Aggregation 33
 5.3. Data Availability & Collection 35

 6. Impact Indicator 4: Air Pollution 36
 6.1. Definitions 36
 6.2. Calculation & Aggregation 37
 6.3. Data Availability & Collection 38

 7. Impact Indicator 5: Modal Share of Non-Motorized and Public Transport 39
 7.1. Definitions 39
 7.2. Calculation & Aggregation 40
 7.3. Data Availability & Collection 41

 8. Impact Indicator 6: Affordability of Public Transport Erreur ! Signet non défini.
 8.1. Definitions Erreur ! Signet non défini.
 8.2. Calculation & Aggregation Erreur ! Signet non défini.
 8.3. Data Availability & Collection Erreur ! Signet non défini.

 9. Investment Indicators 44

 10. Annexes 45
 10.1. Indicators Assessing Urban Transportation Systems Erreur ! Signet non défini.
 10.2. Examples of Implementation and Sustainable Mobility Indicators 46
 10.3. References 49
 10.4. Index of Boxes 51
 10.5. Index of Figures 51
 10.6. Index of Tables 51
 10.7. Glossary Erreur ! Signet non défini.
Core Indicators and Monitoring Framework
Erreur ! Utilisez l'onglet Accueil pour appliquer Überschrift 1 au texte que vous souhaitez faire apparaître ici. | Erreur !
Utilisez l'onglet Accueil pour appliquer Überschrift 1 au texte que vous souhaitez faire apparaître ici.

1. Introduction
The MobiliseYourCity Partnership supports local Governments in developing countries in creating
more inclusive, liveable, economically competitive and climate resilient cities. It does so by providing
support for the development and implementation of sustainable urban mobility plans (SUMPs) and
national urban mobility plans (NUMPs). The Partnership’s Beneficiary Partners target at reductions of
transport-related GHG emissions of more than 50% compared to business as usual.

This publication sets out the indicator framework and monitoring principles for the MobiliseYourCity
Partnership. That being said, a rough ex-ante estimate of the Partnership’s potential impacts as per its
core indicators is already required during the goal setting phase in order to prioritise measures and
inform cities whether targets can be achieved. This ex-ante estimate is called the SUMP/NUMP sce-
nario. Figure 1 illustrates how the monitoring and reporting process aligns with the main steps of the
SUMP/NUMP process

The SUMP/NUMP Process
 Getting ready to start
 Raising awareness for monitoring and reporting Setting a budget for monitoring and reporting

 Diagnosis & scenarios
 Calculating the transport emissions baseline
 Collecting transport & socioeconomic data
 scenario

 Goal setting & action plan
 Calculating the emission reduction potential of the
 Agreeing on assessment boundaries
 SUMP/NUMP

 Validating the plan
 Agreeing on a monitoring and data collection plan
 Confirming the budget for monitoring and reporting
 and procedures

 Implementation, monitoring, evaluation
 Calculating emission inventory and emission
 Data collection, monitoring
 reductions

Figure 1: Overview of monitoring and reporting steps in the SUMP/NUMP process

 5
6 Core Indicators and Monitoring Framework
 Erreur ! Utilisez l'onglet Accueil pour appliquer Überschrift 1 au texte que vous souhaitez faire apparaître ici. | Erreur !
 Utilisez l'onglet Accueil pour appliquer Überschrift 1 au texte que vous souhaitez faire apparaître ici.

 In principle, the ex-ante calculations follow the same approach as ex-post, but instead of using real-
 world (gathered) data, assumptions have to be made on the likely future development of certain pa-
 rameters (see Figure 2). Whenever assumptions are made, it is important to be transparent and state
 them explicitly in order to understand the results.

 Figure 2: Data collection during SUMP/NUMP development and implementation
Core Indicators and Monitoring Framework
Erreur ! Utilisez l'onglet Accueil pour appliquer Überschrift 1 au texte que vous souhaitez faire apparaître ici. | Erreur !
Utilisez l'onglet Accueil pour appliquer Überschrift 1 au texte que vous souhaitez faire apparaître ici.

2. Overview
The structure of the publication is as follows: The chapter at hand introduces the indicator framework
and provides a general understanding of the scope of the document. The subsequent chapters each
focus on one indicator out of the framework and give guidance on what kind of information the Mobi-
liseYourCity Partnership requires from its Partners with regards to monitoring and reporting of SUMPs
and NUMPs. It is mandatory to monitor and report on all indicators within this publication, except on
Impact Indicator 4 – Air Pollution, which is optional.

For the purpose of aggregated reporting against international agendas, the Partnership has defined
Core Impact and Investment Indicators, which are to be reported and monitored in those Beneficiary
Partners, which receive technical assistance under the Partnership umbrella. As many existing indica-
tor frameworks suffer from complexity, thus requiring a high level of technical knowledge to gather
suitable data, the Partnership’s core indicators have the objective to be actionable, replicable, and
easily understood. This way, SUMP/NUMP progress can be easily communicated not just to people
working within the sustainable urban mobility sphere, but also to politicians and community advocates
from unrelated fields.

This publication shall offer insights for Beneficiary Partner representatives and consultants on how to
gather data in a comparable manner, to ensure methodological coherence over time and to achieve
horizontal consistency among MobiliseYourCity Partners. For this purpose, a common methodology,
which fulfils the Partnership’s minimum recommended requirements, will be put forward for each in-
dicator. Wherever appropriate, a set methodologies will be suggested, which may differ in terms of
the amount of and detail of data needed. It is essential that the chosen methodology is documented
transparently and continuously for entire monitoring and reporting process.

2.1. Impact Indicators
GHG impact

 1. (Expected) GHG emission reductions (of a ‘SUMP/NUMP scenario’) (in tCO2e) against a
 ‘without SUMP/NUMP scenario’ (baseline)1.

Impacts related to Sustainable Development Goals (SDGs)

 2. Access (Proportion of the population living within 500 meters or less of a public
 transport stop with a minimum 20 minutes service at peak hour, or have access to a
 shared mobility system with comparable service for money)
 3. Safety (traffic fatalities (road, rail, etc.) in the urban area per 100.000 inhabitants. As
 defined by the WHO, a death counts as related to a traffic accident if it occurs within
 30 days after the accident)

1In order to harmonise reporting, estimated emission reductions must be reported in accumulated form for every 10-year

 7
period, and as the average annual reduction over a 10-year reporting period. In addition, the expected annual emission re-
duction in the target years 2030 and 2050 should also be reported
8 Core Indicators and Monitoring Framework
 Erreur ! Utilisez l'onglet Accueil pour appliquer Überschrift 1 au texte que vous souhaitez faire apparaître ici. | Erreur !
 Utilisez l'onglet Accueil pour appliquer Überschrift 1 au texte que vous souhaitez faire apparaître ici.

 4. Air pollution (optional): Mean urban air pollution of particulate matter (in mg PM2.5)
 at road based monitoring stations
 5. Modal share (share of public transport and non-motorized modes in trips)

 These indicators directly align with the transport related Sustainable Development Goals especially
 SDG 3 (good health and well-being) and SDG 11 (sustainable cities and communities). They refer to
 official SDG indicators for Target 3.6: “Halve number of global deaths and road injuries from traffic
 accidents”, Target 3.9: “Reduce deaths and illnesses from pollution”, and Target 11.2: “Provide access
 to safe, affordable, accessible and sustainable transport systems for all”.

 Further indicators selected individually in Beneficiary Partner Cities may link to the individual
 SUMP/NUMP targets and can be built upon experiences and tools developed e.g. in the EU specialist
 sphere about SUMPs/NUMPs. Annex 1 provides an overview of existing indicator sets and can be used
 as orientation for city-specific indicators for the Partnership’s Beneficiary Partners.

 2.2. Investment Indicators
 In addition to impact indicators, MobiliseYourCity requires from Beneficiary Partners data on five in-
 vestment indicators:

 1. KM of sidewalks planned to be built or to be substantially advanced in quality through
 the SUMP/NUMP
 2. KM of cycle lanes planned to be built or to be substantially advanced in quality
 through the SUMP/NUMP
 3. KM of mass rapid transit planned to be built or to be substantially advanced in quality
 through the SUMP/NUMP
 4. Number of city centre parking spaces (for individual cars), which are newly subjected
 to active parking management through the SUMP/NUMP (i.e. payment required in the
 future for parking, which was previously free of cost).
 5. The amount of mobilised public and private funding for the implementation of the
 SUMP/NUMP in Euro (€).

 Beneficiary Partners may want to define more investment indicators to ensure that individual
 measures are on track. However, because of strong differences in context, these will vary from Partner
 to Partner. Examples include the number of low-carbon buses purchased, or the number of bus kilo-
 metres offered, as well as indicators that refer to the quality of implementation and use of service,
 such as parking space or bicycle flows on new routes (see Annex 2 for examples of implementation
 and sustainable mobility indicators). This should provide an evidence base of city level transport GHG
 emission developments, i.e. emission reductions compared to the BAU scenario, being directly related
 to the implemented measures. These indicators again depend on the measures set out in the
 SUMP/NUMP.
Core Indicators and Monitoring Framework
Erreur ! Utilisez l'onglet Accueil pour appliquer Überschrift 1 au texte que vous souhaitez faire apparaître ici. | Erreur !
Utilisez l'onglet Accueil pour appliquer Überschrift 1 au texte que vous souhaitez faire apparaître ici.

2.3. Aggregated Monitoring on Partnership Level
All mandatory indicators are used for aggregated reporting on the MobiliseYourCity Partnership. Table
1 summarises ways how to aggregate indicators in the reporting framework of the Partnership:
Table 1: Ways to aggregate MobiliseYourCity indicators

 Indicator Aggregation

 GHG Impact

 Impact Indicator 1: GHG emission reductions (tCO2e) Sum of emission reductions in all Beneficiary Partner
 contexts

 SDG Impact

 Impact Indicator 2: Access to PT (Proportion of the Number of Partners that improve in the access to
 population living within 500 meters or less of a public public transport shares by certain amounts (e.g.: by
 transport stop with a minimum 20 minutes service at up to 3%, 5%, 10%)
 peak hour)

 Impact Indicator 3: Road Safety (traffic fatalities (road, Number of Partners that achieve a reduction of their
 rail, etc.) in the urban area per 100.000 inhabitants) respective fatality rates by certain amounts (e.g.: by
 up to 5/100000, 10/100000, 15/100000)

 Impact Indicator 4: Air Pollution (mean urban air pollu- Number of Partners with mean urban air pollution val-
 tion PM2.5 at a captured number of road based moni- ues below the WHO limit for PM2.5
 toring stations in a city

 Impact Indicator 5: Modal Share (share of public Number of Partner Cities that achieve an increase of
 transport and non-motorized modes in trips) their respective modal shares of non-motorized and
 public transport by certain amounts (e.g.: by up to 2%,
 by up to 5%, by up to 7%).

 Investment

 Investment Indicator 1: KM of sidewalks planned to be Sum of total km of infrastructure planned to be built or
 built or to be substantially advanced in quality through to be substantially advanced in quality under Mobi-
 the SUMP/NUMP liseYourCity SUMPs/NUMPs

 Investment Indicator 2: KM of cycle lanes planned to Sum of total km of infrastructure planned to be built or
 be built or to be substantially advanced in quality to be substantially advanced in quality under Mobi-
 through the SUMP/NUMP liseYourCity SUMPs/NUMPs

 Investment Indicator 3: KM of mass rapid transit Sum of total km of infrastructure planned to be built or
 planned to be built or to be substantially advanced in to be substantially advanced in quality under Mobi-
 quality through the SUMP/NUMP liseYourCity SUMPs/NUMPs

 Investment Indicator 4: Number of city centre parking Sum of city centre parking spaces (for individual
 spaces (for individual cars), which are newly sub- cars), which are newly subjected to active parking
 jected to active parking management through the management; foreseen in MobiliseYourCity
 SUMP/NUMP (i.e. payment required in the future for SUMPs/NUMPs
 parking, which was previously free of cost).

 Investment Indicator 5: The amount of mobilised pub- Sum of mobilised public and private funding under
 lic and private funding for the implementation of the MobiliseYourCity SUMPs/NUMPs in Euro (€)
 SUMP/NUMP in Euro (€).

 9
10 Core Indicators and Monitoring Framework Erreur ! Utilisez l'onglet Accueil pour appliquer Überschrift 1 au texte que vous souhaitez faire apparaître ici. | Erreur ! Utilisez l'onglet Accueil pour appliquer Überschrift 1 au texte que vous souhaitez faire apparaître ici. The overall approach to monitoring and reporting in MobiliseYourCity is summarised in the figure be- low. Figure 3: Overall logic of the monitoring and reporting approach in MobiliseYourCity 2.4. Application of the Core Indicator and Monitoring Framework to NUMPs NUMPs can take on different forms that are defined in Box 1. The Partnership categorizes NUMPs in three main categories: broad investment programmes carried out in a set of cities across a country, sector policies that provide harmonized and incentivising laws and regulations, and specific interventions on one aspect of sustainable urban mobility (e.g.: a scrapping programme). Box 1: Definition of a National Urban Mobility Policy and Investment Programme A National Urban Mobility Policy or Investment Programme is a strategic, action-oriented frame- work for urban mobility, developed by national governments, enacted to enhance the capability of cities to plan, finance and implement projects and measures designed to fulfil the mobility needs of people and businesses in cities and their surroundings in a sustainable manner. It builds on ex- isting policies and regulations and aims at harmonizing relevant laws, norms, sector strategies, in- vestment and support programs towards an integrated approach for the benefits of cities and their inhabitants. It takes due consideration of participation and evaluation principles.
Core Indicators and Monitoring Framework
Erreur ! Utilisez l'onglet Accueil pour appliquer Überschrift 1 au texte que vous souhaitez faire apparaître ici. | Erreur !
Utilisez l'onglet Accueil pour appliquer Überschrift 1 au texte que vous souhaitez faire apparaître ici.

In general, MobiliseYourCity encourages the monitoring of NUMPs with the help of the indicator
framework set out in this publication. As NUMPs can differ considerably in terms of focus and scope,
for each NUMP a thorough assessment should be carried out, which determines the set of indicators
that can be applied to any specific NUMP on a case by case basis. As a rule of thumb, it is expected
that NUMPs in the form of investment programmes can benefit the most from the application of this
indicator framework. NUMPs that constitute a very specific intervention may only show limited impact
on indicators that are not directly related to that intervention, and should only be monitored by a part
of the indicators in the framework.

 11
12 Core Indicators and Monitoring Framework
 Erreur ! Utilisez l'onglet Accueil pour appliquer Überschrift 1 au texte que vous souhaitez faire apparaître ici. | Erreur !
 Utilisez l'onglet Accueil pour appliquer Überschrift 1 au texte que vous souhaitez faire apparaître ici.

 3. Impact Indicator 1: Transport Related GHG Emissions
 The MobiliseYourCity approach to monitoring and reporting proposes that Beneficiary Partners project
 and track the development of transport related GHG emissions (CO2, CH4 and N2O) and other impacts
 at city level rather than per measure. The SUMPs form packages of measures that interact with each
 other and consequently have a bigger impact on emissions than the sum of single measures. Mobi-
 liseYourCity Partners are therefore required to account transport GHG emissions for their territory, i.e.
 direct emissions from mobile sources (tank-to-wheel) – cars, motorbikes, trucks and buses – and indi-
 rect emissions from the use of electricity and potentially upstream emissions from fuels (well-to-tank).
 Accounting for upstream emissions from fuels is particularly relevant wherever measures in the terri-
 tory affect the type of fuel that is consumed. Once established, the inventories should be updated
 annually as far as possible.

 Box 2: Focus on GHG emission accounting in MobiliseYourCity
 Note: Emission monitoring in MobiliseYourCity focuses on GHG emissions, in particular CO2, CH4
 and N2O. Monitoring air pollutant emissions is not mandatory for MobiliseYourCity reporting. Cit-
 ies that are interested in monitoring transport-related air quality, however, can use the data on
 transport related GHG emissions as a first step towards calculating local air pollutants. Air pollution
 assessments essentially follow the same methodology, but require more disaggregated data on
 vehicle fleets than the bottom-up calculation of GHG emissions (see Figure 5).

 In order to assess the GHG effect of each SUMP/NUMP, the overall GHG emissions associated with
 transport in each city territory are compared to a hypothetical business-as-usual scenario, which acts
 as the baseline (see Figure 4). This scenario describes the transport emissions that would have oc-
 curred in the absence of the SUMP/NUMP based on assumptions on travel demand per mode, vehicle
 efficiency and fuel-related emissions. In particular, assumptions on travel demand are coupled with
 assumptions on GDP and population developments.
Core Indicators and Monitoring Framework
Erreur ! Utilisez l'onglet Accueil pour appliquer Überschrift 1 au texte que vous souhaitez faire apparaître ici. | Erreur !
Utilisez l'onglet Accueil pour appliquer Überschrift 1 au texte que vous souhaitez faire apparaître ici.

This way emission inventories at the city level can be used to measure and report on the overall impact
of the SUMP’s/NUMP’s measures rather than assessing individual measures, since the GHG impacts
cannot easily be isolated from each other.

Figure 4: Comparison of real emissions (in year x) with the business-as-usual scenario (purple line) and the SUMP/NUMP
 scenario (green line)

The rationale for using the entire city territory as the assessment unit is that any measures imple-
mented within the city territory fall into the sphere of influence of local government, and can thus be
affected by the SUMP. In this way, the assessment unit directly corresponds to the geographical area
where the SUMP will have the greatest expected impact.
In addition, the ex-ante SUMP scenario can be used for setting a GHG emission target (in CO2e) for the
target year of the SUMP. Transport related emissions from within the city territory (within the same
boundaries as the SUMP) can then be tracked against the pathway to achieve this target. This allows
monitoring whether cities are on track to meet their GHG emission reduction goal. The savings can be
expressed in total tons CO2e per annum against the originally calculated baseline value in the respec-
tive year.
At the national level – in case a national urban mobility policy or programme (NUMP) incentivises
SUMP development or implementation – the total GHG emission reductions (compared to the base-
line) in all participating cities can be aggregated into the impact of the national policy or programme.
In addition, countries interested in developing NUMPs may want to provide national average emission
factors, average fleet composition or average annual mileages as default values for cities. This helps
cities develop their own inventories and track emission reductions, and also ensures comparability
across cities.

 13
14 Core Indicators and Monitoring Framework
 Erreur ! Utilisez l'onglet Accueil pour appliquer Überschrift 1 au texte que vous souhaitez faire apparaître ici. | Erreur !
 Utilisez l'onglet Accueil pour appliquer Überschrift 1 au texte que vous souhaitez faire apparaître ici.

 3.1. Definitions
 Definition of the Transport Related GHG Emissions Indicator:
 (Expected) GHG emission reductions (of a ‘SUMP/NUMP scenario’) (in tCO2e) against a ‘without
 SUMP/NUMP scenario’ (baseline).

 System Boundary for GHG Emission Accounting
 The GHG emission inventory for urban transport is the sum of all transport-related activities that can
 be attributed to the city. This attribution can follow different rationales (see Dünnebeil et al., 2012:23f
 and Box 3). The MobiliseYourCity Partnership follows a territorial approach since the city’s territory
 reflects the political and administrative sphere of influence and facilitates the assessment of each city’s
 SUMP. It includes emissions from inhabitants and visitors alike, and addresses all the local stakeholders
 that influence transport within the city’s territory (inhabitants, employers, public services, industry,
 trade etc.) (IFEU, 2014).
 The territorial approach is also recommended by other international guidelines, such as the Global
 Protocol for Community-Scale Greenhouse Gas Emission Inventories (WRI, 2014) or the Covenant of
 Mayors2, and is therefore in line with state-of-the-art international best practice.

 Box 3: System boundaries for emission accounting in urban transport and reasons for a
 territorial approach
 Transport activities can be attributed to a monitoring area using different approaches. This has
 consequences for the informative value and the further use of the monitoring results. The most
 common system boundaries for monitoring urban transport emissions are:

 1. Territorial: All transport activities of a means of transportation within the territory are covered.
 The territory can be defined in different ways, e.g. as the whole functional area of a city or city-
 governed districts only. With this approach, all transport activities within the political sphere of
 influence of municipal Government are covered. However, further differentiations (e.g. internal vs.
 origin/destination vs. transit traffic) can help understand the drivers of traffic flows and volumes,
 and identify fields of action.

 2. Inhabitants: All traffic related to city inhabitants is included, independent of the place where
 traffic occurs (e.g. including trips outside of the city or air travel). Contributions to traffic in the city
 from non-inhabitants (e.g. commuters, tourists, incoming freight transport) are not covered in this
 approach. Consequently, possible GHG emission reductions in commuter traffic or any other in-
 coming transport are not covered in this monitoring system. At the same time, the inhabitants
 approach includes travel activities that cannot directly be influenced by municipal Government,
 such as long-distance travel.

 2The Covenant of Mayors for Climate & Energy Initiative was launched in 2009. It brings together thousands of local and
 regional authorities who have voluntarily committed to implementing EU climate and energy objectives within their terri-
 tory. http://www.covenantofmayors.eu/index_en.html
Core Indicators and Monitoring Framework Erreur ! Utilisez l'onglet Accueil pour appliquer Überschrift 1 au texte que vous souhaitez faire apparaître ici. | Erreur ! Utilisez l'onglet Accueil pour appliquer Überschrift 1 au texte que vous souhaitez faire apparaître ici. Figure 5: Different system boundaries for urban transport emission accounting Figure source: IFEU Heidelberg, 2012 3. Origin-destination (OD) approach: All traffic with an origin and/or destination within the city’s territory is covered (boundary-crossing traffic: 50% of long-distance trips is counted). This ap- proach reflects urban transport activities very well, but it requires high levels of data availability that only a few cities are able to meet. Furthermore, it still includes 50% of long-distance trips, which city policies has no influence on. Transit traffic is not covered. 4. Energy sales: Emissions are calculated using a top-down approach based on statistics on fuel sales in the city. This approach only allows for a rough estimation since a purely sales-based ap- proach does not provide any information on how much of the purchased fuel is actually used within the city. It also does not provide data on the actual transport activities that are related to the city, or their causes – information which is necessary for transport planning. Using energy sales data alone does not adequately monitor the effects of SUMPs, but it can be used to cross-check bottom- up calculations. Source: Dünnebeil et al., 2012 In addition to the general approach to system boundary, several other parameters have to be decided on in order to fine-tune the accounting process, namely: Which transport modes are covered? Which emissions/gases are accounted for? What is the timeframe and monitoring interval? 15
16 Core Indicators and Monitoring Framework
 Erreur ! Utilisez l'onglet Accueil pour appliquer Überschrift 1 au texte que vous souhaitez faire apparaître ici. | Erreur !
 Utilisez l'onglet Accueil pour appliquer Überschrift 1 au texte que vous souhaitez faire apparaître ici.

 Transport Modes
 Ideally, all motorised modes (passenger and freight transport) are included in the emissions inventory.
 This helps paint a complete picture of the transport sector’s emission profile in each territory. In reality,
 however, data may not be readily available for all modes. A pragmatic option is to begin with those
 modes that are relevant to the scope of the individual SUMP, i.e. those modes directly affected by the
 measures included in the SUMP. In most cases, this means disregarding aviation emissions (territorial
 boundary emissions only include take-offs and landings) and emissions of inland shipping if they are
 not affected by the SUMP and only make up a small share of transport and emissions. This of course
 depends on each city’s specific context. If a city has an airport or a port within the city territory, these
 emissions could account for a significant portion of transport related emissions and a deliberate deci-
 sion has to be taken whether or not to include them.
 In addition, it is recommended to differentiate the emission profile for transport modes that are under
 the influence of local administrations (transport within the city boundary or with an origin/destination
 within the territory, including passenger and freight transport) and those that are hardly affected by
 local measures (transit traffic, public long-distance transport, such as bus, rail and aviation, as well as
 rail-bound and inland freight transport) (IFEU, 2014). Such a differentiation enables accounting all
 emissions in each territory, while highlighting those that are influenced by the SUMP and analysing
 their emission development separately. In this way, the complete emission profile can be reported and
 the SUMP’s achievements can be tracked.

 Emissions
 The MobiliseYourCity approach aims to account for CO2, CH4 and N2O in CO2-equivalents (see Box 4),
 including direct tailpipe emissions (tank-to-wheel) and upstream emissions that result from the pro-
 duction and transportation of fuels (well-to-tank). Direct tailpipe emissions and upstream emissions
 should be reported in separate figures and then aggregated. Accounting for upstream emissions en-
 sures the comparability of conventional propulsion systems and electric vehicles (for which emissions
 only occur upstream), as well as other fuel switch options.
 In addition to GHG emissions, black carbon emissions, a component of soot, which is released during
 diesel fuel combustion, may be monitored. Black carbon has a strong warming effect as well as disas-
 trous impacts on local air quality and public health (see Box 4). Monitoring black carbon emissions can
 therefore be extremely useful for cities. Unfortunately, due to the complex interactions of black carbon
 in the atmosphere, its exact global warming potential is still subject to scientific uncertainties. None-
 theless, monitoring black carbon emission developments can help keep track of the order of magni-
 tude and local air quality effects.

 Box 4: Transport related emissions and their warming effect
 GHG emissions and their global warming potential
 GHGs emitted by transport mainly consist of carbon dioxide (CO2), in addition to small amounts of
 methane (CH4) and nitrous oxide (N2O). In order to compare the warming effects of different
 GHGs, the global warming potential (GWP) is used. The GWP relates the amount of heat trapped
Core Indicators and Monitoring Framework
Erreur ! Utilisez l'onglet Accueil pour appliquer Überschrift 1 au texte que vous souhaitez faire apparaître ici. | Erreur !
Utilisez l'onglet Accueil pour appliquer Überschrift 1 au texte que vous souhaitez faire apparaître ici.

 in the atmosphere by a particular GHG to the amount of heat trapped by a similar mass of CO2. In
 this way, the sum of all GHG emissions can then be indicated as CO2 equivalents.

 The global warming potentials (for a time horizon of 100 years) of carbon dioxide, methane and
 nitrous oxide are as follows (IPCC, 2007):

 CO2: 1 CH4: 25 N2O: 298

 Black carbon (not calculated in MobiliseYourCity)
 Black carbon – a component of soot – is released by burning biomass (wood stoves and biomass
 burning, as well as natural wild fires), coal and diesel fuels. It is an important component of partic-
 ulate matter, contributing to air pollution and leading to respiratory diseases like asthma and lung
 cancer. The World Health Organisation estimates that outdoor air pollution led to 3.7 million prem-
 ature deaths in the year 2012 alone, of which almost 90% occurred in low- and middle-income
 countries (WHO, 2014). A lesser known fact is that soot also has a strong warming effect on the
 climate. In fact, it is the second largest man-made contributor to climate change (Bond et al., 2013).
 Soot warms in two ways:

 1. Particles in the air absorb sunlight, generating heat in the atmosphere.
 2. Winds transport soot particles to the Arctic and the Himalayas, where they settle
 on ice and snow like a black blanket, stopping the reflection of sunlight. Instead,
 radiation is absorbed, accelerates the melting of the arctic ice sheet and the Hima-
 layan glaciers, and further intensifies global warming.

 In contrast to CO2, which stays in the atmosphere for centuries, black carbon only remains for
 several weeks. Abating black carbon therefore has a short- term effect on climate change and an
 immediate effect on local air quality. The main contributors to black carbon from the transport
 sector are diesel vehicles without particulate filters. This includes trucks, ships, rail, utility vehicles
 and construction machinery (Eckermann et al., 2015).
 Calculating the exact effect of black carbon is a complex and scientifically contested issue. Mobi-
 liseYourCity does not require an assessment of black carbon warming effects. It may however be
 of interest to cities that wish to account for particulate matter out of air quality considerations. In
 this case, the number of PM can also give an order of magnitude indication to the development of
 black carbon emissions.

Upstream and downstream emissions from vehicle production are not accounted for since they are
small compared to transport related emissions.

The inventory also does not account for construction emissions from major infrastructure projects,
such as metros or highways. Metro construction emissions are, however, significant and should be
considered in the emission reduction calculations. This is usually done in the form of an ex-ante esti-
mation to get an idea of the total emissions, but it is not monitored during construction in an attempt
to keep the data requirements low. Whether or not construction emissions are included in emission
 17
18 Core Indicators and Monitoring Framework
 Erreur ! Utilisez l'onglet Accueil pour appliquer Überschrift 1 au texte que vous souhaitez faire apparaître ici. | Erreur !
 Utilisez l'onglet Accueil pour appliquer Überschrift 1 au texte que vous souhaitez faire apparaître ici.

 reporting is decided on a case-by-case basis. If construction is considered in the accounting system
 then it also has to be included in the baseline emission calculations.

 Source: Own illustration, adapted from IFEU, 20133

 Figure 6: Transport modes and emissions included in the GHG monitoring (ideal case)

 Timeframe
 MobiliseYourCity suggests a GHG monitoring interval of 1-3 years. For ex-ante emission reduction sce-
 narios the timeframe has to be adopted to fit into the SUMP’s planning cycle. Assuming that the im-
 plementation of a SUMP will take approximately 10 years, the minimum time span for the monitoring
 and reporting system should also be ten years. In order to harmonise reporting, estimated emission
 reductions should therefore be reported in accumulated form for every 10-year period, and as the
 average annual reduction over a 10-year reporting period. However, since the full benefits will not be
 apparent until the SUMP measures have been implemented, annual emission reduction benefits will
 increase over time. This means that a longer assessment period, e.g. 20 years, will show larger effects.
 Once all of the above parameters have been decided upon, the system boundary for monitoring is set.
 The boundary will always be a compromise between as close a representation of the territorial emis-
 sion profile as possible and the extent of locally available data and resources. Finding this compromise
 is a key challenge for good inventories. Often, data needs to be combined from various data sources
 and data needs to be analysed and processed to meet the defined boundaries.

 3 Icons created by Viktor Vorobyev, Matthew Hall, Ricardo Ruíz, Edward Boatman, Creative Stall, Iastspark from Noun Pro-
 ject https://thenounproject.com/
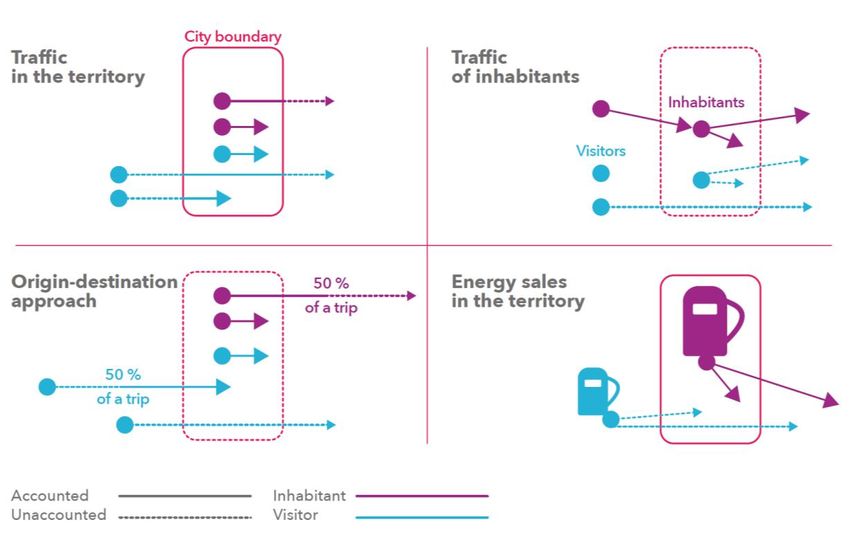
Core Indicators and Monitoring Framework
Erreur ! Utilisez l'onglet Accueil pour appliquer Überschrift 1 au texte que vous souhaitez faire apparaître ici. | Erreur !
Utilisez l'onglet Accueil pour appliquer Überschrift 1 au texte que vous souhaitez faire apparaître ici.

3.2. Calculation & Aggregation
Calculation
The total transport related GHG emissions depend upon several parameters: Transport demand (travel
activity by mode), respective specific energy consumption per mode per travel activity, and specific
GHG conversion factor per energy carrier per mode. The emission inventory for the transport sector is
calculated using a bottom-up approach that is based on the ASIF framework as described in Figure 7.

 Figure 7: ASIF Framework for the calculation of transport emissions

Ideally, the values for the parameters should be adapted to city-specific circumstances to calculate
local transport GHG emission inventories. However, the availability of data and resources for data col-
lection usually does not permit such a level of detail/local adaptation. At the same time, not all param-
eters are equally dependent on local contexts. For instance, travel activity and modal split usually vary
greatly from city to city, depending on their size and level of urbanisation, as well as geographic, eco-
nomic and demographic aspects. In contrast, the carbon content of fuels lies outside of the influence
of cities, which means that national default factors or even IPCC default values can be used (IFEU,
2014).

The calculation approach must also account for local capacities. Depending on local data availability
and resources, inventories can be based on simple calculations and more aggregated data, or on more
advanced modelling approaches that allow for emissions from different sources to be monitored in
great detail.
In principle, the inventory approach presented here also facilitates the calculation of local air pollutant
emissions. However, this requires more information on vehicle characteristics than the calculation of
GHG emissions. It is, therefore, more relevant in cities with good data availability.

 19
20 Core Indicators and Monitoring Framework
 Erreur ! Utilisez l'onglet Accueil pour appliquer Überschrift 1 au texte que vous souhaitez faire apparaître ici. | Erreur !
 Utilisez l'onglet Accueil pour appliquer Überschrift 1 au texte que vous souhaitez faire apparaître ici.

 Aggregation / Time Series
 Once the GHG emissions of the base year have been obtained, its progress against the target GHG
 emissions can be monitored in regular intervals. It is therefore required that the SUMP/NUMP provides
 a robust business as usual scenario against which progress can be observed.

 On the Partnership level we want to aggregate the sum of emission reductions in all Beneficiary Part-
 ner contexts.

 3.3. Data Availability & Collection
 As shown above (Figure 7), the calculation of transport related emissions requires information on each
 transport mode included in the monitoring boundary and specific GHG emission factors (in gCO2e per
 km), which depend on the type of vehicle, as well as fuel consumption and fuel type, i.e. fleet compo-
 sition. The data collection process for these parameters is explained in the following chapters.

 Monitoring Transport by Mode
 Transport data has to be collected and determined at city level. National averages do not enable an
 evaluation of SUMP progress. Typical sources of transport data are summarised in Table 2. If transport
 data is not yet routinely collected and available from official statistics, a number of options for low-
 effort data collection exist (cf. Table 3). One of the most common approaches to data collection for
 private road transport is traffic counts, which should be differentiated according to road type (inner-
 city road, urban roads and highways) (see Monitoring Greenhouse Gas Emissions of Transport Activi-
 ties in Chinese Cities – A Step-by-Step Guide to Data Collection, Section 2.1.2).
 In addition to assessing transport in general in each territory, transit traffic has to be estimated sepa-
 rately. This is important to distinguish from other types of transport since urban transport policy has –
 in most cases –little influence over transit traffic.

 Cities with travel demand models that are frequently updated can extract transport data from the
 model by multiplying traffic flow data with the length of the road network. In this case, it is important
 to compare the geographic boundary of the travel demand model to the assessment territory since
 some models only cover city centres.

 Once transport by mode is known, this needs to be multiplied with the correct emission factors to
 calculate the urban transport emission inventory. In order to choose the right emission factors, infor-
 mation on the composition of the vehicle fleet is required.

 Monitoring Fleet Composition
 The composition of a city-specific vehicle fleet strongly influences local transport emissions. The more
 private cars are on the road and the larger or older the vehicles are, the higher their fuel consumption
 is and the higher the related GHG emissions are. In other words, GHG emissions depend on the vehicle
 fleet and on the distribution of VKT across the fleet’s vehicle mix.

 Data on the vehicle fleet is usually available from vehicle registration statistics for passenger cars, taxis,
 trucks and motorcycles (e-bikes are mostly excluded), which includes technical specifications for the
Core Indicators and Monitoring Framework Erreur ! Utilisez l'onglet Accueil pour appliquer Überschrift 1 au texte que vous souhaitez faire apparaître ici. | Erreur ! Utilisez l'onglet Accueil pour appliquer Überschrift 1 au texte que vous souhaitez faire apparaître ici. different vehicle types. Once the registered fleet is documented for the base year, e.g. 2015, only newly registered (and deregistered) vehicles have to be monitored each year. If there are no big differences in the fleet compositions across different cities in a country, using na- tional averages for urban fleet composition may be considered. Where the fleet is known to be quite specific, however, these local characteristics should be accounted for; e.g. prosperous metropolitan areas may have a larger number of new and larger cars than less prosperous mid-sized cities with a smaller but older fleet. Table 2: Data sources for vehicle fleet composition in cities Data source Means of Type of data System Fleet Traffic transportation boundaries composition situation Vehicle Passenger cars Vehicle stock by Inhabitants Yes, but only for No registration statis- Taxis technical charac- (= owners of regis- stock, not for VKT tics Trucks teristics tered vehicles) Motorcycles (usually no e- bikes) 21
22 Core Indicators and Monitoring Framework Erreur ! Utilisez l'onglet Accueil pour appliquer Überschrift 1 au texte que vous souhaitez faire apparaître ici. | Erreur ! Utilisez l'onglet Accueil pour appliquer Überschrift 1 au texte que vous souhaitez faire apparaître ici. Table 3: Data sources for transport in cities Data source Means of Type of data System Fleet Traffic transportation boundaries composition situation Trip survey Passenger cars Per person: Inhabitants Optional (depending on con- No (households or companies) Motorcycles Pkm* figuration of the survey) Taxi * For cars differentiated into Buses driver, co-driver, with chauf- Subway feur Regional train Vehicle activity survey Passenger cars Per vehicle: Inhabitants (= owners of the Optional: Depending on con- No Taxis - VKT or vehicles) figuration of the survey (only if survey includes float- Motorcycles ing car data - Number of trips & dis- Trucks tances Main inspection data Passenger cars Per car: Inhabitants (owners of the ve- Yes No Taxis - VKT from odometer hicles) Trucks Taximeter information Taxis Per taxi: Territorial: Optional: only if analysed No - VKT or Cruising radius of local taxi taxis are representative of the fleet (territory might differ to entire taxi fleet - Number of trips & trip distances geographical boundaries of the city)
Core Indicators and Monitoring Framework Erreur ! Utilisez l'onglet Accueil pour appliquer Überschrift 1 au texte que vous souhaitez faire apparaître ici. | Erreur ! Utilisez l'onglet Accueil pour appliquer Überschrift 1 au texte que vous souhaitez faire apparaître ici. Data source Means of Type of data System Fleet Traffic transportation boundaries composition situation Floating car data (GPS) -Passenger cars Per vehicle: Inhabitants (= owners of the Optional: only if analysed ve- Yes: Conversion to HBEFA -Taxis - VKT for single vehicle in vehicles) hicles are representative of traffic situations is only possi- -Buses analysed time period entire fleet ble with linkage to GIS data -(Trucks) on the road network Extrapolation to total VKT only if analysed vehicles and time period are representa- tive of fleet Traffic counting with on-road Passenger cars Traffic volumes for analysed Territorial: can be used as ba- No Optional: sensors Taxis road section sis for calculating travel activ- Some road sensors provide in- Buses ity based on street lengths formation on vehicle speed Motorcycles and for calibrating traffic Trucks model and estimating VKT de- velopment Video monitoring on selected Passenger cars Traffic volume for analysed Territorial: can be used as ba- Optional: Licence plate survey No road sections Taxis road section sis for calculating travel activ- and matching with vehicle Buses ity based on street lengths for registration statistics Motorcycles territorial VKT of a city and for Trucks calibrating traffic model and updating VKT data 23
24 Core Indicators and Monitoring Framework Erreur ! Utilisez l'onglet Accueil pour appliquer Überschrift 1 au texte que vous souhaitez faire apparaître ici. | Erreur ! Utilisez l'onglet Accueil pour appliquer Überschrift 1 au texte que vous souhaitez faire apparaître ici. Data source Means of Type of data System Fleet Traffic transportation boundaries composition situation Public transport companies Bus For the entire public transport Territorial: public transport Optional: No Subway network or for different network might differ to geo- - Bus per engine type (and Regional train routes: graphical boundaries of the size) - Final energy consump- city - Train per traction tion - VKT - Pkm - Transport capacity - Load factors Public transport network Bus Length of each public Territorial: public transport No No plans Subway transport route network might differ to geo- Regional train graphical boundaries of the city Public transport timetables Bus Service frequency of each Territorial: public transport No No Subway public transport route(e.g. network might differ to geo- Regional train number of buses per day) graphical boundaries of the city IC cards Bus Number of passenger Territorial: public transport No No Subway trips network might differ to geo- Pkm (only subway) graphical boundaries of the city Car hailing apps Taxi Number of passenger Territorial: public transport No No trips network might differ to geo- Pkm graphical boundaries of the city
Core Indicators and Monitoring Framework Erreur ! Utilisez l'onglet Accueil pour appliquer Überschrift 1 au texte que vous souhaitez faire apparaître ici. | Erreur ! Utilisez l'onglet Accueil pour appliquer Überschrift 1 au texte que vous souhaitez faire apparaître ici. Selection of Emission Factors Specific GHG emission factors (CO2, CH4, N2O in gCO2e/km) apply according to the different transport characteristics. The accuracy of emission factors greatly affects the overall emission calculations. At vehicle level, the specific energy consumption per kilometre travelled depends on technical param- eters and operating conditions. In road transport, considerable differences in energy consumption and related GHG emission factors per kilometre are caused by: Different vehicle characteristics, such as engine type, engine capacity, vehicle age and, to a lesser extent, the emission concept (such as Euro 1-6). As emission standards are phased in over time, data on emission concepts can be used as a proxy indicator for vehicle age (based on fleet compo- sition). Different traffic characteristics, especially speed, traffic quality and road gradients. These depend primarily on transport infrastructure and traffic volumes, but also on other conditions, such as traffic lights or weather conditions. Emission factors range from highly disaggregated factors, e.g. specific emission factors for each pas- senger car differentiated by vehicle size, age and emission class (e.g. EUR 4), to averaged emission factors, e.g. only one average emission factor for all buses. If average emission factors are used, these should ideally be derived from detailed factors that are aggregated based on average fleet composi- tions and average driving situations. Since the many factors that influence fuel consumption vary significantly from country to country, country-specific emission factors are required. Using international default values introduces high un- certainties into emissions calculations, which is not recommended since it does not reflect country- specific circumstances. In addition, improvements that affect emission factors, such as changes in ve- hicle fleets or improvements in driving conditions, cannot be reflected in emissions calculations if in- ternational defaults are used. Several countries already have national average emission factors based on average national fleet com- positions (how many vehicles of a certain size (engine capacity), age and fuel type per vehicle cate- gory), average driving conditions on different road types, and ideally also upstream emissions of fuels. If emission factors are only available for tank-to-wheel emissions, a correction factor for upstream emissions can be applied. If official national emission factors exist, cities must decide whether it is appropriate and sufficient to work with national defaults or whether city-specific adaptations to emission factors are required. This can depend on several factors: 1. Which measures are covered by the SUMP? Can their effects be reflected in national average values or not? 2. Does the local context vary significantly to the national average, e.g. due to a wealthier population in the capital, which affects the fleet composition (e.g. higher number of larger cars)? 25
26 Core Indicators and Monitoring Framework Erreur ! Utilisez l'onglet Accueil pour appliquer Überschrift 1 au texte que vous souhaitez faire apparaître ici. | Erreur ! Utilisez l'onglet Accueil pour appliquer Überschrift 1 au texte que vous souhaitez faire apparaître ici. For instance, if the national average emission factors are based on an average fleet composition, effi- ciency improvements in the local municipal fleet will not show up in the city-specific emission calcula- tions. This can also affect public transport fleets. Similarly, if larger cities are interested in traffic flow measures and their effects, local data on driving conditions, such as congestion reduction measures, will need to be collected. This is possible in cities where travel demand models and differentiated emission factors exist, e.g. the Chinese city of Shenzhen. If no country-specific emission factors exist, international (or possibly regional) default values can be used as a fall-back option, especially for ex-ante calculations. However, MobiliseYourCity recommends striving towards the adaptation of emission factors that are country-specific in order to ensure accu- rate monitoring. MobiliseYourCity can provide support for this process to participating cities. Furthermore, it is suggested that emission factors should be differentiated by fuel type within each vehicle category. Step by Step Approach to GHG Monitoring and Reporting The previous sections set out the MobiliseYourCity’s approach to GHG monitoring and reporting. They also highlighted how these principles fit into the broader monitoring framework, including sustainable mobility and implementation indicators. A rough impact assessment should already be conducted ini- tially to identify each SUMP’s emission reduction potential. The following checklist sums up the key elements of a successful Monitoring, Reporting and Verification process during the development and implementation of SUMPs. Table 4: Monitoring and Reporting Checklist Checklist Monitoring and Reporting (M+R) SUMP Step 1: Getting ready to start The needs for external support on M+R are assessed A budget for M+R is set SUMP Step 2: Diagnosis & scenarios Transport data availability is checked and available data collected Baseline scenario for transport emission development is calculated and assumptions are agreed upon among relevant stakeholders SUMP Step 3: Goal setting and action plan development Expected effects of the planned SUMP and actions are described (cause-effect relation/logical framework) Scope of the monitoring approach is set (assessment boundaries) GHG impact of the SUMP has been calculated ex-ante Limitations of the GHG emission quantification are described (uncertainties) Sustainable mobility benefits have been assessed ex-ante SUMP Step 4: Validation of the action plan If necessary, adjust the ex-ante GHG impact calculation to the validated action plan for the SUMP Data needs and collection methods have been identified and agreed by relevant stakeholders
Core Indicators and Monitoring Framework Erreur ! Utilisez l'onglet Accueil pour appliquer Überschrift 1 au texte que vous souhaitez faire apparaître ici. | Erreur ! Utilisez l'onglet Accueil pour appliquer Überschrift 1 au texte que vous souhaitez faire apparaître ici. Checklist Monitoring and Reporting (M+R) Responsibilities for M+R have been assigned Precise budget for M+R has been confirmed A monitoring plan and procedures have been developed, including quality assurance SUMP Step 5: Implementation and monitoring Data is collected, processed and quality controlled continuously Emission inventory is calculated every 1-3 years The baseline scenario is recalculated ex-post and emission reductions are assessed every 1-3 years Supporting information to verify the GHG impact can be provided annually Sustainable mobility report is produced every 5 years (mid-term assessment) In reality, this process must be adapted to local circumstances and decision-making processes. As a result, timing may vary from city to city. Data collection and management, as well as emission calculations, are iterative processes that can be improved over time as data availability increases. To ensure consistency and transparency in emission reporting it is important to clearly document all data sources, definitions and assumptions. If done correctly, monitoring and reporting can greatly improve the information basis for transport planning and vice versa. Most of the data needed for emission calculations must also be collected as part of the development of a sound SUMP. At the same time, monitoring reports can be used to communicate progress, highlight the impacts of SUMP implementation and help secure ongoing support from stake- holders. 27
You can also read