North Shore Community Health
      Data Assessment
          2017-2021
←
→
Page content transcription
If your browser does not render page correctly, please read the page content below

North Shore Community Health
Data Assessment
2017-2021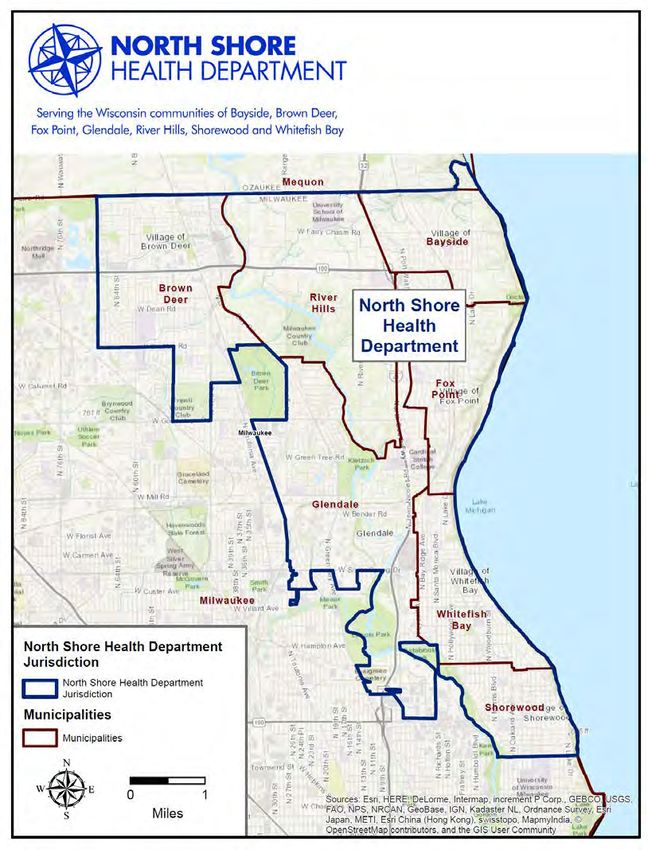
Introductory Letter
Letter from the Health Director/Officer
In 2017, the North Shore Health Department began the process of creating a North Shore Community Health
Assessment with a vision to gather information on the current health needs, assets, and conditions of people
living in the seven municipalities that we serve. We wanted to present a comprehensive picture of what is
impacting the health outcomes and quality of life of people in our communities. The first task was to collect as
much public health data as we could within existing data systems. The results of our data gathering and
assessment of this information comprises this document--the North Shore Community Health Data
Assessment. We also wanted to hear from residents and leaders of our communities to learn their views on
the community health issues preventing residents from obtaining optimal health, and their thoughts on our
community assets. We interviewed 40 key informants and summarized their input in the North Shore
Community Health Stakeholder Assessment. The third component of our approach was to hear directly
from residents about their top community health concerns. Our North Shore Community Health Priority
Assessment provides a snapshot of the primary health concerns voiced by residents. The findings of each
approach are stand-alone documents which can be accessed through our website at
www.nshealthdept.org/CHA.

What stood out from all elements of the North Shore Community Health Assessment is residents of the North
Shore generally experience good health and the conditions that drive good health. Education, access to
clinical care, and environmental resources such as parks and farmers’ markets are important assets within our
region. While health outcomes are generally better among residents in the North Shore when compared to
Milwaukee County or Wisconsin overall, there still exist several health outcomes, behaviors, and risk factors
which are important to address. Examples include:
     • Lung cancer is the leading cause of cancer-related deaths in the North Shore, and lung, colorectal,
         prostate and breast cancers account for almost half of all cancer deaths in our region.
     • Drug-related death rates are increasing, including those attributable to prescription opioids and heroin.
     • Self-reported rates of diabetes increased from 4% in 2003 to 11% in 2015, and hospitalization rates for
         diabetes are higher in the North Shore than in Wisconsin as a whole.
     • Mental health issues were a top concern for stakeholders and residents.
     • Rates of binge drinking in the North Shore have caught up to rates state-wide, with 25% reporting binge
         drinking in the past month.
     • The North Shore has a larger percentage of older adults (65+) than the rest of the state, many of whom
         live alone.
     • Older adults have falls at higher rates, which also contribute to a leading cause of death in the North
         Shore.

As we move into the next phase of the Community Health Improvement Action Cycle, we welcome your
feedback on the Community Health Assessment. Please join us at an upcoming listening session or contact us
directly.

Ann Christiansen, MPH
Health Officer/Director
North Shore Health Department
414-371-2980

                                                        2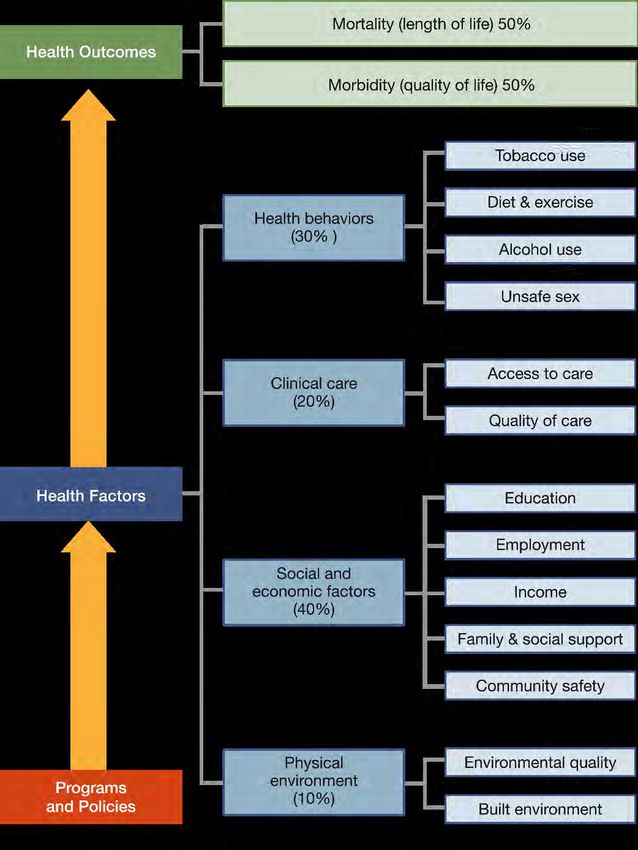
Acknowledgements
Completing a Community Health Assessment (CHA) covering the seven jurisdictions included in the North
Shore requires contributions from many partners. The North Shore Health Department acknowledges and
appreciates contributions to all components of the North Shore CHA from the following individuals and
organizations:

 •    Residents, elected officials, and    • REDgen
      leaders from the municipalities      • Grassroots North Shore
      served by the North Shore            • Aurora Health Care
      Health Department:                   • Medical College of Wisconsin
          Village of Bayside               • REACH Clinic
          Village of Brown Deer            • Milwaukee County Department on Aging
          Village of Fox Point
                                           • Milwaukee Health Care Partnership
          City of Glendale
          Village of River Hills           • United Way of Greater Milwaukee and Waukesha County
          Village of Shorewood             • University of Wisconsin-Milwaukee,
          Village of Whitefish Bay           College of Nursing
                                           • University of Wisconsin-Milwaukee,
•    Bayside Communications Center           Joseph J. Zilber School of Public Health
•    North Shore Fire/Rescue               • University of Wisconsin, Center for Urban Population Health
•    North Shore Library Directors         • Wisconsin Department of Health Services,
                                             Office of Health Informatics
•    North Shore School Districts’ Staff
                                           • Wisconsin Department of Health Services, Office of Preparedness and
     and Leaders
                                             Emergency Health Care
•    North Shore NOW                       • Wisconsin Department of Health Services, Bureau of Environmental and
•    Fringe Interior Design                  Occupational Heath
•    Mark Travel                           • Wisconsin Department of Public Instruction
•    Shorewood Family Chiropractic         • Wisconsin Department of Transportation
•    Texas Instruments

                North Shore Health Department                        North Shore Health Department
             Community Assessment Team Members                         Board of Health Members
                       Lori Ahrenhoerster, PhD
                                                                      Jennifer Evertsen, MS – Bayside
                        Public Health Manager
                       Ann Christiansen, MPH
                                                                  Barbara Bechtel, RN, BSN – Brown Deer
                        Health Director/Officer
                         Rachel Lecher, MPH
                                                                   William Warner (deceased) – Fox Point
                 Former Public Health Specialist and
                                                                           Bruce Weiss, MD, MPH
                 UWM MPH Field Placement student
                         Sanja Miljevic, BSN
                                                                    Debesh Mazumdar, MD – Glendale
                         Public Health Nurse
                  Kristine Peterka, DPN Candidate
                                                                      Claudia Altman, MD – River Hills
                      UWM College of Nursing
                         Kathleen Platt, BSN
                                                                  Mary Jo Baisch, PhD, RN – Shorewood
                   Public Health Nurse Supervisor
                      Kimberly Schneider, BSN
                                                                 Christopher Simenz, PhD – Whitefish Bay
                         Public Health Nurse
                            Jessica Warden                                  Gary Lewis, MD
                 UWM MPH Field Placement Student                          Medical Advisory/Chair
                                                         3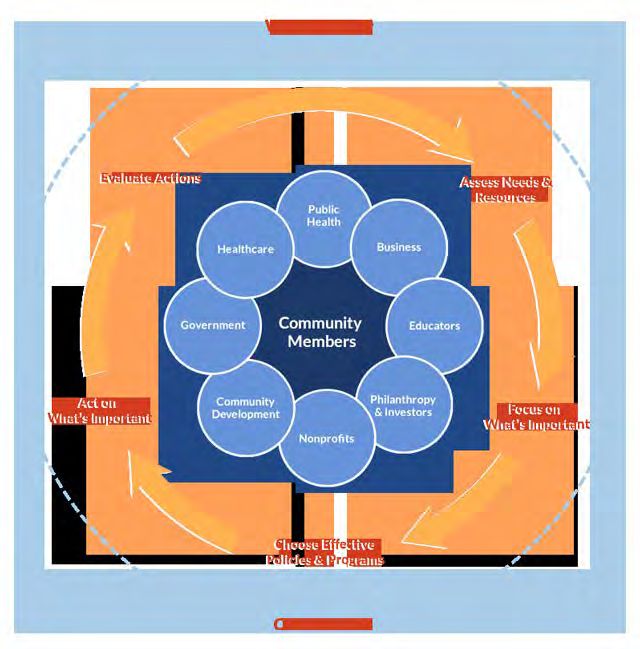
Table of Contents
                       Introductory Letter                    2
                       Acknowledgements                       3
    Introduction       Table of Contents                      4
                       Appendices List                        5
                       Methodology                            6-9
                       North Shore Community Overview         10
  Demographics
                       North Shore Demographic Data          11-12
                       Leading Causes of Death                13
     Mortality         Injury-related Deaths                 13-15
                       Infant Mortality                       15
                       Overall Indicators of Health          16-17
                       Chronic Disease                       17-20
     Morbidity
                       Communicable Disease                  20-23
                       Injury                                23-25
                       Physical Activity and Nutrition       26-27
                       Alcohol                               27-28
 Health Behaviors      Substance Abuse                       28-29
                       Tobacco                               29-30
                       Reproductive and Sexual Health        30-32
                       Insurance Coverage                     33
Clinical Health Care
  & Public Health      Access to Providers                    34
      Systems
                       Health Literacy                        35
                       Education                              36
                       Employment & Income                    37
Social & Economic
     Factors           Community & Personal Safety           37-38
                       Social Support                        38-39

    Physical           Built Environment                     40-41
   Environment         Natural Environment                   41-43

    Next Steps         Community Health Improvement Cycle     44

                                                         4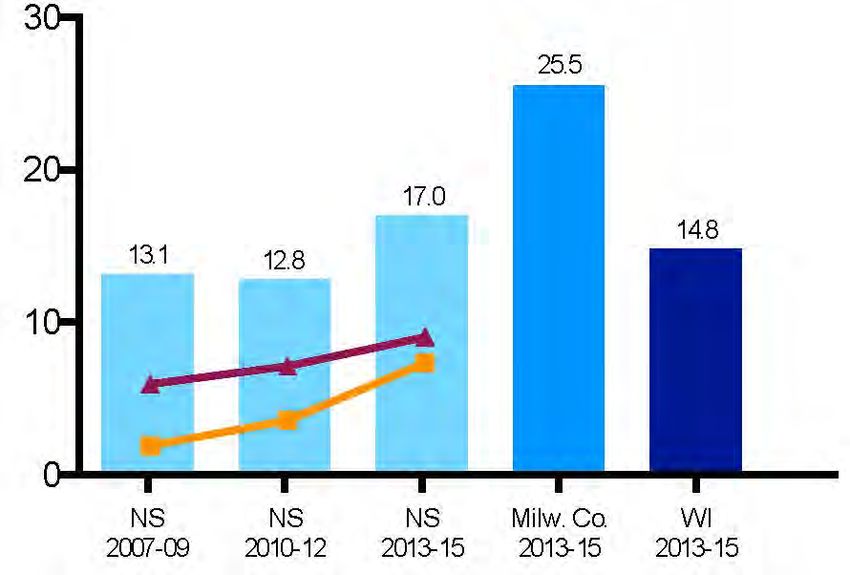
Appendices
             Measures Used in North Shore 2017-2021 Community Health Data
Appendix A   Assessment, which contains a summary of local data used for              45-53
             comparisons, with sources and comparison to State data

             North Shore Community Health Survey Report Methods, which
Appendix B   outline the methods of data collection for the Community Health Survey    54

             North Shore ZIP Codes by population, which illustrates the
Appendix C   proportion of the North Shore within each ZIP Code, and the proportion    55
             of each ZIP Code within the North Shore.

             Determination of categories included in Communicable Diseases
Appendix D   section, which lists the communicable diseases used in each category     56-57

                                           5
Methodology
In 2015, the Robert Wood Johnson Foundation and the RAND Corporation set out to create a national
framework to improve health, well-being, and equity in the United States. The Culture of Health Action
Framework is built on the premise that health and well-being are influenced by factors including the
communities where we live, work, go to school, and play. Local health departments play a large role in both
leading and supporting communities in their initiatives to becoming healthier places for everyone. A community
health assessment (CHA) is an important tool in determining how healthy a community is currently and what
issues need to be addressed to optimize health for all.

The CHA is both a process and a document that uses quantitative and qualitative methods to systematically
collect and analyze data to understand the health of a specific community. CHAs review data on health-
related risk factors, quality of life, morbidity, and mortality, along with information on community assets and
social and economic factors that influence health and quality of life. CHA data and information is used broadly
for community decision-making, prioritization of health problems, and the development, implementation, and
evaluation of community health improvement plans.

Wisconsin State Statute (Ch. 251.05) and Public Health Accreditation Board requirements call for local health
departments to conduct a comprehensive community health assessment at least every five years. Additionally,
since 1993, Wisconsin State Statutes have required health departments to lead the development of Community
Health Improvement Plans which address the priority community health issues based on CHA findings.
Our Process: The North Shore Community Health Assessment (NSCHA) was developed based on “Improving
the Health of Local Communities: The Wisconsin Way and the County Health Rankings and Roadmaps from
the University of Wisconsin-Madison School of
Public Health and Medicine and Robert Wood
Johnson. Both resources outline a comprehensive
approach to community health assessment and
community health improvement planning using a
Take Action Cycle (Figure 1). Key components of
the Take Action Cycle for community health
improvement include:

   •    Assess Needs and Resources: What data
        help us understand our community?
   •    Focus on What’s Important: What are the
        priority areas to address?
   •    Choose Effective Policies and Programs:
        Are there available strategies that have
        shown they work?
   •    Act on What’s Important: How do we fund
        and implement identified strategies?
   •    Evaluate Actions: How do we know if our
        strategies made a difference?
                                                           Figure 1: Community Health Improvement
                                                                       Take Action Cycle

                                                       6
The NSCHA specifically focuses on the Assess Needs & Resources components of the Take Action Cycle
(Figure 1). Activities of this stage include:
• Review County Health Rankings
• Identify community assets and resources
• Find existing local, county, and regional data based on measures from County Health Rankings and
Wisconsin Way
• Collect our own data
• Analyze data to move to action
• Share results with community
The NSCHA has three components to thoroughly assess health and quality of life in the North Shore (Figure
2). The first component is a Data Assessment. The Data Assessment is a review and analysis of North Shore,
Milwaukee County and Wisconsin data based on variables outlined in the County Health Rankings and
Wisconsin Way. The second part of the NSCHA is a Stakeholder Assessment. This assessment uses a
series of in-depth key informant interviews with North Shore leaders, residents, and community stakeholders.
The purpose of the Stakeholder Assessment is to go beyond the data to understand issues impacting health
and quality of life that may both be similar to or
different than the quantitative data. The interview
data helps us to understand issues critically North Shore Community Health Assessment
important to residents and leaders. This information
will help begin to identify what areas should to be
addressed later in the Community Health Improvement
Plan. The final component of the NSCHA is a Priority
Assessment. This assessment is a brief survey asking NS Community NS Community
residents their top five community health priorities. Health Health
Data Assessment: Stakeholder
Analysis of primary Assessment:
The remaining components of this report focus on and secondary Key Informant
data lth Interviews
results of the North Shore Community Health Data
Data Assessment:
Assessment. The Stakeholder Assessment and Priority
Assessment are reported in other documents which can
be found on the North Shore Health Department NS Community
Health
website (www.nshealthdept.org/CHA). Priority
Assessment:
Survey of residents
North Shore Community Health
Data Assessment Figure 2: Components of NSCHA
North Shore Health Department staff used the County
Health Rankings and the Wisconsin Way to determine the variables we would use to measure health and
quality of life in the North Shore. Both resources provide suggestions for variables that touch on a variety of
health factors or determinants impacting both length of life and quality of life. As seen in Figure 3, the first
health determinant is health behaviors, which account for 30% of health outcomes. The next determinant is
clinical care, including access to healthcare care services, which accounts for 20% of health outcomes.
Social and economic factors are responsible for the majority (40%) of health outcomes, and the physical
environment accounts for the remaining 10%. Sections in this report are organized into health outcomes
(mortality and morbidity), and factors that influence health outcomes (health behaviors, clinical care, social and
economic determinants, and the physical environment).
7Source: University of Wisconsin School of Medicine and Public Health
Figure 3: County Health Rankings Model
8Data Sources and Methods
The North Shore Community Health Data Assessment (NSCHDA) uses a variety of data sources, including
the North Shore Community Health Survey. The Community Health Survey is a telephone survey that has
been administered once every three years since 2003. It is commissioned by local hospitals in partnership with
the Center for Urban Population Health and the North Shore Health Department. The survey is conducted by
JKV Research, LLC and consists of a land or cell phone-based survey of approximately 400 North Shore
residents each survey year. Respondents are scientifically selected so the survey is representative of all adults
18 years old and older in the North Shore. More details about these data are included in Appendix B.
The NSCHDA also includes a review of other municipal, North Shore, county, and state level data systems.
Below is our approach to organizing the data geographically since not all data are available at a municipal or
North Shore-level.
Municipal Data: The NSCHDA presents information for the Villages of Bayside, Brown Deer, Fox
Point, River Hills, Shorewood, and Whitefish Bay and the City of Glendale when data are available.
The NSCHDA reports municipal-level data if the number of occurrences for a specific indicator are large
enough to not violate data privacy guidelines (usually greater than 5 occurrences per indicator).
North Shore Data: State and federal public health data reported for the North Shore may be available
by US Census Tract or ZIP Code. When available, Census Tracts are combined to report data for the
North Shore overall. North Shore area ZIP Codes include 53209, 53211, 53217, and 53223. ZIP Code
53217 includes only residents from North Shore communities. The other three ZIP Codes cross borders
and include residents from the City of Milwaukee. If data are reported by ZIP Code, we have combined
all four to report the information for the North Shore because these data serve as a better proxy for the
combined seven communities than using only those residents living in 53217. In addition, approximately
230 North Shore residents live in ZIP Code 53212, which accounts for less than 2% of 53212 residents.
Because this is such a small proportion, 53212 is not included in calculations of North Shore ZIP Code
data. See Appendix C for break-down of population by ZIP Code.
County Data: For many state and federal data sources, the smallest data level available is by county.
For data only available at this level, we report Milwaukee County data. Given the North Shore’s
proximity to Ozaukee County, we also include Ozaukee County data as a comparison in certain
circumstances.
State Data: In some cases, specifically the Youth Risk Behavior Survey, the number of local
respondents is not large enough to obtain valid estimations for the North Shore or Milwaukee County. In
that case, Wisconsin-wide data is used, and compared to National data.
Whenever comparable measures are available, local data is compared to State-wide data. When comparable
data was collected during different years at State and local levels, the dates are indicated. When no
comparable data was available at the State level, none is presented.
9Demographics
North Shore Community Overview: The North Shore Health Department serves the residents of the seven
communities of Bayside, Brown Deer, Fox Point, Glendale, River Hills, Shorewood, and Whitefish Bay with a
total population of 64,830 (Source: US Census, 2010). Of the seven communities, Whitefish Bay has the highest
population (14,122) and River Hills the lowest (1,472). The 21.75 square mile area of the North Shore area is
within Milwaukee County, located north and east of the City of Milwaukee.
Figure 4: Map of the North Shore communities of Bayside, Brown Deer, Fox Point, Glendale,
River Hills, Shorewood, and Whitefish Bay; Milwaukee County, Wisconsin
10North Shore Demographic Data: Table 1 shows the composition of the population of the North Shore Health
Department’s jurisdiction by age and community. As seen in Table 2, the North Shore is more racially diverse
than Wisconsin overall. Four percent of residents are Asian compared to only 3% in Wisconsin overall. Ten
percent of North Shore residents are Black or African American compared to 6% of Wisconsin residents. The
percent of residents with Hispanic ethnicity, however, is lower overall (4%) compared to the percent of
Hispanic Wisconsin residents (6%). As seen in Table, 3, the
predominant languages spoken in the North Shore are English,
Spanish, Russian and German. 17% of the population in the North
According to the US Census Bureau’s American Community Shore is over 65 years of age,
Survey, 2011-15), 10% of the North Shore population are compared to 15% state-wide.
foreign-born. The category of foreign-born residents includes
both non-citizens (immigrants) and people born outside of the Source: US Census Bureau,
American Community Survey, 2011-15
US who have become naturalized citizens. In Wisconsin, 5% of
residents are foreign-born.
Population Change
• The North Shore five-year population estimate from 2011 to 2015 is 65,092, an estimated 0.4%
increase from 2010 (262 people). In the same timeframe, the population of Wisconsin experienced an
estimated 1.8% increase (104,170 people).
Population Density
• Milwaukee County and the North Shore communities are urban areas, with 0.02% of the county defined
as rural compared to 29.9% in Wisconsin. The estimated population density of the North Shore is 2687
people per square mile, compared to 106 in Wisconsin.
Table 1: Population of Communities Served by the North Shore Health Department, 2011-15
Whitefish North Shore
Bayside Brown Deer Fox Point Glendale River Hills Shorewood
Age Bay Total
Group
# % # % # % # % # % # % # % # %
Children
989 22% 2,095 17% 1,359 20% 1,790 14% 248 17% 2,131 16% 3,560 25% 12,172 19%
(≤14)
Young
Adults 287 6% 1,220 10% 605 9% 1,760 14% 174 12% 1,623 12% 1,244 9% 6,913 11%
(15-24)
Middle
Adults 2,215 49% 6,703 55% 3,384 50% 6,545 51% 723 49% 7,680 58% 7,520 53% 34,770 53%
(25-64)
Older
Adults 999 22% 2,083 17% 1,361 20% 2,819 22% 327 22% 1,850 14% 1,798 13% 11,237 17%
(65+)
Total 4,490 12,101 6,709 12,914 1,472 13,284 14,122 65,092
Source: United States Census Bureau, American Community Survey, 2011-2015
Percentages may not add up to 100 due to rounding
11Table 2: Race & Ethnicity Population Estimates, North Shore and Wisconsin, 2011-15
Race or Ethnicity Percentage in North Shore Percentage in Wisconsin
American Indian or Alaskan NativeMortality
Mortality refers to the length of life, or more specifically the number of deaths by cause. In 2014, the leading
causes of death in the North Shore were cancer and heart disease. Heart disease has consistently been the
leading cause of death in the United States. The mortality burden of cancer, however, has surpassed that of
heart disease in several states. In 2000, there were only two states where cancer was the leading cause of
death; in 2014, there were 22, including Wisconsin.
Nationwide, the cancer death rate has declined steadily over the past two decades, falling 25% from the peak
in 1991 to 2014. Lung cancer is the leading cause of cancer deaths in the North Shore and Wisconsin. Lung,
colorectal, prostate and breast cancers account for approximately 46% of the total cancer deaths among men
and women in the US, and almost half of cancer deaths in the North Shore (Source: Cancer Statistics, 2017). Cancer
death rates are highest among residents 65 and older, accounting for 73% of all cancer deaths in Wisconsin.
Residents 65 years and older had 10 times the rate of cancer deaths as residents aged 25-64 (Source: WI
Department of Health Services, Division of Public Health, Office of Health Informatics, Annual WI Death Report, 2015).
Heart disease is responsible for approximately 20% of all deaths in Wisconsin and the North Shore. The
category “heart disease” covers disease of multiple anatomical parts of the heart, including the endocardium,
myocardium and pericardium, as well as the internal vessels of the heart, such as the coronaries that supply
blood to the heart. Heart disease deaths have declined roughly 14% in the last decade (Source: WI Department of
Health Services, Division of Public Health, Office of Health Informatics, Annual WI Death Report, 2015).
Table 4: Leading Causes of Death, North Shore and Wisconsin, 2014
North Shore Wisconsin
Cause of Death
Deaths Death rate death rate
(as recorded on death certificate)
(count) (per 100,000) (per 100,000)
Cancer 122 184.5 196.2
Heart disease 114 172.4 192.5
Unintentional injury 29 43.8 51.1
Cerebrovascular disease 28 42.3 42.9
Lower respiratory disease 28 42.3 47.7
Total deaths 524 792.3 871.8
Substance abuse* 77 116.4 179.3
*Deaths with any mention of alcohol, tobacco use, or other drugs on death certificate; a death with more than one of these causes
mentioned is counted for each one. For instance, a death that mentions both alcohol and tobacco would be counted twice
Sources: North Shore Public Health Profile, 2016; Wisconsin Public Health Profile, 2016
Unintentional injury-related deaths are the third leading cause of death in Wisconsin and the North Shore.
Unintentional injury-related death rates have increased 19% in the last decade. Injuries represent any harm or
damage done to the body resulting from an external force (physical or chemical), but do not include
psychological trauma. Falls, especially those among older adults, are one of the leading causes of injury-
related deaths in Milwaukee County and Wisconsin. Deaths attributable to poisonings from substances like
prescription opioids, heroin, and other drugs and from motor vehicle crashes are also leading causes of injury
deaths in Milwaukee County, including communities in the North Shore.
13Table 5: Fall-related Deaths, Milwaukee County and Wisconsin, 2015
Milwaukee County
Wisconsin death rate
Age Group Deaths Death rate
(per 100,000)
(count) (per 100,000)
65-69 6 15.0 14.4
70-74 8 31.0 36.3
75-79 15 78.3 82.2
80-84 40 256.7 185.2
85+ 117 623.3 591.6
Source: Wisconsin Interactive Statistics on Health (WISH), 2015
Figure 5: Drug-Related Death Rates per 100,000, North Shore, Milwaukee County, and
Wisconsin, 2007-15
Rate per 100,000 residents
*North Shore ZIP Codes are 53209, 53211, 53217, and 53223 and Over the past decade in the North
include data for North Shore and Milwaukee residents living in these ZIP Codes. Shore, drug overdose deaths
Source: Wisconsin Department of Health Services, 2016
involving prescription opioids
increased by 52%, and drug
overdose deaths involving heroin
Suicide is a public health issue that affects people of all ages, races, increased by almost 300%.
and ethnicities. In 2015, suicide was the tenth leading cause of death
in the US and in 2016 was the ninth leading cause of death in the Source: Wisconsin Department of Health
Services, 2016
North Shore. In the US, suicide is the second leading cause of death
for youth aged 10 to 14 years and the fifth leading cause of death for
adults aged 45 to 55 years. In the US in 2014, roughly half of all
suicide deaths were firearm suicides, and a quarter were by suffocation. Wisconsin’s suicide rate is four times
its homicide rate.
14Table 6: Suicide/Self-Inflicted Death Rate, Milwaukee County and Wisconsin, 2015
Milwaukee County
Wisconsin death rate
Age Group Death rate
Deaths (count) (per 100,000)
(per 100,000)
15-44 46 11.1 17.5
45-64 36 15.8 22.2
65+ 11 9.2 14.6
Source: Wisconsin Interactive Statistics on Health (WISH), 2015
Infant Mortality includes the death of a baby before his or her first birthday. The infant mortality rate is the
number of infant deaths that occur for every 1,000 live births. This rate is often used as an indicator to measure
the health and well-being of a community, because factors affecting the health of entire populations also
impact the mortality rate of infants. High rates of infant mortality indicate the existence of broader issues
pertaining to access to care, preventative health practices, socioeconomic conditions, and maternal and child
health. The infant mortality rate in the North Shore was 2.1 per 1000 live births between 2011-2015. This is
lower than the State of Wisconsin (5.9 per 1000), Milwaukee County (8.5 per 1000) and Ozaukee County (3.7
per 1,000) for the same time-period. The majority of infant deaths in the North Shore are the result of newborns
affected by perinatal complications, low birthweight or short gestation, or other congenital malformations. A
small number of deaths are attributable to Sudden Infant Death Syndrome (SIDS) (Source: Wisconsin Interactive
Statistics on Health (WISH), 2015).
15Morbidity
Morbidity refers to the impact on health caused by living with a disease, illness or injury. Some chronic
diseases impact a person for many years. At a community level, morbidity can be measured by the incidence
of a disease (which measures new diagnoses), or its prevalence (which counts all people who currently have
the disease—whether new or prior diagnoses).
I. Overall Indicators of Health
An individual’s self-reported quality of life status is an important indicator of health because quality of life can
positively or negatively impact daily activities, such as going to work or school, getting enough exercise, and
making healthy choices. In 2015, 11% of North Shore residents rated their health as “Fair or Poor” (Table 7).
This is a significant increase from the seven percent of residents who reported their health as “Fair or Poor” in
2003. Additionally, while approximately 30% of residents rated their health as “Excellent” between 2003 and
2012, in 2015, that percent had dropped to 21% (Source: North Shore Community Health Survey Summary Report, 2015).
Low birthweight (LBW) is unique as a health outcome because it represents multiple factors and has
numerous health associations and impacts. In terms of the infant’s health outcomes, LBW serves as a
predictor of premature mortality and/or morbidity over the life course. From the perspective of maternal health
outcomes, LBW indicates maternal exposure to health risks in all categories of health factors, including her
health behaviors, access to health care, the social and economic environment the mother inhabits, and
environmental risks to which she is exposed.
Table 7: Quality of Life Indicators, North Shore and Wisconsin, 2015
North Shore Wisconsin
Fair or Poor Health Status (Self-reported percentage) 11% 16%*
Low Birthweight (Infants weighingmost common mental illness, affecting over a quarter of the US adult population. While positive mental health
can improve physical health, it is also true that mental illness can arise due to diagnosis of chronic diseases
including cancer, cardiovascular disease, and obesity. In 2015, 14% of North Shore residents reported having
a mental health condition in the past three years compared to 18% of residents in Milwaukee County overall
(Sources: North Shore Community Health Survey, 2015; Milwaukee County Community Health Survey, 2015).
II. Chronic Disease
Chronic diseases such as cancer, diabetes, cardiovascular disease, and respiratory conditions are significant
contributors to premature mortality. Additionally, when not well-managed, chronic diseases can cause pain,
disability, financial hardship, and overall lower quality of life. Many chronic diseases can often be prevented
through healthy diet, physical activity, and eliminating tobacco use and substance abuse. Once a chronic
disease has manifested, effective management can prevent more serious complications and premature death.
Chronic disease can be measured in several ways. One is by assessing the number of cases of a given
disease or by reports by emergency departments and hospital inpatient admissions for certain conditions.
Hospitalizations due to certain chronic diseases are an indicator of barriers to effective self-management of the
disease. In North Shore ZIP Codes in 2014, the rate of total hospitalizations for all conditions was 113.2 per
1,000 compared to a rate of 104.1 per 1,000 for all Wisconsin residents (Source: Public Health Profiles, 2016).
Chronic disease incidence and management data can also be self-reported. Individuals can live well with most
chronic diseases if those diseases are effectively self-managed through treatment adherence, healthy lifestyle,
and behaviors.
Cancer: The crude incidence rate for prostate and female breast cancer in the North Shore exceeds rates in
Milwaukee and Ozaukee Counties and in Wisconsin. Though lung and colorectal cancer rates are lower in the
North Shore, the total rate of cancer incidence in the North Shore exceeds that in Milwaukee County and in
Wisconsin. For many cancer types, the risk of developing the disease rises with age, and the North Shore
population has a higher percent of the population over age 65 than in the rest of Wisconsin. Additionally, the
Wisconsin Cancer Reporting System receives incidence data submitted by hospitals, clinics, and physicians.
Incidence data therefore depends on a patient being seen (and diagnosed) by a provider. The North Shore has
a slightly higher insured population than Wisconsin (Table 29), which may translate into more diagnoses.
Table 8: Cancer Incidence, North Shore and Wisconsin, 2013
North Shore ZIP Codes1 Wisconsin
Invasive Cancer type Cases Incidence Rate Incidence Rate
(count) (per 100,000) (per 100,000)
Female breast2 71 207.7 154.5
Prostate2 55 179.9 124.1
Lung/bronchus 35 54.1 70.9
Colorectal 23 35.5 43.1
All other sites 195 301.1 281.2
Total 379 585.3 534.6
1North Shore data includes all residents of 53209, 53211, 53217 and 53223, including some Milwaukee residents who share ZIP Codes
53209, 53211, and 53223.
2Rates include cases per 100,000 sex-specific population
Source: Wisconsin Public Health Profiles, 2016, reported to WI Cancer Reporting System; 2013 cases
17Early and ongoing health screenings for certain cancers lead to early identification and treatment before health
deteriorates. Women in the North Shore report a high percent of cervical cancer screening compared to
women in Wisconsin. Among North Shore residents over 50 years, about three-fourths of North Shore
residents report having been screened for colorectal cancer, similar to the percent of Wisconsin residents.
Table 9: Self-Reported Screening for Certain Cancers, North Shore and Wisconsin, 2015
Screening North Shore Wisconsin
Cervical Cancer Screening of women aged 18 years and above
PAP Smear 92%1 85%1
HPV Test 52% -
Mammogram of women aged 50 years and above, within past 3 years 89% 82%2
Colorectal Cancer Screening of the population aged 50 years and above
76%1 75%1
who had ever had a colonoscopy or sigmoidoscopy
12012,2014, 2016 data
22012data
Source: North Shore Community Health Survey, 2015; Wisconsin Behavioral Risk Factor Surveillance System, 2012-16
Cardiovascular Disease includes several types of diseases of the heart and blood vessels, including coronary
artery disease (CAD) and hypertensive heart disease. Cardiovascular diseases lead to premature death, costly
hospitalizations, and potentially long-term disability. In 2015, 11% of North Shore residents reported that they
had heart disease or a heart condition within the past three years. This is an increase from 2003 when 7% of
residents reported having heart disease.
High blood pressure and high blood cholesterol are two risk factors for cardiovascular disease. Over 80% of
North Shore residents reported they had their blood cholesterol checked within the past five years. This is
slightly higher than Wisconsin residents overall (77%). Twenty-six percent of residents reported they had high
blood cholesterol within the previous three years and 24% of residents reported having high blood pressure.
State-level data report that 30% of Wisconsin residents report being told they have high blood pressure.
Despite the high prevalence of cardiovascular disease in the North Shore, 98% of residents reported in 2015
they manage their blood pressure with medications and lifestyle changes. In 2015, 95% of North Shore
residents with high blood cholesterol said that it was controlled—an increase from 88% in 2012 (Source: North
Shore Community Health Survey, 2015).
Cerebrovascular Disease refers to a group of conditions that can lead to a cerebrovascular event, such as a
stroke. These events affect the blood supply to the brain. If a blockage, malformation or hemorrhage prevents
the brain cells from getting enough oxygen, brain damage can result. Cerebrovascular disease is usually
caused by atherosclerosis (“hardening of the arteries”) or deep vein thrombosis (blood clots) and can lead to a
stroke. Stroke risk increases with age, but strokes can occur at any age. High blood pressure, high cholesterol,
smoking, obesity, and diabetes are leading contributing causes of stroke. One in three US adults has at least
one of these conditions or habits. Although a stroke is the most common cerebrovascular event, transient
ischemic attacks (“mini strokes”), aneurisms, and vascular malformations are also types of cerebrovascular
disease. In the North Shore in 2014, there was a higher rate of hospitalizations due to cerebrovascular disease
(280 per 100,000) than for cardiovascular disease (232 per 100,000). The opposite was true for Wisconsin
(246 vs. 281 per 100,000; Table 10).
18Diabetes is a chronic and long-lasting disease affecting millions of people. The CDC reports approximately
one in every ten people have diabetes and one out of three adults have pre-diabetes. People with diabetes are
at higher risk of health complications including blindness, kidney failure, heart disease, stroke, and loss of toes,
feet, or legs. In the North Shore in 2003, 4% of residents report they had diabetes within the previous three
years. By 2015, 11% of residents reported having the disease within the previous three years (Source: North
Shore Community Health Survey, 2015). Ten percent of WI residents report they were told by a doctor that they had
diabetes (Source: Behavioral Risk Factor Surveillance System, 2016). Table 10 shows that in 2014, residents living in
North Shore ZIP Codes had a slightly higher rate of diabetes-related hospitalizations (161 per 100,000)
compared to WI overall (132 per 100,000) (Source: Wisconsin Public Health Profiles, 2016).
Asthma is a disease that affects the lungs. For many, it can be a lifelong chronic disease leading to premature
death, costly emergency department visits and hospitalizations, missed days of work and school, and reduced
quality of life. Nine percent of North Shore
adult residents reported in 2015 they had Fewer than one in ten North Shore adult residents report
asthma within the previous three years. This having asthma, and all who have asthma report that it is
is slightly lower than in 2012 when 11% of controlled by medication and lifestyle changes. However,
residents reported having the disease. In
high asthma hospitalization numbers--double the State
2015, 100% of adult residents with asthma
rate--could indicate inadequate management,
also reported it was being controlled with
medication and lifestyle changes. The
specifically in children with asthma (Table 10).
percent of adults with asthma in the North
Source: North Shore Community Health Survey, 2015; North Shore Public
Shore are similar to the reported prevalence
Health Profiles, 2016; Wisconsin Public Health Profiles, 2016
in Wisconsin overall.
Residents living in North Shore ZIP Codes have double the rate of asthma-related hospitalizations compared
to Wisconsin overall. The hospitalization rate is 180 per 100,000 residents compared to 90 per 100,000 (Table
10). This is slightly lower than Milwaukee County’s rate of 210 but higher than Ozaukee County’s rate of 90 per
100,000. Hospitalization data includes children and adults.
Table 10: Chronic Disease-related Hospitalizations, North Shore and Wisconsin, 2014
North Shore ZIP Codes*
Wisconsin
Cause of hospitalization Hospitalization Hospitalization Rate
Hospitalizations
Rate (per 100,000)
(number)
(per 100,000)
Cardiovascular disease/
326 232 281
coronary heart disease
Cerebrovascular disease 393 280 246
Diabetes 226 161 132
Asthma 253 180 90
Total hospitalizations 15,958 11,338 10,415
*Data includes all hospitalizations to residents of 53209, 53211, 53217 and 53223, including some residents of Milwaukee who share
ZIP Codes 53209, 53211, and 53223.
Sources: North Shore Public Health Profiles, 2016; Wisconsin Public Health Profiles, 2016
19Breastfeeding as Prevention
Breastfeeding has been shown to decrease the incidence of multiple chronic diseases and risk
factors. This includes those in the infant (Celiac disease, inflammatory bowel disease, asthma,
childhood leukemia, obesity, and Type 1 and 2 diabetes), and in the mother (postpartum
depression, Type 2 diabetes, rheumatoid arthritis, cardiovascular disease, breast and ovarian
cancer). Communities also benefit with decreased healthcare and hospitalization costs,
decreased parental absenteeism from work, and a reduction in the environmental burden from
production, packaging and transportation costs of infant formula.
In the North Shore in 2016, upon discharge from the hospital, 93% of mothers
were breastfeeding. This is higher than the rate in Milwaukee County (74%)
and the State of Wisconsin (82%).
Source: Wisconsin Department of Health Services Wisconsin Interactive Statistics on Health (WISH), 2018
III. Communicable Disease
Communicable diseases are also known as infectious diseases. Communicable diseases are caused by a
viral, bacterial, parasitic or fungal pathogen which is passed from one human to another. Reduction in
infectious disease mortality has increased life expectancy in the 20th century—largely due to immunizations. In
2012, the World Health Organization estimated that vaccination prevents 2.5 million deaths worldwide each
year. Four diseases are responsible for 98% of those deaths: measles, Haemophilus influenzae type
b, pertussis, and neonatal tetanus. Despite the advancements in immunization, infectious disease remains a
major cause of disability, pain, and death. Furthermore, incorrect information about vaccine safety has resulted
in geographical areas of low vaccination rates, resulting in outbreaks of measles, mumps and pertussis.
Table 11: Communicable Disease Cases*, North Shore and Wisconsin, 2014-16 3-year Totals
North Shore Wisconsin rate
Type of Disease Cases Rate (per 100,000)
(count) (per 100,000)
Vaccine-preventable Diseases
Hepatitis A & B 23 12 8
Influenza hospitalizations 137 70 47
Meningitis, Aseptic (viral) 0 0Table 11, continued
North Shore
Wisconsin rate
Type of Disease Cases Rate
(per 100,000)
(count) (per 100,000)
Vector-borne Diseases
Vector, Mosquito (West Nile, Zika, etc.) 0 0 1
Vector, Tick (Lyme) 14 7 46
Foodborne and Waterborne Diseases
Campylobacteriosis 32 17 25
Cryptosporidium 8 4 12
E. coli 5 3 4
Giardia 17 9 10
Salmonella 18 9 16
Shigella 15 8 8
Other Water/Foodborne 5 3 4
Other Communicable Diseases
Hepatitis C + non-vaccine preventable 62 32 64
Streptococcal 27 14 21
TuberculosisTable 12: Sexually Transmitted Infections (STIs), North Shore and Wisconsin, 2014-16
Three-year Totals
North Shore
Wisconsin rate
Cases Rate (per 100,000)
(count) (per 100,000)
Sexually Transmitted Infections* 686 352 551
Chlamydia 565 291 443
Gonorrhea 101 52 95
*STI counts include Chlamydia, Gonorrhea, and others, as listed in Appendix D
Sources: Wisconsin Department of Health Services, STD Control Section, 2016; Wisconsin Electronic Disease Surveillance System,
2017
Figure 6: Reported STI Infection Rates by Age, North Shore and Wisconsin, 2016
3500
Rate per 100,000 Population
3000
North Shore
2500
Wisconsin
2000
1500
1000
500
0
10-14 15-19 20-24 25-29 30-34 36-39 40-44 45-49 50+
Age Group in Years
Source: Wisconsin Electronic Disease Surveillance System, 2017
Vaccination to Prevent Communicable Diseases
Overall, the North Shore has a highly-immunized
population. The majority of 24-month-old children in For the 2016-17 flu season, 59% of adults 65
the North Shore have received the recommended and older in the North Shore communities
vaccinations for this age, with all benchmark received an influenza (flu) vaccination,
percentages exceeding the State’s levels (Table 10).
compared to 65% in Ozaukee County, 57%
Flu immunization rates among adults 65 and older in in Wisconsin, and 52% in the US.
the North Shore are similar to those in Wisconsin, but
Source: Medicare Claims Data, National Vaccine Program,
lower than in Ozaukee County, and well below CDC Office of US Department of Health & Human Services,
recommendations. CDC recommends all people over 2017
the age of 6 months receive a seasonal influenza
vaccination, but emphasizes that older adults and
their caregivers are considered high risk groups. The North Shore* has one and a half times the hospitalization
rate due to influenza as Wisconsin (Table 11). Adults 65 years of age and older typically account for up to 70%
of flu-related hospitalizations each year and up to 85% of flu-related deaths. The North Shore has a higher
percent of the population over age 65 than in the rest of Wisconsin (page 11), which contributes to this rate
(Source: Medicare Claims Data, National Vaccine Program Office of US Department of Health & Human Services, 2017; *North shore
data includes all residents of 53209, 53211, 53217 and 53223, including some residents of Milwaukee who share ZIP Codes 53209,
53211, and 53223).
22Table 13: Childhood Immunization Rates, North Shore and Wisconsin, 2016
% of 24-Month-Old Children
Recommended Vaccination Meeting Benchmark in 2016
North Shore Wisconsin
DTap (Diptheria, Tetanus, Pertussis) x4 81% 78%
Polio x3 91% 87%
MMR (Measles, Mumps, Rubella) x1 92% 86%
Hib (Haemophilus influenzae type b) x3 92% 87%
Hep B (Hepatitis B) x3 88% 86%
Varicella (Chicken Pox) x1 90% 84%
Pneumonia/ PCV13 (Pneumococcal Conjugate Vaccine) x4 88% 84%
4:3:1:3:3:1:4 series (all listed above) 76% 73%
Source: Wisconsin Immunization Registry, 2017
IV. Unintentional and Intentional Injuries
Nonfatal injuries are a leading cause of disability for people of all ages. Though injuries are often thought of as
“accidents” or “acts of fate,” most are predictable and preventable. Unintentional injuries result from falls,
poisonings, motor vehicle crashes, concussions, drowning, bicycle crashes, and fires, etc. Intentional injuries
and violence include self-inflicted injuries, along with child abuse, sexual violence, intimate partner and dating
violence.
Rates of injury-related hospitalizations are higher in Milwaukee County than Wisconsin for all of the top five
causes of injury-related hospitalizations (Table 14). Poisonings can result from prescription and illicit drug use,
as well as toxic substances like carbon monoxide, pesticides, solvents, etc. Other injuries may include those
arising from overexertion, fire, drowning, suffocation, firearm, machinery or other transport injuries.
Table 14: Top Injury-related Hospitalizations, Milwaukee County and Wisconsin, 2014
Emergency Department Visits Hospitalization
Rate per 100,000 Rate per 100,000
Milwaukee Milwaukee
County Wisconsin Wisconsin
County
Falls 2500 2258 519 436
Poisoning 344 203 170 125
Cutting or Piercing 644 622 46 30
Struck By or Against Object or Person 1334 1024 46 27
Motor Vehicle Traffic Crash-Occupant 1021 519 37 36
Other Injury 2582 2086 371 275
Source: Wisconsin Interactive Statistics on Health, 2017
23Motor vehicle injuries are the leading cause of death for people ages 5-34 in the United States, and motor
vehicle-related injuries send more than 2.3 million people to hospital emergency departments every year.
Despite continual improvements to safety features, including seat belts, air bags, and child safety seats, motor
vehicle crashes remain a primary source of morbidity. In the North Shore in 2016, there was one crash for
every four miles of roadway. Additionally, 456 people were injured on North Shore roadways in 2016 and five
people were killed. Five percent of all crashes on North Shore roadways involved alcohol and all fatal crashes
involved alcohol. In 2016, eight motor vehicle crashes involved pedestrians and 19 involved bicycles (Table
15).
Table 15: Motor Vehicle Crashes in North Shore by Municipality, 2016
Total Miles of Crashes per Alcohol- Total Total
Municipality Crashes roadway roadway related Persons Persons
miles Crashes Injured Killed
Fox Point 31 38.7 .8Self-Inflicted Injuries: Self-inflicted injuries can be the result of poisonings, firearms, cutting or piercing, or
suffocation. Data for the North Shore are limited in this area. In reviewing emergency department visits and
inpatient hospitalizations for self-inflicted causes of injury between 2010 and 2014, poisoning and cutting or
piercing are the most common causes of self-inflicted injuries in the North Shore. Only three hospitalizations or
emergency department visits in that time frame resulted from a self-inflicted gunshot wound. This is likely
because of the higher likelihood of fatality with a firearm.
Table 16: Self-Inflicted Injuries: Emergency Department and Inpatient Hospitalizations, North
Shore and Wisconsin, 2010-2014
Emergency Department Visits Hospitalization
Rate per 100,000 Rate per 100,000
Self-Inflicted Injury North Shore North Shore
ZIP Codes* Wisconsin Wisconsin
ZIP Codes*
Poisoning 64 32 50 71
Cutting/Piercing 18 19 13 18
Suffocation 3 2 - 2
*North Shore data includes all residents of 53209, 53211, 53217 and 53223, including some Milwaukee residents who share ZIP Codes
53209, 53211, and 53223.
Source: Wisconsin Hospital Emergency Department and Inpatient Data Systems, 2016; Wisconsin Interactive Statistics on Health, 2017
25Health Behaviors
Health is more than access to health care. Health is also largely influenced by choices made. Personal
behaviors that can affect chronic disease and injuries include lack of physical activity, poor nutrition, tobacco
use, excessive alcohol consumption, and drug use.
I. Physical Activity and Nutrition
Current behaviors are determinants of future health. Body weight higher than what is considered a healthy
weight for a given height is described as overweight or obese. Body Mass Index (BMI) is calculated by weight
and height and is used as a screening tool for overweight or obesity. As BMI increases beyond 25, it appears
to be strongly correlated with various adverse health outcomes (Source: Centers for Disease Control and Prevention).
Inactivity causes 11% of premature deaths in the United States (Source: Lancet Physical Activity Series Working Group,
2012). Regular physical activity improves quality of life and lowers the risk of chronic disease.
In Milwaukee County in 2014, 99% of the county population had reasonable access to exercise
opportunities, compared to 81% of Wisconsin. “Reasonable access” is defined as residing within one mile of
a recreational facility or residing in a census block within a half mile of a park. In Milwaukee County in 2012,
there were 78 recreation and fitness facilities for county residents—an increase of over 25% since 2007
(Source: County Health Rankings, 2017).
Walkscore.com calculates a Walk Score between 0-100 and a Within the seven North Shore
walkability ranking for any given address. Within the North Shore, communities, there are 23 local
elementary school walk scores ranged from 29 (car-dependent)
parks and over 135 acres of public
at Maple Dale School, to 78 (very walkable) for the Shorewood
outdoor recreation space.
School District.
Table 17: Self-reported Indicators of Adult Physical Health, North Shore and Wisconsin
North Shore 2015 Wisconsin 2016
Overweight adults (BMI greater or equal to 25.0) 55% 60%
Recommended moderate (5 times/30 min) or
56% -
vigorous (3 times/20 min) physical activity weekly
Sources: North Shore Community Health Survey, 2015; Behavioral Risk Factor Surveillance System, 2016
Good nutrition correlates with good health and is especially important to children’s growth and development.
A healthy diet and weight also helps individuals reduce their risk for many chronic diseases. Communities that
facilitate healthy diets and food security provide access to retail venues that sell affordable healthy options.
Although adult fruit and vegetable intake in the North Shore has remained roughly steady since 2012, the
reported percent of children meeting recommended vegetable intake dropped from 45% to 36% in the same
period. This parallels findings at the national level, where fruit intake is increasing while vegetable intake is not.
Furthermore, children are not “eating the rainbow” and approximately one third of vegetables eaten by children
are potatoes, often eaten as fries or potato chips (Source: Centers for Disease Control and Prevention, 2017).
26Table 18: Self-reported Nutritional Intake, North Shore and Milwaukee County, 2015
North Shore Milwaukee County
Adults Children Adults Children
Fruit intake (2+ servings/day) 68% 90% 62% 82%
Vegetable intake (3+ servings/day) 36% 36% 28% 27%
Sources: North Shore Community Health Survey, 2015; Milwaukee County Community Health Survey, 2015
Seasonally, North Shore residents have access to an abundance of fresh produce.
From 2009 to 2013, there was a 47% increase in Farmers’ Markets in Milwaukee
County. As of 2017, there are four Farmers’ Markets within the North Shore, with
an additional 19 in Milwaukee County, and seven in nearby Ozaukee County.
Source: UW-Extension, 2017
II. Alcohol
Excessive alcohol consumption includes binge drinking, heavy drinking, and any drinking by pregnant women or
people younger than age 21. It can lead to several immediate health risks including unintentional injuries (traffic
injuries, falls, drownings), domestic violence, risky sexual behaviors, poor birth outcomes and alcohol
poisoning. Over time, in addition to the potential of developing alcoholism, continued excessive alcohol
consumption can lead to the development of chronic diseases including high blood pressure, heart disease,
stroke, liver disease, digestive problems, and several cancers (breast, mouth, throat, esophagus, liver and
colon). It can also cause neurological (memory and learning) impairment, including dementia and poor school
performance; lead to mental health problems like depression and anxiety; and increase social and economic
problems including lost productivity, family problems, and unemployment.
The state of Wisconsin has the highest population nationwide of binge drinkers, who report having as many as
9 drinks on an occasion, and averaging approximately 5 episodes of binge drinking a month. Nationally, 17%
of adults report binge drinking in the previous 30 days.
Figure 8: Percent of Adults Self-Reporting Binge Drinking* in the Last 30 Days, North Shore
and Wisconsin, 2003-15
27%
24% 24% 24% 25% 24%
15%
North Shore
11% Wisconsin
10%
2003 2006 2009 2012 2015
*defined as ≥4 drinks per occasion for females; ≥5 drinks per occasion for males
Source: North Shore Community Health Survey, 2015; Behavioral Risk Factor Surveillance System, 2015
27Table 19: Alcohol-related Hospitalizations, North Shore ZIP Codes and Wisconsin, 2014
Number of Alcohol-related Hospitalizations Alcohol-related Hospitalization rate (per 100,000)
in North Shore ZIP Codes* North Shore ZIP Codes* Wisconsin
227 161 182
*North Shore data includes all residents of 53209, 53211, 53217 and 53223, including some Milwaukee residents who share ZIP Codes
53209, 53211, and 53223.
Sources: North Shore Public Health Profiles, 2016; Wisconsin Public Health Profiles, 2016
A Note About Youth Risk Behavior Survey Data
The Wisconsin Department of Public Instruction (DPI) has administered the Wisconsin Youth Risk
Behavior Survey (YRBS) to a sample of students in Wisconsin's public high schools every two years
since 1993. These results provide an estimate of risky youth behavior state-wide and can be compared
to results from other states and the nation as a whole. Youth behavior data is an important component
of a community health assessment because behavioral patterns established during adolescence help
determine young peoples’ current health status and their risk for developing chronic diseases during
adulthood. While Wisconsin data is available from 2017, the most recent national data available is from
2015, so it is used for comparison. Because YRBS data is not available from all North Shore school
districts, state-wide data is presented here.
Table 20: Youth Alcohol Use, High School Students, Wisconsin and USA, 2017 and 2015
YRBS Measure Wisconsin1 USA2
Percentage of students who had at least one drink of alcohol on one or more days 65% 63%
during their life
Percentage of students who had their first drink of alcohol other than a few sips 16% 17%
before age 13 years
Percentage of students who had at least one drink of alcohol on one or more of the 30% 33%
past 30 days
Percentage of students who had five or more drinks of alcohol in a row, that is, within 16% 18%
a couple of hours, on one or more of the past 30 days
Percentage of students who rode one or more times during the past 30 days in a car 17% 20%
or other vehicle driven by someone who had been drinking alcohol
1Source:2017 Wisconsin Youth Risk Behavioral Survey, Wisconsin Department of Public Instruction, 2017
2 Source: 2015National Youth Risk Behavioral Surveillance System, Centers for Disease Control and Prevention, Division of
Adolescent and School Health, 2017
III. Substance Abuse
Substance abuse has a major impact on the social, physical, and emotional health of individuals, families, and
communities. Substance abuse disorder typically develops in adolescence and, for some individuals,
progresses to a chronic illness that will require lifelong monitoring and care. The consequences of addiction
can lead to other physical and emotional conditions including forms of violence and injury.
28Marijuana (cannabis) is the most commonly used illicit substance. This drug impairs short-term memory and
learning, the ability to focus, coordination, and can harm the lungs. Research suggests that when regular
marijuana use begins in the teen years, addiction is more likely (1 in 6 users, compared to 1 in 9 among those
who began using as adults). While reported use by youth of all illicit substances decreased over the past
decade, rates of nonmedical use of prescription and over-the-counter medication remained high. This practice
can lead to addiction, and in some cases, overdose (Source: National Institute on Drug Abuse, National Institutes of Health).
Table 21: Drug-related hospitalizations, North Shore ZIP Codes and Wisconsin, 2014
Number of Drug-related Hospitalizations in Drug-related Hospitalization rate (per 100,000)
North Shore ZIP Codes* North Shore ZIP Codes* Wisconsin
84 60 62
*North Shore data includes all residents of 53209, 53211, 53217 and 53223, including some Milwaukee residents who share ZIP Codes
53209, 53211, and 53223.
Sources: North Shore Public Health Profiles, 2016; Wisconsin Public Health Profiles, 2016
Table 22: Youth Drug Use, High School Students, Wisconsin and USA, 2017 and 2015
YRBS Measure Wisconsin1 USA2
Percentage of students who used marijuana one or more times during their life 30% 39%
Percentage of students who tried marijuana for the first time before age 13 years 5% 8%
Percentage of students who used marijuana one or more times during the past 30 16% 22%
days
Percentage of students who used any form of cocaine, including powder, crack, or 4% 5%
freebase one or more times during their life
Percentage of students who sniffed glue, breathed the contents of aerosol spray cans, 6% 7%
or inhaled any paints or sprays to get high one or more times during their life
Percentage of students who have taken a prescription drug (such as OxyContin, 11% 17%
Percocet, Vicodin, codeine, Adderall, Ritalin, or Xanax) without a doctor's prescription
one or more times during their life
Percentage of students who were offered, sold, or given an illegal drug by someone 18% 22%
on school property during the past 12 months
1Source:2017 Wisconsin Youth Risk Behavioral Survey, Wisconsin Department of Public Instruction, 2017
2 Source: 2015National Youth Risk Behavioral Surveillance System, Centers for Disease Control and Prevention, Division of
Adolescent and School Health, 2017
IV. Tobacco
Cigarette smoking remains the leading preventable cause of death in the US, accounting for nearly one in five
deaths. Cigarette smoking harms nearly every organ of the body, causes many diseases, and reduces the
health of smokers in general. Cigarette smoking increases risk for death from all causes in men and women.
Smoking during pregnancy causes additional health problems, including premature birth, certain birth defects,
and infant death. Electronic cigarettes (e-cigs) can contain harmful and potentially harmful substances,
including nicotine, heavy metals like lead, volatile organic compounds, and cancer-causing agents, and
therefore have similar health risks. Of adult North Shore residents surveyed in 2015, 4% reported using
electronic cigarettes (e-cigs), compared to 6% in Milwaukee County (Sources: North Shore Community Health Survey,
2015; Milwaukee County Community Health Survey, 2015).
29You can also read