COMMUNITY ACTION WAYNE/MEDINA - Community Needs Assessment 2020-2022 - SEPTEMBER 1, 2020 - Community ...
←
→
Page content transcription
If your browser does not render page correctly, please read the page content below
COMMUNITY ACTION
  WAYNE/MEDINA
Community Needs Assessment 2020-2022

              SEPTEMBER 1, 2020
        COMMUNITY ACTION WAYNE/MEDINA
       905 Pittsburgh Ave., Wooster, OH 44691

                          1
Contents
EXECUTIVE SUMMARY......................................................................................................................................... 4
 Agency Background ............................................................................................................................................. 4
 Needs Assessment Framework ........................................................................................................................... 4
 Summary of Findings ....................................................................................................................................... 5
OBJECTIVES ........................................................................................................................................................... 6
METHODOLOGY ................................................................................................................................................... 6
  Surveys ................................................................................................................................................................. 6
  Focus Groups ....................................................................................................................................................... 7
  Stakeholder Interviews ....................................................................................................................................... 7
  Program Participant Interviews .......................................................................................................................... 7
DEMOGRAPHICS .................................................................................................................................................. 8
 Poverty Level ....................................................................................................................................................... 8
 Median Income.................................................................................................................................................... 8
 Racial Diversity .................................................................................................................................................... 9
 Gender ................................................................................................................................................................. 9
 Household Type ................................................................................................................................................... 9
 Educational Attainment ....................................................................................................................................11
 General Population Characteristics ..................................................................................................................11
DATA ANALYSIS AND KEY FINDINGS ............................................................................................................14
   Poverty...............................................................................................................................................................14
     KEY FINDING: ..............................................................................................................................................20
   Housing ..............................................................................................................................................................20
     KEY FINDING: ..............................................................................................................................................25
   Food Insecurity ..................................................................................................................................................25
     KEY FINDING: ..............................................................................................................................................28
   Transportation ...................................................................................................................................................28
     KEY FINDING: ..............................................................................................................................................30
   Child Welfare and Early Childhood Education and Care ..................................................................................30
     KEY FINDING: ..............................................................................................................................................33
   Health ................................................................................................................................................................33
     KEY FINDING: ..............................................................................................................................................41
   Aging and Disability ...........................................................................................................................................41
     KEY FINDING: ..............................................................................................................................................42
   Access to Technology ........................................................................................................................................43
     KEY FINDING: ..............................................................................................................................................44
SUMMARY ............................................................................................................................................................44
APPENDIX: ...........................................................................................................................................................46
   A.          COMMUNITY INPUT PARTICIPANTS ................................................................................................46
                                                                                        2
B. SOURCES OF DATA ................................................................................................................................46
C. COLLABORATORS ..............................................................................................................................47
D. SURVEY RESULTS......................................................................................................................................49
3COMMUNITY NEEDS ASSESSMENT 2020-2022
EXECUTIVE SUMMARY
Agency Background
Community Action Wayne/Medina (CAW/M) formed in 1966 as part of the anti-poverty
movement supported by President Lyndon B. Johnson. President Johnson signed the Economic
Opportunity Act (EOA), creating a variety of programs including Community Action Agencies – as
part of his War on Poverty. CAW/M was one of the agencies established to address local poverty
issues in communities across the country. Additional EOA programs were created to address other
causes and effects of poverty and to resolve poverty impacts. These programs included the Head
Start program. Head Start was created to narrow the education achievement gap poverty can
create by using a two-generational approach to supporting family education and early childhood
development through a holistic family approach.
Although funding and programs have changed over the years, including the elimination of the
Office of Economic Opportunity and the corresponding formation of the Community Services
Block Grant, CAW/M continues its work to alleviate poverty in its service area through these core
principles:
- Recognize the complexity of the issues of poverty
- Build local solutions specific to local needs
- Support family stability as a foundation for economic security
- Pursue positive individual, family and community level change
- Maximize involvement of people with low incomes
- Engage local community partners and citizens in solutions
- Leverage state, federal and community resources
- Advocate for systemic change
CAW/M currently serves Wayne and Medina Counties through three office locations: Wooster,
Rittman and Medina. Additionally, outreach locations are often identified throughout both
counties in order to facilitate residents’ access to services. Four Head Start centers are located in
each county with centers in Wooster, Rittman, Orrville and West Salem in Wayne County and in
Medina, Brunswick, Wadsworth and Chatham in Medina County.
Needs Assessment Framework
Community Action Agency services are designed to address local community needs through a
wide range of programs and activities which are tailored to each specific community served by a
particular agency. These needs are determined through a community needs assessment (which
is conducted a minimum of every three years) of the low-income population to ensure that the
agency has a pulse on those needs, emerging trends and where service gaps occur.
4This Community Needs Assessment was conducted March through August 2020 by CAW/M staff
through the assistance of Board members and community members. The purpose of this
assessment was to ascertain current and emerging needs as identified by Board members,
stakeholders, other service providers and, most importantly CAW/M program participants in
order to direct future program and funding priorities. Although planning for this assessment
created a reasonable framework for data collection, the initiation of action coincided with the
COVID-19 pandemic, resulting in the cancelling of meetings and focus groups and necessitating a
revised and modified plan of action as discussed in the methodology section. The result is still a
comprehensive view of causes and conditions of poverty in Wayne and Medina Counties and the
effects on its residents.
Methodology
As CAW/M serves both Medina and Wayne Counties, data was collected specific to each county.
Quantitative data was gathered from numerous national, state and local organizations and
resources and data are cited and documented throughout. The more time-consuming aspect of
data collection occurred through direct contact with individuals. A mass survey was distributed
to community members, low-income residents served by CAW/M, and other organizations. In
addition, focus groups and stakeholder meetings were cancelled and replaced with individual
interviews with stakeholders and program participants. Focus groups were still held with a group
of Getting Ahead students in Wayne County and a Veterans group in Medina County.
Summary of Findings
Key findings are noted in each section with affordable housing, food and mental health services
surfacing as most needed services in both counties. Transportation continues to be reported as a
major community need in Wayne County as well as support and communication with senior
citizens. Additional workforce development supports to complement the current workforce
development services that are in place were also cited as needs in Medina County. Mental health
and substance abuse (both COVID and nonCOVID related) were cited as issues in both counties.
Lower incidence of poverty in Medina County and more robust funding of transportation and
senior services allowed for significantly more resources for residents of Medina County. Lack of
access to living wage jobs, benefits cliff, issues of generational poverty and the limitations of fixed
incomes continue to impact low-income families as does the ongoing harsh impacts of the opioid
epidemic. These concerns were similar across both counties. The COVID-19 pandemic
exacerbated many impacts of poverty.
5OBJECTIVES
As directed by federal legislation, Community Action Wayne/Medina (CAW/M) conducts an in-
depth assessment of its target population (low-income) every three years and updates
information annually. These assessment activities are required by law for every Community Action
Agency. As a Community Action Agency, CAW/M uses the survey results to inform its strategic
planning process and development of funding opportunities for maintaining existing and creating
new services to address the needs of the low-income populations of Wayne and Medina Counties.
In addition, data and information allow for new and enhanced partnerships and ideas which allow
CAW/M to remain a relevant and important player in addressing community needs related to
poverty. Goals are measured in a ROMA (Results Oriented Management and Accountability) cycle
that incorporates assessment, planning, implementation, achievement of results and evaluation.
Additionally, results are aligned with the National Community Action goals of:
• Individuals and families with low incomes are stable and achieve economic security.
• Communities where people with low incomes live are healthy and offer economic
opportunity.
• People with low incomes are engaged and active in building opportunities in
communities.
The process supports CAW/M’s mission in continually seeking to assist low-income individuals
and families to reduce poverty, revitalize low-income communities and empower low-income
individuals and families to become self-sufficient.
METHODOLOGY
Several different methods of data collection were used to gather appropriate information for the
assessment. The demographic and research statistics found in this document represent
information that is helpful in understanding the communities we serve and how to interpret the
impact of local trends. Charts are segmented in this document under areas of focus. The narrative,
while not always directly addressing those statistics, will offer information gleaned from CAW/M's
own community survey, stakeholders' discussion and focus group input, along with information
from the community needs assessments of other local partners.
Surveys
The community needs survey was distributed through several methods including emailing links
to Board members, Head Start families, community stakeholders, individuals served by CAW/M
and members of various organizations and groups. Lists of collaborations and groups that
received the email are attached in the appendix. The survey was also posted on Facebook. Hard
copies were made available at CAW/M offices but were not widely utilized due to the office shut
down resulting from COVID-19. Also, individuals currently being served by CAW/M’s food pantry
received hard copies of the survey with their food orders.
One hundred and eighty-seven surveys were completed, with 122 identifying with Wayne County
6and 62 identifying with Medina County. Eighty-five of the surveys (46%) were from individuals
served by CAW/M. Responses came from every sector of the community, including 5% Faith-
based organizations, 7% private sector, 25% Community organizations, 3% Educational
institutions, 6% Board members, 9 % CAW/M staff or volunteer and 5% government or public
sector (with some respondents identifying with more than one category). Survey questions
included questions related to demographics of respondents, community needs, causes and
conditions of poverty, service gaps and suggestions for additional programming. Survey results
were analyzed by CAW/M staff.
Focus Groups
Focus groups were planned to be held in March and April with the following groups: Head Start
Policy Council, Wayne Transportation Advisory Committee, Getting Ahead Program participants,
Energy Services program participants, individuals served by Lodi Family Center, Medina Office for
Older Adults and Medina Veterans’ Services. Due to COVID-19 all of these group meetings were
cancelled, and most could not be rescheduled. Discussions still occurred and input obtained from
a Getting Ahead group and Board members of Medina Veterans’ Services (all former veterans
themselves). In order to gain firsthand input from low-income individuals, mini phone interviews
were conducted by staff and volunteers in place of the planned focus groups and additional
community needs surveys were sent to those who were willing to provide input. (See information
in Survey section below).
Stakeholder Interviews
Similar to the Focus Groups, stakeholders’ meetings were scheduled in early April in each county
with selected well-respected and knowledgeable leaders from the following sectors: community-
based organizations, faith-based organizations, private sector, public sector and educational
institutions. As with the focus groups, these meetings all had to be cancelled due to COVID-19.
As it became clear that face-to-face meetings probably could not happen in 2020, staff began
arranging phone interviews with the individuals who were identified to be leaders in each of these
sectors and individual phone interviews occurred. Agencies represented are listed in the
appendix. 32 phone interviews were conducted by staff. The benefit of these interviews became
quickly apparent as staff were able to expand their focus and ask questions directly related to the
changing needs in uncertain and unprecedented times with questions focused on three time
periods— 1) beginning of 2020, 2) during the onset and height of Covid-19 in mid-2020 and 3)
future needs in early 2021. These interviews typically were 30-60 minutes in length and were in-
depth discussions of what individuals were seeing with the segment of the population with which
they worked. These individuals were able to provide solid and unique information and
perspectives into the effects and possible aftereffects of Covid-19.
Program Participant Interviews
Very early during the COVID-19 pandemic and resulting shut-down and stay-at-home orders in
the State of Ohio, it became clear that many of those individuals and families who had used
CAW/M services in the past may be without needed services or were lacking in basic needs. Staff
7began calling these individuals to remind them of CAW/M services and to check if there were
other services that were needed. Several hundred calls were made. Of those calls, over 100
individuals were included in a mini-survey asking them about the effects of COVID-19 and any
additional needs that they were experiencing. These calls quickly began to establish that there
was a high level of anxiety and several referrals were made to mental health services. It also
became apparent that many individuals were feeling isolated and lonely. Staff also emailed links
to the community needs survey to those who were interested and tracked those who were willing
to be interviewed to provide additional information.
Information on who was willing to participate in a larger survey was then used and provided to a
community volunteer who called and conducted 19 in-depth interviews with low-income
individuals. That information provided the most in-depth information and was valuable in
identifying community needs that were priorities for them and their families.
DEMOGRAPHICS
Poverty Level
Although Wayne County is considered a rural county, Medina County has rural areas but is
considerate a suburban bedroom community for jobs in both Cleveland/Cuyahoga County area
and the Akron/Summit County area. Both counties have lower poverty rates than the state
average of 13.9% based on July 2019 Census estimates in which Medina had a 6.5% rate and
Wayne had a 9.1% rate. The average rate within the United States is 11.8%.
Poverty Level—Census estimate
Wayne County – 9.1% Household Median Medina County – 6.5%
https://www.census.gov/quickfacts/ https://www.census.gov/quickfacts/
waynecountyohio medinacountyohio
Median Income
Both counties also have higher median incomes than the state average of $54,533 with Medina
County having the 5th highest median income of all Ohio counties and Wayne County having the
35th highest out of 88 counties. cleveland.com/datacentral/2020/01/every-ohio-city-and-
county-ranked-for-median-family-household-income-census-estimates.html.
Household income
Wayne County - $59,111 Household Median Medina County - $ 75,786
$18,851 SS MEAN $19,877
$9,910 SSI MEAN $11,826
$2,781 TANF MEAN $3,474
TANF w/ Food
$4,208 Stamps MEAN $3,620
8https://data.census.gov/cedsci/table? https://data.census.gov/cedsci/table?
q=Wayne%20County%20Ohio%20aver q=Medina%20County%20Ohio%20aver
age%20social%20security%20benefit& age%20social%20security%20benefit&
g=0500000US39169&tid=ACSDP1Y201 g=0500000US39103&tid=ACSDP1Y201
8.DP03 8.DP03
Racial Diversity
Medina and Wayne Counties also have limited racial and ethnic diversity showing over 95% of
the population in both counties as White.
Population by Race
Wayne County - 115,915 TOTAL POPULATION Medina County – 176,362
95.1% 110,182 White 168,584 95.6%
1.4% 1,610 Black 2,682 1.5%
1.9% 2,152 Hispanic 3,435 1.9%
American Indian/
0.2% 262 Alaskan Native 242 0.1%
1.0% 1,138 Asian 2,124 1.2%
0.0% 24 Pacific Islander 13 0.0%
1.7% 2,026 Two or more races 2,135 1.2%
0.6% 673 Other 582 0.3%
6.0% 7,005 TOTAL MINORITIES 10,326 5.9%
www.development.ohio.gov/files/re www.development.ohio.gov/files/re
search/C1086.pdf search/C1053.pdf
Gender
There are slightly more females in each county than males.
Population by Gender
Wayne County - 115,967 TOTAL POPULATION Medina County - 179,146
49.50% 57,444 Male 89,213 49.8%
50.50% 58,223 Female 89,933 50.2%
https://data.census.gov/cedsci/table? https://data.census.gov/cedsci/table?
q=Wayne%20County%20Ohio%20pop q=Medina%20County%20Ohio%20pop
ulation&g=0500000US39169&tid=ACS ulation&g=0500000US39103&tid=ACS
DP1Y2018.DP05 DP1Y2018.DP05
Household Type
The majority of households in each county are made up of married couples with children under
the age of 18 in what are considered family households. However, there are also a significant
number of nonfamily households and of those over 80% in each county are individuals who are
living alone. Over 40% of households in each county in which someone is living alone are
individuals over the age of 65. This is significant and not surprising as predictions of growth in
the aging population have been documented. The population aged 60+ in Medina County was
919.3% in 2010 and projected to grow to 25.8% in 2020 and to 31% in 2030. In Wayne County, the
population aged 60+ was 20.4% in 2010 and is projected to grow to 26.6% in 2020 and 30.3% in
2030, according to Scripps Gerontology Center.
Households by type
Wayne County – 43,908 total households Medina County – 70,609
family households
66.4% 29,166 52,471 74.3%
nonfamily
33.6% 14,742 households 18,138 25.6%
Non-Family Household
Information
(of those nonfamily
households the # living
83.6% 12,318 alone) 15,983 88.1%
(of those living alone
40.5% 4,994 those age 65 and over) 7,080 44.3%
https://data.census.gov/cedsci/table?q https://data.census.gov/cedsci/table?q
=Wayne%20County%20Ohio%20total% =Medina%20County%20Ohio%20total
20households&g=0500000US39169&ti %20households&g=0500000US39103&
d=ACSDP1Y2018.DP02 tid=ACSDP1Y2018.DP02
Population by Age
Wayne County – 115,967 TOTAL POPULATION Medina County – 179,146
6.3% 7,309 Under 5 years 9,723 5.4%
6.8% 7,846 5-9 years 10,212 5.7%
7.0% 8,132 10-14 years 12,435 6.9%
7.1% 8,204 15-19 years 11,782 6.6%
6.7% 7,764 20- 24 years 9,099 5.1%
11.7% 13,619 25-34 years 19,628 11.0%
10.8% 12,469 35-44 years 22,615 12.6%
11.9% 13,762 45-54 years 25,803 14.4%
7.1% 8,253 55-59 years 14,417 8.0%
7.2% 8,345 60-64 years 11,358 6.3%
9.8% 11,401 65-74 years 18,922 10.6%
5.6% 6,497 75-84 years 10,152 5.7%
2.0% 2,366 85 and over 3000 1.7%
39 MEDIAN AGE 42
https://data.census.gov/cedsci/table?q https://data.census.gov/cedsci/table?q
=Wayne%20County%20Ohio%20popul =Medina%20County%20Ohio%20popul
ation&g=0500000US39169&tid=ACSDP ation&g=0500000US39103&tid=ACSDP
1Y2018.DP05 1Y2018.DP05
10Educational Attainment
Medina County also ranks high among educational attainment by its residents. Medina ranks 7 th
among all Ohio counties for percentage of residents with a bachelor’s degree or above while
Wayne County ranks 29th among 88 counties.
Educational Attainment
Wayne County Medina County
86.0% high school diploma/ 94.9%
GED
Bachelor’s
21.9% Degree 33.3%
Master’s
8.2% or Higher 9.2%
https://www.cleveland.com/datacentral/2019/12/every-ohio-city-and-county-ranked-for-
education-level-of-adults-census-estimates.html
General Population Characteristics
The following charts show additional general characteristics for each county.
Population by Veteran Status
total population 18
Wayne County 87,875 and over Medina County – 138,890
6.3% 5,526 veterans 10,363 7.5%
https://data.census.gov/cedsci/table?q=Wayne https://data.census.gov/cedsci/table?q=Medina
%20County%20Ohio%20population%20by%20V %20County%20Ohio%20population%20by%20V
eteran%20Status&g=0500000US39169&tid=ACS eteran%20Status&g=0500000US39103&tid=ACS
ST1Y2018.S2101 ST1Y2018.S2101
Civilian Labor Force
Total employable
Wayne County – 60,800 civilians Medina County – 96,500
58,600 employed 92,400
2,200 unemployed 4,100
3.6% unemployment rate 4.3%
https://www.development.ohio.gov/files/re https://www.development.ohio.gov/files/re
search/C1086.pdf search/C1053.pdf
Population by U.S. Citizenship Status of Foreign-
Born population
total foreign born
Wayne County – 1,883 population Medina County – 4,931
naturalized U.S.
52.0% 980 citizen 2,846 57.7%
48.0% 903 not a U.S. citizen 2,085 42.3%
11https://data.census.gov/cedsci/table?q=Way https://data.census.gov/cedsci/table?q=me
ne%20county%20ohio%20population%20by dina%20county%20ohio%20population%20
%20Foreign%20Born&g=0500000US39169&t by%20Foreign%20Born&g=0500000US3910
id=ACSDP1Y2018.DP02&t=Foreign%20born& 3&tid=ACSDP1Y2018.DP02&hidePreview=fa
layer=VT_2018_050_00_PY_D1 lse&vintage=2018&t=Foreign%20born%3AF
oreign%20born&layer=VT_2018_050_00_PY
_D1&cid=DP02_0001E
Population by Ancestry
Wayne County – 115,967 TOTAL POPULATION Medina County – 179,146
6.8% 7,871 American 7,628 4.3%
0.3% 357 Arab 2,277 1.3%
0.7% 831 Czech 4,081 2.3%
0.2% 267 Danish 438 0.20%
1.7% 1,955 Dutch 2,456 1.40%
7.3% 8,433 English 19,856 11.1%
2.5% 2,904 French 3,315 1.9%
0.1% 106 French Canadian 0 0.0%
27.9% 32,297 German 51,737 28.9%
0.20% 226 Greek 908 0.5%
1.1% 1,277 Hungarian 9,170 5.1%
9.0% 10,483 Irish 30,324 16.90%
4.40% 5,079 Italian 15,661 8.7%
0.30% 337 Lithuanian 394 0.20%
0.50% 548 Norwegian 579 0.30%
2.7% 3,155 Polish 19,942 11.1%
0.0% 49 Portuguese 167 0.10%
0.1% 81 Russian 1,095 0.60%
.6% 672 Scotch- Irish 1,926 1.10%
2.10% 2,391 Scottish 3,790 2.10%
0.70% 771 Slovak 4,757 2.7%
0.10% 84 Subsaharan African 44 0.00%
0.40% 494 Swedish 893 0.50%
6.20% 7,216 Swiss 1,774 1.0%
0.10% 105 Ukrainian 1,866 1.0%
0.40% 515 Welsh 1,862 1.0%
0.0% 0 West Indian 57 0.00%
https://data.census.gov/cedsci/table?q=wayn https://data.census.gov/cedsci/table?q=Med
e%20county%20ohio%20how%20many%20ar ina%20county%20ohio%20how%20many%20
e%20arab&g=0500000US39169&tid=ACSDP1Y are%20arab&g=0500000US39103&tid=ACSD
2018.DP02&layer=VT_2018_050_00_PY_D1 P1Y2018.DP02&layer=VT_2018_050_00_PY_
D1
12Language Spoken at Home
Population in
residence 5 years or
Wayne County 86,998 longer Medina County – 136,805
92.0% 80,017 English only 133,620 97.7%
language other than
8.0% 6,981 English 3,185 2.3%
(speaks English less than
3.6% 3,137 "very well") 924 0.7%
https://data.census.gov/cedsci/table?q=W https://data.census.gov/cedsci/table?q=
ayne%20County%20Ohio%20population% Medina%20County%20Ohio%20populatio
20by%20Language%20spoken%20at%20ho n%20by%20Language%20spoken%20at%
me&g=0500000US39169&tid=ACSST1Y201 20home&g=0500000US39103&tid=ACSST
8.S1601&t=Language%20Spoken%20at%2 1Y2018.S1601&t=Language%20Spoken%2
0Home 0at%20Home
Top Crimes
Number Wayne Rank Medina County-- Number
County--2018 2017
517 theft #1 Larceny 986
315 Vandalism #2 Burglary 168
306 drug Investigation #3 Assault 46
https://www.waynecountysheri http://www.ocjs.ohio.gov/c
ff.com/sites/default/files/2019- rime_stats_reports.stm
05/2018%20Annual%20Report.
pdf
Overall, the demographic data shows both counties to be predominantly white with higher
incomes and educational attainment than the majority of counties in the state. Both counties
show an aging population with increasing numbers of individuals over the age of 65 living in the
county. However, those demographics share only part of the story of the two counties. As
additional quantitative and qualitative data will show, poverty still exists within the counties and
individuals continue to struggle with meeting the basic needs which their families need to grow
and thrive. The COVID-19 epidemic has brought to light additional data and information which
must be considered and planned for in any assessment of county problems and its resources.
13DATA ANALYSIS AND KEY FINDINGS
Poverty
As an organization that works with low-income families and individuals and provides them with
resources and opportunities to improve their situation and work toward self-sufficiency,
CAW/M’s focus is on issues of poverty and how to address, minimize and solve the multitude of
problems which result from poverty. Although Wayne and Medina County poverty rates are
lower than most counties in Ohio (Wayne 9.1% and Medina 6.5%), it is still clear that poverty
exists in pockets around each county. https://www.census.gov/quickfacts/waynecountyohio;
https://www.census.gov/quickfacts/medinacountyohio
Highest areas of poverty
Listed by highest
percentage per
Wayne County – 9.1% capita Medina County – 6.5%
19.3% Wooster 1st Lodi 24.1%
18.5% West Salem 2nd Medina 9.8%
16.0% Orrville 3rd Brunswick 8.0%
16.2% Rittman 4th Wadsworth 6.8%
12.0% Creston 5th Chatham/Spencer 6.5%
Each city looked up individually http://www.city-data.com/poverty/poverty-Brunswick-Ohio.html
It is important to note that not all groups are affected equally when we are looking at issues of
poverty and economic hardship. Groups which are more affected by poverty are minorities,
women, children, single mothers, and those disabled and older individuals who are on a fixed
income. Poverty rates by race and ethnicity are higher than average in Medina for Blacks,
Hispanics, Asians, and those of multiple races and “other” races as shown in the chart below.
Similarly, in Wayne County, the poverty rate is higher than the rate for Whites for all groups except
Asians. This is true for these groups even though over 95% of the population is White in both
counties. The Ohio Associations of Community Action Agencies 2020 State of Poverty shows that
adults age 65 and older have the lowest poverty rate in every racial/ethnic group, while those
under age 6 have the highest poverty rate for all groups except Asian Ohioans.
Population by Race in Poverty
Wayne County - 115,915 TOTAL POPULATION Medina County – 176,362
11.72% White 5.99%
40.85% Black 27.7%
25.56% Hispanic 16.32%
28.82% Native American/ .43%
Alaskan Native
7.59% Asian 11.98%
NA Pacific Islander NA
13.66% Two or more races 9.54%
38.78% Other 13.14%
https://engagementnetwork.org, 7/23/2020 https://engagementnetwork.org, 7/23/2020
14Population by Gender in Poverty
Wayne County - 115,967 TOTAL POPULATION Medina County - 179,146
10.89% 6,053 Male 4,497 5.17%
13.87% 7,832 Female 6,806 7.68%
https://engagementnetwork.org, 7/23/2020 https://engagementnetwork.org, 7/23/2020
Data shows that single mothers have the lowest income of any family group, making 55-60% of
single women without children and making only 60% of what single males with children make
each year. Nationally, almost 25% of unmarried mothers live in poverty.
americanprogress.org/issues/women/reports/2020/08/03/488536/basic-facts-women-poverty
County Married Married Single Single Single Single
couple couple males males with females females
without with without children without with
children children children children children
Wayne 72,234 81,638 44,718 41,908 45,286 25,331
Medina 92,832 110,036 81,579 55,855 56,916 33,824
https://engagementnetwork.org, 7/23/2020
Families Facing Economic Hardship*
TOTAL Number of
Wayne County – 30,187 Families Medina County – 52,471
# of families below
2,143 125% FPL 3,481
Married couple 1,560
1,261 families below 100%
Single Female Head
of Household families
1,014 below 100% 1,982
https://data.census.gov/cedsci/table?q=Wayn *these stats are all https://data.census.gov/cedsci/table?q=Med
e%20county%20ohio%20families%20in%20po independent of each ina%20county%20ohio%20families%20in%20
verty&g=0500000US39169&tid=ACSST1Y2018 other poverty&g=0500000US39103&tid=ACSST1Y2
.S1702&t=Poverty&vintage=2018 018.S1702&t=Poverty&vintage=2018
Children Facing Economic Hardship
Total Children
Wayne County - 7309 Counted under age5 Medina County -9723
Children under 6 in
Households living
below FPL
8.2% 672 (low-income) 734 6.6%
15Living at or above
FPL
7,524
91.8%
10,353 93.3%
https://data.census.gov/cedsci/table?q=United%20 https://data.census.gov/cedsci/table?q=United%
States&table=DP05&tid=ACSDT1Y2018.B17001&g= 20States&table=DP05&tid=ACSDT1Y2018.B17001
0100000US_0500000US39103,39169&lastDisplayed &g=0100000US_0500000US39103,39169&lastDis
Row=29&vintage=2018&layer=state&cid=DP05_000 playedRow=29&vintage=2018&layer=state&cid=
1E&t=Age%20and%20Sex%3AOfficial%20Poverty%2 DP05_0001E&t=Age%20and%20Sex%3AOfficial%
0Measure%3APoverty 20Poverty%20Measure%3APoverty
Veterans Facing Economic Hardship
Wayne County – 5,526 Total number of vets Medina County – 10,363
Number of vets
2.3% 123 below 311 3. 0%
100% FPL
https://data.census.gov/cedsci/table?q=Wa https://data.census.gov/cedsci/table?q=
yne%20county%20ohio%20population%20o Medina%20county%20ohio%20populatio
f%20veterens%20facing%20economic%20h n%20of%20veterens%20facing%20econo
ardship&g=0500000US39169&tid=ACSST1Y mic%20hardship&g=0500000US39103&ti
2018.S2101&t=Veterans d=ACSST1Y2018.S2101&t=Veterans
Work Status while Facing Economic Hardship
Population 16-64
Wayne County – 70,858 years of age Medina County - 111,848
1.5% of which worked full time year 1.0% of which
are in poverty 37,738 round 76,713 are in poverty
7.5% of which worked less than full 6.5% of which
are in poverty 19,144 time year round 29,289 are in poverty
36.3% of which 24.% of which
are in poverty 13,976 did not work 17,125 are in poverty
https://data.census.gov/cedsci/table?q=Wa https://data.census.gov/cedsci/table?q=Med
ynce%20county%20ohio%20population%20 ina%20county%20ohio%20population%20in
in%20labor%20force&g=0500000US39169& %20labor%20force&g=0500000US39103&tid
tid=ACSSE2018.K202302&vintage=2018 =ACSSE2018.K202302&vintage=2018
When asked in the community needs assessment survey the most serious effects of poverty,
results from both counties showed people were most concerned about: substandard and unsafe
housing, lack of transportation to needed services, lack of affordable health care and shortage of
food.
Q4: What do you consider the most serious effects of poverty in the community?
16Other issues which were discussed in interviews and surveys included lack of a living wage,
generational poverty and “benefits cliff” issues.
Recently we have heard the call for a “Living Wage” by many advocates for the poor. This is a
concept which has emerged from the Self-Sufficiency Standard, which was first developed by Dr.
Diana Pearce in 1996, and is a measure that provides realistic and detailed data on what
individuals need to be self-sufficient. The Standard can be found in 37 states, including Ohio, and
the District of Columbia. The Standard defines the amount of income necessary to meet basic
needs (including taxes) without public subsidies (e.g., public housing, food stamps, Medicaid or
child care) and without private/informal assistance (e.g., free babysitting by a relative or friend,
food provided by churches or local food banks, or shared housing). The Standard takes into
consideration housing, childcare, food, transportation, healthcare, taxes and tax credits and
miscellaneous household expenses in determining the level of self-sufficiency a family
17possesses/needs to reach to become independent from government assistance as much as
feasible.
ITEMS INCLUDED IN THE SELF-SUFFICIENCY STANDARD, OHIO
CO WHAT IS INCLUDED IN
ST EACH BUDGET ITEM
Yes: Rent, utilities, and property taxes
Housing
No: Cable, internet, or telephone services (telephone service is included under miscellaneous costs)
Yes: Full-time family day care for infants, full-time center care for preschoolers, and before and after
Child Care school care for school-age children
No: After school programs for teenagers, extracurricular activities, babysitting when not at work
Yes: Groceries
Food
No: Take-out, fast-food, restaurant meals, or alcoholic beverages
Yes: car ownership cost (per adult)—insurance, gasoline (including gasoline taxes), oil, registration,
Transportati repairs, monthly payments—or public transportation when
adequate (assuming only commuting to and from work and day care plus a weekly shopping trip)
on
No: Non-essential travel or vacations
Yes: Employer-sponsored health insurance and out-of-pocket costs
Health Care
No: Health savings account, gym memberships, individual health insurance
Yes: Federal and state income tax and tax credits, payroll taxes, and state and local sales taxes
Taxes
No: Itemized deductions, tax preparation fees or other taxes (property taxes and gasoline taxes are
included under housing and transportation costs, respectively)
Yes: Clothing, shoes, paper products, diapers, nonprescription medicines, cleaning products,
Miscellaneo household items, personal hygiene items, and telephone service
us
No: Recreation, entertainment, pets, gifts, savings, emergencies, debt repayment (including student
loans), or education
SOURCE: University of Washington, Center for Women’s Welfare, Self-Sufficiency Standard for Ohio
OACAA State of Poverty 2020
Putting this into perspective, the Ohio Association of Community Action Agencies in its “2020
State of Poverty” recognizes the self-sufficiency standard as one of several factors in determining
poverty. Their tool can be found at http://oacaa.org/self-sufficiency-calculator and shows that
for a family of four with two adults and two school-age children in Wayne County, both parents
must be working full-time and making a minimum of $10.13 per hour in order to just meet basic
needs. In Medina County each adult must make a minimum or $11.71 per hour. This amount
changes based on age of the children with higher amounts necessary the younger the children
are.
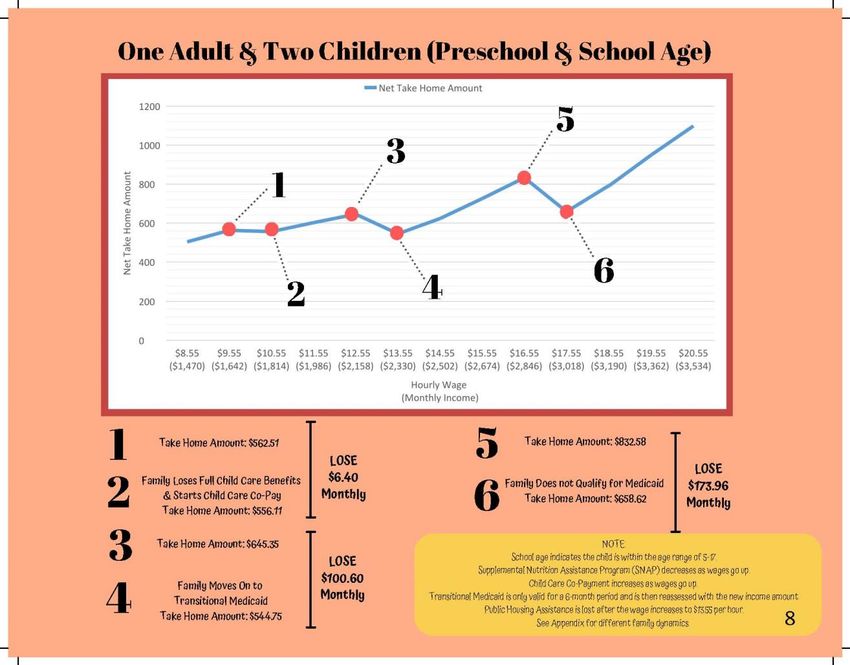
Another common issue cited as a reason for ongoing poverty in both communities was the
benefits cliff. The benefits cliff is commonly defined as “a sudden drop off in public benefits, due
to an income increase that shifts [the workers’] income above the allowable maximum for
certain benefits”. The reality is that this impacts an individual’s financial status, but it can also
affect their professional career, keeping them from accepting a promotion and raise due to the
negative effect that it will have on a family’s resources. The chart below shows an example created
by the 2019 Applied Methods and Research Experience class at the College of Wooster.
18https://documentcloud.adobe.com/link/track?uri=urn%3Aaaid%3Ascds%3AUS%3Aaa20c475-65c8-4a41-
a6e1-86a2e9a87164#pageNum=1
One interview respondent stated that she makes $12.50/hour and is just over the income limit
for most assistance. She states that she wants to work but feels penalized for working—a
sentiment of many who are affected by the benefits cliff. Similarly, a survey respondent stated
“Barriers need to be eliminated that create disincentives to earning more. For instance, better
food stamp security. If whenever someone's income rises, their SNAP benefits go down, then
there is less incentive to try.”
Beyond these long-standing issues of poverty, another layer of hardship occurred as a result of
the COVID-19 pandemic. As data collection continued during the pandemic, additional
information on the effects of the pandemic was gathered. The immediate impacts of COVID-19
were felt across all sectors of society. According to the Prosperity Now Scorecard April 2020
report, macroeconomic slowdown, lost income, and mass layoffs were the first visible signs of
COVID-19’s impact. These events had a significant impact on those who experienced layoffs and
lost income.
Research by the Federal Reserve Board of Governors showed that 39% of U.S. adults do not have
enough cash or savings to cover a $400 emergency expense. This figure has fallen from a 50% rate
19reported in 2013.
https://prosperitynow.org/sites/default/files/PDFs/Scorecard%202020/Unequal_Impact_of_CO
VID-19.pdf. Living paycheck-to-paycheck can cause a family to slip into episodic poverty quickly. It
is more common with fewer assets and nearly half of Ohioans lack assets to stay out of poverty
for 3+months according to the OACAA State of Poverty Report 2020. This was seen during the
pandemic as unemployment in Ohio rose and individuals began losing their jobs. Individuals in
many sectors of the economy – but particularly the service sector, the retail sector, and others
most affected by quarantine policies experienced sudden and unexpected unemployment. Some
were unaware of resources available to them and their families as they experienced
unemployment for the first time. Unemployment rates skyrocketed from 3.6% in Wayne County
in February to 11.8% in April.
https://ycharts.com/indicators/wayne_county_oh_unemployment_rate. Similarly, in Medina
County unemployment rates grew from 4.4% in February to 21.10% in April. Residents who had
not previously contacted CAW/M began calling CAW/M and requesting service.
https://ycharts.com/indicators/medina_county_oh_unemployment_rate. Almost all stakeholder
interviews confirmed that the effects of the pandemic are expected to be ongoing and last well
into 2021.
KEY FINDING:
Despite working fulltime, people are still living in poverty. In many instances, poverty is
generational, and the resources are lacking that are needed to pull families out of this cycle.
Contributing to ongoing poverty are lack of a living wage and the benefits cliff. These factors
create numerous other effects for families and individuals in our community such as substandard
housing, lack of transportation, lack of medical care and shortage of food. Each of these items
need to be addressed individually through advocacy at all levels of policy making but the overall
effects of poverty within the community cannot be ignored.
Additional resources have been provided through special funding to address the increased
unemployment and corresponding rise in poverty during the pandemic. CARES Act funding
including rent, utilities, food and funding for mental health services has been increased but it is
likely that the effects of the pandemic may last longer than the funding, creating even more need
for services in the future.
Housing
As discussed above, the survey results from both counties show affordable housing as the top
issue. Housing Coalitions in both counties recognize that there is a significant lack of affordable
housing and programming. Both Medina Metropolitan Housing and Wayne Metropolitan Housing
have 2-4 year waiting lists for both their public housing units and for the Housing Voucher
program. Those who do receive vouchers have 90 days to use the voucher. There is much
anecdotal information about families who receive vouchers after a long wait and then cannot find
a place to rent within the required 90 day window due to lack of units and unwillingness of
landlords to accept the vouchers. Data shows that over 42% of Wayne County and 45% of Medina
County households are paying over 30% of their incomes on rent. Since 1981 the Housing and
Urban Development Department (HUD) standard has been that 30% of household income or less
20should be spent on housing in order for it to be considered affordable for a family. HUDuser.gov,
Defining Housing Affordability (August 2017).
Gross Rent as a percentage of household income*
Occupied units
Wayne County - 10,638 paying rent Medina County - 12,797
less than 15% of
19.8% 2,110 income 1,881 14.7%
12.6% 1,337 15-19.9 % of income 1,983 15.5%
12.2% 1,298 20-24.9 % of income 1,502 11.7%
12.1% 1,292 25-29.9% of income 1,587 12.4%
10.7% 1,140 30-34.9% of income 1,362 10.6%
32.5% 3,461 35% or more 4,482 35.0%
https://factfinder.census.gov/faces/t *Excluding units https://factfinder.census.gov/faces/t
ableservices/jsf/pages/productview.x where GRAPI cannot ableservices/jsf/pages/productview.x
html?src=CF be computed html?src=CF
Wayne County - $657 Median Gross Rent Medina County - $824
https://factfinder.census.gov/faces/t https://factfinder.census.gov/faces/t
ableservices/jsf/pages/productview.x ableservices/jsf/pages/productview.x
html?src=CF html?src=CF
Affordable housing is a concern across the country and the State of Ohio as OACAA’s State of
Poverty 2020 states, “A lack of affordable housing, flat wages and limited housing assistance have
collided, creating an increasingly concerning eviction environment in Ohio.“ Research shows that
affordable housing has cascading effects on a family’s lives helping to improve health, access to
education and employment prospects.
That eviction environment has increased significantly with COVID-19 and the resulting high
unemployment rates. In its article “Why a Historic Eviction Wave is Bearing Down on the U.S.”
Bloomberg News reports, “About 30 million Americans are “at risk” of being evicted in coming
months because they can’t pay rent, according to a review of the Census survey data by the
Aspen Institute Financial Security Program, the Covid-19 Eviction Defense Project, the National
Low Income Housing Coalition and a coalition of researchers. “The National Low-Income Housing
Coalition’s 2020 “Out of Reach” Report states, “Millions of renters were one financial shock away
from housing instability, and for many the pandemic and economic fallout is that shock.”
https://reports.nlihc.org/sites/default/files/oor/OOR_2020_Mini-Book.pdf. And while agencies
in both counties have received additional money for rent assistance, it appears to be far too little
to meet the developing need. In Wayne County both Wayne Metropolitan Housing and One
Eighty have received additional rent monies and faith-based Salvation Army and People to People
Ministries have been providing rent assistance. In Medina County, Medina Metropolitan Housing
and Salvation Armies continue to meet as much need as they are able.
CAW/M’s Housing Department works in both counties to weatherize homes and provide minor
home repairs to keep individuals in their homes and to decrease their energy usage in the home
21to keep it affordable. Older housing stock is still often a viable option for families as long as the
homes can be maintained. In addition, the reality is that in both counties, mobile homes are a
popular option for low-income homeowners and renters.
Both counties also have Community Housing Improvement Programs (CHIP) to assist
homeowners with projects to help them maintain and stay in their homes. Also, both counties
have Habitat for Humanity organizations which are building new affordable homes for LMI
individuals. Metro Housing in both counties have invested in numerous public housing buildings
to expand capacity.
Housing Units
Wayne County - 45,939 Total housing units Medina County - 70,239
6.6% 3,029 vacant housing 4,237 6.0%
93.4% 42,910 occupied housing 66,002 94.0%
73.1% 31,355 (owner occupied) 52,373 79.4%
26.9% 11,555 (renter occupied) 13,629 20.6%
https://factfinder.census.gov/faces/t https://factfinder.census.gov/faces/t
ableservices/jsf/pages/productview.x ableservices/jsf/pages/productview.x
html?src=CF html?src=CF
Year Structure Built
Wayne County - 45,939 Total housing units Medina County - 70,239
12.5% 5,733 Built 2000 or later 14,284 20.3%
25.1% 11,552 Built 1980-1999 20,159 28.7%
37.6% 17,334 Built 1950-1979 26,425 37.9%
24.7% 11,320 Built 1949 or earlier 9,371 13.3%
https://factfinder.census.gov/faces/t https://factfinder.census.gov/faces/t
ableservices/jsf/pages/productview.x ableservices/jsf/pages/productview.x
html?src=CF html?src=CF
Mobile Homes
Wayne County - 3,543 Total # of trailers Medina County - 645
37 Total # of MH parks 10
Wayne County Auditor's office Medina County Auditor's office
Housing Heating Fuel
Wayne County - 42,910 Occupied Housing Medina County - 66,002
63.8% 27,361 Utility gas 49,263 74.6%
6.5% 2,801 Bottled, tank, LP gas 3,242 4.9%
16.9% 7,264 Electricity 10,087 15.3%
5.3% 2,285 Fuel Oil/ kerosene 1,485 2.2%
6.5% 2,801 Coal/coke/wood 1,265 1.9%
0.0% 5 Solar 11 0.0%
0.6% 256 other 458 0.7%
220.3% 137 No fuel used 191 0.3%
https://factfinder.census.gov/faces/t https://factfinder.census.gov/faces/t
ableservices/jsf/pages/productview.x ableservices/jsf/pages/productview.x
html?src=CF html?src=CF
Households without complete facilities
Total occupied
Wayne County - 42,910 housing unit Medina County - 66,002
housing without
0.9% 382 complete plumbing 298 0.5%
housing without
2.2% 951 complete kitchens 731 1.1%
https://factfinder.census.gov/faces/t https://factfinder.census.gov/faces/t
ableservices/jsf/pages/productview.x ableservices/jsf/pages/productview.x
html?src=CF html?src=CF
The other major issue which must be addressed when discussing housing issues in both Wayne
and Medina counties is homelessness and the lack of resources for the homeless. As shown
below, both counties have homeless populations yet neither county has significant resources for
the homeless. Both have domestic violence shelters and Wooster Salvation Army has a small 37
bed homeless shelter that serves men, women and families. Those with past felony convictions
for certain crimes are not welcome. Medina County does not have a homeless shelter but relies
on churches that will house up to 10 individuals overnight on a rotating basis, again with
exceptions as to who is welcome.
Homelessness
Wayne County - 115,371 TOTAL POPULATION Medina County - 174,831
77 homeless adults 26
10 homeless children 11
total homeless
children served by
43 Head Start* 79
PIT count *different definition PIT count
Other services for homeless are limited as well. In Wayne County, the Salvation Army is opening
the Living Room—a day center where homeless individuals can spend time during the day. Also,
many go to Trinity United Church of Christ where they can get a breakfast 5 mornings each week.
There are groups actively working in each county to address this issue, but funding facilities and
ongoing support issues have not been solved. In the community needs survey asking which
housing needs should be addressed, several items were important, but the biggest issue was
Temporary and Transitional Housing, which 50% of respondents thought was an issue.
2324
KEY FINDING:
Affordable housing was identified as the number one need in both counties and was emphasized
repeatedly in interviews. LMI individuals are spending way too much of their monthly income on
housing, and homelessness has been recognized as a problem in both counties for many years
but a solution or plan has not yet been developed. CAW/M is taking measures to investigate if it
has a possible role in becoming a Community Housing Development Organization (CHDO) or in
developing any type of affordable housing. Discussions have begun with Board of Directors and
a volunteer committee is being developed to assist with research and a business plan.

Food Insecurity
Over 30% of survey respondents in both counties believed that there was a food shortage among
families despite numerous food pantries and resources available. Information from the Akron
Canton Regional Food Bank which serves 8 counties in northeast Ohio, including both Wayne and
Medina Counties, reports food insecurity as “the USDA’s measure of lack of regular access to
nutritional food for an active and healthy life.” Current information shows the food insecurity
rate in Wayne County is 12.0 percent of the total population, and the child food insecurity rate is
19.2 percent. https://www.akroncantonfoodbank.org/hunger-wayne-county.                 The food
insecurity rate in Medina County is 9.7 percent of the total population, and the child food
insecurity rate is 16 percent. https://www.akroncantonfoodbank.org/hunger-medina-county.

Supplemental Nutrition Assistance Program (SNAP) provides a minimal amount of assistance to
families in each county with average award being only $116 and $117 in Medina and Wayne
County respectively. In Medina County, less than 5% of the population receives SNAP and in
                                                25
Wayne County only 8.5% of the population receive any SNAP benefits.
SNAP assistance
Wayne County - 115,967 TOTAL POPULATION Medina County – 179,146
number of people
receiving cash
1.20% 1,443 assistance AND SNAP 1,236 0.60%
Nonpublic assistance
people receiving
7.3% 8,451 SNAP 7,769 4.30%
average $
$117 food stamps given $116
https://jfs.ohio.gov/pams/PAM-2018- https://jfs.ohio.gov/pams/PAM-2018-
Reports/State-Fiscal_2018.stm Reports/State-Fiscal_2018.stm
Due to this there is a heavy reliance on food pantries, the School Free and Reduced Lunch Program
and other programs and services throughout both counties.
In Medina County, only Black River High School and Middle School and Garfield Elementary School
in Medina have eligibility rates over 40%. In Wayne County, the schools with the highest eligibility
numbers are Cornerstone elementary in Wooster (74.71%) and then all schools in the Orrville
(44%-54%) and Rittman (43%-45%) school districts.
http://education.ohio.gov/Topics/Other-Resources/Food-and-Nutrition/Resources-and-Tools-
for-Food-and-Nutrition/MR81-Data-for-Free-and-Reduced-Price-Meal-Eligibil
Children on Free and Reduced Lunch Programs
District listed by
highest number on
Wayne County - the program Medina County -
Black River 473 of
52.20% Orrville 787 of 1507 1st 1185 39.90%
Cloverleaf 808 of
48.90% Rittman 619 of 1265 2nd 2867 28.20%
Wooster 1657 of
46.1% 3598 3rd Medina 1528 of 6839 22.30%
Northwestern 601 Brunswick 1543 of
43.3% of 1387 4th 7013 22.00%
Southeast Local 641 Buckeye 1031 of
40.9% of 1569 5th 5183 20.20%
26http://education.ohio.gov/Topics/Oth
http://education.ohio.gov/Topics/Other-
er-Resources/Food-and-
Resources/Food-and-Nutrition/Resources-
Nutrition/Resources-and-Tools-for- and-Tools-for-Food-and-Nutrition/MR81-
Food-and-Nutrition/MR81-Data-for- Data-for-Free-and-Reduced-Price-Meal-
Free-and-Reduced-Price-Meal-Eligibil Eligibil
http://education.ohio.gov/Topics/Other-Resources/Food-and-Nutrition/Resources-and-
Tools- for-Food-and-Nutrition/MR81-Data-for-Free-and-Reduced-Price-Meal-Eligibil
In addition, both counties have weekender back-pack programs for students. Feeding Medina
County’s Weekender program serves approximately 1,400 students each week, serving every
elementary school in all seven Medina County school districts, Medina County Board of DD
elementary school and all four CAW/M Head Start centers in Medina County. During the 2019-
2020 Head Start program year, CAW/M partnered with Feeding Medina County to provide
Weekender Food Bags to 121 children in CAW/M’s Head Start program once a week for 40 weeks
during the school year with 4,840 bags of food distributed during the school year. The Wooster
Hope Center provides these Weekender bags to children in 11 elementary schools in Wayne
County but does not include CAW/M’s Head Start program.
There are numerous small pantries in both counties, including CAW/M’s small pantry serving
Rittman, Ohio and the surrounding areas—primarily Wadsworth and Doylestown. In addition,
the Hope Center in Wooster and Feeding Medina County in Medina County are large programs
that offer significant assistance. In addition, A Whole Community Food Rescue program provides
fresh vegetables June through September to several organizations and low-income housing
complexes. CAW/M has partnered with A Whole Community to provide greater access to those
in need.
Despite its relatively low poverty rates, over half of the population in Medina County is deemed
to be in a food dessert as determined by the U. S. Department of Agriculture based on lacking
access to healthy foods sources due to income, distance or vehicle access. In Medina County, 20
of 37 census tracts are considered to contain food desserts while only 7 of 32 census tracts in
Wayne County are considered to be in food desserts.
During COVID-19 food distribution expanded greatly by many organizations. With so many
students on free and reduced lunch program, the abrupt end of the in-person school year, left
many students without their normal lunch and breakfast programs. Numerous local school
districts and CAW/M’s Head Start program had food distribution programs for students during
the early stages of the pandemic and throughout the summer, worrying that food insecurity
would increase for children who normally relied on free lunch programs. Wooster Hope Center
expanded its hours and Feeding Medina County expanded service. The Office for Older Adults in
Medina County increased deliveries of meals and food supplies to seniors throughout the county.
CAW/M’s food pantry in Rittman expanded to allow for service every week for those in need
rather than the standard “once every 30 days” that had been the standard before the pandemic.
27You can also read