2019 San Francisco Community Health Needs Assessment

 
CONTINUE READING
2019 San Francisco Community Health Needs Assessment
San Francisco
Community
Health Needs
Assessment
2019
2019 San Francisco Community Health Needs Assessment
Table of Contents

A Message from SFHIP............................................3
 Message from the Director of Health
A
for the City and County of San Francisco..................... 4
Acknowledgments..................................................5
Executive Summary................................................6
 HE 2019 COMMUNITY
T
HEALTH NEEDS ASSESSMENT ................8
Purpose and Collaborators.......................................9
Approach............................................................ 10
    Community Health Status Assessment................. 10
    Assessment of Prior Assessments........................ 11
    Community Engagement................................... 11
    Health Need Identification................................. 12
San Francisco Snapshot......................................... 13
Major Findings..................................................... 15
Foundational Issues.............................................. 16
    Poverty........................................................... 16
    Racial and Ethnic Inequality............................... 17
Health Needs....................................................... 20
     ccess to Coordinated, Culturally, and
    A
    Linguistically Appropriate Care and Services........ 20
    Food Security, Healthy Eating,
    and Active Living.............................................. 21
    Housing Security and an
    end to Homelessness........................................ 24
    Safety from Violence and Trauma........................ 26
    Social, Emotional, and Behavioral Health............. 30
References.......................................................... 35

                                                                            PHOTOGRAPH: PHOTOEVERYWHERE / STOCKARCH.COM

San Francisco Health Improvement Partnership                                                                             Community Health Needs Assessment 2019 | 2
2019 San Francisco Community Health Needs Assessment
A Message from SFHIP

It is our pleasure to share with you the 2019 San Francisco Community
Health Needs Assessment. On behalf of the members of San Francisco Health
Improvement Partnership (SFHIP), we hope you find this information useful
in planning and responding to the needs of our community.
We would like to thank the many individuals including       Many health needs were identified through this
community residents, community-based organizations,         assessment including: access to coordinated, culturally
and health care partners that contributed to this           and linguistically appropriate care and services; food
assessment. A special thank you goes out to the             security, healthy eating and active living; housing security
Community Health Needs Assessment and Impact Unit           and an end to homelessness; safety from violence and
of the San Francisco Department of Public Health for        trauma; and social, emotional, and behavioral Health.
their work on the data analysis and overall project         Additionally, poverty and racial health inequities were
management, and to the Backbone of SFHIP, staffed by        identified as structural and overarching issues which must
the Department of Public Health, the Hospital Council,      be addressed to ensure a healthy San Francisco for all.
and the University of California at San Francisco, for
their support for the project.                              SFHIP recognizes that all San Franciscans do not have
                                                            equal opportunity for good health, and we are committed
This Community Health Needs Assessment (CHNA) is            to eliminating health disparities and inequities by
part of an ongoing community health improvement             working together across sectors to achieve health equity
process. The CHNA provides data enabling identification     for all. We hope you find this assessment useful and we
of priority issues affecting health and is the foundation   welcome any suggestions you may have for assisting us
for citywide health planning processes including the        in improving the health of San Francisco.
Community Health Improvement Plan, the San
Francisco’s Health Care Services Master Plan, the San
Francisco Department of Public Health’s Population
Health Division’s Strategic Plan, and each San Francisco
non-profit hospital’s Community Health Needs
Assessment and Implementation Strategy.

A Community Health Improvement Plan (CHIP) is being
developed as a companion to this document and will
detail goals, objectives and action plans for each of the
focus areas identified.

                                                            SFHIP Co-Chairs
                                                            Jim Illig,
                                                            Kaiser Permanente San Francisco
                                                            Amor Santiago,
                                                            Asian and Pacific Islander Health Parity Coalition

San Francisco Health Improvement Partnership                                                                              Community Health Needs Assessment 2019 | 3
2019 San Francisco Community Health Needs Assessment
A Message from the
Director of Health

                                                PHOTOGRAPH: MIKE HOFFMAN

San Francisco Health Improvement Partnership                Community Health Needs Assessment 2019 | 4
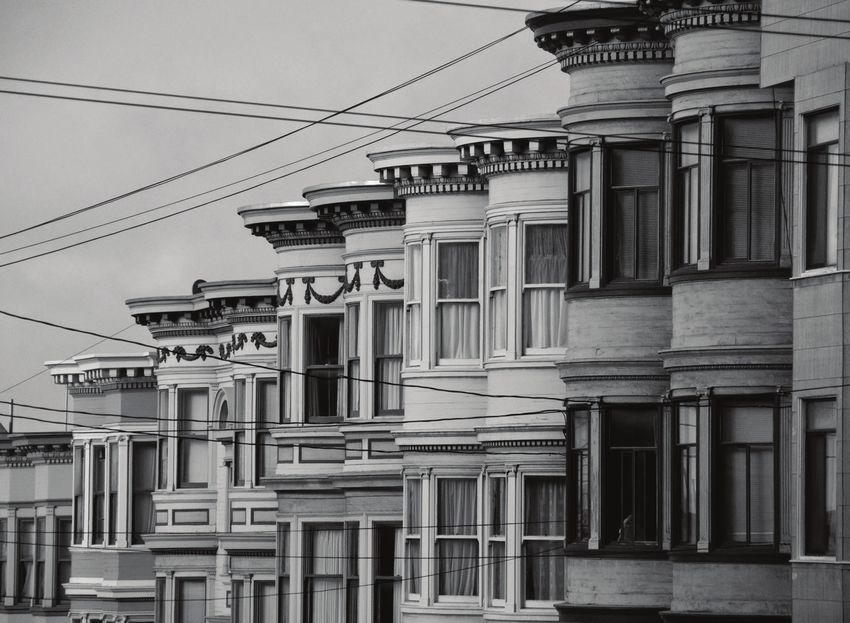
2019 San Francisco Community Health Needs Assessment
Acknowledgments

San Francisco Health Improvement Partnership Steering Committee                                                            San Francisco Department of Public Health
AMOR SANTIAGO                   ESTELA R. GARCIA              KEVIN GRUMBACH                MONIQUE LESARRE                Nora Anderson                Mary Hansel           Sharon Pipkin
Asian and Pacific Islander      Chicano/Latino/Indigena       Clinical & Translational      African American Community     Laura Braining-Rodriguez     Ling Hsu              Uzziel Prado
Health Parity Coalition         Health Equity Coalition       Science Institute’s           Health Equity Council                                       Brandon Ivory         Priti Rane
                                                                                                                           Katie Burk
                                                              Community Engagement
ANGELA SUN                      FLOYD TRAMMELL                                              SAEEDA HAFIZ                   Curtis Chan                  Karen Kohn            Chris Rowe
                                                              & Health Policy Program,
Chinese Hospital                SF Interfaith Council                                       San Francisco Unified                                       Mia Lei               Veronica Shepard
                                                              UCSF                                                         Carol Chapman
                                                                                            School District
KATE WEILAND                    JENNIFER VARANO                                                                            Shrimati Data                Dedriana Lomaz        Maryna Spiegel
                                                              KIM SHINE
Sutter Health California        Saint Francis Memorial                                      SHALINI IYER                                                Zea Malawa            Marianna Szeto
                                                              San Francisco Health                                         Derek Smith
Pacific Medical Center          Hospital                                                    Metta Fund
                                                              Services Network                                             Cristy Dieterich             Devan Morris          Mimi Tam
DEENA LAHN                      JIM ILLIG                                                   TOMAS ARAGON                                                Shivaun Nestor        Ana Validzic
                                                              ALEXANDER MITRA                                              Patricia Erwin
San Francisco Community         Kaiser Permanente                                           Population Health Division,
                                                              St. Mary’s Medical Center                                    Margaret Fisher              Rita Nguyen           Megan Wier
Clinic Consortium               San Francisco                                               San Francisco Dept of Public
                                                                                            Health                         Patrick Fosdahl              Trang Nguyen          Tiffany Yim
                                                                                                                           Joanna Fraguli               Israel Nieves         Janine Young
                                                                                                                           Jenna Gaarde                 Amy Nishimura
Community Health Needs Assessment                                              Hospital Council of
Leadership and Major Contributors                                              Northern & Central                          Dale Gluth                   Melissa Ongpin
                                                                               California                                  Christina Goette             Prasanthi Patel
Ameerah Thomas, San Francisco           Michelle Kirian, San Francisco
Department of Public Health             Department of Public Health            David Serrano Sewell                                                     Sneha Patil
                                                                               Laura Goria                                                              Susan Philip
Ayanna Bennett, San Francisco           Paula Fleisher, Department
Department of Public Health             University of California at San
Jason Xu, San Francisco Department
                                        Francisco                              University of California
                                                                               at San Francisco                            Community Partners
of Public Health                        Paula Jones, San Francisco
                                        Department of Public Health                                                        Mory Chhom, Vietnamese Youth Development Center
Jodi Stookey, San Francisco                                                    Kaya Balke             Alex Rutherford
Department of Public Health             Priscilla Chu, San Francisco           Mollie Belinski        Ma Somsouk           Debbie Lerman, San Francisco Human Services Network
                                        Department of Public Health            Nicholas Evans         Roberto Vargas       Ellen Moffatt, San Francisco Office of the Chief Medical Examiner
Lauren Swain,
University of San Francisco             Victor Kong, San Francisco             Laura Fejerman         Priyanica Vyas       Stefan Nilsen, University of San Francisco
                                        Department of Public Health            Stan Glanz             Susan Wang
Matt Wolff, San Francisco                                                                                                  Karma Smart, Rafiki Coalition for Health and Wellness
Department of Public Health             Wylie Liu, University of California    Robert Hiatte          Erica Wong           Pedro Vidal Torres, Center for Open Recovery
                                        at San Francisco
Max Gara, San Francisco                                                        Carmela                Aileen Xu
                                                                                                                           Karen Zeigler, San Francisco Office of the Chief Medical Examiner
Department of Public Health                                                    Lamonaco
Meg Wall-Shui, San Francisco                                                   James Rouse
Department of Public Health                                                    Iñiguez

San Francisco Health Improvement Partnership                                                                                                      Community Health Needs Assessment 2019 | 5
2019 San Francisco Community Health Needs Assessment
Executive Summary

Welcome to the Community Health Assessment (CHNA). The CHNA takes a broad view of health
conditions and status in San Francisco. In addition to providing local disease and death rates, this CHNA also
provides data and information on social determinants of health —social structures and economic systems which
include the social environment, physical environment, health services, and structural and societal factors.
The CHNA involves four steps:                                          The CHNA identifies two foundational issues contributing to
   • Community health status assessment                                local health needs:
                                                                          •R  acial health inequities
   • Assessment of prior assessments
                                                                          •P  overty
   • Community engagement
   • Health need identification and prioritization                     The CHNA identifies five health needs that heavily impact
                                                                       disease and death in San Francisco:
The CHNA is the foundation for each San Francisco non-profit              •A
                                                                            ccess to coordinated, culturally and linguistically
hospital’s Community Health Needs Assessment and is one of the             appropriate care and services
requirements for Public Health Accreditation. While the CHNA              •F
                                                                            ood security, healthy eating and active living
informs large-scale city planning processes such as San Francisco’s
                                                                          •H
                                                                            ousing security and an end to homelessness
Health Care Services Master Plan, the intent of this document is to
                                                                          •S
                                                                            afety from violence and trauma
inform the work of all organizations, teams and projects that impact
                                                                          •S
                                                                            ocial, emotional, and behavioral health
the people of San Francisco. Gaining an understanding of why health
outcomes exist here in San Francisco can help gear our efforts
towards addressing root causes and developing better interventions,    Foundational Issues
policies and infrastructure. SFDPH’s mission to protect and promote    Racial Health Inequities
the health of all San Franciscans, we all have a contribution to
                                                                       Health inequities are avoidable differences in health outcomes
achieving this goal, no matter the scale or scope of our work.
                                                                       between population groups. Health inequities result from both
                                                                       the actions of individuals (health behaviors, biased treatment by
Overall, the CHNA finds that health has improved in
                                                                       health professionals), and from the structural and institutional
San Francisco:
                                                                       behaviors that confer health opportunities or burdens based on
   • More San Franciscans have insurance.
                                                                       status. For example, the uneven distribution of wealth and
   •T he estimated rate of new HIV infection in San Francisco
                                                                       resources determines the level of health those getting the least
     continues to decrease.
                                                                       of these resources can achieve. Pages 17–19 include data on a
   •L ife expectancy increased for all San Francisco with the
                                                                       few improvements to health and determinants of health and
     biggest gains seen by Black/African Americans.
                                                                       point to where more work needs to be done to address the
   •M ortality rates due to lung, colon, and breast cancers and
                                                                       structural and institutional racism in San Francisco. Additional
     influenza and pneumonia continue to decline.
                                                                       data on health inequities are found throughout the Community
   •T he availability of tobacco products has decreased. At 11%,
                                                                       Health Data pages.
     rates of smoking are lower than the HP2020 goal of 12%.
   •2 017 had the lowest number of traffic-related fatalities
     since record keeping began in 1915.

San Francisco Health Improvement Partnership                                                                                              Community Health Needs Assessment 2019 | 6
2019 San Francisco Community Health Needs Assessment
Executive Summary

Poverty                                                              Housing Security and an End to Homelessness
Enough income generally confers access to resources that             Housing is a key social determinant of health.1 Housing stability, quality,
promote health — like good schools, health care, healthy food,       safety, and affordability all have very direct and significant impacts on
safe neighborhoods, and time for self-care — and the ability to      individual and community health. Much of California, and especially the
avoid health hazards — like air pollution and poor quality housing   Bay Area, is currently experiencing an acute shortage in housing, leading
conditions. Page 16 focuses on the economic barriers to health       to unaffordable housing costs, overcrowding, homelessness and other
that many San Franciscans face. Find additional data on              associated negative health impacts. Between 2011 and 2015, the Bay
economics and health in the Economic Environment data page.          Area added 501,000 new jobs — but only 65,000 new homes. An
                                                                     estimated 24,000 people in San Francisco live in crowded conditions
Health Needs                                                         and about 7,500 homeless persons were counted in San Francisco.
                                                                     Pages 24 – 25 provide an overview of the housing stressors in
Access to Coordinated, Culturally and Linguistically
                                                                     San Francisco. Additional information on housing and health is found
Appropriate Care and Services
                                                                     in the Housing data page.
San Francisco continued to see gains in access to health care
with 10,000 fewer residents uninsured in 2017 than in 2015.          Safety from Violence and Trauma
However, an estimated 3.6% of the population, or 31,480              Violence not only leads to serious mental, physical and emotional injuries
residents, still do not have health insurance. Furthermore,          and, potentially, death for the victim, but also negatively impacts the
access to services is influenced by location, affordability, hours   family and friends of the victim and their community. Persons of color are
of operation, and cultural and linguistic appropriateness of         more likely to be victims of violence, to live in neighborhoods not
health care services. Page 20 presents                               perceived to be safe and to inequitable treatment through the criminal
San Francisco statistics on health care use, barriers to use, and    justice system. Pages 26 – 29 focus on violence and trauma, their
consequences of not having access to quality care. Additional        determinants and health impacts in San Francisco. Additional data on
information on health care quality and access is located in the      violence and trauma in the City are presented in the Crime and Safety
Health Care Access and Quality data page.                            data page.
Food Security, Healthy Eating and Active Living                      Social, Emotional, and Behavioral Health
Inadequate nutrition and a lack of physical activity contribute to   Mental health is an important part of community health. In San
9 of the leading 15 causes of premature death in San Francisco
                                                                     Francisco the number of hospitalizations among adults due to major
— heart failure, stroke, hypertension, diabetes, prostate cancer,
                                                                     depression exceed that of asthma or hypertension. Presence of mental
colon cancer, Alzheimer’s, breast cancer, and lung cancer.
                                                                     illness can adversely impact the ability to perform across various facets of
Studies have shown that just 2.5 hours of moderate intensity         life — work, home, social settings. It also impacts the families,
physical activity each week is associated with a gain of             caregivers, and communities of those affected. Substance Abuse
approximately three years of life. Data on physical activity and     including drugs, alcohol and tobacco, contributes to 14 of the top causes
healthy eating and barriers to each are presented on pages           of premature death in the City — lung cancer, COPD, HIV, drug overdose,
21–23. Additional data are available in the Physical Activity,       assault, suicide, breast cancer, heart failure, stroke, hypertensive heart
Transportation, Crime and Safety, Overweight and Obesity, and        disease, colon cancer, liver cancer, prostate cancer, and Alzheimer’s.
Nutrition data pages.                                                Pages 30 – 34 focus on psychological distress, major depression, and
                                                                     substance abuse in San Francisco. Find additional data on social,
                                                                     emotional and behavioral health in the City in the Mental Health,
                                                                     Substance Abuse, and Tobacco Use and Exposure pages.

San Francisco Health Improvement Partnership                                                                                                       Community Health Needs Assessment 2019 | 7
2019 San Francisco Community Health Needs Assessment
The 2019
                                                Community
                                                Health Needs
                                                Assessment
                                                    Purpose and Collaborators 9

                                                                     Approach 10

                                                      San Francisco Snapshot 13

                                                               Major Findings 15

                                                                   References 35

San Francisco Health Improvement Partnership   Community Health Needs Assessment 2019 | 8
2019 San Francisco Community Health Needs Assessment
Purpose & Collaborators

The 2019 Community Health Needs Assessment (CHNA) takes a comprehensive
look at the health of San Francisco residents by presenting data on demographics, socioeconomic
characteristics, quality of life, behavioral factors, the built environment, morbidity and mortality,
and other determinants of health status.

      Health Care
       Services
      Master Plan
                                                     CHNA                                               Public Health
                                                                                                        Accreditation

             Hospitals’
            Community                                                                          Community Health
           Benefits Plans                                                                      Improvement Plan

                                        Hospitals’
                                    Community Health                  Other Planning
                                    Needs Assessments                   Processes

The CHNA is the foundation for each of San Francisco’s            The San Francisco Health Improvement Partnership
non-profit hospitals’ Community Health Needs Assessments          (SFHIP) guided CHNA development. SFHIP is a collaborative
and is one of the requirements for Public Health Accreditation,   body whose mission is to embrace collective impact and to
which includes: a CHNA, a community health improvement            improve community health and wellness in San Francisco.
plan, and a strategic plan for population health. The CHNA        Membership in SFHIP includes the San Francisco Depart-
also informs city planning processes such as San Francisco’s      ment of Public Health, San Francisco’s non-profit hospitals,
Health Care Services Master Plan.                                 the Clinical and Translational Science Institute’s Community
                                                                  Engagement and Health Policy Program at UCSF, the San
While the CHNA informs large-scale city planning pro-             Francisco Unified School District, The Office of the Mayor,
cesses, the intent of this document is to inform the work of      community representatives from the Asian and Pacific
all organizations, teams and projects that impact the people      Islander Health Parity Coalition, Human Service Network,
of San Francisco. Gaining an understanding of why health          Chicano/Latino/Indigena Health Equity Coalition, and African
outcomes exist here in San Francisco can help gear our            American Community Health Council, Community Clinic
efforts towards addressing root causes and developing             Consortium, Faith based and philanthropic partners. SFHIP
better interventions, policies and infrastructure.                completes a CHNA once every three years.

San Francisco Health Improvement Partnership                                                                                    Community Health Needs Assessment 2019 | 9
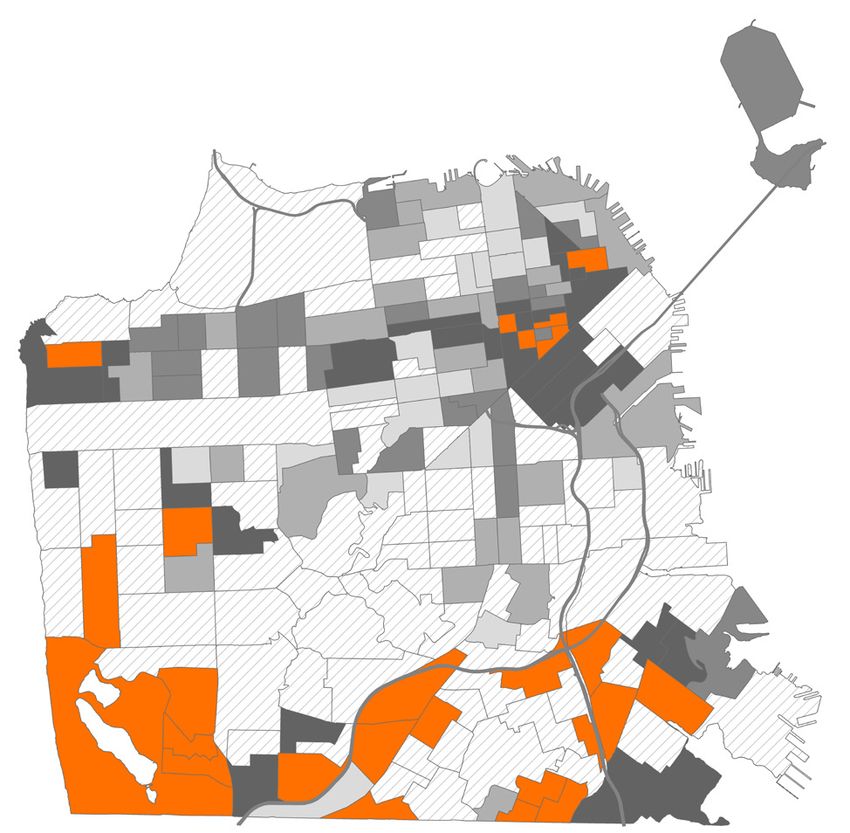
2019 San Francisco Community Health Needs Assessment
Approach

The Community Health Needs Assessment                                                          SAN FRANCISCO FRAMEWORK FOR ASSESSING POPULATION HEALTH AND EQUITY
takes a life course approach when exploring and
presenting the health needs of San Franciscans.                                                    UPSTREAM Root Causes                                                          DOWNSTREAM Consequences
A life course approach considers one’s lived experience and health
throughout the lifespan, within the context of their history, environment,
family, community, society, and culture. Certain events and exposures
(i.e. trauma, racism, poverty, environmental factors, etc.) during sensitive
time periods in early life can have long-term impacts on development and
health.1                                                                                            Belief                  Living                           Health                             Health
                                                                                                   Systems                Conditions                        Behaviors                         & Well-Being
                                                                                                    Cultural/      PHYSICAL ENVIRONMENT                        Nutrition                  QUALITY OF LIFE
In addition to impacting one’s own future health status, early life                              Societal Values           Land Use                        Physical Activity               FUNCTIONING
experiences can have intergenerational health outcomes. One’s                                    Discrimination/        Transportation                      Tobacco Use                   CLINICAL HEALTH
                                                                                                     Stigma
wellness during the prenatal or pregnancy periods impacts the health of                                                    Housing                     Alcohol and Other Drugs          Communicable Disease
                                                                                                                      Natural Environment                    Oral Health                   Chronic Disease
one’s children. Investing in pregnancy, early childhood, and family                                                                                         Sexual Health
                                                                                                                    SOCIAL ENVIRONMENT                                                         Injury
wellbeing through policies, interventions and systems can support our                                                                                      Preventive Care                  Mental Health
                                                                                                                       Social Cohesion
society and address the root causes of health inequities.                                                                   Safety
                                                                                                                                                                Sleep

                                                                                                                   ECONOMIC ENVIRONMENT
Data Collection                                                                                                      Educational Attainment
                                                                                                 Institutional           Employment
The CHNA collected information on the health of San Franciscans via                                                         Income
                                                                                                  Policies &
three methods:                                                                                     Practices          Occupational Safety
                                                                                                                   SERVICE ENVIRONMENT                    Psychosocial
   • Community Health Status Assessment                                                         Public Policies         Health Care                        Factors
                                                                                                 Organizational
   • Assessment of Prior Assessments, and                                                         Practices
                                                                                                                        Social Services
                                                                                                                                                               Stress
                                                                                                                           Education                      Lack of Control
   • Community Inclusion.                                                                                                                               Reactive Responding
                                                                                                                                                             Resilience                             Death
Through review of the information provided by these sources, SFHIP
identified San Francisco’s health needs.

Community Health Status Assessment
Health is a state of complete physical, mental, and social well-being and
not merely the absence of disease or infirmity.2 While biology, genetics,                                                     Community                      Health
                                                                               INTERVENTIONS

                                                                                                    Strategic               Capacity Building             Promotion &
and access to medical services are largely understood to play an                                   Partnerships                                            Prevention               Medical
                                                                                                                               Community                                             Care
important role in health, social-economic and physical environmental                                 Advocacy                Organizing Civic                Case
conditions are now known to be major, if not primary, drivers of health.2-4                                                   Engagement                  Management
These conditions are known as the Social Determinants of Health and are
shaped by the distribution of money, power, and resources throughout
local communities, nations, and the world.5
                                                                                                                                       EVIDENCE BASED POLICY MAKING

San Francisco Health Improvement Partnership                                                                                                                        Community Health Needs Assessment 2019 | 10
Approach

Recognizing the essential role social determinants of health play in   three health equity/parity coalitions, UCSF health          SFHIP Key Informant Group Interview
the health of San Franciscans, the Community Health Status             professions students, and UCSF Clinical and Translational   One focus group was comprised of SFHIP members who
Assessment examined population level health determinant and            Research staff began conducting online searches for         are all subject matter experts. Two series of questions
outcome variables. We used the San Francisco Framework for             published assessment reports for the 2019 CHNA.             were asked, “What are the healthiest characteristics of
Assessing Population Health and Equity, which is a modified                                                                        this community? What supports people to live healthier
version of the Public Health Framework for Reducing Health             For this assessment, the San Francisco Framework            lives?” and “What are the biggest health issues and/or
Inequities published by the Bay Area Regional Health Inequities        for Assessing Population Health and Equity was used         conditions your community struggles with? What do you
Initiative to guide variable selection.3 We ranked and selected        to define “Root Causes” that reflect social determinants.   think creates those issues?”.
available variables based on the Results Based Accountability          Additionally, the Working Group decided to add
criteria for indicator selection — communication power (ability to     incarceration, experience with law enforcement, and         Equity Coalition focus groups
communicate to broad and diverse audiences), proxy power (says         community development/investment to the framework.          Three focus groups were conducted with each of the three
something of central significance), and data power (available                                                                      health equity coalitions in San Francisco: The Chicano /
regularly and reliably), as well as the ability to examine health      Further details on methods used and findings are pre-       Latino / Indigena Health Equity Coalition, The Asian
inequities and current use by stakeholders. Furthermore, we            sented in the Assessment of Prior Assessments page.         Pacific Islander Healthy Parity Coalition, and The African
hosted meetings throughout 2017 to gather feedback on                                                                              American Health Equity Coalition. Using the Technology
indicators from experts and community representatives. In all,         Community Engagement                                        of Participation (ToP) Consensus Method, the question
171 variables were analyzed. We present the results from all                                                                       posed to each focus group was, “What actions can we
                                                                       The goals of the community engagement component of the
analyses in 30 Community Health Data pages.                                                                                        take to improve health?”
                                                                       CHNA are to:

Assessment of Prior Assessments                                           • Identify San Franciscan’s health priorities,          Food Insecure Pregnant Women focus groups
                                                                            especially those of vulnerable populations             Four focus groups were conducted with women who
San Francisco’s community-based organizations, healthcare
service providers, public agencies and task forces conduct health         • Obtain data on populations and issues for which       experienced food insecurity while pregnant. Each focus
                                                                            we have little quantitative data                       group focused on a different group of women: Spanish,
needs assessments and publish reports of their activities for
                                                                          • Build relationships between the community             Chinese, multi-ethnic English speakers, and African
planning and evaluation purposes and to be accountable to
                                                                             and SFHIP                                             American. The question to respond to was, “What actions
those they serve. Our aim in conducting an assessment of these
                                                                                                                                   can we take to improve your food needs?”
assessments and reports is to augment what we know from                   • Meet the regulatory requirements including the IRS
routinely collected secondary health data and primary data                  rules for Charitable 501c3 Charitable Hospitals,
collection through CHNA community engagement activities. We                 Public Health Accreditation Board requirements for     Kaiser led focus groups
hope thereby to gain a better understanding of which communities/           the San Francisco Health Department, and the San       Kaiser conducted four focus groups, one each with
populations in San Francisco have been engaged in health needs              Francisco’s Planning Code requirements for a Health    Kaiser Permanente leadership, Kaiser Permanente staff,
assessment activities; what topics are of concern and interest to           Care Service Master Plan                               Spanish-speaking parents on youth healthy eating and
these communities/populations; and learn about promising and                                                                       active living, and homeless and/or HIV positive youth.
effective approaches to eliciting and addressing these concerns.       The 2019 CHNA includes 4 categories of focus groups:
We included both needs assessments and service reports in our          SFHIP key informant group interview, Equity Coalition       Further details on the methods and findings are available
definition of “assessments” for this assessment.                       focus groups, food insecure pregnant women focus            in the Community Engagement page.
                                                                       groups, and Kaiser focus groups.
Beginning in January 2017, CHNA administrative leads from
the SF Department of Public Health and UCSF and a small
Working Group consisting of members of San Francisco’s

San Francisco Health Improvement Partnership                                                                                                     Community Health Needs Assessment 2019 | 11
Approach

       Health Need Identification                                        Figure A: Consensus development steps
       To identify the most significant health needs in San Francisco
       the SFHIP steering committee met on October 18th, 2018.           1     Individually listing of top health needs

       Participants identified health needs through a multistep
                                                                               Small group discussions on the top health needs to identify
       process. First participants reviewed data and information         2
                                                                               similarities and differences
       from the Community Health Status Assessment, the
       Assessment of Prior Assessments, and the Community                3     Sharing all the health needs identified by the individuals
       Engagement, as well as the health priorities from the 2016
       Community Health Improvement Plan. Then, using the                4     Clustering the similar health needs into themes
       Technology of Participation approach to consensus
       development, participants engaged in a focused discussion         5     Determining a name for the theme, which is the health need
       about the data. Finally, participants developed consensus on
       the health needs. (Figure A) Throughout the process needs               Comparing and discussing new needs with those
                                                                         6
                                                                               from 2012 Community Health Improvement Plan
       were screened using pre-established criteria (Figure B).
       Thisprocess yielded two foundational issues and five
       health needs.
                                                                         Figure B: Health need screening criteria
       Foundational issues are needs which affect health at
                                                                         Health need is confirmed by more than one indicator and/or data source
       every level and must be addressed to improve health in
       San Francisco.                                                    Need performs poorly against a defined benchmark(s)

                                                                        Health needs include health outcomes of morbidity and mortality as well as
       The two foundational issues identified were:                     behavioral, environmental, clinical care, social and economic factors that impact
                                                                        health and well-being.
          • Poverty
          • Racial health inequities

       The five health needs identified were:
          • Access to coordinated, culturally and linguistically
             appropriate care and services
          • Food security, healthy eating, and active living
          • Housing security and an end to homelessness
          • Safety from violence and trauma
          • Social, emotional, and behavioral health

       Data describing part of each of the foundational issues and
       health needs are located in the Major Findings pages and in
       the various Community Health Data pages.
                                                                                                                                                            PHOTOGRAPHY: PHOTOEVERYWHERE / STOCKARCH.COM

San Francisco Health Improvement Partnership                                                                                                                     Community Health Needs Assessment 2019 | 12
San Francisco Snapshot

Population Growth                                               growth in California (6 percent).2 By 2030, San Francisco’s   children is projected to rise.2,5 As of 2017, San Francisco is
San Francisco is the cultural and commercial center of the      population is expected to total more than 980,000.            home to 67,740 families with children, 26 percent of which
Bay Area and is the only consolidated city and county                                                                         are headed by single parents.5 There are approximately
jurisdiction in California. At roughly 47 square miles, it is   An Aging Population                                           132,330 children under the age of 18.2 The number of
the smallest county in the state, but is the most densely       The proportion of San Francisco’s population that is 65       school-aged children is projected to rise by 24 percent by
populated large city in California (with a population density   years and older is expected to increase from 17 percent in    2030.2 The neighborhoods with the greatest proportion of
of 17,352 residents per square mile) and the second most        2018 to 21% in 2030; persons 75 and over will make up         households with children are: Seacliff, Bayview Hunters
densely populated major city in the US, after New York City.1   about 11% of the population.2 At the same time, it is         Point, Visitacion Valley, Outer Mission, Excelsior, Treasure
                                                                estimated that the proportion of working age residents (25    Island, and Portola (all over 30%).1
Between 2011 and 2018 the population in San Francisco
grew by almost 8 percent to 888,817 outpacing population        to 64 years old) will decrease from 61 percent in 2018 to
                                                                56 percent in 2030. This shift could have implications for     Ethnic composition by percentage of
                                                                the provision of social services.                              population, SF, 2010 – 30
 Population by age group as a percentage of
 the total population projections, SF, 2010 – 30
                                                                Ethnic Shifts                                                                     3.1       3.5              3.9
                                                                Population growth is expected for all races and ethnicities
                                                                                                                                         15.1              15.1             14.8
            14                17
                                                                except for Black/African Americans who are projected to                                             0.3                  0.3
                                                21              drop from 4.9 percent of the population in 2018 to 4
                                                                percent in 2030.3 Asians and Whites will remain the                               0.3
                                                                most populous groups and will grow as a percentage
                                                                of the overall population. Population growth is expected                 33.2              33.7              34
                                                                to be lower for Latinx and Pacific Islanders and Latinx
                                                                are expected to drop from 15.1 to 14.8 percent of
            63                                                  the population.
                              61                56                                                                                        5.8     0.2       4.9      0.2         4        0.2
                                                                Currently, 35 percent of San Francisco’s population is
                                                                foreign born and 20 percent of residents speak a
                                                                language other than English at home and speak English
                                                                less than “very well.”1,4 The majority of the foreign born               42.3              41.9             42.5
                                                                population comes from Asia (65 percent), while 18
            10                 7                 8              percent were born in Latin America, making Chinese
                                                                (Mandarin, Cantonese, and other) (43 percent) and
            9                 10                11
                                                                Spanish (26 percent) the most common non-English
            4                  5               4                languages spoken in the City.4                                           2010              2018             2030
          2010              2018             2030
                                                                                                                                Multi-ethnic, Latinx, Pacific Islander, Asian,       Native
                                                                Families and Children                                         American, Black/African American, White.
Groups by age range in years: Seniors (65+), Working Adults
(25 – 64), College Age (18 – 25), School Age (5 –17),
                                                                Although San Francisco has a relatively small proportion of
  Preschool Age (0 – 4).                                        households with children (19 percent) compared to the
                                                                state overall (34 percent), the number of school-aged

San Francisco Health Improvement Partnership                                                                                                   Community Health Needs Assessment 2019 | 13
San Francisco Snapshot

San Francisco Neighborhoods and Zip Codes, 2014

                                                                                                                                                                                                           94130
                                                                                                                        Treasure
                                                                                                                        Island
                                                                                                                                                                                              94111

                                                                                                                                                                                                  94108
                                                                                                                                                             94123                94133            94104
                                                                                                                                             94129
                                                                                    North
                                                                                    Beach
                                                                                                          Chinatown                                                      94109
                                                             Marina          Russian                                                                                                      94105
                               Presidio                                      Hill                                                                            94115
           Seacliff
                                                                                                                                              94118
                                                         Pacific Heights                                                           94121                                      2
                                                                                Nob Hill        Financial                                                                  10
                                            Presidio
                                                                                                District/                                                                94
                                                                                                South Beach                                                                       94103
   Lincoln Park                  Inner    Heights            Japantown        Tenderloin                                                               94117
                                   Richmond                      Western
      Outer Richmond                          Lone               Addition
                                              Mountain                                    South of                                                                                        94107
                                               /USF              Hayes Valley                                                        94122                       94114
                                                                                          Market

            Golden Gate Park                      Haight
                                                                                                Mission Bay                                                                   94110
                                                  Ashbury
                                                                Castro/
                                                                Upper                                                                94116
                                                                Market       Mission                                                                             94131
                                 Inner Sunset
                                                                                                 Potrero Hill                                    94127
       Sunset/Parkside                           Twin                                                                                                                                      94124
                                                 Peaks
                                                             Noe Valley

                                                                                                                                    94132
                                                                                Bernal                                                                     94112              94134
                                                                                Heights
                                West of Twin Peaks           Glen Park

                                                                                                     Bayview Hunters Point
                                                                                    Portola
                                                           ion

                  Lakeshore
                                                         iss
                                                         M

                                   Oceanview/
                                                     ter

                                                                            McLaren
                                   Merced/
                                                    Ou

                                                                            Park
                                   Ingleside
                                                           Excelsior
                                                                                  Visitacion
                                                                                  Valley

San Francisco Health Improvement Partnership                                                                                                                     Community Health Needs Assessment 2019 | 14
Major Findings
                                                The 2019 Community Health Needs Assessment identified
                                                two foundational issues and five health needs.

                                                The following infographics highlight aspects of each issue
                                                and need.

                                                Foundational Issues
                                                Poverty...................................................................16

                                                Racial and Ethnic Inequality......................................17

                                                Health Needs
                                                Access to Coordinated, Culturally, and Linguistically
                                                Appropriate Care and Services....................................20

                                                Food Security, Healthy Eating, and Active Living...........21

                                                Housing Security and an End to Homelessness.............24

                                                Safety from Violence and Trauma................................26

                                                Social, Emotional, and Behavioral Health....................30

San Francisco Health Improvement Partnership                                            Community Health Needs Assessment 2019 | 15
Major Findings                                                          Poverty
Foundational Issues

Income generally confers                        Household Income                                                                                                     Income Inequality
access to resources that                                                                                                                                             and Health
promote health — like                                                                                                                                                San Francisco has the
good schools, health                                                                                                                                                 highest income inequality
care, healthy food, safe                                                                                                                                             in California.
neighborhoods, and time                                                                                                                                              The wealthiest 5% of households
for self care — and the                                                                                                                                              in SF earn 16 times more than the
ability to avoid health                                                                                                                                              poorest 20% of households.9
hazards — like air
pollution and poor                                                                                                                                                   Low income impacts
                                                                                                                                                                     lifetime health, beginning
quality housing.                                                                                                                                                     with pregnancy and birth.
Low income groups are at greater                                                                                                                                     Lower-income children in San
risk of a wide range of health                                                                                                                                       Francisco experience higher rates
                                                                                                                                                                     of asthma, hospitalization,
conditions than higher income                   Almost 1 in 4 (22%) San Franciscans live below 200% of the federal poverty level.3                                   obesity, and dental caries.10-12
groups, and have a shorter
life expectancy.1                               For a family of four,     A family of four in             40% of new jobs in           18% of children               Low-birth weight is highest among
                                                200% of the               San Francisco, requires         San Francisco are            under 6 years of age          low-income mothers.13
People who live in communities                  Federal Poverty           an income of greater            expected to be low           in San Francisco live
with higher income disparity are                Level is $50,200.4        than $120,000 to meet           wage (
Major Findings                                       Racial and Ethnic
Foundational Issues                                  Inequality

Two types of racialized social                        Improvements
interaction, interpersonal and                        For Black/African Americans improvements are seen in some social determinants and some health conditions.
structural racism, play a role the                    However, the improvements do not always impact the inequity as other groups may experience greater gains.
racial health disparities seen in
San Francisco.
                                                       Indicator         Who Better for...

Racial discrimination in interpersonal                                   Between 2007 and 2016 the teen birth rate for first time moms decreased from 34% to 10% among Black/African
behavior, often called everyday racism or bias,        Teen Birth        American women in San Francisco.2 In that same time, the proportion of mothers who had a college education
                                                                         when they delivered their first baby increased by 16 percentage points.2
sets the kind of experiences that make up the
social lives of people of color. The accumulation                        Mortality rates decreased for all in San Francisco. However, rates decreased the most for Black/African Americans
of those experiences has been associated with                            (15%) (vs. 11% for Pacific Islanders, 12% for Whites, 14% for Asians and Latinx). Decreased rates among Black/African
increased hypertension, preterm birth and other        Mortality         Americans were primarily due to decreases in ischemic heart disease, lung cancer, Assault, and HIV..17
conditions mediated by stress.                                           Life Expectancy also grew for all San Francisco with the largest gains seen by Black/African Americans. (+3 years
                                                                         between 2005 s–2007 and 2015 –2017 vs +2 years for others).
Long-standing social and institutional
rules, both historic and current,                      High School       Graduation rates increased for all between 2012 and 2017. The biggest gains were seen among Black/African Americans
determine which spaces and resources                   Graduation        (8%), and Pacific Islanders (12%) while rates for Latinx (4%), Whites (3%) and Asians (4%) were more modest.3
are available to marginalized groups. The
disparate treatment of children based on race in       Childhood         Between 2007–2012 and 2012–2017, rates of untreated tooth decay among kindergarteners decreased the
schools and courts is an example of these forces.      Caries            most for Black/African Americans (26% to 19%).8

So are the historic differences in family wealth
that stem from government housing policy and
private banking rules. These forces are often
                                                      Population Loss
intertwined and reinforcing as they occur over the
life-course.                                          Between 1990                                                                                          Between 1990 and 2005,
                                                      and 2005, the                                                                                         the proportion of very low
                                                      Black/African                                                                                         income households
Racial inequities are not just a                      American                                                                                              increased from 55%
matter of unfortunate history,                        population                                                                                            to 68%.18
but of on-going, correctable                          decreased by
injustice.                                             41% from
                                                      almost 79,000
                                                                                                                             The strong association between poverty
                                                      to less than                                                           and health would suggest that the poorer
                                                      47,000.                                                                remaining Black/African American population
                                                                                                                             is more likely to have poor health than the
                                                                                                                             previous more mixed-income population.

San Francisco Health Improvement Partnership                                                                                                 Community Health Needs Assessment 2019 | 17
Major Findings                                                      Racial and Ethnic
Foundational Issues                                                 Inequality

                                                 Prebirth/Infancy                                   Childhood                                              Adolescence
            Basic
      Requirements                                                                      Adequate income, Engaged with school,                              Mistakes corrected
       for a healthy                                Healthy Diet
                                                                                          Social network, Adequate housing,                              Schools well-resourced
         life span                                  Prenatal care
                                                                                                  Healthy diet, Safety                                      School success

                                                                                                                                           Student Proficiency
         Children 0 –18 Living in Poverty3
                                                                                                                                           Black/African American Students
         50
                          Black/African                                                                                                    13% are proficient or above in mathematics,
                         American 46%                                                                                                      19% in English language arts.5
         45
         40                                                                                                                                Latinx students
         35                            Pacific                                                                                             22% of are proficient in math,
         30                           Islander                                                                                             28% in English language arts.
                                        27%
         25
                                                              Latinx                        K–3 Suspensions                                Pacifica Islander Students
         20                                                                                                                                19% of are proficient in math,
         15
                                                              15%                                  2.4%                                    25% in English in Mathematics.
                                                   Asian
                                                                                suspension rate for Black/African Americans
         10                                        10%
           5
                 White                                                                           vs 0.1%                                   White Students
                  3%                                                                     for White SFUSD Students 4                        70% are proficient in Mathematics,
           0                                                                                                                               77% in English language arts.

                                                           Hurdles to a healthy life start early in San Francisco

                                                                                                              Nutrition                         5th Grade Obesity4

                                                                        Food insecurity among                                                                 Black/African American
                                                                                                                                                75%
                                                                        pregnant women in                                                         80                Filipino
                                                                        San Francisco1                                                            70                       Latinx
                                                                                                                                                                                       Pacific
                                                                                                                                                50%               65          66
                                                                         26.5% among Latinx women                                                 60                                   Islander

                              86%                                        19.5% a mong Black/African
                                                                                                              Black/African American and          50
                                                                                                                                                  40
                                                                                                                                                             52         52          White
                                                                                    American women            Latinx SFUSD students are         25%                                         Asian
                                                                                                              2–3 times more likely to            30
                                                                         6.6% a mong Asian and               consume fast food (64%,             20
                                                                                                                                                                                    22 23
  Full-Term Birth                                                                 Pacific Islander women      73%), or soda (44%, 36%)            10
  Full term birth more likely for Whites (93%)                                                                                                  0%
                                                                          Almost no White women in            at least weekly, as compared           0
  than Black/African Americans (86%).2                                    San Francisco report food           to White students (fast food      ■ Black/African American ■ Filipino ■ Latinx
                                                                          insecurity during pregnancy.        (35%) and soda (17%). 6           ■ Pacific Islander ■ White ■ Asian

San Francisco Health Improvement Partnership                                                                                                Community Health Assessment & Profile 2019 | 18
Major Findings                                                       Racial and Ethnic
Foundational Issues                                                  Inequality

                                                   Adolescence                                                   Adulthood                                                           Old Age
           Basic
      Requirements                                 Mistakes corrected                                      Employment, Stable housing                                               Active lifestyle
      for a healthy                              Schools well-resourced                                    Active, Healthy childbearing                                             Independence
        life span                                   School success                                                   Freedom                                                           Long life

Juvenile Detentions                                                   Unduplicated                            Educational Attainment 2012 –20163                                                         ■B
                                                                                                                                                                                                           achelor’s Degree
                                                200                   Account of Juvenile                       80
                                                                                                                                                                                                           or higher.
Black/African American youth make up
                                                                      Hall Bookings
over 57% of bookings at juvenile hall                                                                           70                                                                                       ■ S ome College
                                                150                   — Criminal Offenses                       60                                                                                         or Associates
even though they make up only 6% of                                   by Ethnicity, 2017                        50                                                                                         Degree.
the population.9
                                                100                                                             40
                                                                                                                                                                                                         ■H
                                                                                                                                                                                                           igh School
Together Black/African American and                                                                             30
                                                                                                                                                                                                           Diploma or GED.
Latinx youth comprise 86% of all                 50                                                             20
juvenile bookings. Samoan youth are                                                                             10                                                                                       ■ L ess than a High
                                                   0                                                                                                                                                       School Diploma
also over-represented and make up 3%                                                                             0
of the bookings, but only account for           ■ Black/African American ■ Latinx ■ Samoan                           SF       Whites      Latinx         Black/      Asian      Native   Pacific
                                                                                                                                                         African               American Islander
less than 1% of the youth population.           ■ Pacific Islander ■ White ■ Chinese                                                                    American

   The starkest inequities are seen between Black/African American residents and all other groups, and occur across the lifespan.

Median Household Income                                                       Homelessness                                 Heart
The median income in San Francisco varies greatly by                  Black/African Americans are                          Disease                                        2005-2007                      2015-2017
race/ethnicity. Typically, Whites earn 4x more than                   over-represented among the                           Heart Disease
Black/African Americans in San Francisco.3                            homeless in San Francisco.                           impacts
                                                                                                                                                                    All                            All
                                                                                                                           Black/African
$120,000
                                                                                                              Americans at younger
$100,000                                                                                                      ages. Rates of heart                 All             80.8      84.0      77.6      83.1        86.1       80.3
  $80,000                                                                           35%                       disease related
                                                                                                                                                   Asian           85.1      87.5      82.4      87.0        89.6       83.9
                                                                          of the homeless persons are         hospitalizations among
  $60,000
                                                                            Black/ African American           Black/African Americans              B/AA            68.5      73.7      64.2      72.1        76.5       68.3
  $40,000                                                                                                     in their 40s and 50s
  $20,000
                                                                                    22%                       are comparable                       Latinx          82.7      85.8      79.4      85.1        87.9       82.5
                                                                            are Latinx compared to            to those seen in
         0
                                                                              5% and 15%,                     other races/                         PI              73.4      77.0                76.0        76.8       75.5

■ SF ■ White ■ Latinx ■ Black/African American                                    respectively,               ethnicities over                     White           79.7      83.1      76.9      81.7        84.2       79.6
■ Native American ■ Asian ■ Pacific Islander                                 of the city overall.   3,10      75 years of age.7

San Francisco Health Improvement Partnership                                                                                                                      Community Health Assessment & Profile 2019 | 19
Major Findings                                                         Access to Coordinated, Culturally
                                                                       and Linguistically Appropriate
Health Needs                                                           Care and Services

Healthy People                          Many San Franciscans do not access health care                                                                                   Language barriers
2020 defines access                                                                                                                                                      and cultural competency
                                        San Francisco’s population now numbers over 850,000 people.
to health care as                                                                                                                                                        of services are serious
“the timely use of                                  Fewer insured
                                                                                                                                                                         barriers to receiving
personal health                                   Over 10,000 fewer
                                                                                                                                                                         quality care.
services to achieve                             San Franciscans were                                                                                                     Increased cultural competence requires
the best possible                           uninsured in 2017 com-                                                                                                       structural and systemic improvements,
health outcomes.”1                          pared to 2015.However,                                                                                                       and can be linked toimprovements in
Access is influenced by                     and estimated... 3.6% of                                                                                                     healthcareaccess, participation, and
                                              residents (31,480) still                                                                                                   patient satisfaction.10-11
availability of providers,
                                                   do not have health
location, affordability, hours,
                                                         insurance.3-4
                                                                                                                                                                         From the community
and cultural and linguistic                                                                                                                                              we heard…
appropriateness of health                   8%            24%              51%                   54%                 15%            27%             82%                  “Cultural competency doesn’t happen
care services. Accessible                do not have      of adults       have not          of women ages        of women with     of adults     of Denti-Cal            with just a class or a one-day training.”
                                        a usual place   have not had      had a flu        18 – 44 have not       public safety    have not     eligible infants
health care can prevent                    to go for      a routine      shot in the    received counseling or    net insurance     seen a       aged 2 years            “Healthcare professionals need to be
disease and disability, detect             medical      check-up in      past year.5   information about birth   do not receive    dentist in      or less do            from the community and actually know
                                            care.5        the past                       control from a doctor        timely       the past       not access
and treat illnesses, maintain                               year.5                        or medical provider    prenatal care.6     year.5      dental care.7           the culture of the community.”
quality of life, and extend                                                                in the past year.5
                                                                                                                                                                         “Community-based organizations serve
life expectancy.2                                                                                                                                                        a critical role in small, datasparce
From a population health                                                  Young                                                                                          cohorts, by informing public health
                                                                       adults are        Young adults 18 to 34 years of age and people                                   efforts and bringing resources to
perspective, regular access
                                                                          at risk.       of color are less likely to be covered by insurance.4                           multicultural communities.”
to quality health care and
primary care services also
reduces the number of
unnecessary emergency                                              Different Levels                              Preventable Hospitalizations and Emergency Room Visits
room visits and hospitaliza-                                       of Prenatal Care
                                                                                                                 While preventable hospitalizations for most causes have
tions and can save public
                                                                  In 2013-15, >    99%        of mothers
                                                                                                                 decreased over time, preventable hospitalizations for hyperten-
and private dollars.                                              with private insurance received                sion and diabetes have respectively increased 45% and 50%
                                                                  prenatal care in the first trimester.6         between 2011 and 2016 —  potentially indicating these
While access to health care                                                                                      conditions are not being well managed at the population level.8
in San Francisco is better                                        Only   86%     of those with Medi-Cal
                                                                  received early prenatal care.6
than many other places,                                                                                          Preventable hospitalizations and ER visits are
significant disparities exist                                     Residents covered by public                    significantly higher among Black/African
by race, age, and income.                                         safety net insurance do not                    Americans and Pacific Islanders compared to
                                                                  receive preventative care at                   all other ethnicities in San Francisco.9
                                                                  the same rate as those with
                                                                  private insurance.

San Francisco Health Improvement Partnership                                                                                                                      Community Health Needs Assessment 2019 | 20
Food Insecurity,
Major Findings                                                         Healthy Eating,
Health Needs                                                           and Active Living

                                                             Many in San Francisco are food insecure                                                                 Many in
                                                                                                                                                                San Francisco do
                                                       50%                       20 –30%                          50%                                           not eat and drink
                                            of low income residents        of Black/African American   of SFUSD students                                            healthily
                                             surveyed in SF report        and Latinx pregnant women     qualify for free or
                                                 food insecurity.6             are food insecure.5   reduced-price meals.9

                                                           Over 100,000 food insecure adults and seniors
Good nutrition means
                                                         are eligible to receive meals, groceries or eating vouchers.
getting the right
amount of nutrients                                           Services to ameliorate food insecurity
from healthy foods                                                    are not meeting need                                            2 out of 3 pregnant women in the WIC
and drinks. Good
nutrition is essential                                                                                                                Eat SF program and 2 out of 3 youth do not
                                                        70%                          -7%                         1,969                eat 5 or more servings of fruits or vegetables daily.5
from infancy to                                Percentage of eligible       Decrease in the number The number of meals
old age.                                    students not participating          of food vendors        denied Seniors and
                                              in the Summer Lunch            authorized to acccept persons with disabilities          Some San Franciscans do
The USDA’s MyPlate.org                                                                                                                not drink enough water
                                                     Program.                   food stamps.14     at congregate meal sites.6
recommends that fruits and
vegetables make up at least half
of our plate, or approximately
                                                21 days/187 days The number of days seniors/persons with                                           614
                                                disabilities must wait to start getting home delivered meals.6                                     people were
five servings a day.1
                                                616 The number of persons waiting for enrollment at a food pantry.      33
                                                                                                                                                   hospitalized for
                                                                                                                                                   “potentially preventable”
Leading medical and health
associations recommend                                                                                                                             dehydration in 2016.7
drinking water instead of sugary
                                                 The USDA has designated the Oceanview, Merced,
drinks.2 The institute of                                                                                                             Many do drink sugary drinks.Two thirds
                                                 Ingleside, Bayview Hunters Point, Visitation Valley
Medicine recommends 13 cups                                                                                                           of high school students and one third
                                                 and Treasure Island neighborhoods as areas of low
of liquids per for men and 9                                                                                                          of young adults regularly consume soda.8
                                                 food access.10
cups for women who live in
temperate climates.3
                                                Facilities                                           Barriers to drinking enough water include limited access to               Not all have
A healthy diet promotes health                  necessary to                                         bathroom facilities. 31-32 San Francisco operates 28 public               a kitchen to
and reduces chronic disease                     eat and drink                                        restrooms that are open all day, which amounts                            cook in. Over
risk. It is critical for growth,                healthily are                                        to 3.3 restrooms per 100,000 residents.13                                 21,000 occupied
development, physical and                       not available                                                                                                                  housing units in
cognitive function, reproduc-                   for all                                                                                                                        San Francisco do
tion, mental health, immunity,                                                                            The Mission, Bayview Hunters Point and Treasure                      not have complete
stamina, and long-term                                                                                    Island districts each have only one public                           kitchen facilities.
good health.4                                                                                             access drinking water fountain.12

San Francisco Health Improvement Partnership                                                                                                        Community Health Needs Assessment 2019 | 21
Food Insecurity,
Major Findings                                                     Healthy Eating,
Health Needs                                                       and Active Living

Regular exercise                                Many San Franciscans don’t spend              Many San Franciscans don’t meet activity standards
extends lives.                                  the recommended amount of time                In San Francisco about 30% of 5th and 7th graders
                                                      doing physical activity
The World Health Organization                                                                 and 40% of high school students do not meet the
(WHO) recommends that                                         1 out of 2                      Fitnessgram standard for aerobic capacity, which is
children and adolescents, age               (56%) adults does not walk at least 150 min       ability to run one mile or pass a PACER test.
5 to 17 years, should do at                   per week for transportation or leisure.18
least one hour of moderate-to-                                                                60 percent of Black/African American
vigorous physical activity daily,                             1 out of 2                      and Latinx 9th graders, do not meet the
while adults, age 18 years and              (47%) children ages 3–5 years in child care       fitness standards, compared to 30% of White
above, should do at least 150                  centers are not physically active for          and Asian students. 27
minutes of moderate-intensity                       90 min per school day.19
physical activity, 75 minutes of
vigorous-intensity physical                                   2 out of 3
                                                  (67%) middle schoolers do not spend
activity, or an equivalent
                                                60 min per day each day of the week doing                             Aerobic fitness is
combination of moderate and
                                                            physical activity.20                                      10 percentage points
vigorous activity throughout                                                                                          lower for economically
the week.15                                                   4 out of 5                                              disadvantaged students 27
Just 2.5 hours of                                 (83%) high schoolers do not spend
moderate intensity                                60 min per day each day of the week
aerobic physical                                       doing physical activity.20
activity each week is
                                                                Each day,
associated with a gain of                                    4.5 million
approximately three                                      transportation trips are
years of life.16                                         made in San Francisco.
Walking is a simple, affordable
way for people to get around.
                                            Of these, only about 37% are walking trips
A walkable city provides a free
                                           or public transit trips which include walking.21
and easy way for people to
                                                                                                                               14% percent of adults ages
incorporate physical activity
                                                                                                                               65-75 and 37% of adults
into their daily lives as they
walk to work, to school,                                                                                                       over age 75 have difficulty
to the market, to transit or                                                                                                   walking or climbing stairs.28
other nearby services, or
just for fun.17

San Francisco Health Improvement Partnership                                                                                     Community Health Needs Assessment 2019 | 22
Major Findings                                         Food Insecurity,                                                           59% of adults do not
                                                       Healthy Eating,                                                            feel safe walking alone
Health Needs                                           and Active Living                                                          in their neighborhood
                                                                                                                                  at night. 25

Safety, and a lack                              Every day, on average 2 people
of resources and                                walking are hit by cars
other supports                                      Cars violating a pedestrian’s right-of-way is the
are barriers to                                     top risk factor for injuries to people walking.
physical activity                                   In 2018, there were 15 pedestrian
in San Francisco                                    deaths and 3 cyclist deaths.22-23

                                                                                                        There are gaps               There are gaps in school and
Vision Zero High Injury Network                                                                         in neighborhood              workplace supports for
2017 Update San Francisco California 21                                                                 resources for                physical activity
                                                                                                        physical activity
                                                                                                                                     2 out of 3 (67%) child care
                                                                                                        Sidewalk networks            centers do not use physical activity
                                                                                                        support walkers to           curriculum.29
                                                                                                        varying degrees.
                                                                                                        Downtown and in                 All of our students, regardless of
                                                                                                        Chinatown, the blocks           which neighborhood they live in or
                                                                                                        are short and provide           which school they attend, should
                                                                                                        many pedestrian                 be able to safely walk or bike to
                                                                                                        connections. In other           school. We are adding crossing
                                                                                                        neighborhoods,                  guards across the City and I am
                                                                                                        pedestrians have to walk        pushing the SFMTA to expedite
                                                                                                                                        Vision Zero projects because we do
                                                                                                        further to make less
                                                                                                                                        not have time to waste. We need
                                                                                                        direct connections.34
                                                                                                                                        safer, more livable streets now.”
                                                                                                        35% of San Francisco            — mayor london breed 23
                                                                                                        playgrounds do not
                                                                                                        score an A or B for          Although each April, more than
                                                                                                        infrastructure quality,      10,000 people participate in Walk to
                                                                                                        cleanliness and              Work Day, including San Francisco’s
                                                                                                        upkeep.26                    Mayor and Supervisors, over
                                                                                                                                     200,000 workers drive to
                                                                                                                                     work on a daily basis.30

   SF has 0.18 miles of bike lane for every 1 mile of streets.24

San Francisco Health Improvement Partnership                                                                                 Community Health Assessment & Profile 2019 | 23
Housing Security
Major Findings                                                                       and an End to
Health Needs                                                                         Homelessness

                                                         Shelter is a basic human need                                                         Homelessness
                                                                                                                                               In 2017, about 7,500 homeless persons were
                                                         Housing is foundational to meeting people’s most basic                                counted in San Francisco.7 Despite making up
                                                         needs. Quality housing provides a place to prepare and store                          only 6 percent of the general population, 35%
                                                         food, access to water and sanitation facilities, protection                           of the homeless persons counted
                                                         from the elements, and a safe place to rest. Stable/                                  were Black/African American.
                                                         permanent housing can also provide individuals with a sense
                                                                                                                                               Among the many challenges homeless persons
                                                         of security. Unfortunately, California, and especially the Bay                        face, including those in temporary housing, are: 8-9
                                                         Area, suffers from an acute housing shortage which has been
                                                         driving housing costs to unaffordable levels, leading an                              •Safely storing medications
                                                         increasing number of residents to become homeless.1                                   •Eating healthfully
                                                                                                                                               •Finding a job
Housing production has declined in the Bay Area
                                                                                                                                               •Maintaining relationships
Between 2011 and 2015, the Bay Area added 501,000 new jobs — but only 65,000 new homes.2                                                       •Going to the doctor

  Housing Production Decline in the Bay Area, 1970 – 2015

 500,000

 450,000

 400,000

 350,000                                                                                                                                       Overcrowding
 300,000                                                                                                                  San Francisco        An estimated 24,000 people
                                                                                                                          usually exceeds      in San Francisco live in crowded
 250,000
                                                                                                                          requirements for     conditions.4
 200,000                                                                                                                  development of
 150,000                                                                                                                  above moderate-                                         Living in

 100,000                                                                                                                  income housing                                          overcrowded
                                                                                                                          (120% AMI), but                                         conditions can
   50,000                                                                                                                                                                         increase risk
                                                                                                                          builds less than a                                      for infectious
             0                                                                                                            third of the units                                      disease.5
                     1970 –1980                  1980 –1990         1990 –2000      2000 – 2010     2010 – 2015           allocated for
   Rest of Bay Area   San Mateo & Santa Clara (except San Jose)    San Jose    Marin & Napa                               moderate and
   Outer East Bay, Solano, Sonoma    Inner East Bay    San Francisco city    Bay Area 2020                                low-income
Source: SF Planning Analysis of US Census and ACS Data                                                                    residents.3

San Francisco Health Improvement Partnership                                                                                                          Community Health Needs Assessment 2019 | 24
Housing Security
Major Findings                                                 and an End to
Health Needs                                                   Homelessness

Housing Affordability                                               Percent of                            0 –14.2%
Between 2010 and                                                    renter
                                                                    households                           14.3 –18.3%
2018, the median
market rate rent for                    +48%                        whose rent is
                                                                    50% or more
                                                                                                         18.4 – 22.9%
                                                                                                          23 – 29.5%
a 2–bedroom unit                                                    of their
                                                                                                          29.6 – 61.1%
increased 48%                                                       household
                                                                    income                                Excluded due
to $4,725.10                                                                                              to small sample
                                                                                                          size

                                 It
                              would
                               take

4 full-time minimum wage jobs to afford a
“fair market rate” ($3,121) 2–bedroom unit 11                                                                                          Nearly one-third of
                                                                                                                                       Chinatown residents
6 full-time minimum wage jobs to afford a                                                                                              live in overcrowded
“median market rate” ($4,725) 2–bedroom unit 10                                                                                        conditions.12

                                                                    Evictions
                                                                    There had been a steady increase in the number of all-cause eviction notices between
                                                                    2011–2016; however, in 2017 there was a 27% decrease in the number
                                                                    of eviction notices filed.6 This rapid change may be attributable to the implementation
                                                                    of Eviction Protection 2.0 in November 2015, as well as economic shifts and other factors.

                                                                                                                                                     27%
                                                                    Moving can result in: 5
          The median percent of income paid to gross rent in
                San Francisco was 30% in 2017.
                                                                    •Loss of employment
          17% of renter households spend 50% or more                •Difficult school transitions
                      of their income on rent.4                     •Increased transportation costs
                                                                    •Loss of health protective social networks
San Francisco Health Improvement Partnership                                                                                         Community Health Assessment & Profile 2019 | 25
You can also read