Municipal Energy Plan - Plug into a Smart Energy Future - vaughan.ca/Environment - the City of Vaughan
←
→
Page content transcription
If your browser does not render page correctly, please read the page content below
City of Vaughan

Municipal Energy Plan
       Plug into a Smart Energy Future

                     vaughan.ca/Environment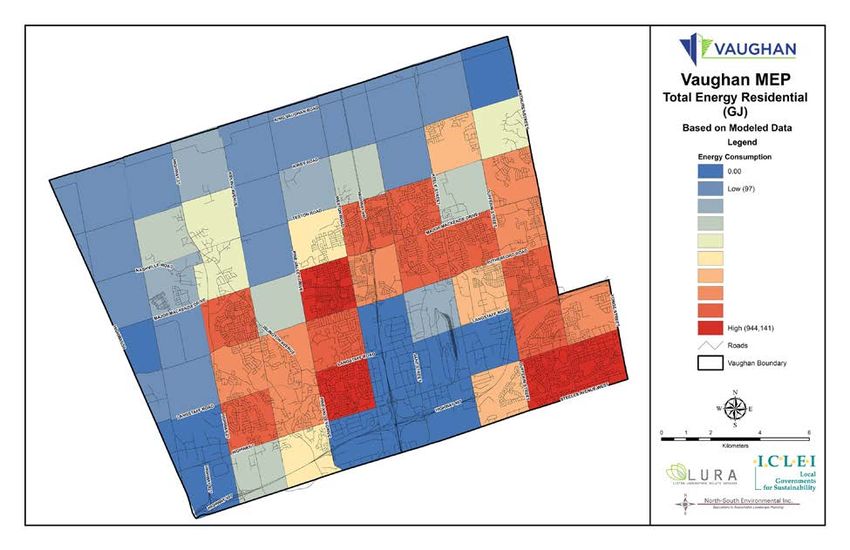
This report can be cited as:
City of Vaughan. 2016. Vaughan Municipal Energy Plan: Plug into a Smart Energy Future. June
2016.

This report was prepared by LURA Group and ICLEI Canada.

Funding/Financial Support
The preparation of this Municipal Energy Plan was carried out with assistance from the Ministry
of Energy and administered through the Municipal Energy Plan Program. Notwithstanding this
support, the views expressed are the personal views of the authors, and the Ministry of Energy
accepts no responsibility for them.

The Municipal Energy Plan is based on the Community Climate Action Plan, which was
approved by Council of the City of Vaughan in 2014. The Community Action Plan was partially
funded by the Green Municipal Fund of the Federation of Canadian Municipalities

© 2016 City of Vaughan. All Rights Reserved.
Vaughan Municipal Energy Plan                                               June 2016

Acknowledgments
Municipal Energy Plan Stakeholder Advisory Group
Lauren Bates, Smart Commute                   Jamie Paris, Enbridge Gas Distribution
Paula Bustard, SmartCentres                   Neetika Sathe, PowerStream
Jacqueline Candaras, DG Group Development     Dan Ruby, City of Vaughan
Kyle Catney York Region Transit               Derek Satnik, Mindscape Innovations Group
Kathleen Cea, PowerStream                     Pierre Schipper, York Region District School
Teresa Cline, Regional Municipality of York   Board
Sandro Costa, Avacos Clean Energy             Riaz Shaikh, PowerStream
Lucy Cummings, Greening Sacred Spaces         John Sherin, PowerStream
Luisa Da Rocha, Independent Electricity Brian Shifman, Vaughan Chamber of
System Operator                               Commerce
Bala Gnanam, BOMA Toronto                     Tim Short, Enbridge Gas Distribution
Gabriella Kalapos, Clean Air Partnership      Anna Sicilia, City of Vaughan
Adrian Kawun, York Region Transit             John Smiciklas, BOMA Canada
Gerry Lynch, Cole Engineering                 Bronwen Smith, Independent Electricity
Rick Mangotich, Fieldgate Developments        System Operator
Gloria Marsh, York Region Environmental Mary Sye, Enbridge Gas Distribution
Alliance                                      Kim Taylor, Lormel Homes
Doug McBoyle, Canada’s Wonderland             Michael Tremayne, Enbridge Gas Distribution
Berne McIntyre, Toronto and Region Norm Vezina, York Catholic District School
Conservation                                  Board
                                              Max Vossough, Liberty Development
Kyle Osborne, RioCan Real Estate

City of Vaughan Project Staff
Tony Iacobelli, Manager of Environmental Sustainability
Chris Wolnik, Manager of Wastewater and Stormwater Services
Elizabeth Linley, Sustainability Coordinator – Energy
Kailyn Smith, Sustainability Coordinator

Lura Consulting
Susan Hall, Project Director
Peter Zerek, Project Manager

ICLEI Canada
Megan Meaney, Energy Advisor
Michael Dean, Climate and Energy Project Coordinator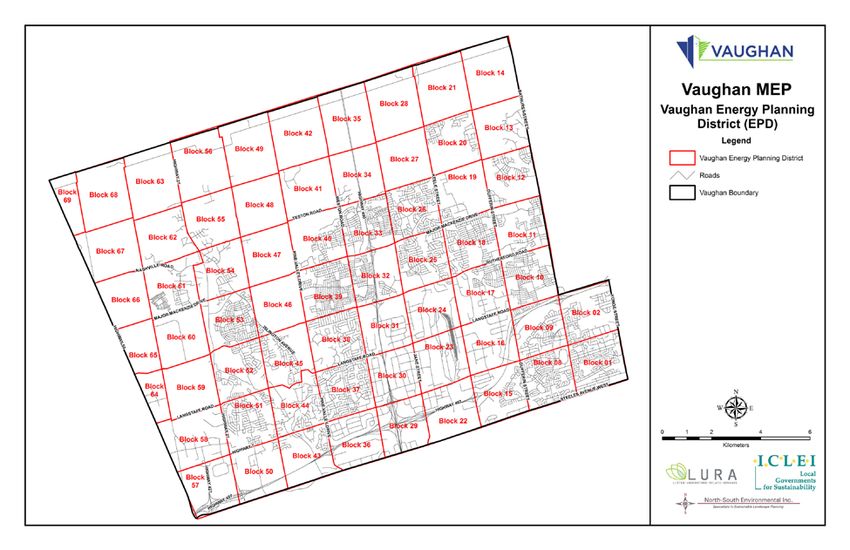
Vaughan Municipal Energy Plan                                                                                                 June 2016

Table of Contents
1     Introduction ............................................................................................................................ 1
    1.1     What is a Municipal Energy Plan? .................................................................................... 1
    1.2     Shifting Context of Energy Planning in Ontario ............................................................... 1
    1.3     Why a MEP for Vaughan?................................................................................................. 2
    1.4     How Does This Plan Align with Other City Plans? ............................................................ 3
      1.4.1        Vaughan Term of Council Priorities .......................................................................... 4
    1.5     How was this Plan Developed? ........................................................................................ 4
      1.5.1        Analyzing Vaughan’s Energy Use .............................................................................. 5
2     Setting Direction for a Smart Energy Future........................................................................... 7
    2.1     Vision ................................................................................................................................ 7
    2.2     CCAP and MEP Mission .................................................................................................... 7
    2.3     CCAP and MEP Goals ........................................................................................................ 7
3     What is Vaughan’s Current Community Energy Profile? ........................................................ 9
    3.1     Vaughan’s Housing Profile ............................................................................................. 10
    3.2     Vaughan’s Baseline Energy Use Profile .......................................................................... 12
      3.2.1        2013 Total Residential Energy Consumption (GJ)................................................... 14
      3.2.2        2013 Total Residential Natural Gas Consumption (GJ) ........................................... 15
      3.2.3        2013 Total Residential Electricity Consumption (GJ) .............................................. 17
    3.3     Energy Mapping Analysis ............................................................................................... 18
    3.4     Vaughan’s Baseline GHG Emissions Profile .................................................................... 19
    3.5     The Economic Impact of Vaughan’s Energy Use ............................................................ 20
4     What is Vaughan’s Energy Future In 2031? .......................................................................... 23
    4.1     The Implications of Business as Usual............................................................................ 23
    4.2     Future Developments..................................................................................................... 27
5     GHG Emissions Reduction Target ......................................................................................... 29
6     Actions and Opportunities to Reach the MEP Target ........................................................... 30
    6.1     Actions and Opportunities At Home .............................................................................. 30
    6.2     Actions and Opportunities At Work ............................................................................... 33
    6.3     Actions and Opportunities On The Move ...................................................................... 35
    6.4     Summary of Actions and Impacts .................................................................................. 39
7     Implementation Framework & Next Steps ........................................................................... 42

                                                                                                                                                    i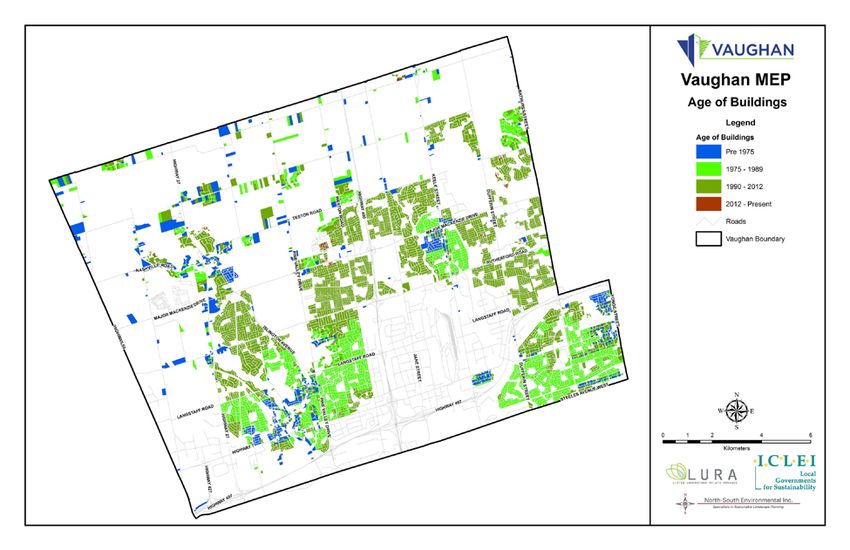
Vaughan Municipal Energy Plan                                                                                             June 2016

   7.1       Roles and Responsibilities .............................................................................................. 42
       7.1.1       Partner with Key Stakeholders for MEP Program Delivery .................................... 42
   7.2       Mobilizing the Community ............................................................................................. 45
   7.3       Resources and Funding .................................................................................................. 45
   7.4       Ongoing Tracking and Monitoring ................................................................................. 45
   7.5       Plan Renewal .................................................................................................................. 46
   7.6       Next Steps ...................................................................................................................... 46

List of Tables
Table 1: Stakeholder Advisory Group Meetings Summary ............................................................. 5
Table 2: Vaughan Building Age Profile .......................................................................................... 10
Table 3: Profile of Vaughan’s Industrial and Commercial Sectors (2006 – 2013) ........................ 13
Table 4: Residential Energy Consumption - Intensity Figures for EPD 1, 8, 37 & 39………………….15
Table 5: Residential Natural Gas Consumption - Intensity Figures for EPD 1, 8, 37 & 39…………..17
Table 6: Residential Electricity Consumption - Intensity Figures for EPD1, 8, 37 &39……………….18
Table 7: Residential Unit Profiles for EPD1, 8, 37 & 39……………………………………………………………..18

List of Figures
Figure 1: Alignment of CAP and MEP with Green Directions Vaughan .......................................... 3
Figure 2: Vaughan Municipal Energy Plan Development Process .................................................. 5
Figure 3: Energy Planning Districts ................................................................................................. 6
Figure 4: Housing Age ................................................................................................................... 11
Figure 5: Vaughan Residential Building Type Profile (2013)......................................................... 12
Figure 6: Energy Use by Source (2013) ......................................................................................... 13
Figure 7: Energy Use by Sector (2013) .......................................................................................... 13
Figure 8: Total Residential Energy Consumption (GJ) (2013) ....................................................... 15
Figure 9: Residential Natural Gas Consumption (GJ) (2013)……………………………………………………..16
Figure 10: Residential Electricity Consumption (GJ) (2013) ......................................................... 17
Figure 11: GHG Emissions by Sector (2013).................................................................................. 19
Figure 12: GHG Emissions by Source (2013) ................................................................................. 19
Figure 13: Energy Costs ($ Millions) (2013) .................................................................................. 21
Figure 14: Vaughan's Energy Expenditure - Where Does the $ Go? ............................................ 22
Figure 15: Vaughan's Energy Expenditure - by Commodity (2013) .............................................. 22
Figure 16: Comparison of 2006 and 2013 BAU GHG forecasts (ktCO2e) (2013-2031) ................. 24
Figure 17: Business-As-Usual Forecast – Energy Consumption by Sector (2013-2031) ............... 24
Figure 18: Business-As-Usual Forecast – Energy Consumption by Source (2013-2031) .............. 25
Figure 19: Business-As-Usual Forecast – GHG Emissions by Sector (2013-2031) ........................ 25
Figure 20: Block 27 Map ............................................................................................................... 27
Figure 21: Block 41 Map ............................................................................................................... 27
Figure 22: Mackenzie Vaughan Hospital Project Map .................................................................. 28
Figure 23: Updated GHG Reduction Potential - MEP Actions (ktCO2e) (2013-2031) ................... 30

                                                                                                                                               ii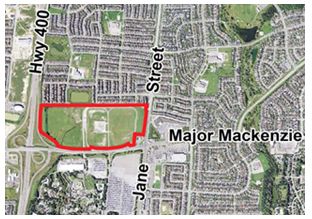
Vaughan Municipal Energy Plan                                                  June 2016

Message from the Stakeholder Advisory Group

The Stakeholder Advisory Group for the Vaughan Municipal Energy Plan is pleased to present
Vaughan’s Municipal Energy Plan (MEP) for reducing greenhouse gas emissions. We want to
congratulate the City of Vaughan for showing leadership in developing this Plan and applaud
Lura Consulting for guiding the process. We are grateful to have an opportunity to support
further implementation of Green Directions Vaughan and to contribute to addressing climate
change. The Stakeholder Advisory Group and the City thank the Federation of Canadian
Municipalities and the Ontario Ministry of Energy for financial support to develop the MEP.

The MEP builds on and replaces the Community Climate Action Plan. Many Vaughan citizens
contributed throughout the process. The Stakeholder Advisory Group reflects a broad range of
agencies and sectors with a strong commitment to addressing climate change and to taking
action to protect human health and the environment. We want to thank all of those that
contributed to this Plan.

We know that immediate action is required to mitigate the impacts of climate change. More
intense weather events causing flooding and more extreme climate variability such as heat
waves are already being manifested here at home and in many parts of the world. We
understand the serious health consequences associated with climate change – impacts to
cardiovascular and respiratory health as a result of air pollution and extreme heat events,
increased incidence of infectious diseases related to waterborne diseases and emerging vector-
borne diseases, and increased risk for vulnerable populations.

Governments are working to create the tools to foster real action to reduce greenhouse gas
emissions:
   • At the 2015 United Nations Climate Change Conference in Paris (COP21), 195 countries
       adopted the first-ever universal, legally binding global climate deal.
   • The federal government is engaging with provincial counterparts to develop a carbon-
       pricing framework.
   • Ontario’s Climate Change Strategy sets a vision for climate-resilient communities and to
       create a low-carbon economy.

The City of Vaughan Municipal Energy Plan puts us on a path to create a climate-resilient
community and participate in a low-carbon energy future. We all have a part to play in
initiating action and achieving results in these areas to reduce greenhouse gas emissions – at
home, at work or school, and on the move. Let’s get started!

                                                                                            iii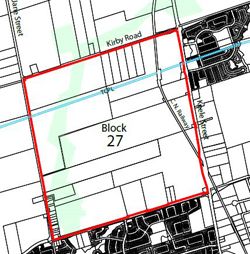
Vaughan Municipal Energy Plan                                                     June 2016

1 Introduction
     1.1 What is a Municipal Energy Plan?
In 2013, the Ministry of Energy (MOE) announced that it would be supporting local energy
planning efforts in Ontario by launching the Municipal Energy Plan (MEP) program. The MEP
program aims to support municipalities’ efforts in understanding their community’s energy use
and GHG emissions, identifying opportunities for energy efficiency and clean energy initiatives,
and ultimately developing a plan to meet their goals.

The MEP takes a holistic approach to energy planning at the community level, taking into
account energy generation and transmission infrastructure, land use planning, economic
development and overall education on energy issues by the community at large.

The purpose of the MEP is to help municipalities1:
   1. Assess the community’s energy use and greenhouse gas (GHG) emissions;
   2. Identify opportunities to conserve, improve energy efficiency and reduce GHG
       emissions;
   3. Consider the impacts of future growth and options for local clean energy generation;
       and
   4. Support local economic development.

     1.2 Shifting Context of Energy Planning in Ontario
Energy planning in Ontario continues to make significant progress towards clean, reliable
energy solutions that will ensure an efficient, low energy intensive future. Conservation and
demand management have taken on a much more significant role in recent years, and this has
happened at the provincial, regional and municipal levels.

The Ministry of Energy (MOE) has identified conservation as a key part of the province’s
collective effort to reduce GHG emissions in both its Long-Term Energy Plan (LTEP) and the
Conservation First Framework. The LTEP is designed to balance five principles of cost-
effectiveness, reliability, clean energy, community engagement, and emphasizes conservation
and demand management before building new generation. Ontario Regulation 397/11 also
came into force, which requires public agencies (such as municipalities, universities and
hospitals) to report on their energy use and GHG emissions to the MOE on an annual basis, in
addition to developing 5-year conservation and demand management plans.

The Ontario Power Authority, now merged with the Independent Electricity System Operator
(IESO), has been carrying out regional plan activities on an ongoing basis since its inception in
2005. These integrated regional plans examine generation, transmission, distribution and
conservation options from a regional perspective. The IESO released the York Region Integrated
Regional Resource Plan in April 2015 and is continuing to engage with the Local Advisory

1
    Ministry of Energy – http://www.energy.gov.on.ca/en/municipal-energy/
                                                                                               1
Vaughan Municipal Energy Plan                                                                     June 2016

Committee (LAC) to further define mid and longer-term strategies for the York Region
Integrated Regional Resource Planning area. 2

Energy planning at the municipal or community-wide level is therefore a natural extension of
these changes that have been shifting the context of energy management in Ontario at the
provincial and regional levels. Taking a holistic, integrated systems approach in energy planning
has seen some cities around the world (most notably Copenhagen and other cities in Germany
and Scandinavia) become energy secure, efficient, sustainable, cost-competitive and
environmentally friendly. The MEP program offers Ontario municipalities a key mechanism and
platform for municipal and community level action to achieve this as well.

On a global scale, climate change and the reduction of global GHG emissions has taken on
increased importance. At the 2015 United Nations Climate Change Conference in Paris (COP21),
195 countries adopted the first-ever universal, legally binding global climate deal.3 This MEP
provides a platform for realistic short-term actions, but also sets the stage for more advanced
opportunities and transformational targets down the road – such as those invoked through the
Paris Agreement – that will help set Vaughan in the right direction to a smart energy future.

    1.3 Why a MEP for Vaughan?
In early 2014, the City of Vaughan (the City) approved its first Community Climate Action Plan
(CCAP) focused on the reduction of community GHG emissions. The newly released Ontario
Municipal Energy Plan Program presented the City with an exciting opportunity to delve further
into understanding local energy needs and consumption patterns from a geographical
perspective and presented an opportunity to align the CCAP within the Municipal Energy
Planning framework. Vaughan was one of the first eight municipalities to receive funding from
the MOE to develop a Municipal Energy Plan. 4

A MEP is an important tool for Vaughan to ensure energy security, support local economic
development, foster a culture of social responsibility and sustainability, and to identify ways to
reduce the community’s energy consumption and GHG emissions. The MEP considers the
environmental and economic benefits of how energy is consumed and generated in the
community, as well as how this impacts the quality of life of Vaughan’s residents.

As a “living document,” the MEP identifies actions and opportunities with positive impacts to
Vaughan’s economy, environment, and energy security and will be updated to reflect new data
as it becomes available. Building climate-resilient communities will provide many more
opportunities to meet energy needs in a more decentralized, flexible and responsive way than

2
  IESO – http://www.ieso.ca/Pages/Ontario's-Power-System/Regional-Planning/GTA-North/default.aspx
3
  The Paris Agreement sets out a global action plan to hold the increase in the global average temperature to well
below 2 °C above pre-industrial levels and to pursue efforts to limit the temperature increase to 1.5 °C above pre-
industrial levels, recognizing that this would significantly reduce the risks and impacts of climate change. 195
countries signed the agreement.
4
  The MOE provides successful applicants with funding for 50% of eligible costs to develop a MEP, up to a
maximum of $90,000.
                                                                                                                      2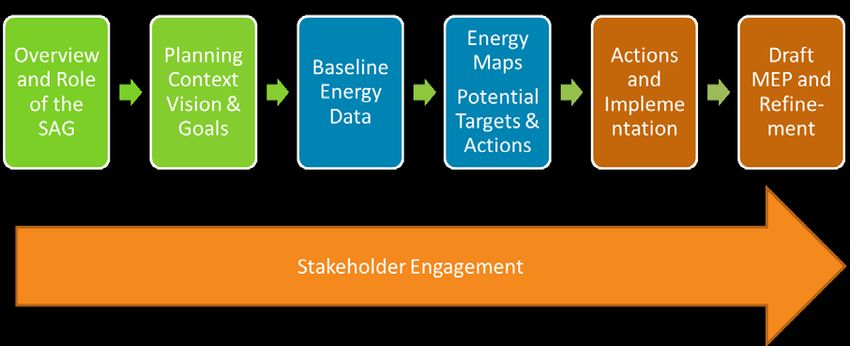
Vaughan Municipal Energy Plan                                                    June 2016

past technology provided. The Vaughan MEP advances the energy discussion and positions the
City and Vaughan citizens to reduce vulnerability to energy price increases and to be
participants, rather than just consumers, of the emerging low-carbon energy economy.

  1.4 How Does This Plan Align with Other City Plans?
Like the CCAP, the MEP retains the overarching vision and environmental ethic from Green
Directions Vaughan – the City’s Community Sustainability and Environmental Master Plan.
Green Directions Vaughan is designed to guide the Vaughan community to a more sustainable
future by addressing environmental, cultural, social and economic issues. It has linkages to the
Vaughan Official Plan (VOP 2010) in guiding the City’s growth as well as Vaughan’s master
plans, such as for transportation, water, stormwater, parks and recreation (Active Together),
and finance.

Figure 1: Alignment of CAP and MEP with Green Directions Vaughan

A key driver to develop the CCAP is Vaughan’s membership in the Partners for Climate
Protection (PCP) program – a voluntary five-milestone framework used to guide municipalities
to reduce GHG emissions. In addition, the York Region Official Plan (ROP 2010) requires the
development of Community Energy Plans at the following geographic scales:
    • a municipal-wide Community Energy Plan (ROP 2010 policies 4.1.14 and 5.2.13);
                                                                                           3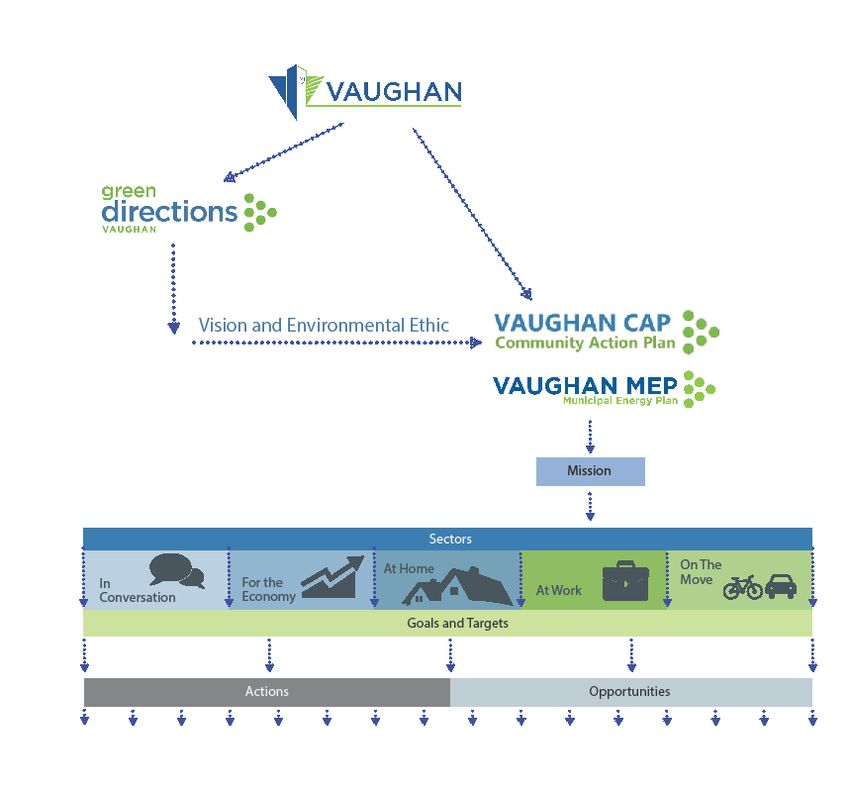
Vaughan Municipal Energy Plan                                                         June 2016

   •    for each Regional Centre (ROP 2010 policy 5.2.24); and
   •    for each New Community Area (ROP 2010 policy 5.6.10).

Hence, the MEP is intended to conform with the ROP 2010 policies requiring the preparation of
a municipal-wide energy plan.

The MEP is designed to replace the CCAP, and as such retains the CCAP mission, goals, actions
and opportunities as its foundation. The MEP adds two additional goals for economic
development and community engagement as well as provides the identification of potential
geographical locations for actions and opportunities in the residential sector to occur. It is a
living document that will be updated as new information becomes available and as monitoring
of energy use and GHG emissions informs progress on goals and targets.

1.4.1 Vaughan Term of Council Priorities

The City of Vaughan Service Excellence Strategy Map 2014-2018 describes the approach to be a
“City of Choice”. It identifies Council priorities and the strategic initiatives the administration
will undertake to build capacity, focus and deliver on those priorities so that the City will be
successful and sustainable for the long term. The revision and implementation of Green
Directions Vaughan is a “key activity” measuring progress on the Term of Council Priority: “To
continue to cultivate an environmentally sustainable City”. The MEP defines targets and specific
actions that can be undertaken by the City, in collaboration with community partners, further
implement Green Directions Vaughan.

As a corporation, the City is demonstrating leadership in climate change mitigation through
implementation of the Energy Conservation and Demand Management Plan, which was
approved by Council in June 2014. Based on the results of a facility energy audit, the Energy
Conservation and Demand Management Plan identifies a target for a 10% overall reduction in
energy consumption for facilities on per person served basis below the 2011 baseline year by
2020. Progress is monitored by annual reporting in accordance with the Ontario Energy
Conservation Leadership Act. Energy saving retrofits in City facilities is tracked as a “key activity”
to implement the Service Excellence Strategy Map.

  1.5    How was this Plan Developed?

In October 2014, the first Stakeholder Advisory Group meeting for the development of the
Vaughan MEP was held. The advisory group is a non-political body whose members are key
stakeholders representing various sectors and different perspectives across Vaughan. The
advisory group was an extension of the CCAP Steering Committee and provided guidance,
critique and suggestions, shared technical advice and knowledge, and actively participated
throughout the Plan’s development.

Since that initial meeting, the City held four more meetings throughout key stages of the
project. A brief summary of the five meetings and topics covered follows.
                                                                                                    4
Vaughan Municipal Energy Plan June 2016
Table 1: Stakeholder Advisory Group Meetings Summary
Meeting # Date Topics Covered
1 October 8, 2014 • Understanding of Project Objectives
• Overview of MEP planning process
• Understanding of SAG framework and roles and
responsibilities
• Discussion on opportunities, challenges and goals
2 November 4, 2014 • Update on data collection process
• Review of Regional Planning context (OPA presentation)
• Best Practices review from other community energy plans
• Review of Burlington’s Community Energy Plan
• Review of Markham’s MEP process and discussion
opportunities on integration with Vaughan
3 May 26, 2015 • Present and discuss Vaughan’s baseline, economic analysis
and draft energy maps
• Discuss alignment and integration with CCAP
4 November 5, 2015 • Present and discuss updated baseline, Business-As-Usual
forecast, and energy maps
• Discussion on MEP actions to “round out” the CCAP
• Discussion on implementation considerations and approach
5 January 19, 2016 • Discuss draft Vaughan Municipal Energy Plan
The advisory group was instrumental in providing key inputs and overall direction in each of the
six phases of the MEP work, as shown below.
Figure 2: Vaughan Municipal Energy Plan Development Process
1.5.1 Analyzing Vaughan’s Energy Use
The analysis of Vaughan’s energy consumption involved linking actual metered energy use with
a database of residential and non-residential buildings in the city. Vaughan is divided into 63
geographic block areas for community planning purposes. Each of the block plans address lot
patterns, road and pedestrian networks, and location of community services such as schools,
parks and community centres. Block plans essentially serve as a comprehensive blueprint for
the creation of individual plans for subdivisions where large parcels still remain. Using the
5Vaughan Municipal Energy Plan June 2016
existing geographic block areas as planning units, Energy Planning Districts (EPDs) were created
using an inventory of all properties and built floor space categorized based on building type and
age (Figure 3).
Figure 3: Energy Planning Districts
The EPDs will allow City departments to better correlate between the maps and future planning
initiatives (e.g., EPDs with higher residential energy consumption and older dwelling units can
be prioritized for area-specific retrofit programs ahead of EPDs that have relatively lower
energy consumption).
HOT2000 and the Screening Tool for New Building Design - open software developed by Natural
Resources Canada - were used to create models of typical energy use for Vaughan buildings5.
These programs use average energy use characteristics of houses and buildings in Canada that
allowed for the generation of housing ‘archetypes’ that can be applied to houses of different
ages and types. The archetypes were used to derive energy intensity values (GJ per m2) for the
different housing categories. The intensity values were then applied to all existing housing
based on building age and type to create a model of total residential energy use for Vaughan.
The resulting total energy use values were then verified through comparison to actual energy
consumption for Vaughan. Modelled values were then adjusted to match metered data within
1%. The result is an Energy Use Database (EUDB) for all properties based on each EPD, with
5
HOT2000 was used to model low-rise residential, and the Screening Tool was used to model multi-unit residential
buildings. Non-residential buildings were not modeled.
6Vaughan Municipal Energy Plan June 2016
energy use values assigned to built floor space that match total metered energy use. This
allowed for very detailed analysis of energy use in the residential sector, and these resulting
energy use values were ultimately used in the creation of this Plan’s energy maps.
While an inventory of energy use for the commercial and industrial sectors was completed,
there was insufficient detail of property data to build similar models for these sectors.
Acquiring detailed data on the existing floor space of non-residential buildings in Vaughan in
the future would allow for this level of analysis to be completed. In the future, the City of
Vaughan hopes to be able to fill these gaps and develop a model of energy consumption in the
non-residential sector similar to the residential one presented in this plan.
Once a complete model of energy use and emissions in Vaughan was built, a Business-As-Usual
(BAU) projection was created to illustrate how Vaughan’s energy use would evolve over the
plan horizon to 2031 assuming that annual increase in built floor space would match annual
projected population increases for residential properties and projected employment for non-
residential properties. Transportation energy use was also assumed to increase in line with
projected population growth.
2 Setting Direction for a Smart Energy Future
In order to align with the CCAP, this Municipal Energy Plan retains the Green Directions Vision
and Environmental Ethic and CCAP mission and goals.
2.1 Vision
Sustainability First
Sustainability means we make decisions and take actions that ensure a healthy environment,
vibrant communities, and economic vitality for current and future generations.
Environmental Ethic
• Lead by example as responsible stewards of our community
• Decisions entail determining the impact of our actions on the environment, weighing
social/cultural consequences, and understanding financial implications
• Actions enhance both the natural and built environments
2.2 CCAP and MEP Mission
The Vaughan community is committed to acting on climate change now and in the future. We
will reduce greenhouse gas emissions through leadership and education, fostering a culture of
social responsibility. Our efforts will strive to improve human health and economic benefits
while sustaining our planet.
2.3 CCAP and MEP Goals
The CCAP identified goals, and supporting actions and opportunities under three easily
relatable categories, including:
7Vaughan Municipal Energy Plan June 2016
1. At Home (Residential and Waste);
2. At Work (Industrial, Commercial and Institutional); and
3. On The Move (Transportation).
Through the MEP process, two additional areas of focus were identified:
4. For The Economy (Economic Development); and
5. In Conversation (Education and Raising Awareness on Energy Issues).
For the Economy
Advisory group members identified economic development as an important goal to include as a
part of this Plan. As the City, stakeholders and the community work towards implementing the
actions described in Section 6, numerous economic opportunities will arise for businesses in
Vaughan.
The MEP can stimulate economic development in the form of new businesses that focus on the
energy sector, whether this is alternative/renewable energy sources, energy storage solutions,
conservation and efficiency, retrofit programs, and other innovative solutions. All of these
businesses have the potential to thrive in a community that is growing while making energy
conscious decisions and concerted efforts to lower GHG emissions on a per capita basis.
In Conversation
In its Long-Term Energy Plan document and through its Conservation First Framework, the
Ministry of Energy has identified conservation as a key part of the province’s collective effort to
reduce GHG emissions. It’s important to note, however, that conservation and demand
management programs provide not only environmental but economic benefits as well: for
every $1 invested in energy efficiency programs, Ontario avoids about $2 in costs to the
electricity system 6. Energy efficiency and conservation is an effective way of reducing not only
Vaughan’s vulnerability to energy price increases, but the energy bills of residents as well.
Education, awareness and behaviour change programs are all part of instilling a “culture of
conservation” amongst the broader community. As the City and a number of stakeholder
organizations work on community engagement initiatives, the key benefits to the local
economy and environment must be integrated.
CCAP and MEP Goals
1. At Home (Residential and Waste)
Goal 1. We will reduce the amount of electricity and natural gas used in our homes
through conservation, improved efficiency, and use of renewable energy
sources.
Goal 2. We will reduce the amount of waste generated in our homes that end up in
landfill.
6
Ministry of Energy, “Conservation First: A Renewed Vision for Energy Conservation in Ontario”
8Vaughan Municipal Energy Plan June 2016
Goal 3. The City will continue to look at planning policy that supports more sustainable
homes, developments and neighbourhoods.
2. At Work (Industrial, Commercial, Institutional)
Goal 4. Our businesses, schools, and industries will reduce the amount of electricity
and natural gas they consume through conservation, improved efficiency, and
use of renewable energy sources.
Goal 5. Our businesses, schools, and industries will improve their waste management
practices and demonstrate leadership in waste management activities.
Goal 6. The City will continue to encourage more sustainable commercial
developments through policies, standards and planning practices.
3. On the Move (Transportation)
Goal 7. We will reduce our reliance on cars, choose more efficient vehicles and take
more sustainable forms of transportation.
Goal 8. The City will continue to encourage more sustainable transportation in
Vaughan through policies and land use planning practices.
4. For the Economy
Goal 9. We will stimulate economic development in Vaughan in the form of new
businesses that focus on the energy sector.
5. In Conversation
Goal 10. We will raise awareness among Vaughan residents of the benefits of a smart
energy future through focused educational programs and initiatives.
3 What is Vaughan’s Current Community Energy Profile?
Since incorporation in 1991 (when Vaughan’s population was 111,000 residents), the city has
grown by a staggering 187%. In 2013, the baseline year for this study, the population was
312,882. Based on the community’s electricity and natural gas consumption, total energy use in
Vaughan in 2013 amounted to 36 million GJ and total GHG emissions were approximately 1.58
million tonnes of CO2 equivalent 7. This equates to 115 GJ and 5.04 tonnes of CO2 equivalent on
a per-capita basis in 2013.
At 152 GJ/household 8, Vaughan energy use per home 9 is higher than both the Canadian (105
GJ/household) 10 and Ontario averages (107 GJ/household). Residential energy consumption per
m2 of built floor space in Vaughan (0.50 GJ/m2) is comparable with both the Canadian (0.56
GJ/m2) and Ontario (0.52 GJ/m2) averages. In both instances, however, Vaughan’s baseline
performance indicators are much higher than the best practice in Denmark and Germany – 70.5
GJ/household and around 0.25 GJ/m2.
7
Based on electricity and natural gas consumption figures from PowerStream and Enbridge, respectively, as well as
energy figures for the transportation sector.
8
152 GJ/household is based on 13,272,532 GJ of energy consumed in the residential sector, divided by 87,194
dwellings.
9
Per-capita and per-household values differ in that the former is calculated by dividing the total figure (energy
consumption or GHG emissions) by the number of residents in Vaughan, while the latter divides the total figure by
the number of dwellings in Vaughan.
10
Stats Canada 2011 data. http://www.statcan.gc.ca/pub/11-526-s/2013002/aftertoc-aprestdm1-eng.htm
9Vaughan Municipal Energy Plan June 2016
3.1 Vaughan’s Housing Profile
As the chart below indicates, Vaughan has experienced enormous growth starting in 1980-1989
when 22,350 new homes were constructed. From 1990-1999, more than 18,000 new homes
were constructed and during 2000-2009 Vaughan saw that number almost double to 34,200
new homes. As of early 2016, the average age of a residential dwelling in Vaughan is about 20
years, reflecting the amount of new construction since 1980.
Table 2: Vaughan Building Age Profile
Building Age Count
Pre-1945 376
1945-1969 1,674
1970-1979 3,024
1980-1989 22,350
1990-1999 18,170
2000-2009 34,209
2010-2013 7,391
The map below shows Vaughan’s housing stock, categorized by year built. From 1975 to 1989,
two areas experienced large growth in housing starts: (1) in the southwestern part of Vaughan,
west of Highway 400 from Highway 27 to Weston Road and north of Highway 7
(Woodbridge) 11, and (2) in the southeastern corner, south of the 407 and between Dufferin and
Yonge Streets (Thornhill)12. In addition, there was some development near the intersection of
Keele Street and Major Mackenzie Drive.13
From 1990 to 2012, Vaughan experienced huge growth from Langstaff Road northwards,
spanning from Highway 27 all the way to Bathurst Street.14 This reflects the build-out in the
Carrville and Vellore planning areas articulated in Official Plan Amendment 600.
11
EPD #s 37, 38, 43, 44, 45 and 51
12
EPD #s 1, 2, 8, 9 and 15
13
EPD #s 18, 25 and 26
14
EDP #s 9, 10, 11, 12, 17, 18, 20, 25, 26, 32, 33, 38, 39, 40, 52, 53 and 54
10Vaughan Municipal Energy Plan June 2016
Figure 4: Housing Age
A large majority of Vaughan’s building stock is comprised of single-family detached homes
(71%). Single-family row/town houses, single-family semi-detached houses and multi-unit
residential buildings make up the rest of the building stock in fairly equal amounts (9 to 10.5%).
According to Statistics Canada 15, single-detached dwellings have the highest average household
energy use in Ontario at 136 GJ per household. This compares to 33 GJ per household for
apartments and 94 GJ per household for multi-unit buildings (including doubles, duplexes and
row homes). This is an important consideration for Vaughan, as the average size of a single-
family home in Vaughan is quite large, at approximately 313 m2. 16 This compares to an average
size of a new, single-detached house of 186 m2 in Canada, according to the Canadian Home
Builders’ Association. 17
Homes built after 2010 adhere to the more stringent 2012 Ontario Building Code and are
therefore more energy efficient. However, these homes make up a fairly small percentage
(8.5%) of total housing stock in Vaughan.
15
http://www.statcan.gc.ca/pub/11-526-s/2013002/t007-eng.htm
16
Municipal Property Assessment Corporation (MPAC), Vaughan Housing Data
17
Canadian Home Builders Association, Pulse Survey – Winter 2013/2014 Survey Results (National & All Regions)
11Vaughan Municipal Energy Plan June 2016
70000
61470
60000
50000
40000
30000
20000
9232 8835 7657
10000
0
Single Family Single Family MURB Single Family
Detached Row/Town Semi-Detached
House
Figure 5: Vaughan Residential Building Type Profile (2013) 18
Additionally, Statistics Canada shows that Ontario households that are rented consumed less
energy than those that are owned – 53 GJ per household compared to 123 GJ per household 19.
As of 2011, Vaughan had a very high home ownership rate of 92.2%, compared to Ontario and
Canada figures of 71.4% and 69%, respectively.20
3.2 Vaughan’s Baseline Energy Use Profile
Energy use by sector indicates that the residential (37%) and commercial (29%) sectors are
together responsible for around 67% of energy use in Vaughan (Figure 7)21. The industrial
sector 22 has seen a decline in recent years, and is now responsible for 18% of total energy use.
This decline has been driven by the elimination of the small mining and oil and gas extraction
industry, as well as a decline in employment in “heavy industry” such as transportation,
equipment and machinery manufacturing, as well as chemical, metal, wood and paper
manufacturing.
18
Source: Municipal Property Assessment Corporation
19
http://www.statcan.gc.ca/pub/11-526-s/2013002/t008-eng.htm
20
Canadian Index of Wellbeing, The Vaughan Community Wellbeing Report 2015
21
All energy sources are standardized and have been converted to joules for the purpose of comparison.
22
Please note that in this Plan, the industrial and commercial sectors are defined according to rate classes that the
local utilities apply.
12Vaughan Municipal Energy Plan June 2016
Table 3: Profile of Vaughan’s Industrial and Commercial Sectors (2006 – 2013)
Type 2006 Employees 2013 Employees % change
Heavy Industry 45,321 39,835 -12%
Light Industry 27,045 40,741 51%
Commercial 75,027 109,310 46%
More than half of the energy used in Vaughan is natural gas consumption (53%; Figure 6) that is
used to heat and cool homes and businesses – this supports the residential and commercial
consumption values in Figure 7. Electricity accounts for 31% of the energy used in Vaughan,
with 11% being supplied by gasoline, 4.6% diesel and 0.15% propane (Figure 6).
Diesel Propane
1,674 TJ 5% 54 TJ 0.1%
Gasoline
4,031 TJ 11% Electricity
11,163 TJ
31%
Natural Gas
19,151 TJ
53%
Figure 6: Energy Use by Source (2013)
Transport
5,758 TJ
16%
Residential
13,368 TJ
37%
Industrial
6,366 TJ
18%
Commercial
10,580 TJ
29%
Figure 7: Energy Use by Sector (2013)
13Vaughan Municipal Energy Plan June 2016
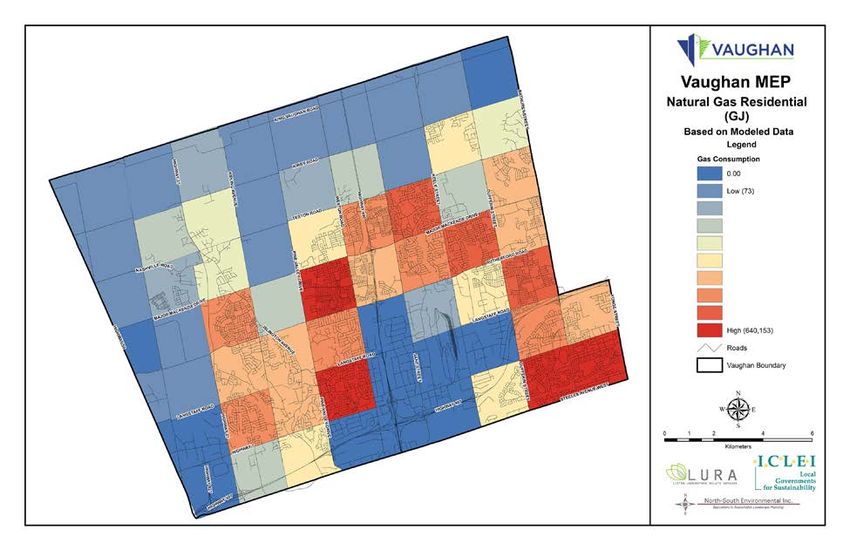
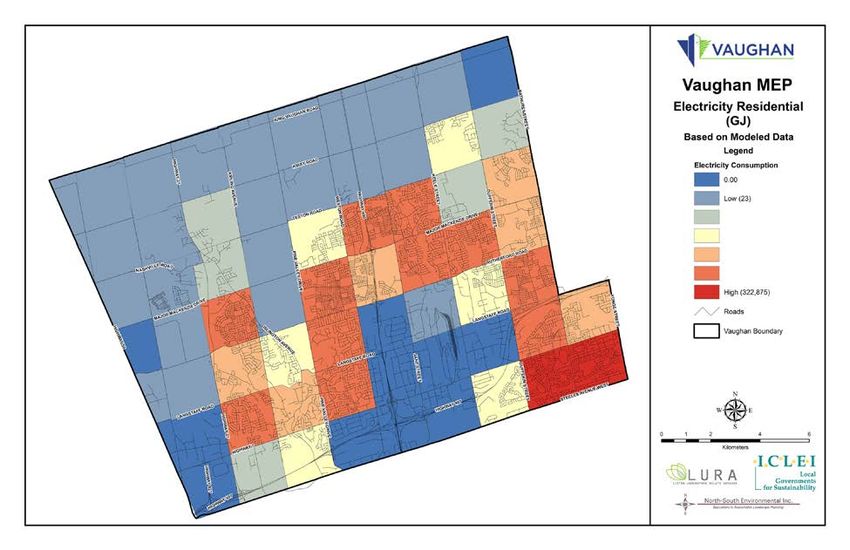
3.2.1 2013 Total Residential Energy Consumption (GJ)
In addition to the baseline energy study and economic analysis, an energy mapping exercise
was completed based on Vaughan’s electricity and natural gas consumption data. Energy
mapping has proven to be an effective method of visually representing total energy use, and to
help identify specific areas within a municipality for conservation and retrofit opportunities.
The energy maps presented subsequently focus on the residential sector. 23
Figure 8 below shows Total Residential Energy (GJ) in Vaughan for the base year of 2013. The
blue EPDs represent areas with zero/low total energy consumption and the red EPDs show
those areas with higher total energy consumption. As mentioned in Section 1.6, the subsequent
energy maps are based on modelled energy use values that were assigned to all existing
housing in Vaughan, matching total actual metered energy use.
In the map below, four energy planning districts (EPD1, 8, 37 and 39) have the highest energy
consumption (both natural gas and electricity) by residential users. Referring back to Figure 4,
three of these four EPDs (EPD1, 8 and 37) have a housing stock predominantly built in the 1975-
1989 range, representing older, less energy efficient housing. Meanwhile, EPD39 has a newer
housing stock but due to its density and large number of single-family detached houses (it has
the highest floor area of all the EPDs), it has higher residential energy consumption overall.
In addition to looking at total energy consumption, it is important to consider energy intensity
when targeting specific areas or neighbourhoods for retrofit or efficiency programs. Specifying
specific EPDs for retrofit programs would also need to consider density, gross residential floor
area, as well as the amount of market penetration for existing programs within the EPD.
In Table 4 below, we can see energy intensity figures 24 for select EPDs. These energy intensity
figures account for differences in density and floor area, and show which EPDs consume
relatively more total energy (a lower energy intensity figure is better as it indicates this EPD is
more energy efficient and that it uses relatively less energy on a per-area basis).
This table shows that while there is only a 14% difference in total residential energy
consumption between EPD1 and EPD39 for example, the energy intensity is much higher on a
relative basis (28%) in EPD1. EPD39, with the fourth highest total residential energy
consumption in comparison was designed and built to EnerGuide 80 rating, which is why it has
one of the lowest energy intensity figures of all the EPDs.
23
Also, as noted in Section 1.5.1, since detailed data on the existing floor space of non-residential buildings was
not available, a detailed database of energy consumption and energy maps were not developed for the non-
residential sector as this would have involved too many assumptions.
24
Calculated by taking total residential energy consumption and dividing by gross residential floor area for a given
EPD
14Vaughan Municipal Energy Plan June 2016
Table 4: Residential Energy Consumption – Intensity Figures for EPD1, 8, 37 & 39
EPD Total Residential Gross Floor Area, Energy Intensity
Energy Consumption (GJ) Residential (m2) (GJ/m2)
1 944,141 1,582,219 0.597
8 939,530 1,607,754 0.584
37 854,688 1,569,442 0.545
39 828,379 1,771,860 0.468
Of the four EPDs with highest residential energy consumption, energy intensity is highest in
EPD1, followed by EPD 8, 37, and then 39.
EPD39
EPD1
EPD8
EPD37
Figure 8: Total Residential Energy Consumption (GJ) (2013)
3.2.2 2013 Total Residential Natural Gas Consumption (GJ)
The story continues in the map for residential natural gas consumption in Vaughan. Again, we
see that EPD1, 8, 37 and 39 have the highest natural gas consumption rates in this category.
15Vaughan Municipal Energy Plan June 2016
EPD39
EPD1
EPD8
EPD37
Figure 9: Residential Natural Gas Consumption (GJ) (2013)
Dwelling unit density is a factor in the areas of higher natural gas consumption. However, the
impact of building age has a more prominent correlation to natural gas consumption rates
(Figure 9) as compared to the electricity consumption rates shown in Figure 10. This is due to
the fact that natural gas is predominantly used for space heating in Vaughan, suggesting that
areas with higher natural gas consumption have an older housing stock built to older, less
efficient building codes. Electricity consumption tends to remain more stable since appliances
and lighting are upgraded more frequently.
Table 5 illustrates residential natural gas consumption intensity figures for EPD1, 8, 37 and 39.
Again, it’s evident that as a Block designed to EnerGuide 80 rating, EPD39 has a much lower
natural gas intensity compared to EPD1, 8 and 37. Higher natural gas consumption intensity
figures are seen in the houses of EPDs 37, 8 and 1, in ascending order. In referring back to
Figure 4, we can see that these areas have relatively older housing stock, with most houses
built from 1975 to 1989.
16Vaughan Municipal Energy Plan June 2016
Table 5: Residential Natural Gas Consumption – Intensity Figures for EPD1, 8, 37 & 39
EPD Total Residential Gross Floor Area, Natural Gas
Natural Gas Residential (m2) Intensity
Consumption (GJ) (GJ/m2)
1 621,266 1,582,219 0.393
8 640,153 1,607,754 0.398
37 632,248 1,569,442 0.403
39 589,768 1,771,860 0.333
3.2.3 2013 Total Residential Electricity Consumption (GJ)
EPD1
EPD8
Figure 10: Residential Electricity Consumption (GJ) (2013)
Figure 10 illustrates residential electricity consumption in Vaughan. A large number of Energy
Planning Districts 25 are relatively high consumers of electricity. However, EPD1 and EPD8 clearly
stand out as the highest areas in Vaughan with respect to electricity usage.
Since electricity is mainly used for space cooling, lighting, and operating household appliances,
EPDs with both higher electricity consumption and electricity intensity are prime targets for
retrofit programs that aim to replace old, inefficient appliances such as refrigerators, washing
machines and air conditioners. As seen in Table 6 below, not only are EPD1 and EPD8 districts
25
EPD9, 10, 18, 25, 26, 33, 37, 38, 39, 51 and 53
17Vaughan Municipal Energy Plan June 2016
the highest electricity consumers, at energy intensity figures of 0.204 and 0.186 GJ/m2,
respectively, they also have much higher intensity than other EPDs with relatively high total
electricity consumption figures (in the table below, EPD 37 and 39 were included in order to
illustrate this fact).
Table 6: Residential Electricity Consumption – Intensity Figures for EPD1, 8, 37 & 39
EPD Total Residential Gross Floor Area, Electricity
Electricity Consumption Residential (m2) Intensity
(GJ) (GJ/m2)
1 322,875 1,582,219 0.204
8 299,377 1,607,754 0.186
37 222,440 1,569,442 0.142
39 238,611 1,771,860 0.135
3.3 Energy Mapping Analysis
Table 5 shows that EPDs 37, 8 and 1 have the highest natural gas intensity figures on a GJ/m2
basis and that the 3 EPDs are relatively close using this metric. At the same time, Table 6
indicates that EPD1 and 8 have a much higher electricity intensity while also having higher total
residential electricity consumption.
Overall, the energy mapping analysis suggests that EPD1 and EPD8 in particular may serve as
primary locations to study the potential impacts of various retrofit programs in these parts of
Vaughan.
Table 7: Residential Unit Profiles for EPD1, 8, 37 & 39
EPD Number of Gross Floor Area, Average House Average Age
Residential Units Residential (m2) Size (m2) of House
1 6,432 1,582,219 246 1988
8 6,987 1,607,754 230 1989
37 4,708 1,569,442 333 1987
39 5,382 1,771,860 329 2005
As illustrated in Table 7, EPD8 has the highest number of residential units followed by EPD1.
Furthermore, in reviewing the residential unit profiles for EPDs 1, 8, 37 and 39, the average
house size in EPDs 1 and 8 are much smaller than in EPDs 37 and 39, for example. As a result,
we can conclude that EPDs 1 and 8 have houses that are older, smaller and less energy efficient,
making these two EPDs candidates for further detailed analysis for suitability for retrofit
programs. This analysis also demonstrates that reliable data regarding dwelling unit age and
dwelling unit type will assist in developing the aforementioned retrofit programs.
18Vaughan Municipal Energy Plan June 2016
3.4 Vaughan’s Baseline GHG Emissions Profile
With a 31% population increase from 2006 to 2013, it makes sense that the residential sector is
now responsible for the largest share of GHG emissions (35%) on a per-sector basis, compared
to 26.6% in 2006. Similarly, the transportation sector has experienced a GHG emissions rise
from 19.8% in 2006 to 25% in 2013 due to Vaughan’s population growth.
Transport
Residential
386,735 tCO2e
551,501 tCO2e
25%
35%
Industrial
207,637 tCO2e
13%
Commercial
431,255 tCO2e
27%
Figure 11: GHG Emissions by Sector (2013)
Gasoline
264,982 tCO2e
17%
Diesel
118,530 tCO2e
7%
Propane
3,223 tCO2e
Natural Gas >1%
942,333 tCO2e
60%
Electricity
248,060 tCO2e
16%
Figure 12: GHG Emissions by Source (2013)
19Vaughan Municipal Energy Plan June 2016
In comparison to the CCAP figures (6.8 tonnes of CO2 equivalent per capita), the MEP analysis
indicates that Vaughan’s GHG emissions are 5.04 tonnes of CO2 equivalent 26 on a per capita
basis in 2013. Vaughan’s GHG emissions picture has improved in recent years due to the
aforementioned changes in the industrial sector as well as Ontario’s successful coal phase-out
program.27 The CCAP and MEP numbers differ because solid waste emissions are not included
in the MEP figure, but also because the energy efficiency programs offered by Vaughan’s local
utilities (PowerStream and Enbridge) have become more aggressive and forecast higher uptake
in the coming years.
3.5 The Economic Impact of Vaughan’s Energy Use
Based on consumption figures and commodity prices for electricity, natural gas, gasoline, diesel
and propane, and using a model developed by the City of London, Ontario, it is estimated that
Vaughan spent approximately $834 million on energy in 2013. Of this total, 60% is attributed to
electricity costs, 18% gasoline, and 15% natural gas. While natural gas is estimated to account
for 15% of costs for purchasing energy, it comprises 53% of energy use (Figure 6) and accounts
for 60% of GHG emissions (Figure 12). Electricity accounts for higher costs for purchasing
energy, yet comprises 31% of energy consumption (Figure 6) and only 16% of GHG emissions
(Figure 12). Hence, managing costs while converting fossil fuel energy use to Ontario’s relatively
low-carbon electricity grid is an important component of long-term energy planning and
climate change mitigation. This emphasizes the ongoing need for energy efficiency and
conservation, to continue reducing overall energy use on a per capita basis, as a critical part of
GHG emissions reductions strategies.28
26
CO2 equivalent is a metric measure that is used for easy comparison of emissions from various GHGs based on
their global warming potential (GWP). By using this measure, we are able to tally the total emissions from different
sources, including electricity, natural gas, gasoline, diesel and propane.
27
http://www.energy.gov.on.ca/en/archive/the-end-of-coal/
28
It should be noted that in the latest LTEP, the MOE foresees that ratepayer savings will be realized as a result of
reduced FIT prices, the ability to dispatch wind generation, the amended Green Energy Investment Agreement,
and the decision to defer new nuclear.
20Vaughan Municipal Energy Plan June 2016
$600
$505
$500
$400
$ Millions
$300
$200
$150
$123
$100 $55
$2
$-
Diesel Electricity Gasoline Natural Gas Propane
Commodity
Figure 13: Energy Costs ($ Millions) (2013)
Out of the $834 million spent on energy in the community, Figure 14 shows that nearly half
(47%) is going to Ontario businesses, including the businesses that generate and transmit
power in Ontario. 18% of energy dollars stay in Vaughan (mostly to local utilities), 17% go to
Canadian businesses (mostly to Western Canada) and 12% go to the provincial government.
Understanding the magnitude of dollars spent on energy needs – and where those dollars are
allocated within the different economies – will help to drive conservation efforts by engaging
the community in a conversation driven by financial capacity (improving energy literacy). It is
hoped that this approach will help engage new audiences by communicating the energy
consumption in dollars, a more relatable unit of measurement.
21Vaughan Municipal Energy Plan June 2016
Canada - United States,
Government, 1%
Vaughan, 18%
6%
Canada-Wide,
17%
Ontario -
Government,
12% Ontario -
Business, 47%
Vaughan Ontario - Business Ontario - Government
Canada-Wide Canada - Government United States
Figure 14: Vaughan's Energy Expenditure - Where Does the $ Go? 29
$400
$350
$300
$250 Vaughan
$ Millions
$200 Ontario - Business
$150 Ontario -
Government
$100 Canada-Wide
Canada -
$50 Government
United States
$-
Diesel Electricity Gasoline Natural Gas Propane
Commodity
Figure 15: Vaughan's Energy Expenditure - by Commodity (2013)
29
The energy expenditure estimate uses a range of assumptions and generally allocates the cost of purchasing
energy in the following sector categories: commodity cost (i.e. generation and/or production); storage (fossil fuels
only); delivery (primarily local businesses); and HST (Federal and Ontario governments, with debt retirement
calculated separately). The 12% share of energy costs attributed to the Ontario government, for example, primarily
reflects HST as the revenue from Hydro One power generation is attributed to Ontario businesses for the purposes
of the calculation.
22Vaughan Municipal Energy Plan June 2016
4 What is Vaughan’s Energy Future In 2031?
As mentioned throughout Section 3, Vaughan has experienced impressive population growth in
recent years. Vaughan is expected to continue growing and by 2031 Vaughan’s population is
anticipated to be around 427,900 people and 497,400 by 2041 30. This means that compared to
2015 figures, more than 100,000 additional people will call Vaughan home by 2031. That is a lot
of people – and a lot of energy that will be consumed – therefore the City and partner agencies
need the objectives and tools set out in the MEP, aligned with Provincial and regional energy
planning initiatives, to better forecast what the future looks like and plan for future energy
needs.
4.1 The Implications of Business as Usual
In order to determine what this expected growth means for Vaughan’s energy consumption
and GHG emissions profile, modelled Business-As-Usual (BAU) projections were conducted by
sector and source from 2013 to 2031. For this report, BAU projections assume no further
changes to the per capita GHG emissions. That is, the ongoing impact of existing changes to
building codes, new construction requirements, transit enhancements, and conservation and
efficiency retrofit programs have not been incorporated into the BAU projections as a baseline.
The figure below shows the modelled BAU total GHG projections using the 2006 baseline
(CCAP) and the 2013 baseline (MEP). The process of developing an energy model projection
through the MEP uses an in-depth dataset that has provided the City with an opportunity to
refine its anticipated level of GHG emissions to 2031. The results suggest that Vaughan has an
14% lower GHG emissions for the business-as-usual scenario than anticipated through the CCAP
when using the current updated data for 2013. This change can be attributed primarily to three
key factors that have changed in Vaughan and in Ontario between 2006 and 2013: (1) the
province’s successful phase-out of coal; (2) the significantly increased conservation efforts and
conservation targets of local utilities; and (3) changes in the Vaughan economy that have
shifted away from carbon intensive industries. As a result, the refined BAU was used to set a
new GHG emissions reduction target.
30
York Region, 2041 Preferred Growth Scenario – 2041 Population and Employment Forecasts. Please note that
2041 growth scenario subject to change as Region goes through Comprehensive Review process.
23You can also read