JRC Ocean Energy Status Report 2016 Edition - Technology, market and eco-nomic aspects of ocean ener- gy in Europe - Smart ...
←
→
Page content transcription
If your browser does not render page correctly, please read the page content below

JRC Ocean Energy Status Report
2016 Edition

                      Technology, market and eco-
                      nomic aspects of ocean ener-
                      gy in Europe

                      Davide Magagna
                      Riccardo Monfardini
                      Andreas Uihlein

                      2016

                                                     EUR 28407 EN
This publication is a Science for Policy report by the Joint Research Centre (JRC), the European Commission’s science and knowledge ser-
vice. It aims to provide evidence-based scientific support to the European policymaking process. The scientific output expressed does not
imply a policy position of the European Commission. Neither the European Commission nor any person acting on behalf of the Commis-
sion is responsible for the use that might be made of this publication.

Contact information
Name: Davide Magagna
Address: Joint Research Centre, Directorate for Energy, Transport and Climate Change, P.O. Box 2, 1755 ZG Petten, The Netherlands
Email: davide.magagna@ec.europa.eu
Tel.: +31 224 56 5303

JRC Science Hub
https://ec.europa.eu/jrc

JRC104799

EUR 28407 EN

 PDF           ISBN 978-92-79-65940-9              ISSN 1831-9424            doi:10.2760/509876

 Print         ISBN 978-92-79-65941-6              ISSN 1018-5593            doi:10.2760/164776

Luxembourg: Publications Office of the European Union, 2016

© European Union, 2016

The reuse of the document is authorised, provided the source is acknowledged and the original meaning or message of the texts are not
distorted. The European Commission shall not be held liable for any consequences stemming from the reuse.

How to cite this report: Magagna D; Monfardini R; Uihlein A. JRC Ocean Energy Status Report: 2016 Edition EUR 28407 EN. Luxembourg
(Luxembourg): Publications Office of the European Union; 2016. JRC104799

All images © European Union 2016 , expect cover page: ©Tatjana Keisa, [Fotolia. Com]

Title JRC Ocean Energy Status Report – 2016 Edition

Abstract

Assessment of the Ocean Energy status in 2016
This report presents the current status of major ocean energy technologies, focusing primarily on tidal stream and wave energy. Europe is
the global leader in the development of ocean energy technologies, hosting most of global developers. Overall, the sector is progressing
towards the deployment of demonstration farms, and EU policy is helping shaping the industry.
JRC Ocean Energy Status Report
2016 Edition

Joint Research Centre
Directorate of Energy, Transport & Climate

Davide Magagna, Riccardo Monfardini & Andreas Uihlein

2016
PAGE INTENTIONALLY LEFT BLANK

                                i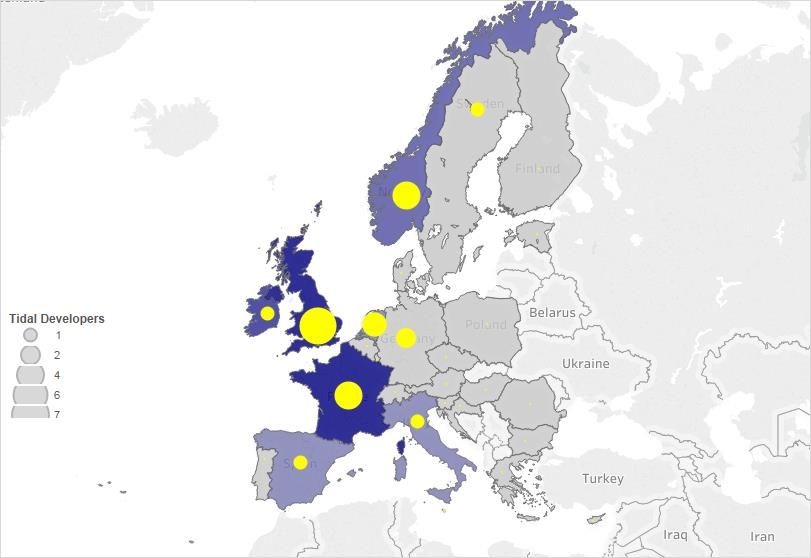
EXECUTIVE SUMMARY

This report is the 2016 edition of the Joint         early stage of development, requiring re-
Research Centre's ocean energy status re-            search and development to progress fur-
port. While the 2014 edition gave an over-           ther in terms of technology.
view of the ocean sector in the European
                                                     Wave energy has yet to prove consistent
Union, including technology descriptions,
                                                     electricity generation to the level reached
this second version focuses more on the
                                                     by prototype tidal energy converters. Tech-
developments that have taken place in the
                                                     nology progression for wave energy is par-
sector over the past years in terms of tech-
                                                     amount to ensure the long-term growth of
nological progress, market creation, and
                                                     the sector. Reliability, availability and sur-
policy instruments available at European
                                                     vivability are the three areas that wave
and national level. The various ocean ener-
                                                     energy developers need to address.
gy technologies (tidal energy, wave energy,
ocean thermal energy conversion and salin-           The deployment of the first demonstration
ity gradient energy) are at different stages         arrays for tidal energy indicates that tech-
of technical and commercial development.             nology progression has been achieved. The
In Europe, tidal and wave energy are those           main challenge for the tidal sector moving
poised to provide the most significant con-          forward is to achieve cost-reduction of the
tribution to the European energy system in           technology through the deployment of
the short term.                                      more demonstration projects. Innovative
                                                     financial instruments are required for sup-
From a policy standpoint, the European
                                                     porting the deployment of the first projects
Commission has strengthened its support
                                                     and attracting private investors.
for the development of ocean energy.
Ocean energy has been identified as a key            The installation of ocean energy devices is
technological area within the Strategic En-          taking place at a slower pace than ex-
ergy Technology Plan of the European Un-             pected. Europe only accounts for 14 MW of
ion. As such, cost targets for wave and tidal        ocean energy installed capacity at the end
energy have been agreed to ensure the                of 2016, much lower than the expectation
long term uptake and viability of both tech-         set by Member States in their National Re-
nologies.                                            newable Energy Action Plans. According to
                                                     NREAPs, 641 MW of ocean energy capacity
The Ocean Energy Forum, supported by the
                                                     were expected to be operational by 2016,
European Commission, and the European
                                                     taking into account the 240 MW tidal range
Technology and Innovation Platform for
                                                     currently operational in France.
Ocean Energy have delivered strategic
roadmaps identifying key hurdles of the              By 2020, if technological and financial bar-
sector, and specific recommendations for             riers are overcome, the pipeline of an-
each ocean energy technology.                        nounced European projects could reach
                                                     600 MW of tidal stream and 65 MW of
The key bottlenecks that the ocean energy
                                                     wave energy capacity. Taking into account
sector faces moving forwards are very
                                                     only projects that have been awarded pub-
similar to those hindering it in 2014: tech-
                                                     lic funds, 71 MW of tidal stream and
nology development, financing of projects;
                                                     37 MW of wave energy capacity could be
and concerns regarding unknown environ-
                                                     operational within the EU in 2020.
mental impacts slowing down consenting
and licensing of projects.                           The next few years will be fundamental to
                                                     understand how far and how fast the mar-
The extent to which each barrier prevents
                                                     kets for both wave and tidal energy tech-
market formation is specific to each tech-
                                                     nology can be formed.
nology. Ocean thermal energy conversion
and salinity gradient technology are still at

                                                ii
Seizing the opportunity offered by the de-            The supply chain is spread across Europe,
velopment of ocean energy will not affect             and the creation of ocean energy market is
only the decarbonisation of the European              expected to affect positively many Europe-
energy system, but will play a direct role in         an regions.
assuring the competitiveness of European
                                                      A wide number of support mechanisms im-
industry. The European Union is at the fore-
                                                      plemented at European, national and re-
front of technology development, with
                                                      gional levels are currently supporting the
about 50 % of tidal energy and about 60 %
                                                      development of ocean energy, from re-
of wave energy developers being located in
                                                      search and development through demon-
the European Union. The majority of ocean
                                                      stration. Whilst, additional and innovative
energy infrastructure, such as ocean energy
                                                      instruments need to be created to over-
test centres, is also hosted in the European
                                                      come specific barriers and support demon-
Union. European technology is being em-
                                                      stration projects, the commitment of the
ployed in key demonstration projects that
                                                      European Commission and its Member
have become operational at the end of
                                                      State is strong to ensure that ocean energy
2016 in the United Kingdom and Canada.
                                                      can become a commercial reality.

                                                iii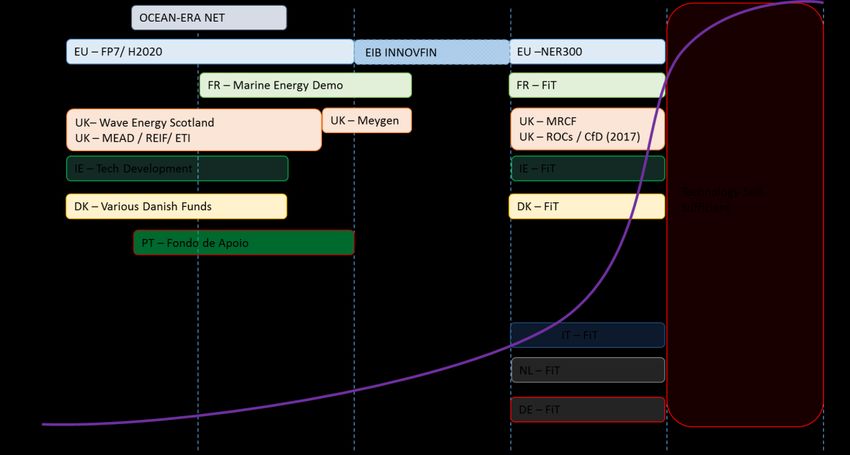
TABLE OF CONTENTS

1 Introduction ....................................................................................................................................................................................... 1
2 Technology status and development .................................................................................................................................. 4
      2.1 Tidal energy ............................................................................................................................................................................ 4
            2.1.1           Technology status ................................................................................................................................................. 4
            2.1.2           Technology development .................................................................................................................................. 5
            2.1.3           Electricity generation ........................................................................................................................................... 7
            2.1.4           Tidal Energy RDI and cost reduction ........................................................................................................... 7
      2.2 Wave energy........................................................................................................................................................................ 10
            2.2.1           Technology status .............................................................................................................................................. 10
            2.2.2           Technology development ............................................................................................................................... 12
            2.2.3           Electricity generation ........................................................................................................................................ 13
            2.2.4           Wave energy RDI and cost reduction ...................................................................................................... 14
      2.3 Tidal lagoons, OTEC and salinity gradient .......................................................................................................... 16
3 Market status ................................................................................................................................................................................ 17
      3.1 Tidal energy ......................................................................................................................................................................... 17
            3.1.1           Companies .............................................................................................................................................................. 17
            3.1.2           Project pipeline and market outlook ........................................................................................................ 19
      3.2 Wave energy........................................................................................................................................................................ 20
            3.2.1           Companies .............................................................................................................................................................. 20
            3.2.2           Project pipeline and market outlook ........................................................................................................ 21
      3.3 Supply chain considerations ....................................................................................................................................... 23
4 Policy support and other initiatives .................................................................................................................................. 26
      4.1 Regional collaboration ................................................................................................................................................... 27
5 Outlook and concluding remarks........................................................................................................................................ 29
6 References ...................................................................................................................................................................................... 31
Appendix A                   Tidal Energy .......................................................................................................................................................... 36
Appendix B                   Wave Energy......................................................................................................................................................... 40

                                                                                            iv
LIST OF FIGURES
Figure 1. Ocean energy polices at EU level ...................................................................................................... 1
Figure 2. Range of testing for tidal energy devices. Blue bars refer to technology with
significant progress in 2016. Red bars indicate technology with no considerable
update/progress in 2016. Shaded bars indicated ongoing testing. The length of
bar indicates the range of TRL attempted. The yellow dot indicates the maximum
achieved TRL. .................................................................................................................................................. 4
Figure 3. R&D effort for tidal technologies tested at full-scale. Calculation are based on
number of active companies identified developing full scale TEC.. ................................ 5
Figure 4. Electricity generation from tidal energy in the UK 2009-2014. No data is
available with regards to 2016............................................................................................................ 7
Figure 5. LCOE predictions for tidal arrays. ....................................................................................................... 8
Figure 6. Tidal energy LCOE cost reduction per cost component. Reduction of 20% (blue)
and of 50% (red) were assumed for each cost components. For capacity factor
improvements of 20% and 50% were assumed. ...................................................................... 8
Figure 7. Range of TRL for wave energy devices. Blue bars refer to technology with
significant progress in 2016. Red bars indicate technology with no considerable
update/progress in 2016. Shaded bars indicated ongoing testing. The length of
bar indicates the range of TRL attempted. The yellow dot indicates the maximum
achieved TRL. ............................................................................................................................................... 10
Figure 8. R&D effort for wave energy technologies (full and part scale). .................................... 13
Figure 9. Electricity generation from wave energy in Europe............................................................... 14
Figure 10. LCOE predictions for wave arrays.................................................................................................... 15
Figure 11. Wave energy LCOE cost reduction per cost component. Reduction of 20% (blue)
and of 50% (red) were assumed for each cost components. For capacity factors
improvements of 20% and 50% were taken into account. .............................................. 16
Figure 12. Distribution of tidal energy developers in the world ............................................................. 17
Figure 13. Spread of tidal developers (in yellow) and resource availability in Europe. Dark
blue areas refer to high resources, and light blue areas indicate limited
resources. ....................................................................................................................................................... 18
Figure 14. Tidal energy pipeline in the EU .......................................................................................................... 20
Figure 15. Distribution of wave energy developers in the world ........................................................... 20
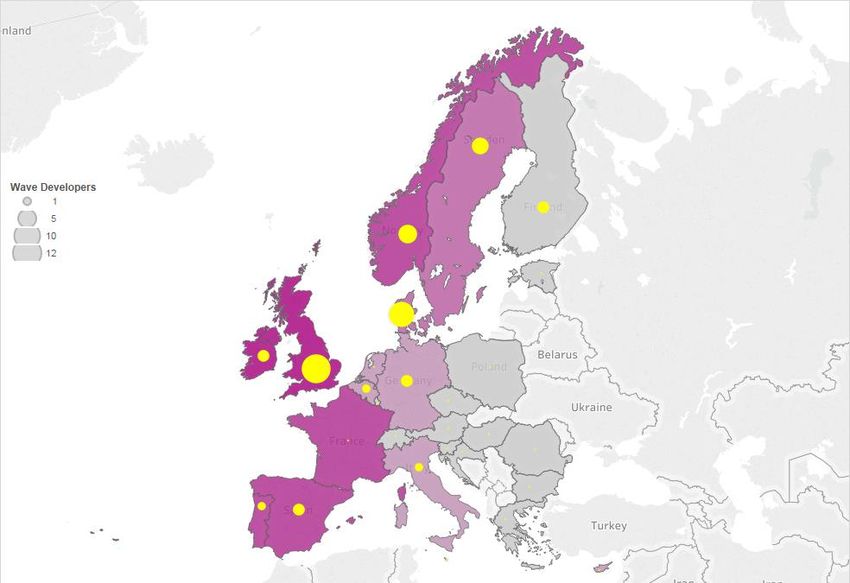
Figure 16. Spread of wave developers (in yellow) and resource availability in Europe. Dark
purple areas refer to high resources, and light pink areas indicate limited
resources. ....................................................................................................................................................... 21
Figure 17. Wave energy pipeline in the EU ........................................................................................................ 22
Figure 18. Supply chain consolidation based on market development.............................................. 23
Figure 19. Consolidated supply chain.................................................................................................................... 23
Figure 20. Non-consolidated supply chain ......................................................................................................... 23
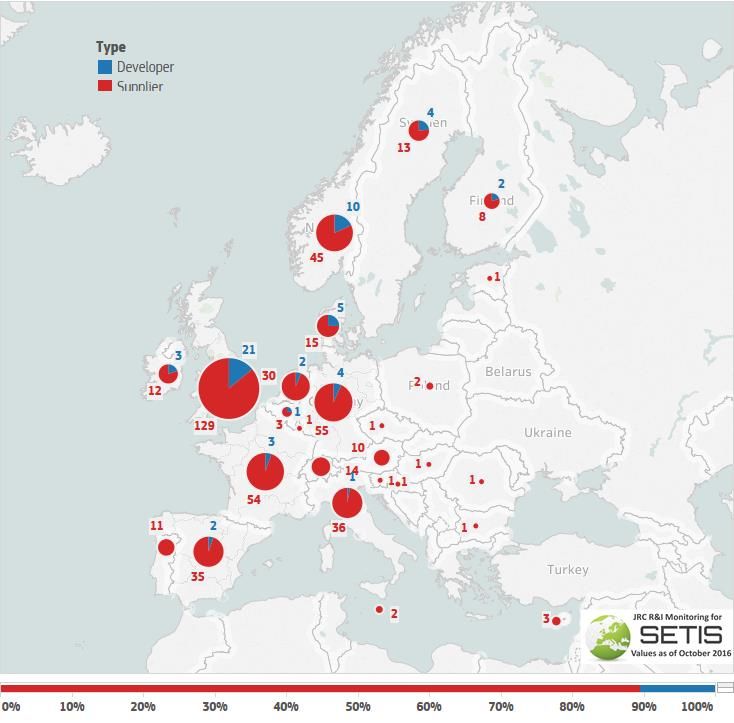
vFigure 21. Ocean Energy patenting companies in the EU in 2008-2013 Companies identified
as wave and tidal energy developers are represented in blue, supply chain and
components manufacturers are classified as suppliers and represented in red.
Please note that 2013 is the last year with complete patents data. An
assessment of patenting activity from 2014 onwards would be inaccurate and
therefore was not carried out. ........................................................................................................... 25
Figure 22. Summary of market push and pull mechanisms for ocean energy in the EU based
on Carbon Trust deployment scenarios [Vantoch-Wood 2016]. Supported
commercial indicates technologies that have a market but receive support such
as FITs, whilst the term fully commercial refers to energy technologies (not
necessarily RES) that do not require FITs or other support schemes, and are thus
self-sufficient. ............................................................................................................................................. 27
viLIST OF TABLES
Table 1. LCOE targets for wave and tidal technology presented in the SET-Plan
declaration of intent ................................................................................................................................... 1
Table 2. Major tidal current pre-commercial and first-of-a-kind demonstration projects.... 6
Table 3. H2020 projects funded to support tidal energy innovation actions ............................... 9
Table 4. Wave energy pre-commercial and first-of-a-kind demonstration projects ............. 11
Table 5. H2020 projects funded to support wave energy innovation actions........................... 15
Table 6. Ocean energy in the EU: NREAP targets and progress......................................................... 17
Table 7. List of ongoing tidal energy pre-commercial and demonstration projects
identified by JRC ........................................................................................................................................ 19
Table 8. List of ongoing wave energy pre-commercial and demonstration projects
identified by JRC ........................................................................................................................................ 22
Table 9. Non-exhaustive list of main companies identified in the field of ocean energy
conversion OEMS are underlined, whilst where companies HQs are outside of the
EU these are mentioned. ....................................................................................................................... 24
Table 10. CPC patetnig codes for ocean energy............................................................................................ 24
Table 11. Pull mechanisms for ocean energy in the EU ........................................................................... 26
Table 12. Push mechanisms for ocean energy in the EU ......................................................................... 27
viiACRONYMS AND ABBREVIATIONS
AMETS Atlantic Marine Energy Test Site
ARENA Australian Renewable Energy Agency
BNEF Bloomberg New Energy Finance
CAPEX Capital expenditure
CEFC Australia's Clean Energy Finance Council
CF Capacity factor
CfD Contracts-for-difference scheme
DIE Demonstratie energie-innovatie
EIA Environmental Impact Assessment
GHG Greenhouse gas
H2020 Horizon 2020
HAT Horizontal axis turbine
IEE Intelligent Energy Europe
IMERC Integrated Maritime Energy Resource Cluster
KPI Key performance indicator
LCA Life Cycle Assessment
LCOE Levelised cost of electricity
LEED Western Australia’s Low Emissions Energy Development Program
MEAD Marine Energy Array Demonstrator
MRCF Marine Renewables Commercialisation Fund
NER New Entrants' Reserve of the European Union Emissions Trading Scheme
NREAP National Renewable Energy Action Plan
OPEX Operating expenditure
OWC Oscillating water column
OWC Oscillating water column
PIA Programme d'Investissements d'Avenir
RO Renewable Obligation
ROC Renewable Obligation Certificates
SDTC Sustainable Development Technology Canada fund
SEIA Sustainable Energy Authority of Ireland
SPD Submerged pressure differential
TEC Tidal energy converter
TRL Technology readiness level
viiiWEC Wave energy converter
ixACRONYMS AND ABBREVIATIONS
The authors would like to thank our colleagues, who reviewed the draft report and contributed
their ideas to its improvement: Matthijs Soede from DG RTD, Xavier Guillou and Felix Leine-
mann from DG MARE, Jan Steinkho from DG ENER and Evangelos Tzimas from DG JRC.
The authors would like to thank the JRC colleagues of the SETIS R&I team who contributed to
the collection of data on patent statistics and R&I investments at EU, national and corporate
level: Alessandro Fiorini, Francesco Pasimeni, Alain Marmier and Aliki Georgakaki.
x1 Introduction
Ocean energy has been the subject of dif- States and the European Commission are
ferent policy initiatives in the past years, presented in Table 1.
both at European and national level. In the Table 1. LCOE targets for wave and tidal technolo-
European Union, following the launch of the gy presented in the SET-Plan declaration of intent
Ocean Energy communication in 2014 Technology Year Target
(COM(2014)8) and the subsequent estab- Tidal 2025 15 cEUR/kWh
lishment of the Ocean Energy Forum, the Tidal 2030 10 cEUR/kWh
industry has been asked to convene to- Wave 2025 20 cEUR/kWh
gether to identify common actions to bring Wave 2030 15 cEUR/kWh
the technology to the market. Wave 2035 10 cEUR/kWh
Most recently, the inclusion of ocean ener- The policy framework at EU level provides
gy in the new Strategic Energy Technology technology developers with the required
Plan (SET-Plan) of the European Union stability and commitment to bring ocean
(COM(2015)6317) has highlighted the cur- energy technology to the market. The SET-
rent European leadership in the sector and Plan Declaration of Intent offers scope on
the need to improve the performance of top of existing instruments available, to
ocean energy technologies throughout the help drive the sector forward towards
innovation, supply and value chain (Figure commercialisation.
1)
Significant technology cost reductions are
In line with the SET-Plan communication, required to meet the ambitious targets of
the European Commission, Member States the SET-Plan: the cost of tidal energy tech-
and stakeholders have defined a "Declara- nology has to be reduced by 75 %, and by
tion of Intent for Ocean Energy" setting out 85 % for wave energy from the current
cost-reduction targets for ocean energy levels. At the same time, ocean energy
technologies to make a significant contribu- farms have to be deployed and investors
tion to the future European energy system have to be attracted to the sector. This re-
[European Commission 2016]. quires public intervention to help drive the
The targets agreed in the Declaration of deployment of first-of-a-kind plants.
Intent between stakeholders, Member .
Figure 1. Ocean energy polices at EU level
1In November 2016, the Ocean Energy Stra- The picture is somewhat different for the
tegic Roadmap produced by the Ocean En- other ocean energy technologies. OTEC is
ergy Forum [Ocean Energy Forum 2016] making technological progress, however it
was released. Together with the Strategic presents limited resources to make a seri-
Research Agenda for Ocean Energy devel- ous contribution to the European energy
oped by Technology and Innovation Plat- system. Salinity gradient technology is at
form for Ocean Energy [TPOcean 2016], it early stage of development, with only one
proposed a number of actions to help the 50 kW demo plant currently operational,
sector towards commercialisation and and is expected to a have limited role in the
overcome the well identified gaps and bar- decarbonisation of the European energy
riers that have been hindering the sector system in the medium term (2025-2030).
[MacGillivray et al. 2013]. Tidal range and lagoons technologies are
fully developed; however, they require spe-
Key to the success of the sector will be the
cific site conditions, and will play a role at
improvement of current technologies and
local or regional level.
the identification of novel financial instru-
ments to sustain the critical phase of mov- This report stems from the need to monitor
ing to demonstration projects. This applies the evolution of ocean energy technology,
to the sector as a whole and to each of the industry and markets in Europe, with a view
different technologies involved. to their global development. This work aims
to present an overview of the issues that
In comparison to 2014, stakeholders have
the sector is facing, and to outline how the
recognised the different development paths
existing policy scenario and instruments
of the various ocean energy technologies,
made available at European, National and
and as a consequence the need to develop
Regional level could push the development
technology-specific mechanisms to bring
of the sector to achieve the targets agreed
them to the market.
in the SET-Plan declaration of intent.
Tidal technologies have reached a pre-
The report is based on the research and
commercial state, culminated with the in-
policy-support work that the Joint Research
stallation of the first tidal energy array in
Centre (JRC) is undertaking in order to sup-
the Shetland islands, followed by the four
port European energy and innovation poli-
1.5 MW rated turbines deployed as part of
cies. The ocean energy status report aims
the Meygen project in the Pentland Firth in
to portray the state of play of the sector,
November 2016. Furthermore, a number of
key achievements, and mechanisms that
smaller tidal projects have gone live in the
have been put in place to overcome docu-
EU and in Canada.
mented gaps and barriers to commerciali-
Wave energy technologies are more in an sation of the sector. The report, in line with
advanced development phase. Following the SET-Plan Declaration of Intent, will fo-
the setbacks of 2014, the wave energy in- cus primarily on tidal and wave energy
dustry is in need of identifying ways for de- technologies.
risking the demonstration phase of tech-
This report is structured as follows: section
nology. National and international initia-
2 portrays the status of the technology and
tives have been created in support of
ongoing developments. Section 3 presents
stage-gate metrics to ensure tangible pro-
the market status and its future projec-
gress made by the technology and align-
tions, and an assessment of the European
ment with funding available. Ocean Energy
supply chain. In section 4, an overview of
System (OES), Wave Energy Scotland
policy instruments at EU level are present-
(WES), the Sustainable Energy Authority of
ed. Finally, section 5 summarises the find-
Ireland (SEAI) and the US the Department
ings and gives a short outlook.
of Energy (DOE) are among the key actors
pushing for the implementation of stage-
gate metrics for wave energy.
23
2         Technology status and development

2.1       Tidal energy                                               gress concerning other tidal energy tech-
                                                                     nologies, such as vertical axis turbines, os-
                                                                     cillating hydrofoils and Archimedes screw
2.1.1 Technology status
                                                                     devices.
The development of tidal energy converters
(TEC) has progressed steadily over the past
few years. The most significant step to-
wards commercialisation of tidal energy
technology is represented by the Meygen
project, operational since 2016. Four tidal
turbines rated at 1.5 MW, that together
with the 200 kW Shetland Array developed
by NovaInnovation, form the first tidal en-
ergy arrays deployed worldwide. A number
of pre-commercial deployments have taken
place in France (OpenHydro), in the Nether-
lands (Tocardo and Bluewater TEC), in the
UK (Minesto, ScotsRenewable, Sustainable
Energy Marine) and in Canada (OpenHydro).
The tidal sector has reached a critical
phase of development, where demonstra-
tion farms are needed, thus with a clear
focus on prioritising deployment and identi-
fying systems for the optimisation of
farms.
The increasing number of deployment pro-
jects signals that tidal energy has reached
a high level of technological maturity. Hori-                        Figure 2. Range of testing for tidal energy devices.
                                                                     Blue bars refer to technology with significant pro-
zontal axis turbines have reached a tech-                            gress in 2016. Red bars indicate technology with no
nology readiness level (TRL) of 8, with lead-                        considerable update/progress in 2016. Shaded bars
ing technologies on the verge of completing                          indicated ongoing testing. The length of bar indicates
the TRL path.1 Other technologies that have                          the range of TRL attempted. The yellow dot indicates
                                                                     the maximum achieved TRL.
made considerable progress are enclosed                              Source: JRC Ocean Energy Database
tips and tidal kite devices. Ongoing projects
in France and Canada are expected to                                 The demonstration of increased reliability
prove the commercial viability of ducted                             and survivability of tidal stream turbines
turbines. Tidal kite technology has reached                          achieved through the deployment of first-
TRL 5, but the expectation to include cur-                           of-a-kind arrays will help de-risking the
rent technology learning and to test the                             sector and attract private investor to fur-
technology at TRL 7 in the coming year                               ther the viability of the sector. Neverthe-
(Figure 2). There was no significant pro-                            less, public support mechanisms are need-
                                                                     ed to fund the deployment the next phase
1
       TRL        scale      can     be       found       here       of tidal energy demonstration arrays.
      https://ec.europa.eu/research/participants/data/ref/h20
      20/wp/2014_2015/annexes/h2020-wp1415-annex-g-
      trl_en.pdf

                                                                 4
2.1.2 Technology development projects, including first-of-a-kind arrays
and pre-commercial deployments are grid-
In the period 2014-2016 the tidal energy connected and operational (Table 2).
sector has made significant progress to- Twelve of these projects are installed in the
wards commercialisation. Key technology EU, reinforcing the leading role that
developers, such as Atlantis Resources, An- European industries and governments have
dritz Hydro-Hammerfest, Openhydro, have in the creation of the ocean energy sector.
optimised their technologies for deploy- The two exceptions are the Cape Sharp
ment in Scotland (Atlantis and Andritz), in project in Canada, with Openhydro turbines,
France (Sabella and Openhydro) and Cana- and the Chinese plant deployed in
da (Openhydro). Zhoushan, Zhejiang. The latter, employs a
modular tidal energy converter, that could
Other developers, such as Tidal Energy Lim-
be expanded to about 10 MW [Zoushan
ited (TEL) have deployed full-scale devices.
Municipal People’s Governement 2015].
A number of small-size TEC developers
Prototype deployments have taken place in
such as Tocardo, Sustainable Marine Energy
other locations including the United States
and Schottel have deployed tidal turbines,
of America, South Korea, Australia,
using both floating structure and storm-
Indoneisa and China.
protection structures.
The progress towards commercialisation is
In 2014, the tidal energy sector showed
seen in the two main areas of the sector:
significant convergence towards horizontal
small-size turbines and MW-rated devices.
axis turbine technology (76 % of R&D ef-
forts in the sector according to [Corsatea & Andritz Hydro-Hammerfest, Atlantis and
Magagna 2013]). In 2016, the picture is the Openhydro are deploying arrays after hav-
same, with horizontal axis turbines domi- ing recorded significant number of opera-
nate the sector, accounting for about three tional hours and electricity generation.
quarters of companies currently developing Scotsrenewables have installed their 2 MW
full-scale tidal devices (Figure 3). floating turbine at EMEC in October 2016,
following the successful testing of their
250 kW device.
Tocardo, Schottel, Nova Innovation and
Sustainable Marine Energy have built on
their experience and are now increasing
their portfolio with new projects. Tocardo is
now preparing a semi-submerged platform
for deployment at EMEC. Sustainable Ener-
gy Marine is also aiming to deploy four Pla-
to systems at EMEC and have already
commissioned the production of sixteen
SG50 tidal turbines from Schottel. Nova
Innovation deployed a second 100 kW Tur-
bine in their Shetland array, in what has
become effectively the first tidal energy
array deployed.
The development of small-size turbine was
identified as one of the key transition of
Figure 3. R&D effort for tidal technologies tested at the tidal energy market [MacGillivray et al.
full-scale. Calculation are based on number of active
companies identified developing full scale TEC..
2013], together with floating systems. The
Source: JRC Ocean Energy Database increase in the number of deployments of
small-size turbines (bottom-fixed and on
At the end of 2016, fourteen tidal energy floating structures) appears to indicate that
5this type of installations are viable and of Europe and Canada. The ongoing devel-
cost-effective. The deployment of the mod- opments are encouraging sings for a tech-
ular tidal device opens new prospects for nology that can be expected to grow con-
tidal energy developers, as well as new siderably in the coming years and play a
market opportunities for developers outside central role in European energy system.
Table 2. Major tidal current pre-commercial and first-of-a-kind demonstration projects
Project Country Location Capacity Class Turbines Status
Paimpol-Bréhat France Paimpol-Bréhat 1 MW ET 2 x 0.5 MW OpenHydro 16 Devices deployed
m
Passage du France Ouessant 1 MW HAT 1 x 1 MW Sabella D10 Retrieved July 2016,.
Fromveur Reinstalled Nov
2016
Ramsey Sound UK Ramsey Sound 0.4 MW HAT 1 x 0.4 MW Daffodil – Decommissioned in
Tidal Energy Limited March 2016.
Oosterschelde Nether- Oosterschelde 1.2 MW HAT 5 x 0.24 MW Tocardo T2 Operational since
lands 2016
Afsluitdijk Nether- Den Oever 0.3 MW HAT 3 x 0.1 MW Tocardo T1 Operational
lands
BlueTEC Nether- Texel 0.24 MW HAT 1 x 0.24 MW Tocardo T2 Floating structure.
lands
DeepGreen 1/10 UK Stangford Loch 0.012 MW Tidal Kite 1 x 0.0120 MW DG8 (TenthTest in preparation
scale prototype) for the 1.5 MW de-
ployment in Wales
Plat-O UK Yarmouth 0.1 MW HAT 2 x 50 kW Schottel SG50 Operational since
mounted 2015
Yell UK Yell 0.03 MW HAT 1 x 30 kW Nova Innovation Operational since
Turbine 2014
Shetland UK Shetland 0.2 MW HAT 2x 100 kW Nova Innova- Two of three tur-
tion Turbine bines installed and
generating. Opera-
tional since 2015
MeyGen Phase UK Pentland Firth 6 MW HAT 4 x 1.5 MW (3 Andritz Operational since
1A HS1000, 1x Atlantis) November 2016
SR2000 @EMEC UK Orkney 2 MW HAT 1 x 2 MW SR2000 from Installed in October
Scotsrenewables 2016
Cape Sharp Canada Bay of Fundy 4 MW Enclosed 2 x OpenHydro (2 MW) Installed in Novem-
tips ber/December 2016
Xiushan Island China Zhoushan, 3.4 MW N/A First component of 1 MW Modular device to be
Zhejiang expanded to 3.4 MW
Tocardo - EMEC UK Orkney 2 MW HAT 5 arrays of 2x T2 turbines Expected 2017
rated (200 kW)
Plato - EMEC UK Orkney 1 MW HAT 16 Schottel Instream tur- Expected 2017
bine (62 kW each)
Nephtyd France Raz Blanchard 5.6 MW HAT 4 x Alstom Oceade 18 (1.4 On hold
MW)
Normandie France Raz Blanchard 14 MW Enclosed 7 x OpenHydro (2 MW) Planning, grid con-
Hydro tips nection in 2018
Sound of Islay UK Islay 10 MW HAT 4 X: Andritz HS1000 & Consented, installa-
Alstom tion in 2016
Stroma Tidal UK Pentland Firth 8 MW HAT To be announced Meygen acquired the
(Meygen 1B) Kyle Rhea NER300
project from Marine
Current Turbines
Holyhead Deep UK Anglesey 10 MW Tidal kite Minesto deep green kites Initial phase ex-
pected to reach 0.5
MW
62.1.3 Electricity generation turbines at Afsluitdijk and on the Bluetec
platform was available [Massaro 2016].
The technological maturity of tidal energy However, according to [Massaro 2016], the
technologies was achieved through many T1 demonstrator produces (1x100 kW tur-
hours of operation of stand-alone TECs. bine) up to 275 kWh per day; the Den Oev-
Technologies such as Seagen from MCT er TTC pilot with 3x100 kW turbines pro-
(acquired by Atlantis), Alstom (acquired by duces up to 1200 kWh per day and the T2
General Electrics) and Andritz Hydro- turbine (200 kW) at BlueTec between 120
Hammerfest have generated large amount kWh and 340 kWh per day. This corre-
of electricity from 2009 to 2014 (Figure 4). sponds to maximum capacity factors of
11.5 % (T1 demonstrator), 17 % (Den Oev-
er TTC), and 3 % to 7 % in the case of
Bluetec Texel.
From the data available in the UK, we see
that several devices had managed to deliv-
er electricity to the grid continuously for
longer periods. The Seagen device achieved
high capacity factors with a maximum of
almost 60 %.The average capacity factor
values for HAT ranged between 8 % and
20 %, in line reference values for R&D pro-
jects. It has to be noted that capacity fac-
tors have been calculated on a monthly
basis and do not take into account eventual
or planned shut-off or maintenance periods
of the devices.
2.1.4 Tidal Energy RDI and cost reduc-
tion
According to the OEF, the tidal energy in-
dustry should focus on the reliability of the
Figure 4. Electricity generation from tidal energy in technology developed so far, and in bridg-
the UK 2009-2014. No data is available with regards ing the gap towards the creation of a sta-
to 2016.
Source:[Ofgem 2015], own analysis ble tidal energy market. Nevertheless, R&D
activities are necessary to ensure that the
The MK1 Andritz Hydro-Hammerfest tur- cost of the technology can be reduced to
bines installed at Meygen are develop- meet the targets agreed in the SET-Plan
ments of the earlier model (HS1000) tested declaration of intent. A mix of deployment
at EMEC. Similarly, Atlantis Resources lim- and technology innovation are needed.
ited is incorporating the experience of MCT Figure 5 shows that current LCOE ranges
in their technologies. between 54 and 71 cEUR/kWh today for an
Other technologies have clocked significant average resource, with a reference value of
energy generation. The 1 MW Sabella D10 about 62 cEUR/kWh. Low resource and high
turbine deployed at Fromveur has produced resource were represented by using differ-
over 70 MWh in the first months operation, ent capacity factors. LCEO predictions have
although the grid export is currently still been calculated applying the same meth-
limited to 250 kW due to network capacity odology as in the previous edition of this
issues [Dhomé 2016]. No information about report [Magagna & Uihlein 2015]. The
the total electricity generated from Tocardo learning rates that were applied are 12 %
for CAPEX and 3 % for OPEX. The band-
7width of the average resource represents tive monitoring solution for the removal of
the low and high CAPEX values (Appendix uncertainties related to the environmental
A.3). To meet the 2025 targets agreed in impact of tidal turbines on marine mam-
the SET-Plan declaration of intent, the cu- mals.
mulative capacity of tidal energy should
From a strict technological point of view,
reach 1000 MW to 10000 MW.
R&D activities on PTO could bring a number
of advantages to the future generation of
tidal devices. Increased power capture will
lead to increased capacity factors and to
lower LCEO.
Furthermore, H2020 projects such as Tipa
and TAOIDE are working in developing wet-
gap PTO, rather than in sealed air-gap
PTOs. Current systems employ air-gap sys-
tems, making the system susceptible to the
presence of water in the nacelle. The re-
sults of such activities are expected to re-
duce significantly maintenance intervals of
tidal turbines, and thus decrease the cost
related to O&M.
Figure 6 provides an overview of the reduc-
tion of the LCEO taking into account reduc-
tion of cost-centres and capacity factor
improvements.
Figure 5. LCOE predictions for tidal arrays.
Sources: [ETRI 2014], updated; own analysis
When we look at the possibilities to reduce
the levelised cost of electricity of tidal en-
ergy, it seems promising to aim reducing
CAPEX cost components and improving the
device performance in terms of availability
and capacity factors.
Since 2014, in the EU, the Horizon 2020
framework programme has funded 10 tidal
energy projects for a total of about EUR 30
million. Five of these projects are directed
to Research and Innovation Actions (RIA) to
improve existing technologies (Table 3).
Most projects share a common goal of re-
ducing the cost of existing technologies;
and of incorporating the results of the on- Figure 6. Tidal energy LCOE cost reduction per cost
going R&D activities in their future devices. component. Reduction of 20% (blue) and of 50%
(red) were assumed for each cost components. For
Specific area of focus for most of the pro- capacity factor improvements of 20% and 50% were
jects include the optimisation of the Power assumed.
Source: Own analysis
Take Off (PTO), improved access to the tur-
bine for ease of maintenance, and innova-
8A reduction of the civil and structural costs late in a reduction of 18 % of the LCOE,
(which include structure, prime mover, whilst a 50% improvement of the CF would
moorings & foundations) by 50 % could lead to a 33% cost reduction for tidal tech-
lead to a decrease of total LCOE by almost nology.
20 %. Reducing the costs of mechanical
When comparing the different options to
equipment and installation by 50 % would reduce the overall costs of tidal energy,
allow a decrease of total LCOE by there is not one option that is more favour-
about 30 %. able than others. From Figure 6, it becomes
Other possible improvement options that clear that a combination of all measures
are not directly targeting capital expendi- could deliver a LCEO reduction of almost
ture could include a reduction of operating 75 % which would mean costs of about 15
expenditure (OPEX) Assuming a 50 % im- c EUR/kWh.
provement in OPEX would lead to reduction
of the LCOE by 16 %. An increase of the
capacity factor (CF) by 20% would trans-
Table 3. H2020 projects funded to support tidal energy innovation actions
Project Project Title Technology Focus
Acronym Developer
FloTEC Floating Tidal Energy Com- Scot Renewables Reduction of lifetime cost of 20% through expan-
mercialisation project sion of rotor diameter, and improved access for
maintenance
InToTidal Demonstration of Integrated Tocardo Demonstration of deployment solutions for tidal
Solution for offshore Tocardo turbines
Tidal power plants.
PowerKite PowerKite - Power Take-Off Minesto Optimisation of power electronics components,
System for a Subsea Tidal reduction of environmental concerns through en-
Kite hanced monitoring.
TAOIDE Technology Advancement of Ocean Renewable Development of wet-gap generators, Life time cost
Ocean energy devices through Power Company reduction. Achieve availability of 96%
Innovative Development of
Electrical systems to increase
performance and reliability
TIPA Tidal Turbine Power Take-Off Nova Innovation PTO optimisation and cost reduction of 20% of
Accelerator lifetime costs.
92.2 Wave energy 2015. Despite the high TRL reached by
some devices, their commercial readiness is
still to be proven. Most of devices tested
2.2.1 Technology status
are still to be considered advance proto-
types having demonstrated survivability to
In contrast with tidal energy technologies,
ocean conditions, but with limited electricity
the development of the wave energy sector
generation.
has slowed down over the past few years.
Technological drawbacks have reduced the
confidence of investors in wave energy
technology. On the other hand they have
sparked a number of initiatives aimed at
assuring a more thorough assessment of
wave energy technology throughout the
various testing and development phases.
At the end of 2016, the picture is not very
different from 2014, with only a handful of
devices successfully tested at TRL 8 (see
Figure 7).
According to the Ocean Energy Forum, the
focus for the wave energy industry is to
build on the demonstration of existing pro-
totypes, and to improve the performance of
key subsystems and components to in-
crease the overall device reliability and sur-
vivability [Ocean Energy Forum 2016].
The most advanced device types are oscil-
lating water column (OWC) and point ab-
sorbers, whit some specific devices have
been extensively tested at TRL 8. Oscillat-
ing wave surge converters (OWSC) and ro- Figure 7. Range of TRL for wave energy devices.
tating mass devices have reached relatively Blue bars refer to technology with significant pro-
high TRL, and are expected to follow gress in 2016. Red bars indicate technology with no
considerable update/progress in 2016. Shaded bars
through to higher TRL.
indicated ongoing testing. The length of bar indicates
No significant progress was witnessed for the range of TRL attempted. The yellow dot indicates
the maximum achieved TRL.
some specific wave energy technologies
Source: JRC Ocean Energy Database
such as attenuators, overtopping and sub-
merged pressure differential devices (SPD). Other deployments include the Sotenas
A limited number of projects have been array from Seabased, the Albatern Wave-
installed in the period between 2014 and NET array in the Isle of Muck, the two Oce-
2016. The majority of the projects include anus devices operating at WaveHub, the
small-size WECs (rated power < 50 kW), 40SouthEnergy H24 device installed in Italy
and a limited number of devices with high- and the Oceantec OWC deployed at Bimep
er power rating, such as CETO5 (240 kW) in October 2016. Outside of the EU, de-
and WaveRoller (300 kW). To date, the Car- ployments have taken place predominantly
negie CETO5 array deployed off the coast in Australia (Carnegie, as previously men-
of Perth in Australia represents the most tioned), in Norway (Waves4power) and the
advanced wave energy array in operation, Navy Test facility of Hawaii (US) where the
having clocked over 14000 hours since the Azura Wave device and Fred Olsen Bolt
deployment of the three devices in late
10have been deployed. A full list of wave en- within the EU. Whilst many projects are
ergy projects is presented in Table 4. modular and expected to reach in the long-
term a capacity of 10 MW; current installa-
In total 21 projects are currently in the wa-
tions have a power rating of less than
ter or expected to become operational in
the near future. Fifteen projects are located 1 MW.
Table 4. Wave energy pre-commercial and first-of-a-kind demonstration projects
Project Country Location Max Ca- Class Devices Status
pacity
Pico PT Azores 400 kW OWC OWC In Operation. To be decom-
missioned
Limpet UK Islay 500 kW OWC Voith Hydro Wagen Operations suspended
WaveHub UK Cornwall 10 MW Point ab- Seatricity Currently two devices in-
sorber Oceanus 2 stalled. No grid connection
Sotenäs SE Västra 10 MW Point ab- Seabased First devices deployed
Götaland (modular) sorber (1 MW)
Perth project AUS Perth 0.72 MW Point ab- Carnegie CETO5 Three CETO5 units were
(modular) sorber deployed in an small array
Ghana GH Ada 14 MW Point ab- Seabased First 6 converters assem-
(modular) sorber bled and grid connection
installed
WaveStar DK Hanstholm 0.6 MW Point ab- WaveStar Grid connected since 2010,
sorber 1:2 scale. Project no longer
operational
Mutriku ES Mutriku 0.3 MW OWC 16 OWC chambers Operational since 2011. One
(modular) rated 18.5 KW of the chamber is used for
R&D testing of new type of
turbines.
Isle of Muck UK Isle of Muck 22 kW Attenuator Albatern 3 WaveNET unit installed
(modular)
Westwave IE Killard, Ireland 5 MW t.b.d. 5 suppliers Project funder under NER
(modular) shortlisted, will be 300 (34 mio. EUR), planned
chosen mid 2016 for 2018
Fred Olsen US Navy Test Cen- 23 kW Point ab- Fred Olsen Life Device grid connected, oper-
tre, Hawaii sorber Saver ating at 30% (6.7 kW)
Azura Wave US Navy Test Cen- 20 kW Point ab- Northwest Energy Half scale prototype. Gener-
tre, Hawaii sorber Innovations ating electricity since 2015
Oceantec ES Bimep 30 kW OWC Oceantec Marmok- Installed in October 2016
A5
40SouthEnergy IT Marina di Pisa 100 kW OWSC H24 from Device installed at the end
40Southenergy of 2015.
PB3 US New Jersey 3 kW Point ab- PB3 Device installed in July
sorber 2016
Wave4Power NO Runde N/A Point Ab- WavEel Device installed in February
sorber 2016. Company does not
provide information on rated
power
Eco Wave Pow- GI Gibraltar 100 kW Point ab- Wave clapper Device installed and opera-
er (modular) sorber tive since June 2016
Seapower IE Galway Bay N/A Attenuator Seapower Platform 1:4 scale model to be tested
in 2016 in Galway Bay
CEFOW UK EMEC 3 MW Roating 3 X Wello Penguins Installation expected in
Mass 1 MW 2017, 2019 and 2019. A
device each year within
H2020 project
11Project Country Location Max Ca- Class Devices Status
pacity
Corpower UK EMEC 25 kW Point Ab- 1 x 25 KW Corpow- Device built in Portugal. Yo
sober er be tested in dry rig in Swe-
den before deployment at
EMEC
Swell PT Peniche 5.6 MW OWSC WaveRoller Funded by NER 300 (9.1
(modular) mEUR), planned for 2018,
16 devices
CETO6 AUS Garden Island 4 MW Point ab- Carnegie CETO6 1 MW device, 3 MW demo
(modular) sorber array planned
CETO6 UK Cornwall 15 MW Point ab- Carnegie CETO6 1 MW device in 2017, to be
Wave Hub (modular) sorber expanded to 15 MW by
2021
Camp Rilea US Oregon 40 kW OWSC Resolute Marine Small project with 2 devices
Energy (2017). Water will also be
used onshore for desalina-
tion
Baby Penguin ES Canary Island N/A Rotating Wello Penguin Reliability for new "mild-
mass climate" device
Wedge Global ES Canary Island N/A Point ab- Wedge Global Reliability testing new PA
sorber
2.2.2 Technology development view, it is good news for the sector that the
three CETO5 devices installed in Australia
The development of wave energy has been have achieved a cumulative 14000 hours
hindered by various setbacks in recent of operation in the Perth Project. Assuming
years, due to the slow progress made in that the devices operated for a similar
developing viable technologies. In 2016 the amount of time, the results suggest an
sector has shown signs of recovery. availability of 53 %. In Europe, key devel-
opments are expected from the deploy-
In 2012 and 2013 a number of OEM exited
the sector. In 2014, the sector was further ment of the first 1 MW Penguin developed
shocked when companies considered at an by Wello Oy as part of the H2020 CEFOW
advanced stage of development such as project. Furthermore, the first full scale
Aquamarine Power and Pelamis Wave Waveroller device is currently being manu-
Power went into administration. Aquama- factured in Finland, for deployment in Por-
rine Power folded its activities weeks after tugal.
it had been awarded a EUR 0.8 million Positive signs are also seen at lower TRL.
Horizon 2020 (H2020) grant [BBC 2015]. The JRC has identified 57 companies active
These events highlight the risk associated in developing wave energy, 40 of which are
with the development of wave energy, and still in the early phase of development.2
in particular with the full-scale demonstra- There is an increasing development of point
tion of converters. absorbers (Figure 8). The early technology
At the end of 2016 the status of the wave status of many new concepts is identified
energy sector looks somewhat different, in the "other" slice of Figure 8, since they do
with a more positive outlook, despite diffi- not fall under the standard wave energy
culties of developers like Wavestar to find categories.
investors [Nordicgreen 2016]. 21 projects
are currently in the water (as seen in Table
4). A number of array projects are moving
forward, such as CETO in Australia, Wello
and AW-Energy in Scotland and Portugal 2
Based on JRC Database and application to WES Scotland
calls and Wave Energy Prize.
respectively. From a technology point of
12the Ocean Energy Forum Strategic
Roadmap [Ocean Energy Forum 2016], with
the expectation to reduce the risk for both
technology developers and funding agen-
cies. The proposition of the Ocean Energy
Forum identifies five critical stages: R&D,
prototype, demonstration, pre-commercial
and industrial roll out; which can be loosely
associated with TRLs.
The key requirement for the implementa-
tion of stage-metric is the identification of
suitable and appropriate technological
achievements for each stage. There is an
international recognition that stage-gate
metrics would be favourable for the devel-
opment of wave energy, and efforts are
being made in order to develop and harmo-
nise the metrics at international level.
2.2.3 Electricity generation
Figure 8. R&D effort for wave energy technologies
(full and part scale).
A number of WEC have delivered electricity
The setbacks witnessed in the sector in to the grid. Understanding the progress
2014 have encouraged funding agencies made by these technologies over the years
across the globe to assess the availability helps assessing the R&D needs and targets
of funding schemes for wave energy tech- for the coming years. There is limited in-
nology, and ensure that these are accom- formation available with regards to elec-
panied with a thorough assessment of tricity generation from devices that became
technology status. operational in 2016. An overview of the
energy generated by wave energy devices
Stage-gate metrics offer the possibility of is provided in Figure 9.
monitoring and comparing success from
technology development until technology To date, the class of devices that has deliv-
are commercially viable [EERA 2016]. Tech- ered the most electricity to the grid is the
nology needs to achieve a minimum OWC. The 400 kW Pico OWC plant has de-
threshold to be able to apply for funding at livered more than 70 MWh to the grid dur-
a higher stage. Stage-gate metrics allow ing 3100 hours of operation [JRC 2014].
de-risking the phase of technology demon- The 500 kW OWC at Limpet has produced
stration that has been so critical for wave about 600 MWh from 2006 to July 2013
energy technology, by ensuring that only [Ofgem 2015]. The OWC installed in
technologies with a proven track record Mutriku produces about 300 MWh annually
have access to the funds available. [Renewable Technology 2015]. In July
2016, it was announced that Mutriku had
Stage-gate systems have been developed surpassed the 1.3 GWh mark - a key mile-
and implemented by different funding
stone for the wave energy industry [EVE
agencies (Wave Energy Scotland, Sustaina-
2016].
ble Energy Authority of Ireland and the US
Department of Energy). Other agencies in By contrast, the data available for Pelamis
Wales, Pays de la Loire and Cornwall are show that the P2 (750 kW) owned by E.ON
considering the implementation of stage- UK delivered 44 MWh to the grid between
metrics for wave energy technology. Simi- November 2011 and April 2012. The P2
larly, this approach, recommended also in owned by ScottishPower Renewables, has
13instead delivered about 102 MWh to the on a continuous base (i.e. in more than
grid between October 2012 and June 2014. twelve consecutive months), aside from
[Scottish Renewables 2014] OWC. The capacity factors achieved are
low, reaching 25 % in the case of OWC and
10 % for other device types.3 Capacity fac-
tors of WECs need to reach 30 % to 40 %
for the technology to become economically
viable.
2.2.4 Wave energy RDI and cost re-
duction
Compared to tidal energy, wave energy
technologies are still in need of R&D to
identify viable solutions and to ensure the
survivability and reliability of key compo-
nents. The full-scale prototypes expected to
be deployed in the near future could play a
key role in assessing the reliability of key
components.
The current LCOE of wave energy ranges
between 60 cEUR/kWh and 110 cEUR/kWh
Figure 9. Electricity generation from wave energy in today for an average resource, with a ref-
Europe
Sources: [Eurostat 2015], own analysis erence value of about 85 cEUR/kWh, as re-
ported in Figure 10. At the extreme, values
Aquamarine Power installed the Oyster 2 can reach up to 139 c EUR/kWh in case of a
device (800 kW) at EMEC in 2012 and it fed poor resource and can go down to about 44
about 12 MWh of electricity to the grid be- c EUR/kWh in case of a good resource.
tween February and November 2013 Estimates of the LCEO for wave energy
[Ofgem 2015]. The first BOLT device from technologies are affected by the lack of a
Fred Olsen was installed and tested at dominating technology as well by uncer-
Risør in Norway and produced about 3.4 tainties caused by unproven technologies in
MWh between June 2009 and December terms of electricity generation, as reported
2010 [Sjolte et al. 2013, JRC 2014]. The also by OES [OES 2015].
following model, the 240 kW BOLT Lifesav-
er was subsequently installed in 2012 at Based on data from ETRI [ETRI 2014], the
FabTest in the UK and has delivered about reference capacity factor of 25 % for first-
4.6 MWh to the grid [Taylor 2013, Sjolte of-a-kind wave energy arrays was em-
2014]. The 1:2 WaveStar prototype at ployed; however as seen in the previous
Roshage device has produced about 70 section, current technology is far away
MWh from September 2009 to April 2013 from it.
[JRC 2014]. Given current uncertainties, the 2025 tar-
No information is yet available on the pow- get of 20 c EUR/kWh would be reached only
er production of the Perth Wave Energy after 10 GW of cumulative capacity has
Project by Carnegie in Australia or by the been installed. Cost reductions could be
WaveEl device installed in Norway aside achieved quickly, if the right technology
from information regarding the survivability progression undertaken, with the SET-Plan
of the devices.
No wave energy converter has thus far 3
Calculations do not take into account eventual or planned
shut-off or maintenance periods of the devices.
been able to deliver electricity to the grid
14You can also read