Valuation of 3G spectrum license in India: A real option approach - Munich Personal ...
←
→
Page content transcription
If your browser does not render page correctly, please read the page content below
Munich Personal RePEc Archive

Valuation of 3G spectrum license in
India: A real option approach

Sinha, Pankaj and Mudgal, Hemant

Faculty of Management Studies, University of Delhi

15 April 2011

Online at https://mpra.ub.uni-muenchen.de/31281/
MPRA Paper No. 31281, posted 05 Jun 2011 15:07 UTC
Valuation of 3G Spectrum License in India
               : A Real Option Approach

                      Pankaj Sinha and Hemant Mudgal
               Faculty of Management Studies, University of Delhi

                                       Abstract
India is about to enter a new technological phase as far as mobile technology is concerned. After
almost a decade of existence, Third Generation (3G) mobile technology will be rolled out in
India. The licenses for the same were auctioned in April – May 2010 and 3G licenses were
allocated to the winners in September 2010. Nine private telecom operators entered the bidding
for the license and eventually seven won the licenses. The bidding was intense and eventually the
aggregate fees of the license as received by the government were almost twice the expected
amount. In the backdrop of experience of 3G auction winners in UK and Germany who paid huge
sums to acquire the 3G licenses and later lost their market capitalization as the markets perceived
that the price paid for the license was more than the actual value of the license, analysts in India
were concerned if the operators had paid too much for the licenses. In this report aggregate value
of the 3G licenses is calculated using both traditional discounted cash flow approach and real
options approach. We find that the rollout of 3G services gives an internal rate of return of
14.2%over the life of the license. If we assume an internal rate of return of 15% for the telecom
operators then the aggregate license value comes out to be INR 594 Billion which is 12% lower
than what the operators have paid to acquire the license. We also found out that the value of the
license as calculated from the real options methodology is INR 798 Billion which is 17.8% higher
than the aggregate value paid by the operators. Hence we see that DCF valuation suggests that the
licenses were overvalued while Real Options methodology suggests that the licenses were
undervalued.

The report discusses the reasons for differences between real option valuation and DCF valuation
of the license, the possible challenges that the 3Goperators might face in the short to long term
and what are the key enablers for the growth of3G services if they want to extract the maximum
mileage out of the 3G technology. The report recommends that in future while allocating telecom
licenses or licenses in sectors where high and irreversible investment is required and there is a
scope for the licensees to invest in phases or in modules, the government should consider real
options methodology for setting the price of the license., or the base price of the licenses in case
the government decides to follow an auction methodology.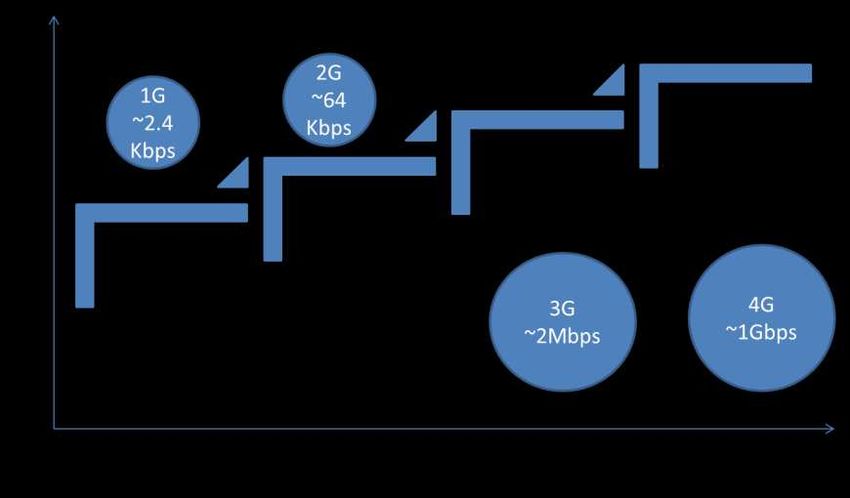
Valuation of 3G Spectrum License In India: A Real Options Approach 2011

     Table of Contents
1     Introduction ........................................................................................................................ 6

    1.1     3G in Emerging Markets ............................................................................................. 7

    1.2     3G Auctions Worldwide.............................................................................................. 9

      1.2.1        Auction ................................................................................................................. 9

      1.2.2        Assignment .......................................................................................................... 9

      1.2.3        Beauty Contest ..................................................................................................... 9

    1.3     3G Auctions in India & Industry Snapshot ............................................................... 10

    1.4     3G – Indian Perspective ............................................................................................ 16

      1.4.1        3G Broadband .................................................................................................... 18

    1.5     Drivers of 3G in India – Consumer & Operator Perspective .................................... 21

2     Historical overview of Mobile Technology ..................................................................... 24

    2.1     GSM .......................................................................................................................... 25

    2.2     CDMAone ................................................................................................................. 25

    2.3     Channel Access Method/Air Technology ................................................................. 26

      2.3.1        TDMA ................................................................................................................ 26

      2.3.2        CDMA................................................................................................................ 26

    2.4     Cellular Technology .................................................................................................. 26

    2.5     What is 3G? ............................................................................................................... 27

      2.5.1        UMTS ................................................................................................................ 28

      2.5.2        CDMA2000........................................................................................................ 28

    2.6     Technology Evolution Path & Future Technologies ................................................. 29

      2.6.1        Evolution of 3G.................................................................................................. 30

      2.6.2        Evolution of 4G (AII – IP) ................................................................................. 30

    2.7     Migration Path to 3G ................................................................................................. 32

3     Literature Review............................................................................................................. 33

4     Methodology .................................................................................................................... 43

2|Page
Valuation of 3G Spectrum License In India: A Real Options Approach 2011
4.1 Discounted Cash Flow Valuation .............................................................................. 44
4.2 Real Option Valuation ............................................................................................... 45
5 Data & Assumptions ........................................................................................................ 47
5.1 Population & Population Growth Rate ..................................................................... 47
5.2 Wireless Subscribers & Wireless Teledensity .......................................................... 48
5.3 3G penetration ........................................................................................................... 48
5.4 Revenue Projections .................................................................................................. 50
5.5 3G Mobile-Broadband Subscribers Ratio ................................................................. 51
5.6 3G Prepaid-Postpaid Split (Mobile Services) ........................................................... 54
5.7 2G ARPU Projections ............................................................................................... 56
5.8 3G Mobile Handset ARPU ........................................................................................ 57
5.9 Modem-Broadband ARPU ........................................................................................ 58
5.10 Blended 3G ARPU ................................................................................................ 58
5.11 Revenue Composition of 3G Mobile ARPU ......................................................... 58
5.12 Operator‟s share in Data ARPU ............................................................................ 59
5.13 Capital Expenditure ............................................................................................... 60
5.14 Operating Expenditure ........................................................................................... 61
5.15 Financing of Capital Expenditure and License Fees ............................................. 61
5.16 Depreciation & Amortization ................................................................................ 62
5.17 Cost of Capital ....................................................................................................... 62
6 Results & Findings ........................................................................................................... 65
6.1 NPV & IRR ............................................................................................................... 65
6.2 Revenue Projections .................................................................................................. 67
6.3 Incremental Revenues for 3G Operators ................................................................... 67
6.4 Real Option Valuation of 3G License ....................................................................... 68
7 Conclusions & Recommendations ................................................................................... 71
8 References ........................................................................................................................ 74
3|PageValuation of 3G Spectrum License In India: A Real Options Approach 2011
9 Appendix .......................................................................................................................... 79
9.1 DCF Model ................................................................................................................ 79
9.2 DCF Assumptions ..................................................................................................... 82
Table of Figures
Figure 1 – Cellular Teledensity in Developed & Developing Countries ................................... 7
Figure 2 – Comparison of GNI & Teledensity of Developed & Developing Nations .............. 8
Figure 3 – ARPU trend in India ............................................................................................... 12
Figure 4 – Comparison of GSM & CDMA ARPU .................................................................. 12
Figure 5 – Circle wise ARPU for Jan-Mar'10 Quarter ............................................................ 14
Figure 6 – Circle wise mobile revenue for Jan-Mar'10 Quarter .............................................. 14
Figure 7 – Circle wise license fees paid by Operators ............................................................. 15
Figure 8 – Circle Wise Allotment of 3G Spectrum to Operators ............................................ 15
Figure 9 – Implications for 3G Operators ................................................................................ 18
Figure 10 – Broadband & Internet Subscribers in India .......................................................... 18
Figure 11 – Wireless & Wireline Subscribers in India ............................................................ 19
Figure 12 – Quarterly net additions in wireless subscriber base in India ................................ 19
Figure 13 – Drivers of Mobile Broadband in India ................................................................. 20
Figure 14 – Mobile Data Subscribers in India ......................................................................... 20
Figure 15 – Cellular Network .................................................................................................. 27
Figure 16 – Evolution of Wireless Technology ....................................................................... 29
Figure 17 – Guiding Principles for 4G Technology ................................................................ 31
Figure 18 -- Differences between Net Present Value & Real Options Valuation Approach ... 35
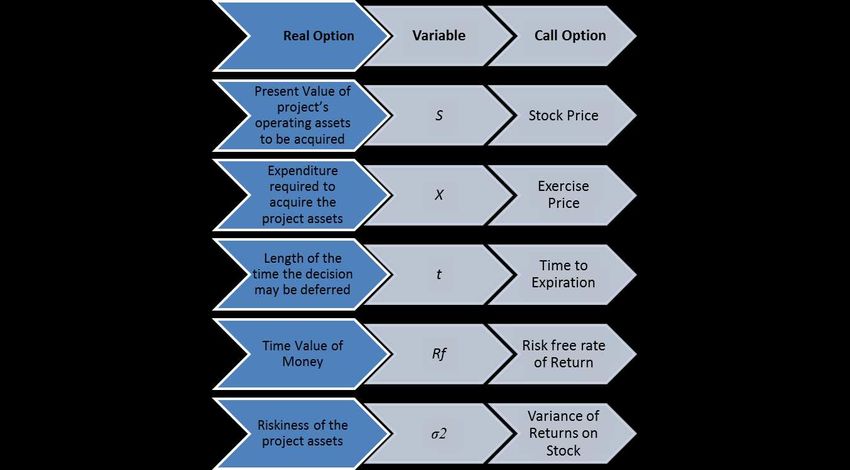
Figure 19 – Analogies between a Real Option and a Financial Call Option ........................... 43
Figure 20 – Rise in 3G Penetration in Developed Countries ................................................... 49
Figure 21 – 3G Penetration in Developed Markets ................................................................. 49
Figure 22 – Teledensity in India (Urban Vs. Rural) ................................................................ 50
Figure 23 – Comparison of Capacity of 3G Vs. 2G Base Sites ............................................... 52
Figure 24 – Capacity of 2G & 3G Base Sites .......................................................................... 52
Figure 25 – Proportion of Broadband among 3G Subscribers (Projections) ........................... 53
Figure 26 – Split of 3G Subscribers ......................................................................................... 53
4|PageValuation of 3G Spectrum License In India: A Real Options Approach 2011 Figure 27 – Number of Postpaid & Prepaid Subscribers in India............................................ 54 Figure 28 – Proportion of Postpaid Subscribers among Total Mobile Subscribers in India ... 55 Figure 29 – Projections for proportion of prepaid and postpaid subscribers among total mobile subscribers ................................................................................................................... 55 Figure 30 – 2G Prepaid & Postpaid ARPU in India ................................................................ 56 Figure 31 – Projections for 2G Prepaid & Postpaid ARPU in India ....................................... 57 Figure 32 – Premium of 3G over 2G for some of the operators in Developed Nations .......... 59 Figure 33 – Revenues from 3G Services ................................................................................. 67 Figure 34 – Incremental Revenues from 3G Services for 3G Operators ................................. 68 Figure 35 – Option Value with Change in Volatility............................................................... 70 Figure 36 – DCF Model (2010 – 2016) ................................................................................... 79 Figure 37 – DCF Model (2017 – 2023) ................................................................................... 80 Figure 38 – DCF Model (2024 – 2030) ................................................................................... 81 Figure 39 – DCF Assumptions (2011 – 2016) ......................................................................... 82 Figure 40 – DCF Assumptions (2017 – 2023) ......................................................................... 83 Figure 41 – DCF Assumptions (2024 – 2030) ......................................................................... 84 Table of Tables Table 1 – Snapshot of 3G Auctions in other nations ................................................................. 9 Table 2 – Snapshot of rules of 3G auction in India ................................................................. 11 Table 3 – Shapley Valuation of Spectrum for Various Operators ........................................... 16 Table 4 – Comparison of Wireless Technologies .................................................................... 31 Table 5 – Operating Cost Structure in Telecommunications Industry in India ....................... 61 Table 6 – Average Debt Equity Ratio of Telecom Operators .................................................. 62 Table 7 – Calculation of Beta .................................................................................................. 63 Table 8 – Cost of Capital Calculations .................................................................................... 64 Table 9 – Base Case NPV & IRR ............................................................................................ 65 Table 10 – Sensitivity Analysis of NPV vs. Beta & Premium of 3G over 2G ........................ 65 Table 11 – Sensitivity Analysis of NPV vs. Proportion of Broadband Subs in Total 3G Subs & Cost of Capital ..................................................................................................................... 66 Table 12 Sensitivity Analysis of NPV vs. EBITDA Margin ................................................... 67 5|Page
Valuation of 3G Spectrum License In India: A Real Options Approach 2011

1       Introduction
India is the 2nd largest telecom market in the world and operators had bid aggressively for the
3G spectrum license primarily to shore up the fall in the ARPU and improve their profit
margins. India is divided into 23 telecom circles. Though the overall Teledensity is around
60%, Teledensity in some of the Metro and Category „A‟ circles is above 100%. Telecom
operators in this fast growth environment are suffering from hyper competition and addition
of prepaid subscribers because of which ARPU has fallen from INR 272 in Mar‟ 07 to 120 in
Mar‟10. In India ~95% of the subscribers are prepaid subscribers.

Analysts were worried if winners‟ curse would hit Indian 3G auction winners and whether the
winners of the auction would actually end up paying more than the true value of the license.
Some analysts believe that winners‟ curse hit the auction winners in UK and Germany. UK
and Germany auction generated USD 35 Billion and USD 46 Billion1respectively which were
much more than the amount initially expected.

The motivation to undertake this piece of research was the overwhelming 3G spectrum
license fees as discovered during the 3G spectrum license auction last year. 3G license
auction in India ran for almost 34 days and after 183 rounds of bidding 9 telecom operators
shelled out INR 67718.95 crore. The auction started on 9th April 2010 and concluded on 20th
May 2010. Out of this amount INR 50968.37 was shelled out by 7 private operators while
INR 16750.58 was shelled out by the state owned operators namely BSNL & MTNL2.The
windfall received by government in the form of auction amount was almost twice the amount
as expected by the government. The reserve price of the pan-India 3G spectrum as discovered
during the auction (INR 16750 crore) was almost 5 times its reserve price (INR 3500 crore)
as set by the government before the start of the auction3.While many news articles claimed
that price of the 3G license as paid by the operators was above its intrinsic value, there was
areport in The Economic Times which claimedthat there could be a business case for some of
the 3G operators despite the high license fees4.

1
    www.pensions-research.org/3G.pdf, accessed on 10-03-2011
2
    http://www.medianama.com/2010/05/223-3g-auction-india-ends-provisional-winners, accessed on 10-03-2011
3
    http://articles.timesofindia.indiatimes.com/2009-08-28/india-business/28196801_1_reserve-price-bwa-
spectrum-pricing, accessed on 10-03-2011
4
    http://articles.timesofindia.indiatimes.com/2009-08-28/india-business/28196801_1_reserve-price-bwa-
spectrum-pricing, accessed on 10-03-2011

6|Page
Valuation of 3G Spectrum License In India: A Real Options Approach 2011
Before discussing the intricacies of the auctions, I would now like to discuss about the
relevance of 3G in Emerging Markets, 3G Auctions worldwide, 3G Auctions in India and
Value of 3G from an Indian Perspective. In the 2nd chapter I would discuss about the
historical evolution of the mobile technology, and the migration path of previous and
futuristic wireless technologies.
1.1 3G in Emerging Markets
There is a stark difference in mobile Teledensity between developing and developed nations.
The following graphic in Figure 1 represents the same,
140 India
120
China
100
RSA
80
Indonesia
60
Colombia
40
United States of
20 America
United Kingdom
0
2000 2001 2002 2003 2004 2005 2006 2007
Figure 1 – Cellular Teledensity in Developed & Developing Countries
Source: Worldbank
The major factors which affect the growth of the mobile telephony are lower incomes which
give rise to small tax collection and hence lower expenditure by government in providing the
enabling infrastructure. As we discussed earlier there is an established correlation between
growth of mobile and broadband services and the income of a nation. To provide boost to the
growth of telecommunications in emerging markets, various governments establish funds to
create a service infrastructure where it is really needed. Some of the measures that
governments take are subsidizing the license fees, creating public sector telecom entities,
reduction of duties etc. They may also adopt policies like Calling Party Pays and reduce the
financial burden on lower income subscribers5.The graphics below in Figure 2 demonstrate
the 2008 values of GNI per Capita and Mobile Cellular Teledensity,
5
http://en.wikipedia.org/wiki/4G, accessed on 10-03-2011
7|PageValuation of 3G Spectrum License In India: A Real Options Approach 2011
Figure 2 – Comparison of GNI & Teledensity of Developed & Developing Nations
Source: Worldbank
The figure gives a gross picture of how Mobile Teledensity affects GNI. A similar
relationship is seen between Internet Penetration and GNI per Capita. Hence communications
infrastructure provides an economic stimulus to a country‟s economy. Globally the capital
cost of providing mobile coverage per subscriber is one-tenth of that of capital cost required
for providing wireline coverage. Developing countries are prone to theft and vandalism of
public properties because of low income levels and unstable economic and political
environment. Due to this reason wireless technology is advantageous as the infrastructure is
less prone to theft and vandalism as compared to wireline infrastructure. Moreover wireless
infrastructure could be laid quickly as compared to wireline infrastructure and is scalable
too.Till October ‟07 there were more than 44.2 crore CDMA2000 deployments across the
globe. Majority of these deployments were in developing markets6.
“Popularized not only by their much greater voice/data capacities and air link, 3G wireless
technologies like EV-DO Rel. 0, EV-DO Rev. A, UMTS and HSPA have also become
preferred solutions given their excellent coverage, outstanding mobility attributes (the end
game for most wireless WAN deployments), availability in numerous spectrum bands (such as
450 MHz, 800 MHz, 900 MHz, 1.8 GHz, 1.9 GHz, 2.1 GHz, 2.5 GHz, etc.) and
interoperability with prior and future network evolutions”(Kumar, Liu, Sengupta, & Divya,
2010).
6
www.qualcomm.com/documents/files/3g-emerging-markets.pdf, accessed on 10-03-2011
8|PageValuation of 3G Spectrum License In India: A Real Options Approach 2011
1.2 3G Auctions Worldwide
3G spectrum is a scarce natural resource and hence countries across the world have adopted
various methods to allocate this piece of resource to various utility companies. Some of the
methods are,
1.2.1 Auction
In auction bidders are invited to place their bids in a competitive setting and then the
spectrum is allocated to the bidder who places the highest bid. There could be multiple
rounds in competitive bidding scenario.
1.2.2 Assignment
In case of Assignment mechanism government or the central agency that is in charge of
allocating the spectrum assigns the spectrum to various applicants without any fees.
1.2.3 Beauty Contest
In case of beauty contest spectrum is assigned to various applicants on the basis of certain
preconditions and criteria for allotment of spectrum. A spectrum fees is charged from the
operators to whom spectrum is assigned.
3G services have been rolled out in more than 100 countries throughout the worlds. Table 1 –
Snapshot of 3G Auctions in other nationsTable 1 gives a snapshot of some of the countries
where 3G spectrum has been allotted to various operators,
Table 1 – Snapshot of 3G Auctions in other nations
Country Date of Allocation Method# No. of 3G License Fee License
Licenses Per Capita (US$) Fee/GDP
Europe
Spain Mar-00 BC 4 11.8 0.08%
UK Apr-00 A 5 576.5 2.34%
Netherlands Jul-00 A 5 156.5 0.65%
Germany Aug-00 A 6 561.7 2.43%
Italy Oct-00 A 5 193.6 1.01%
Austria Nov-00 A 6 76.2 0.31%
Norway Nov-00 BC 4 10 0.03%
Switzerland Dec-00 A 4 16.1 0.05%
France Jul 2001+Dec 2001 BC 3 318 1.29%
Asia
Japan Oct 2001-Dec 2002 Assignment 3 0 0%
Malaysia Jul 2005-2008 BC/A 2 1 0.01%
South Korea Oct 2000-May 2001 Assignment/BC 3 62.9 0.57%
#
A: Auction; BC: Beauty Contest
Source: ICRA(ICRA Limited, 2009)
9|PageValuation of 3G Spectrum License In India: A Real Options Approach 2011
As can be seen from the above table majority of the nations in Europe went for the auctions
method of allotting spectrum while majoring of nations in Asia went with Assignment or
Beauty Contest methods of allotment of spectrum. The other startling fact that comes out
from this graphic is the time lag which we are seeing in case of 3G rollout in India. Most of
the countries listed in the table auctioned or allotted 3G air waves in 2000 – 2002; however
India auctioned 3G airwaves only in 2011.
High license cost in Germany and Europe became case studies to see if the licenses have been
overvalued or not. High licenses costs coupled with low initial adoption of technology and
high investment costs required to roll out the 3G services affected the financial performance
of major operators in these countries.
1.3 3G Auctions in India& Industry Snapshot
India decided to go ahead with auctions methodology for allocating 3G airwaves. India is
divided into 23 telecom circles. Indian government decided to auction 3G airwaves in the 2.1
GHz band in blocks of 2 x 5 MHz with a maximum of 5 blocks per circle. In some of the
circles 1 more block of 2 x 1.25 MHz in the 800 MHz was auctioned to any UASL licensee
who was offering CDMA services. The objectives that Government of India set for the 3G
auctions were7 (Department of Telecommunications, 2010),
To stimulate competition in the telecom sector
To ensure that operators don‟t hoard the spectrum and it is used efficiently
To maximize proceeds from the auction
To promote rollout of 3G & broadband services
To provide additional spectrum to existing 2G operators so that they can overcome
the problem of scarcity of spectrum and hence improving quality of service
To obtain a market determined price for 3G spectrum
Table 2as published by ICRA in their report on 3G & Its Implications for India Operators
summarizes the salient features of the auction,
7
DOT, 3G & BWA Notice Inviting Applications for Auctions
10 | P a g eValuation of 3G Spectrum License In India: A Real Options Approach 2011
Table 2 – Snapshot of rules of 3G auction in India
Auction Rules Only one entity to be allowed to bid from the same Group.
3G spectrum – 2.1 GHz band
o Any entity holding Unified Access Service (UAS)/Cellular Mobile
Telephone Services (CMTS) License; or
Eligibility
o Any entity having previous 3G experience whether directly or through
a majority-owned subsidiary and undertaking to obtain a UAS license prior to
commencement of operations
2 x 5 MHz in the 2.1 GHz band (maximum of 5 blocks per Circle)
Rs. 35.0 billion for 2.1 GHz band
Frequency Bands
Clock stage to determine the spectrum lot winners
Assignment stage to assign specific frequency to the winners
Negative demand: 0% increase
Zero excess demand: 2% increase
Bid Price Increments
Demand in excess of 1 or 2 bidders: 5% increase
Demand in excess of 3 or more bidders: 10% increase
Successful bidders are required to deposit 25% of the auction amount
within five days of the close of auction and the remaining 75% within the
next 10 days
On full payment, Department of Telecommunications (DoT) will issue a
Allocation of Spectrum
Letter of Intent (LoI) and would allocate spectrum within 15 days of full
payment of the auction amount
New spectrum winners would be allocated 3G spectrum after they have obtained
UAS License
At the end of 5 years from the date of spectrum allocation or grant of
UAS license (if applicable) whichever is later, the service provider needs
Rollout Obligations to cover 90% of the Metro areas and 50% of the District Headquarters
(DHQs) or cities in the service areas, out of which 15% of the DHQs
must be rural Short Distance Charging Areas
Spectrum charges for existing players to be the same as the revised
spectrum charges for 2G spectrum. 3G spectrum is not to be counted to arrive
at the relative slab of spectrum
Spectrum Usage Charges
Standalone 3G carriers will be charged 3% of Adjusted Gross Revenue (AGR)
after the first year of allocation of spectrum, which is equal to license fees
paid by a 2G carrier with base spectrum of 4.4 MHz of GSM spectrum
Source: ICRA (ICRA Limited, 2009)
The reserve price of the pan-India 3G spectrum as discovered during the auction (INR 16750
crore) was almost 5 times its reserve price (INR 3500 crore) and that was the main motivation
to do a valuation of the 3G license. Some of the qualitative reasons because of which licenses
have received high valuations are,
Average Revenue per User. Declining Average Revenue per user because of a hyper
competitive environment and innovative pricing by prepaid operators has put
immense pressure on the profitability of mobile operators.
11 | P a g eValuation of 3G Spectrum License In India: A Real Options Approach 2011
ARPU (INR)
300
250
200
150
100
ARPU (INR)
50
0
Jun, 2007
Jun, 2008
Jun, 2009
Mar, 2007
Mar, 2008
Mar, 2009
Mar, 2010
Sep, 2007
Sep, 2008
Sep, 2009
Dec, 2007
Dec, 2008
Dec, 2009
Figure 3 – ARPU trend in India
Source: CMIE Database (TRAI)
400
350
300
250
200
GSM ARPU (INR)
150
CDMA ARPU (INR)
100
50
0
Apr-06
Apr-07
Apr-08
Apr-09
Dec-09
Dec-05
Dec-06
Dec-07
Dec-08
Aug-06
Aug-07
Aug-08
Aug-09
Figure 4 – Comparison of GSM & CDMA ARPU
Source: CMIE Database (TRAI)
Spectrum Scarcity. Department of Telecom (DoT) has prescribed certain quality
standards for providing mobile services. Operators were facing a tough time in
adhering to these standards because of high subscriber and bandwidth requirement
growth in face of a limited spectrum. This is especially true in case of Metros and
Category A circles.
Mobile Number Portability. Mobile Number Portability was to be launched in India
when 3G auctions were taking place. Operators vouched to get a piece of 3G
spectrum in areas where they had a stronghold to retain their premium customers by
12 | P a g eValuation of 3G Spectrum License In India: A Real Options Approach 2011
offering them better services and transferring them to 3G spectrum to provide them
better voice quality and an enhanced user experience.
Broadband. 3G spectrum could be used by operators to provide broadband services.
India‟s broadband penetration is abysmal and hence scope for growth is enormous in
the future. Wireless broadband requires a low capital expenditure as compared to a
wireline broadband coupled with the fact that ARPU of broadband is around INR 700
while that of Mobile Services is around INR 110.
Various operators that bid for the 3G spectrum included the incumbent operators such as
Airtel, Aircel, Reliance Telecom, Idea Cellular, Vodafone Essar and TTSL. Some of the new
entrants like Unitech Telenor and Sistema Shyam also bid for the 3G spectrum to compete
with the incumbent operators. International operator like S-Tel also bid for the 3G spectrum.
The circle wise list of operators and amount shelled by each of them is provided in appendix.
The government raised a windfall of INR 67718.95 crore from the auctions. Out of this
amount almost ~39% was raised from Delhi and Mumbai circles only. If we add the other
three top circles of Karnataka, Tamil Nadu, and Andhra Pradesh then it accounts for almost
~65% of the bids.
Aircel, Bharti & Reliance won 13 blocks of 2x5 MHz spectrum in 13 circles. Idea won 11,
Vodafone won 9, TTSL won 9 and STel won 3 licenses. The interesting fact was that none of
the operators won a pan-India license and hence we could see some collaboration between
players to provide a seamless 3G access for their subscribers.
ARPU, Jan - Mar'10 (INR)
250.00
200.00
150.00
100.00
ARPU, Jan - Mar'10 (INR)
50.00
0.00
Punjab
TN
Orissa
NE
Delhi
HP
Kerala
UP (W)
AP
J&K
MP
Bihar
Kolkata
UP (E)
Gujarat
Haryana
Mumbai
Assam
Maharashtra
Chennai
Rajasthan
Karnataka
All India
WB
13 | P a g eValuation of 3G Spectrum License In India: A Real Options Approach 2011
Figure 5 – Circle wise ARPU for Jan-Mar'10 Quarter
Source: Cellular Operators Association of India
Total Revenue (INR crores)
Jan-Mar'10
1400.00
1200.00
1000.00
800.00
600.00
400.00 Total Revenue (INR crores)
200.00 Jan-Mar'10
0.00
TN
Delhi
Kerala
Orissa
UP (W)
Punjab
NE
HP
Karnataka
AP
Bihar
MP
WB
UP (E)
Gujarat
Kolkata
J&K
Maharashtra
Assam
Haryana
Chennai
Mumbai
Rajasthan
Figure 6 – Circle wise mobile revenue for Jan-Mar'10 Quarter
Source: Cellular Operators Association of India
Figure 5 and Figure 6 represent the Average Revenue per User and Total Revenue for GSM
Cellular subscribers. The data has been taken from COAI (Cellular Operators Association of
India). High ARPU in Delhi and Mumbai because of the demographics of the subscribers and
high revenue earning circles of Tamil Nadu, Andhra Pradesh, Karnataka and Maharashtra
have received the highest valuation for the license. The circle wise revenue earned from
license is presented in the graph below.
INR Crore
12000
10000
8000
6000
4000
2000 INR Crore
0
Andhra…
Haryana
Delhi
HP
Karnataka
UP (W)
Punjab
Kerala
NE
Tamil Nadu
Bihar
Orrisa
Kolkata
MP
WB
Gujarat
UP (E)
J&K
Maharasthra
Assam
Mumbai
Rajasthan
14 | P a g eValuation of 3G Spectrum License In India: A Real Options Approach 2011
Figure 7 – Circle wise license fees paid by Operators
Source: Medianama8
Circle Aircel Bharti Idea Reliance STEL Tata Vodafone Total
Delhi 9950.79
Mumbai 9741.21
Maharashtra 4739.73
Gujarat 4394.82
AP 4119.42
Karnataka 3773.46
TN 3228.18
Kolkata 1632.78
Kerala 1542.12
Punjab 1288.04
Haryana 1093.71
UP (E) 963.09
UP (W) 937.44
Rajasthan 813.84
MP 775.08
WB 667.74
HP 494.52
Bihar 290.94
Orissa 148.92
Assam 126.9
NE 124.44
J&K 121.2
1959 - 1965 MHz 1969 - 1974 MHz 1974 - 1979 MHz 1964 - 1969 MHz
Figure 8 – Circle Wise Allotment of 3G Spectrum to Operators
Source: Medianama9
Though we could draw some inferences from the limited data shown above regarding the
high valuations paid for licenses in some of the circles, but the underlying revenue numbers
for a quarter alone are not sufficient to draw inferences regarding whether licenses in some of
the circles were undervalued, overvalued or valued correctly.
There was an article in The Economic Time titled “The Shapley Value of 3G Auction”. As
per the article in Shapley Valuation a payoff is assigned to a player based on its marginal
contribution to a randomly selected coalition. Shapley value becomes important in the current
context as none of the players has won a pan-India license and hence the players have to enter
8
http://www.medianama.com/2010/09/223-3g-mobile-india-spectrum, accessed on 10-03-2011
9
http://www.medianama.com/2010/09/223-3g-mobile-india-spectrum, accessed on 10-03-2011
15 | P a g eValuation of 3G Spectrum License In India: A Real Options Approach 2011
into agreements with each other to provide roaming services to their subscribers. Higher the
Shapley values, higher the competitive position. The table on the next page as appeared in
The Economic Times reported that as per the Shapley Valuation Bharti, Vodafone and TATA
underpaid for their licenses while Reliance, Aircel, Idea and STel overpaid for theirs‟.
Table 3 – Shapley Valuation of Spectrum for Various Operators
Shapley Value Total Outlay Value - Outlay
Company % % Ratio Decision
Bharti 24.27 24.12 1.01 Underpaid
Vodafone 23.04 22.79 1.01 Underpaid
Reliance 16.72 16.86 0.99 Overpaid
Aircel 12.6 12.75 0.99 Overpaid
Tata 11.55 11.5 1.00 Underpaid
Idea 11.27 11.32 1.00 Overpaid
STel 0.55 0.66 0.83 Overpaid
All Players 100 100 1.00
Source: The Economic Times10
1.4 3G – Indian Perspective
There are over 100 countries in the world which have adopted 3G technology. As per Morgan
Stanley global 3G penetration should reach almost 46% by 2014 which translates into 2776
Million 3G subscribers worldwide. 3G auctions were held in India in the timeframe of April –
May 2010 and licenses were allocated to the auction winners by September 2010. The
government received a windfall from the auctions. As per ICRA, the investment in 3G
licenses is a good investment from a long term perspective however various telecom
operators might face some cash flow issues in the short term primarily on account of high
interest cost on the debt raised for paying the licenses and capital required for rolling out the
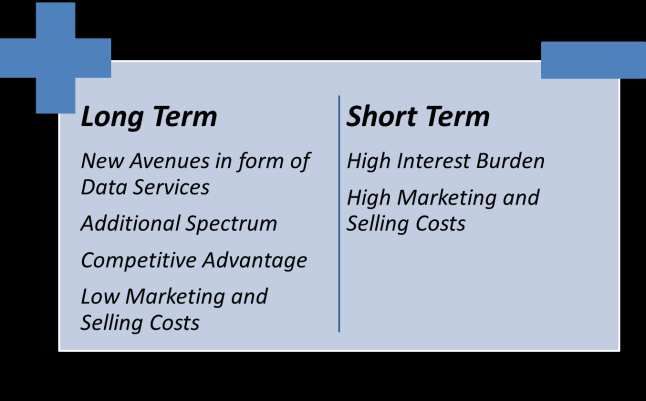
3G networks. As per an “ICRA report titled 3G Telephony Services: Implications for Indian
Operators”the impacts of investment in 3G licenses will manifest both in the long and short
term. Some of the impacts are discussed here (ICRA Limited, 2009),
Telecom operators might face high interest burden in the initial years primarily on
account of high debt burden because of huge investment in securing the license and
the investments that would be required to roll out the 3G networks.
10
http://economictimes.indiatimes.com/opinion/the-shapley-value-of-3g-auction/articleshow/6862694.cms,
accessed on 10-03-2011
16 | P a g eValuation of 3G Spectrum License In India: A Real Options Approach 2011
Telecom operators would have to incur additional marketing costs to communicate
about their 3G offerings. Since 3G penetration and growth is expected to be low in the
initial years telecom companies might offer subsidies and bundled connection and
phone in collaboration with 3G phone manufacturing company, this could suppress
the margins in the early years.
3G technology would enable the growth of data services and Mobile broadband in
India. Currently data services constitutes around 9% of the mobile ARPU, however
once the 3G services will rollout this proportion is expected to go up to 25% and even
more than that because of added applications, and enhanced user experience while
availing data services because of better speed.
The rate at which mobile subscribers are growing in India had made the 2G spectrum
available with the existing telecom operators a constraint for adding more subscribers.
With 3G spectrum available to mobile companies, their subscribes would migrate
from 2G to 3G platform thus vacating the 2G bandwidth which could be used to
provide mobile services to new 2G subscribers.
With Mobile Number Portability being introduced in Indian Telecom Industry, the
propensity of a premium consumer to switch from one operator to other operator has
increased because the consumer can now retain his number. Offering better services
and enhanced user experience can build a competitive advantage for a mobile operator
which would stop its subscribers from hopping to other mobile service providers.
In the long term as the number of 3G subscribes will increase in our country, the
mobile manufacturing companies would also achieve some scale in terms of 3G
mobile phone market. This would bring the costs down and simultaneously mobile
companies needn‟t provide subsidies on handset to simulate demand.
17 | P a g eValuation of 3G Spectrum License In India: A Real Options Approach 2011
Figure 9 – Implications for 3G Operators
Source: ICRA (ICRA Limited, 2009)
1.4.1 3G Broadband
India is a country with an abysmal broadband penetration. There were only 8 Million
Broadband Subscribers out of a population of around 1.2 Billion. A 10% rise in broadband
penetration can boost our GDP by 1.38%11. While landline broadband penetration is low
because of supply side constraints in terms of high per subscriber capital expenditure required
in case of landline broadband, the problem with wireless broadband provided by operators
like MTS, TATA, BSNL and Reliance is that of Scale. Since the scale is small, the device is
expensive and since the device is expensive the demand is less. Scalability is a concern in
wireline broadband, while wireless broadband is a highly scalable model.
20.00
15.00
10.00 Broadband Subscribers
(Mn)
5.00 Internet Subscribers (Mn)
0.00
Apr-08
Dec-04
May-05
Dec-09
Oct-05
Mar-06
Aug-06
Jan-07
Jun-07
Nov-07
Jul-09
Sep-08
Feb-09
Figure 10 – Broadband & Internet Subscribers in India
Source: CMIE Database (TRAI)
11
http://www.business-standard.com/india/news/%5C10-rise-in-broadband-penetration-will-lead-to-138-rise-in-
gdp%5C/418285, accessed on 10-03-2011
18 | P a g eValuation of 3G Spectrum License In India: A Real Options Approach 2011
Broadband penetration has been low in the country. If we look at the number of broadband
connections added between the 5 years from 2004 to 2009, the number stands around 7
Million. This number is extremely low when compared to the number of mobile subscribers
which are growing at a rate of 50 Million new subscribers in every quarter.
700
600
500
400
300
Wireless Subscribers (Mn)
200
100 Wireline Subscribers (Mn)
0
Jun, 2007
Jun, 2008
Jun, 2009
Mar, 2007
Mar, 2008
Mar, 2009
Mar, 2010
Sep, 2007
Sep, 2008
Sep, 2009
Dec, 2007
Dec, 2008
Dec, 2009
Figure 11 – Wireless & Wireline Subscribers in India
Source: CMIE Database (TRAI)
Net Additions in Wireless (Mn)
70
60
50
40
30
20 Net Additions in Wireless
10 (Mn)
0
Aug, 2009
Aug, 2007
Aug, 2008
Jun, 2007
Oct, 2007
Jun, 2008
Oct, 2008
Jun, 2009
Oct, 2009
Feb, 2008
Feb, 2009
Feb, 2010
Dec, 2007
Dec, 2008
Dec, 2009
Apr, 2008
Apr, 2009
Figure 12 – Quarterly net additions in wireless subscriber base in India
Source: CMIE Database (TRAI)
The sluggish performance of broadband in our country depends on both poor demand and
supply economics. As per a report by consulting firm PWC titled Mobile Broadband –
Outlook 2015(PricewaterhouseCoopers India, 2010), the capital expenditure per subscriber in
a wireline broadband is around INR 90000 while the capital expenditure per subscriber in a
19 | P a g eValuation of 3G Spectrum License In India: A Real Options Approach 2011
wireless broadband is as low as INR 3000. Some of the additional factors which have led to
slow growth of broadband services in India are illustrated in the figure,
Figure 13 – Drivers of Mobile Broadband in India
Source: PWC (PricewaterhouseCoopers India, 2010)
Compare the growth of broadband subscribers with the following graphic which shows the
number of users who can access data from their mobile phones.
Data Subscribes (Mn)
200.00
150.00
100.00
Data Subscribes (Mn)
50.00
0.00
Dec-07
Dec-08
Dec-09
Mar-10
Jun-08
Mar-07
Mar-08
Mar-09
Jun-07
Jun-09
Sep-07
Sep-08
Sep-09
Figure 14 – Mobile Data Subscribers in India
Source: CMIE Database (TRAI)
Though people are subscribing to data from their mobile phones using technologies like
EDGE, GPRS the speed and the user experience is very low. Off late some CDMA operators
20 | P a g eValuation of 3G Spectrum License In India: A Real Options Approach 2011
like Reliance, BSNL, MTS and MTNL are giving mobile broadband though data cards based
on EV-DO technology. Reliance reported a figure of 2 Million EVDO subscribers12, while
MTS and MTNL reported a figure of 0.25 Million13 and 0.815 Million subscribers14
respectively.
Given the constraints associated with Wireline Broadband, 3G is well poised to be India‟s
champion for providing broadband services to the masses. While the recently concluded 4G
auctions are providing alternate technologies like LTE (Long Term Evolution – Time
Division Duplexing) and WiMAX which are better and faster than 3G, but the restriction of
voice over 4G spectrum and high investment costs would mean that operators target these
services towards subscribes which have high ARPU. These subscribers typically belong to
urban areas and enterprise subscribers. Till WiMAX or LTE achieve a certain scale the
devices with which to connect the internet would remain expensive. On the other hand 3G
handsets are available for as low as INR 4700. Nokia launched its Nokia 2730 Classic model
at a price point of INR 470015. The availability of 3G devices at affordable prices would
mean high volume of subscribers adopting 3G technology. This coupled with the fact that the
capital expenditure involved in 3G technology is less means that 3G will drive the broadband
growth in India in medium to long term.
1.5 Drivers of 3G in India – Consumer & Operator Perspective
A key metric for valuing the 3G license is the prospective subscriber base of 3G license in
India. In this section we would try to elaborate some of the drivers for 3G in India which
could help the operators achieve the critical mass in terms of number of subscribers so that
their investment in 3G license is profitable. In order to analyze the drivers of 3G in India, a
bifurcation has been done in terms of factors which are associated with the consumer and the
factors which are associated with the wireless operator (PricewaterhouseCoopers India,
2010).
12
http://convergence.in/blog/2011/01/07/reliance-netconnect-broadband-evdo-based-500-cities/, accessed on 10-
03-2011
13
http://www.medianama.com/2010/05/223-mtnl-q4-10-mobile-revenue-at-rs-1840m-348k-3g-subs-broadband-
arpu-rs-592, accessed on 10-03-2011
14
http://www.bsnlevdo.in/bsnl-evdo-news/mts-to-offer-14-7-mbps-speeds-through-cdma-dongles, accessed on
10-03-2011
15
http://techie-buzz.com/mobile-news/nokia-launches-nokia-2730-classic-cheapest-3g-handset-in-india.html,
accessed on 10-03-2011
21 | P a g eValuation of 3G Spectrum License In India: A Real Options Approach 2011
The consumer related factors are,
Quality of Service – Quality of service in terms of better user experience while
accessing internet, streaming videos, playing online games, better applications and
less frequent call drops.The quality of video calls and internet speed would depend on
the coverage of network, density of Base Stations and number of subscribers per base
station.
Applications and Content. The real impetus in giving an enhanced experience to the
user would depend on the Applications that will be developed for the 3G technology
and the quality of content that would be provided by the content providers.
Access Device. The adoption of 3G technology by a consumer would also depend on
the cost of switching to 3G technology. For a subscriber, who is on a 2G technology,
to switch to 3G technology would need an access device or 3G enabled phone. Since
3G has been rolled out in over 100 countries, the device manufacturers have achieved
the economies of scale and the prices of 3G devices are falling. The decrease in prices
of 3G devices coupled with their backward compatibility with 2G systems would be a
key driver for the uptake of 3G technology in India. As previous discussed, Nokia has
launched a 3G enable handset at INR 4700 and going by the trends of the device
prices that we saw during the reign of 2G technology 3G device prices are surely
going to come down.
High Bandwidth Requirements. High bandwidths are required by enterprises and
professionals living in urban areas because of mobility requirements to enhance the
productivity. 3G would surely help in catering to these requirements given that the
infrastructure is already in place to roll out the services.
Demographic Profile. As per a PWC report titled “Mobile Broadband – Outlook
2015” India‟s population in the 20 – 29 age group will reach above 210 million by
2015. Direct implication of this is their propensity to try the new and enhanced
services provided by 3G technology and they would be the early adopters of the
technology thus driving the 3G market in India (PricewaterhouseCoopers India,
2010).
The operator related factors are,
22 | P a g eValuation of 3G Spectrum License In India: A Real Options Approach 2011
Declining ARPU. Operators would turn to 3G to safeguard their profitability which is
under pressure in a hyper competitive environment and the heavily skewed use profile
towards prepaid subscribers.
Better Business Case. For operators rolling out broadband in a wireless environment
makes a much better business case than rolling out broadband in a wireline
environment.
Low Broadband Penetration. Operators see a huge potential in a market where
broadband penetration is less than 1%.
23 | P a g eValuation of 3G Spectrum License In India: A Real Options Approach 2011
2 Historical overview of Mobile Technology
Current GSM and CDMA based mobile communication systems are basically 2G or 2 nd
Generation Mobile communication technology. Before 2G and 3G there was 1G or the 1 st
generation mobile communication technology. 1G technology was based on analog signals as
compared to the present day technology which is digital. First commercial launch of a 3G
systems was in the year 1979 by NTT in Japan. NMT (Nordic Mobile Telephone), AMPS
(Advanced Mobile Phone System) and TACS (Total Access Communication System) are
some of the example of the 1G telecommunication systems16.
After almost a decade of 1G technology 2G technology was rolled out on GSM (Global
System for Mobile Communications) standard in the year 1991 in Finland. The main
advantage of 2G systems over 1G systems was that the technology was made digital. The
inherent advantage of digital systems is that the data is encrypted and compressed thus
allowing a more efficient use of the available bandwidth which translates into higher
penetration for the same amount of available bandwidth. 2G systems also allowed data
services which weren‟t there in the 1G technology17. 2G systems were primarily based on
two technologies,
CDMA (Code Division Multiple Access) – CDMAone
TDMA (Time Division Multiple Access) – GSM
CDMA and TDMA are channel access methods while CDMAone and GSM are standards of
mobile technology. Channel Access Methods are explained in a further section. GSM
technology is by far the most adopted technology across the world with a worldwide
penetration of 80% among all the wireless subscribers. 2G systems were built primarily for
voice communication and limited amount of data communication (SMSs etc.). The spectrum
used by 2G services is in the range of 800 MHz, 900 MHz, 1800 MHz and 1900 MHz with a
limited speed of around 14 Kbps. By the end of the century 20th century voice services no
longer remained the focus area for the mobile communications engineers and the demand for
a faster way to access the internet from mobile device started picking momentum18. This led
to the development of new standards like GPRS (2.5G) and EDGE (2.75G). Though the
16
http://en.wikipedia.org/wiki/2G, accessed on 10-03-2011
17
http://en.wikipedia.org/wiki/2G, accessed on 10-03-2011
18
http://en.wikipedia.org/wiki/3G, accessed on 10-03-2011
24 | P a g eValuation of 3G Spectrum License In India: A Real Options Approach 2011
speeds were limited on these standards, however they were much better than the speed of a
2G network. GPRA could support up to 115 Kbps while EDGE could support up to 236.8
Kbps of data speeds. These standards were used to provide Media Messaging Services,
Pocket Internet and Wireless Application Protocols. We will now discuss about the two most
prominent 2G technologies which are prevalent across the world,
2.1 GSM
Global System for Mobile Communication (GSM) is most widely adopted mobile technology
standard. As per GSM association almost 80% of the mobile subscribers are on GSM
networks. There were over 3.45 Billion GSM subscribers in Q2 200919. GSM is a 2G
technology with both the voice signal which is encoded and the signal over which voice is
encoded are digital. The main advantage over GSM over any other technology is that you can
use your phone anywhere because of high penetration of GSM technology. GSM is based on
cellular technology which means that when the phone connects to the operator‟s network by
searching for the nearby cells. The service areas are divided into cells of various sizes. The
size of the cell depends upon the signal strength and the number of subscribers in a given
service area. The more the number of subscribers the smaller the cell size as a base station
required by GSM technology can serve only a limited number of subscribers. Radius of the
cell could vary from a few hundred meters to few kilometers. The largest possible radius
supported by GSM specification is 35 KM.
2.2 CDMAone
CDMAone is a front name for IS-95 standard. This standard is also based on cellular
technology. CDMA is actually the channel access method used by IS-95 standard. In CDMA
channel is such that several clients can use the same frequency. In case of GSM channel
access method is TDMA which means only one client can access the channel at a single time
and access is granted to various clients in a sequential manner. The advantage of CDMAone
vis-à-vis GSM is that in CDMAone all clients can access the channel anytime and hence
there is no direct relation between channel capacity and a limit on the number of active
subscribers. In case of GSM if an operator wants to add subscribers to an existing cell which
is already running full capacity the operator might need to split the cell into smaller cells,
while in case of CDMA the number of cells required would be lesser than that of GSM with
19
http://en.wikipedia.org/wiki/GSM, accessed on 10-03-2011
25 | P a g eValuation of 3G Spectrum License In India: A Real Options Approach 2011
same number of subscribers and hence CDMA channel access method provides a huge
economical advantage to mobile operators20.
2.3 Channel Access Method/Air Technology
Channel Access Method in the simplest possible language could be described as a permission
mechanism by which the signal which we wish to send is given a permit to transmit over a
channel. When there are multiple users who are attached to the same channel there arise a
problem of who will access the channel and in what sequence the access would be granted. In
case of mobile technology, there are two kinds of signals,
Carrier Signal – Carrier signal is the mother signal over which the signal which we
wish to send is piggybacked. There are various technologies to piggyback the
voice/data signal over the carrier signal. The discussion of those technologies is not
relevant in the scope of this research.
Modulating Signal – This is the user generated or received signal.
The two kinds of channel methods which are more prevalent in wireless telecommunications
industry are TDMA and CDMA.
2.3.1 TDMA
TDMA is the channel access method in which each user shares the same frequency and the
access to channel is given on a sequential basis. Most of the 2G systems except CDMAone
are based on TDMA21.
2.3.2 CDMA
CDMA is based on a spread spectrum technology in which the bandwidth of the modulated
carrier signal is much more than the bandwidth of the modulating signal. This form of
channel access method is much more economically favorable than TDMA22.
2.4 Cellular Technology
A Cellular network is a radio network whose use is widespread in mobile communications.
The name cellular network comes from the word “Cell”. In this kind of network the coverage
area is divided into number of territories known as cells. Each cell has a Base station with
20
http://en.wikipedia.org/wiki/IS-95, accessed on 10-03-2011
21
http://en.wikipedia.org/wiki/Time_division_multiple_access, accessed on 10-03-2011
22
http://en.wikipedia.org/wiki/Code_division_multiple_access, accessed on 10-03-2011
26 | P a g eYou can also read