Distinct identities of leaf phloem cells revealed by single cell transcriptomics
←
→
Page content transcription
If your browser does not render page correctly, please read the page content below
LARGE-SCALE BIOLOGY ARTICLE

Distinct identities of leaf phloem cells revealed by single cell transcriptomics
Ji-Yun Kima,§, Efthymia Symeonidib, Tin Yau Pangc, Tom Denyerb, Diana Weidauera, Margaret
Bezrutczyka, Manuel Miras a, Nora Zöllnera, Thomas Hartwig a, Michael M. Wudicka, Martin Lercherc,
Li-Qing Chene, Marja C.P Timmermansb and Wolf B. Frommera,d§

 Downloaded from https://academic.oup.com/plcell/advance-article/doi/10.1093/plcell/koaa060/6067477 by guest on 03 May 2021
a
 Institute for Molecular Physiology and Cluster of Excellence on Plant Sciences (CEPLAS), Heinrich-Heine-
 University Düsseldorf, Düsseldorf 40225, Germany
b
 Center for Plant Molecular Biology, University of Tübingen, Auf der Morgenstelle 32, 72076 Tübingen,
 Germany
c
 Institute for Computer Science and Department of Biology, Heinrich-Heine-University Düsseldorf,
 Düsseldorf 40225, Germany
d
 Institute of Transformative Bio-Molecules (WPI-ITbM), Nagoya University, Chikusa, Nagoya 464-8601,
 Japan
e
 Department of Plant Biology, School of Integrative Biology, University of Illinois at Urbana-Champaign,
 Urbana, Illinois 61801, U.S.A

Short Title: Transcriptome atlas of the Arabidopsis leaf vasculature
One-sentence summary: A leaf scRNA-seq analysis provides insight into leaf vascular cell types and critical
resources to build hypotheses and strategies related to the transport of ions, metabolites, and signals.

The author responsible for distribution of materials integral to the findings presented in this article in
accordance with the policy described in the Instructions for Authors (www.plantcell.org) are: Wolf B.
Frommer (frommew@hhu.de) and Ji-Yun Kim (jiyun.kim@hhu.de).

ABSTRACT
The leaf vasculature plays a key role in solute translocation. Veins consist of at least seven distinct cell types,
with specific roles in transport, metabolism, and signaling. Little is known about leaf vascular cells, in
particular the phloem parenchyma (PP). PP effluxes sucrose into the apoplasm as a basis for phloem loading,
yet PP has been characterized only microscopically. Here, we enriched vascular cells from Arabidopsis leaves
to generate a single-cell transcriptome atlas of leaf vasculature. We identified at least 19 cell clusters,
encompassing epidermis, guard cells, hydathodes, mesophyll, and all vascular cell types, and used metabolic
pathway analysis to define their roles. Clusters comprising PP cells were enriched for transporters, including
SWEET11 and SWEET12 sucrose and UmamiT amino acid efflux carriers. We provide evidence that PP
development occurs independently from APL, a transcription factor required for phloem differentiation. PP
cells have a unique pattern of amino acid metabolism activity distinct from companion cells (CC), explaining
differential distribution/metabolism of amino acids in veins. The kinship relation of the vascular clusters is
strikingly similar to the vein morphology, except for a clear separation of CC from the other vascular cells
including PP. In summary, our scRNA-seq analysis provides a wide range of information into the leaf
vasculature and the role and relationship of the leaf cell types.

 © The Author(s) (2021) . Published by Oxford University Press on behalf of American Society of Plant Biologists.
 This is an Open Access article distributed under the terms of the Creative Commons Attribution-Non-Commercial-NoDerivs
 licence (http://creativecommons.org/licenses/by-nc-nd/4.0/), which permits non-commercial reproduction and distribution of the
 work, in any medium, provided the original work is not altered or transformed in any way, and that the work is properly cited. 1
 For commercial re-use, please contactjournals.permissions@oup.com
INTRODUCTION

A key feature of multicellularity is the division of labor. During evolution, when plants moved from aquatic
to terrestrial environments, new mechanisms were required for the exchange of nutrients—both
photoassimilates from aerial organs to soil-anchored sections, and water and essential nutrients from the soil
to the aerial, photosynthetic organs. Terrestrial plants developed complex vascular systems to provide, for

 Downloaded from https://academic.oup.com/plcell/advance-article/doi/10.1093/plcell/koaa060/6067477 by guest on 03 May 2021
example, roots with photoassimilates and to provide a photosynthetic organism with essential nutrients. Cells
had to differentiate to acquire unique identities by establishing differential transcriptional networks. The
vasculature serves both transport and communication between organs. Arabidopsis leaf veins are conjoint,
collateral open and closed bundles, with xylem on the adaxial and phloem on the abaxial side (Haritatos et
al., 2000). The veins consist of at least seven different cell types with unique features identifiable by light
and electron microscopy. In Arabidopsis, the abaxial phloem is composed of enucleate sieve elements (SE),
as the actual conduits, which are coupled to companion cells (CC), and a third, poorly understood cell type,
the phloem parenchyma (PP). When mature, the adaxial xylem consists of dead tracheary elements (TE), that
are accompanied by xylem parenchyma (XP). The vascular parenchyma (VP) is often located at the interface
between phloem and xylem. At earlier stages of development, xylem and phloem are separated by
meristematic cells (procambium; open-type vasculature), that differentiate towards the tip of the leaf where
procambium is absent (closed-type) (Kang and Dengler, 2004). Phloem and xylem exchange water and
solutes in complex ways, and thus the cells must be equipped with specific sets of transporters. Moreover, it
is likely that the different cell types have specialized metabolic activities. In addition, the vasculature plays
important roles in communication by translocating hormones, small RNAs, and even proteins; and also
appear to be involved in electrical signaling (Nguyen et al., 2018).

 PP is one of the poorly defined and least characterized vascular cell types. In Arabidopsis, PP has
so-called cell wall ingrowths with a transfer cell appearance that are thought to play a role in amplifying the
surface area to allow for higher transport rates (Arun Chinnappa et al., 2013; Edwards et al., 2010). Since in
many plant species the interface between CC and SE (SE/CC) contains only few plasmodesmata,
photoassimilate translocation requires an apoplasmic transport route (Haritatos et al., 2000). SE/CC loading
is mediated by the H+-sucrose symporter SUT1 (originally identified in potato; named SUC2 in Arabidopsis),
which imports sucrose from the cell wall space (Riesmeier et al., 1994). We recently identified sucrose
uniporters of the SWEET family in a specific subset of cells in the phloem, that likely represent PP (Chen et
al., 2012). SWEET expression in PP was confirmed using translational GFP fusions, using a new confocal
microscopy method that enabled unambiguous PP identification (Cayla et al., 2019). A key goal of this work
was to characterize the role of PP in more detail by identifying its mRNA outfit. This could serve, for example,
as a basis for identifying transporters involved in phloem loading of other nutrients, as well as metabolic
pathways active in these cells.

 2
Understanding the complexity of plant cells at a single cell level has long been an active area of
interest in plant biology. Comprehension at this level is crucial to determine subtle distinctions between, for
example, the multitude of complex vascular cell types. Recently, high throughput single cell RNA-
sequencing (scRNA-seq) has been used to provide new insights into root cell biology and development
(Denyer et al., 2019; Shulse et al., 2019; Zhang et al., 2019; Ryu et al., 2019; Wendrich et al., 2020). These
latest technologies have allowed us to build on the resolution of prior atlases derived from the isolation of

 Downloaded from https://academic.oup.com/plcell/advance-article/doi/10.1093/plcell/koaa060/6067477 by guest on 03 May 2021
specific cell types, using fluorescent activated cell sorting of fluorescently-labelled protoplasts, and/or laser-
capture microdissection (Birnbaum et al., 2003). To gain insights into the specific transcript profiles of the
leaf vasculature, we optimized protoplast isolation protocols to enrich for leaf vascular cells. Using scRNA-
seq, we identified unique and characteristic mRNA signatures, which revealed fundamental differences in
amino acid metabolism and transport pathways in PP and CC important for phloem translocation as well as
differences in hormone and glucosinolate metabolism.

RESULTS

Enrichment of vascular protoplasts

Standard protoplast isolation protocols are efficient for protoplasting mesophyll cells for downstream
applications such as transient expression. However, these procedures do not efficiently release cells from the
vasculature. Here, we developed a methodology for isolating vascular-enriched protoplast populations from
mature Arabidopsis leaves (Figure 1, Supplemental Figure 1). Initially, a fraction of the non-vascular cell
types were removed using the ‘tape-sandwich’ method which effectively eliminated trichomes, guard cells,
and epidermis from the abaxial leaf surface (Supplemental Figure 1B) (Wu et al., 2009). Cuts along the
midvein further facilitated access of cell wall digesting enzymes to the vasculature (Figure 1A, Supplemental
Figure 1B). Elevated concentrations of mannitol lead to an increased release of protoplasts (Figure 1B,
Supplemental Figures 1C and 1D). We monitored the release by light microscopy, RT-qPCR, and
fluorescence microscopy (Figures 1D and 1E, Supplemental Figures 1E and 1F). The mRNA levels of marker
genes were used to evaluate the enrichment of vascular protoplasts during optimization of the protocols
(Figure 1A to 1C). In addition, the release of intact vascular protoplasts was verified microscopically by
monitoring fluorescently-labeled cells using stably transformed Arabidopsis lines expressing
pAtSWEET11:AtSWEET11-GFP, a tentative marker for PP (Chen et al., 2012), and Q0990, a procambial
marker (Radoeva et al., 2016) (Figures 1D and 1E, Supplemental Figure 1E). The bulk leaf (not subjected to
protoplasting) transcriptome showed high correlation with bulk protoplast transcriptomes (Pearson´s
correlation coefficient of 0.9) (Supplemental Figure 2A, Supplemental Data Set 1). The high correlation
indicates that the protoplasting protocol used here did not impact the relative abundance of cells in the leaf

 3
and supported the notion that the scRNA-seq data derived from the protoplasts should cover essentially all
cell types present in a mature leaf (the term enriched here thus refers to enrichment over standard protocols).

Single cell RNA-sequencing of vascular-enriched leaf protoplast population

scRNA-seq libraries were produced from vasculature-enriched leaf protoplast populations, with 5,230 single-
cell transcriptomes obtained from two biological replicates. Sequencing to a depth of ~96,000 reads per cell

 Downloaded from https://academic.oup.com/plcell/advance-article/doi/10.1093/plcell/koaa060/6067477 by guest on 03 May 2021
was undertaken, and identified a median number of 3,342 genes, and 27,159 unique molecular identifiers
(UMIs, representing unique transcripts), per cell (Supplemental Figure 2B). Unsupervised clustering using
Seurat (Satija et al., 2015) identified 19 distinct cell clusters (Figure 2, Supplemental Movie 1, Supplemental
Data Set 2). Plotting the transcriptomes from the two replicates in two dimensions using Uniform Manifold
Approximation and Projection (UMAP) (McInnes et al., 2018) revealed an overlapping distributions of cells,
and a similar proportion of cell identities (Supplemental Figure 2C). mRNA profiles and relative cell numbers
in the clusters were highly correlated in the replicates (Supplemental Data Set 1). To assign cell identity to
the clusters, we examined the specificity of transcripts of known marker genes (Figure 3, Supplemental Figure
3, Supplemental Data Sets 3 and 4).

 The 19 clusters cover all major cell types of the leaf. The population was dominated by mesophyll
cells (~75% of all cells), as indicated by the enrichment of known mesophyll markers (CAB3, LHCB2.1, and
CA1) (Sawchuk et al., 2008; Endo et al., 2014) (Figure 3, Supplemental Figure 3A). The mesophyll group
comprised twelve clusters (Clusters, or C1, 2, 3, 5, 6-9, 11, 12, 14; Figure 2A, Figure 3; Supplemental Data
Set 4) and formed three major branches on the UMAP plot. Naively, two separate mesophyll clusters can be
expected, one for palisade and one for spongy parenchyma. FIL (YAB1) transcripts, markers for spongy
parenchyma were enriched in C2 and C7, possibly indicating that these clusters may represent spongy
parenchyma (Supplemental Figure 3A) (Uemoto et al., 2018). Among the mesophyll clusters, C6 and C9
were enriched for rRNAs (Supplemental Data Set 4). We did not remove rRNA before sample preparation
and did not filter cells that showed higher rRNA transcript levels since rRNA levels can vary between cells.
Whether C6 and 9 represent unique biologically relevant cell populations in the leaf or are due to artifacts
was not further evaluated. While the mesophyll clusters likely contain interesting information, we did not
characterize them further, as we decided to focus on the vasculature.

 Beyond the mesophyll, epidermal cells were identified in C13, based on enrichment of the epidermis-
specific transcription factor AtML1 (Takada et al., 2013) and wax-related genes (Figure 3). Epidermal guard
cells were found in C16, indicated by the specific enrichment of FAMA and guard cell-specific MAP kinases
(Figure 3, Supplemental Figure 3A). Enrichment of transcripts of the purine transporter PUP1 and the
homolog of carrot chitinase, EP3, indicated that C17 comprises hydathodes cells (Supplemental Figure 3A)
(Bürkle et al., 2003).

 4
Several clusters showed a vasculature identity, based on the enrichment of known marker genes,
indicating that the enrichment for these cell types was successful. The vasculature is composed of phloem
and xylem, often separated by a meristematic layer, the procambium, which initiates and maintains vascular
organization. We assigned clusters to the seven known cell types present in leaves (Figure 2). Additionally,
we identified cell types with identities that had properties of two cell types, e.g. xylem and procambium.

 Downloaded from https://academic.oup.com/plcell/advance-article/doi/10.1093/plcell/koaa060/6067477 by guest on 03 May 2021
 Cluster 4 was found to contain bundle sheath (BS) and xylem cells and was subsequently subclustered
into three cell populations, C4.1, C4.2, and C4.3 (Figure 2B, Supplemental Data Set 5). Subclusters C4.2 and
C4.3 were enriched for the BS marker SCL23, and the sulfate transporter, SULTR2;2 (Figure 3, Supplemental
Figures 3B and 3C). C4.2 was enriched for genes involved in photosynthetic processes, possibly indicating a
differentiation of BS cells (Supplemental Data Set 5). The existence of two BS clusters is consistent with
morphological descriptions (Haritatos et al., 2000). C4.1, C10, C15, and C18, with a total of 478 cells, were
assigned as vascular cell types (Figures 2 and 3, Supplemental Figure 3A, Supplemental Data Set 2 and 3).

Degree of kinship relations among BS, XP, PC and PP

Clusters composed of BS, xylem parenchyma (XP) and procambial (PC), and PP cells show a J-shaped
relatedness in our UMAP plot (Figure 2). BS is related to two types of xylem cells (XP1 and XP2), that abut
the PC. PC subclusters into two subsets closely related to XP1 (PCXP) and PP1 (PCPP), respectively. The PCPP
is adjacent to the two PP clusters PP1 and PP2. XP3 and PP2 form a separate group, which together with
XP2, form the hook of the J shape in our UMAP plot (Figure 2B).

Xylem-related clusters

The enrichment of GLR3;6 (Nguyen et al., 2018) and ACL5 markers identified C4.1 as parenchymatic xylem
cells (Supplemental Figures 3A, 3D to 3I). Further clustering of C4.1 resulted in two subgroups, XP1 and
XP2, distinguished by the relative enrichment of photosynthetic genes (Supplemental Data Set 5). An
additional subcluster with xylem identity, XP3, was observed as a subgroup of cells from C18. XP3 was
enriched with xylem markers as well as those for vascular parenchyma (Endo et al., 2008) (Supplemental
Figures 3D to 3I, Supplemental Figure 4). Transport proteins were enriched in the xylem clusters (XP1-XP3),
as one may expect from their role in supplying tracheal elements with ions and nutrients for xylem
translocation. These included amino acid transporters, such as the H+/amino acid symporter AAP6 and the
UmamiT amino acid exporter family member UmamiT22 (Pilot et al., 2004; Okumoto et al., 2002; Dinkeloo
et al., 2018). The transcript of amino acid export protein GDU4 was also enriched in the xylem clusters.
Multiple SULTR low-affinity sulfate transporters, which play pivotal roles in sulfate transport in xylem
parenchyma cells, were detected in the xylem cells as well as the boron transporter NIP6.1, the glucosinolate
importer GTR2/NPF2.11 (Madsen et al., 2014; Nour-Eldin et al., 2012), the heavy metal transporter HMA2,
and the plastidic bile acid transporter BAT5/BASS5 (Supplemental Data Set 6).

 5
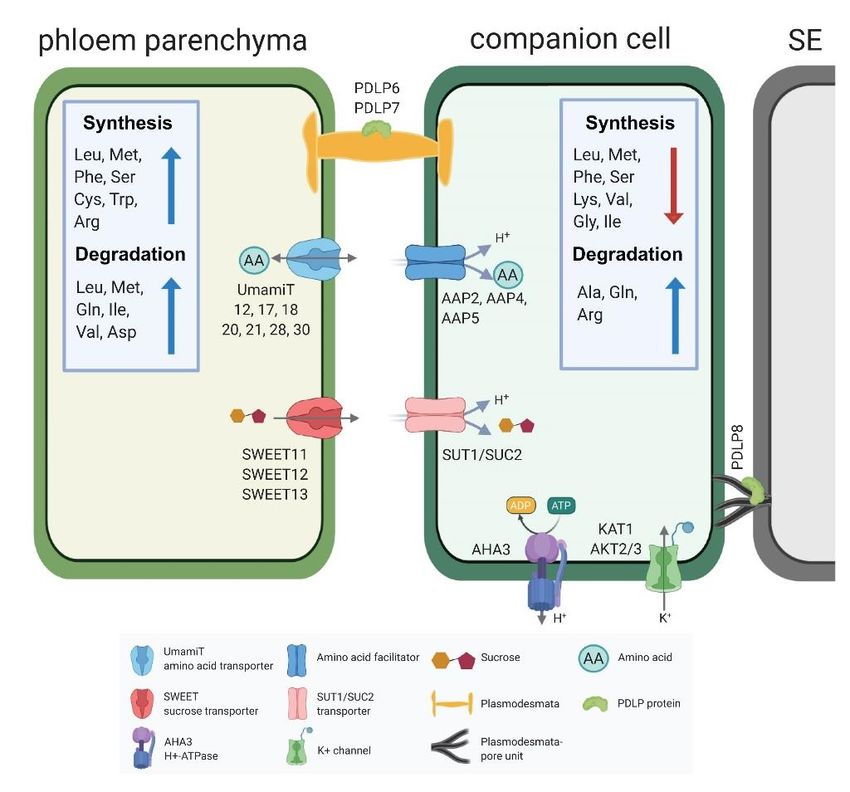
Phloem- and xylem-related subpopulations of the procambial subclusters

Arabidopsis procambium constitutes a bifacial stem cell population producing xylem on the adaxial pole and
phloem on the abaxial pole (Sanchez et al., 2012; Elo et al., 2009). On our UMAP plot, the XP clusters are
in proximity to Cluster 10. Cluster 10 could be further subdivided into three subclusters: the PP1 (C10.2) and
two distinct procambial populations, C10.1.1 and C10.1.2 (Figure 2, Figure 4A, Supplemental Data Sets 7

 Downloaded from https://academic.oup.com/plcell/advance-article/doi/10.1093/plcell/koaa060/6067477 by guest on 03 May 2021
and 8). While cells in PCPP corresponds to procambial cells involved in the maintenance of meristematic
identity and the differentiation of phloem cells, cells of PCXP appear to be more closely related to the
formation of xylem cells, and is located closer to the XP clusters (Figure 4, Supplemental Data Sets 7 and 8).

 Cells in the PCXP cluster were enriched with transcripts for homeodomain leucine-zipper (HD-Zip)
transcription factor, HOMEOBOX GENE 8 (HB-8) (Baima et al., 2001) transcripts, known to trigger xylem
differentiation (Figure 4B). Adaxial HD-ZIP transcription factors, such as REVOLUTA/INTERFASCICULAR
FIBERLESS1 (REV/IFL1), PHABULOSA (PHB), and CORONA (CNA/AtHB15), were also enriched in this
cluster (Figures 4C and 4D, Supplemental Figure 5). Conversely, the PCPP cluster closest to the PCXP was
enriched with factors involved in the maintenance of protophloem identity and pluripotency in roots and stem,
such as COTYLEDON VASCULAR PATTERN 2 (CVP2), CVP2 LIKE 1 (CVL1) (Rodriguez-Villalon et al.,
2015), BARELY ANY MERISTEM 3 (BAM3), and CLAVATA3/EMBRYO SURROUNDING REGION-
RELATED 45 (CLE45) (Gujas et al., 2020; Rodriguez-Villalon et al., 2014) (Figures 4E to 4G, Supplemental
Figure 5). BRX and OCTOPUS (Truernit et al., 2012), involved in protophloem differentiation at different
ends of the developing protophloem cells, were also enriched in the nonoverlapping cells in PCPP. ALTERED
PHLOEM DEVELOPMENT (APL), a major phloem marker which inhibit xylem differentiation, was also
detected in this region (Bonke et al., 2003) (Figure 4E). Transcripts related to phloem differentiation,
including CLE41, DOF5.1 and LBD3 were enriched in the lower region of PCPP (Figures 4H to 4J,
Supplemental Figure 5). Strikingly, the arrangement in the UMAP plot, of the PCPP cluster facing the PP
cluster (C10.2) and the PCXP facing the XP clusters, is analogous to the morphological positioning. However,
as the markers used for inferring the clusters are based on not only leaf markers, but also root and stems due
to the lack of leaf procambium marker cells, further verification will be required to provide a comprehensive
understanding of procambium cells in the mature leaf. Feature plots of additional procambium marker genes
in the subpopulations of C10 are shown in Supplemental Figure 5.

Phloem parenchyma clusters

SWEET11 and SWEET12 efflux transporters had previously been reported to be expressed in the PP (Cayla
et al., 2019; Chen et al., 2012). Sucrose released by the SWEETs into the apoplasm is taken up into the
neighboring SE/CC via the sucrose/H+ symporter SUC2/SUT1 (Riesmeier et al., 1994; Gottwald et al., 2000).
C10.2 (PP1) and C18.1 (PP2) were specifically enriched for SWEET11 and SWEET12 (Figure 3, Figures 5A

 6
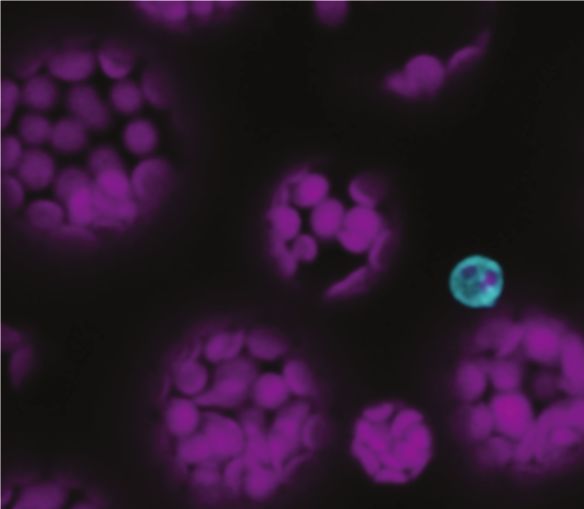
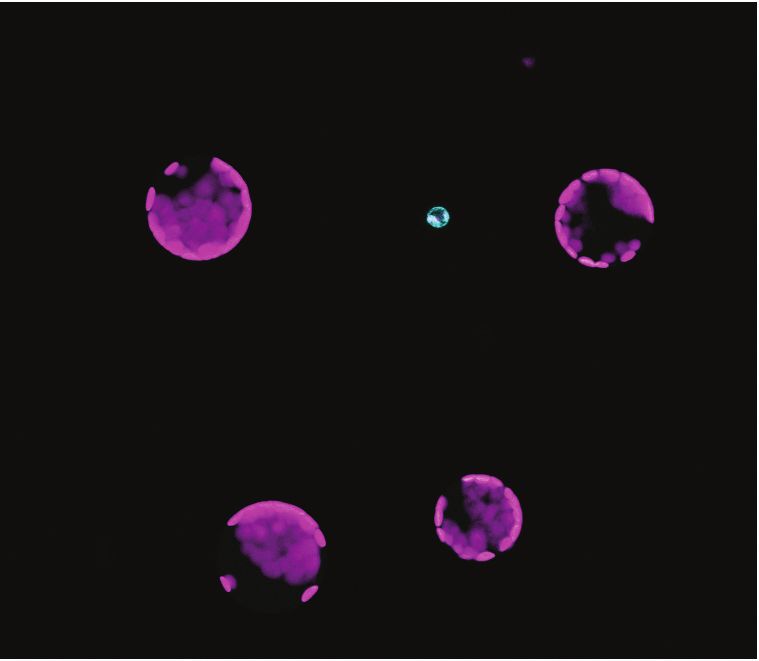
to 5F). Although the top marker genes were not mutually exclusive in either of the clusters (Supplemental
Figure 6A and 6B), genes related to callose deposition and cell wall thickening were over- represented in
PP1, reflecting transfer cell identities (Supplemental Figures 6C and 6D). Among them, NAC056, a
transcription factor known to play a role in cell wall ingrowth deposition in the phloem parenchyma, was
enriched in PP1 in comparison to PP2 (Supplemental Figure 6C) (Wu et al., 2018). On the other hand, genes
involved photosynthesis were enriched in C18.1 indicting that C18.1 and C10.1 could be cells undergoing

 Downloaded from https://academic.oup.com/plcell/advance-article/doi/10.1093/plcell/koaa060/6067477 by guest on 03 May 2021
differential photosynthetic activity (Supplemental Figure 6E).

 Both C10.2 and C18.1 are enriched for transcripts related to transport processes, reflecting the roles
of PP as a critical cell type required for loading diverse substrates into the phloem (Supplemental Data Sets
7, 9-12). We identified an additional member of the Clade III SWEET family, SWEET13, in the cells that
expressed SWEET11 and SWEET12 (Figures 5G to 5I). SWEET13 transcripts show compensatory
accumulation in sweet11;sweet12 double knockout mutants, indicating redundant roles with SWEET11 and
SWEET12 (Chen et al., 2012). As it is challenging to unambiguously distinguish phloem cell types by cross-
sections, we used a modified protocol from a recently developed confocal imaging method (Cayla et al.,
2019) which allows us to distinguish PP cells from the CC, SE, and BS, based on the position of chloroplasts,
presence of cell wall ingrowths, and cell size. Using this method, we were able to validate the presence of
SWEET11 and SWEET13 in the PP-cells in pSWEET13:SWEET13-YFP (Figures 5Q) and
pSWEET11:SWEET11-2A-GFP expressing lines (Figure 5P).

 UmamiT family members have been described as cellular exporters for amino acids (Ladwig et al.,
2012). We thus speculated that UmamiTs may play analogous roles for the efflux of amino acids from PP as
the SWEETs do for sucrose. Consistent with our hypothesis, we found UmamiT18/SIAR1 mRNA in PP
(Figures 5J to 5L). Vascular expression in leaves is supported by UmamiT18/SIAR1 transcriptional fusion
lines (Ladwig et al., 2012). In addition, transcripts for six other members of the UmamiT family (UmamiT12,
17, 20, 21, 28, 30) were enriched in the two PP clusters (Figures 5M to 5O, Supplemental Figures 7A to 7F,
Supplemental Data Sets 7 and 12). Notably many of the PP-specific UmamiTs were coexpressed with each
other as well as SWEET11 and 12 (Supplemental Figure 7G, Supplemental Data Set 13).

 As many transcripts related to transport processes were specifically enriched in the PP clusters, and
many of them were coregulated (Supplemental Data Set 13), this may indicate that they are subject to control
by the same transcriptional networks. We therefore searched for transcription factors that might be
responsible for coregulation of the functionally related transporters. We identified multiple leucine zipper
genes (bZIP) either specific to the PP clusters (bZIP6, bZIP7, bZIP9), or present in PP and other clusters
(TGA7, bZIP11; Supplemental Figure 8). We were able to confirm that bZIP9 promoter activity was specific
for the PP cells in the leaf vasculature, using a transcriptional fusion, pbZIP9:GFP-GUS (Figures 6A to 6D).

 7
Strong GUS activity was also detected in cell types known to be involved in apoplasmic transport steps, such
as the unloading zones of anthers and seeds, and the veins of petals, receptacles, ovules, transmitting tract,
and funiculi (Supplemental Figure 9). The cell specificity of bZIP9 is consistent with a possible role in the
activation of target genes involved in transport process across different tissues. However, as previously
reported, bzip9 single mutants did not display phenotypic differences compared with WT (Supplemental
Figure 10A and 10B) (Veerabagu et al., 2014; Silveira et al., 2007) and transcript levels PP markers were not

 Downloaded from https://academic.oup.com/plcell/advance-article/doi/10.1093/plcell/koaa060/6067477 by guest on 03 May 2021
significantly changed in the bzip9 mutant (Supplemental Figure 10C). As bZIP family members act as dimers
or heteromers, hence are functionally connected, it may be necessary to characterize mutants in multiple PP-
expressed bZIP family members to elucidate their role.

The companion cell cluster

Companion cells, which acquire carbon and nitrogen from the adjacent PP, but also maintain the functionality
of the enucleate sieve elements, cluster separately from all other cell types. C15 was designated as CC based
on the enrichment of transcripts for the sucrose/H+ symporter SUC2/SUT1, the H+-ATPase AHA3, and genes
such as FTIP and APL (Figure 3, Supplemental Figure 3A). CCs were enriched for transcripts of various
transporters, including the amino acid/H+ symporter AAP2 (Zhang et al., 2010), the potassium channel KAT1
(Schachtman et al., 1992), the hexose uniporters SWEET1 and SWEET4 (Chen et al., 2010), and the tonoplast
peptide transporter PTR4/NPF8.4 (Weichert et al., 2012, 4) (Supplemental Data Set 12). All these markers
are also enriched in the CC translatome (Mustroph et al., 2009). A subset of cells in CC is specialized for
synthesizing FT, a small mobile protein that acts as florigen (Chen et al., 2018). Although we could neither
detect FT mRNA nor the presence of specialized CC cells in our data set, many genes involved in the
regulation of FT and control of flowering, for instance, FTIP, CDF5, EFM, VOZ1, were enriched in CC
(Henriques et al., 2017; Liu et al., 2012; Yan et al., 2014; Kumar et al., 2018) (Supplemental Data Set 3).

PP and CC cells undergo differentiation through distinct pathways

The clear separation of PP and CC in the UMAP was striking and indicates the presence of distinct
differentiation pathways. The MYB coiled-coil-type transcription factor APL plays a key role for the
definition of phloem identity (Bonke et al., 2003). In our data set, APL was preferentially expressed in CC,
but also detected in the PCPP cluster (Figure 4E and Supplemental Figure 3A). As APL function is necessary
for the development of the SECC complex, one may propose two hypotheses: (i) APL serves as a master
regulator of all phloem cells, or (ii) PP develops independently of the SECC differentiation. While apl
mutants are characterized by drastic reduction of CC marker SUC2, apl retains expression of multiple PP
markers (Figures 7A and 7B); PP marker transcripts were even > four fold higher in the apl mutant (Figure
7B) (Bonke et al., 2003). Whether the increase of PP-marker transcripts in apl is due to a compensatory

 8
mechanism in which APL represses PP differentiation, as suggested for xylem differentiation (Bonke et al.,
2003), remains to be elucidated.

 The existence or function of phloem parenchyma has not been described for Arabidopsis roots. One
may hypothesize that the root phloem-pole pericycle plays a role in the unloading of small molecules and
thus ontogenetically or functionally be related to leaf phloem parenchyma (Ross-Elliott et al., 2017). Cell

 Downloaded from https://academic.oup.com/plcell/advance-article/doi/10.1093/plcell/koaa060/6067477 by guest on 03 May 2021
clusters in the roots with transcript profiles related to leaf PP1 do not appear to correspond to phloem pole
pericycle identity. The root single cell transcriptome atlas from Wendrich et al. (2020) which includes the
highest proportion of vascular cells had identified the phloem and pericycle as distinct clusters. A comparison
shows that 19 % of the phloem pole pericycle markers overlap with pericycle markers in root single cell
sequencing data set, indicating that PP and pericycle are distinct (Brady et al., 2007; Wendrich et al., 2020).
Furthermore, none of the recent single cell sequencing analyses of roots provides a detailed analysis of
different phloem cells (Wendrich et al., 2020; Denyer et al., 2019; Shulse et al., 2019; Zhang et al., 2019;
Ryu et al., 2019; Jean-Baptiste et al., 2019). Therefore, we compared the markers from our leaf phloem
clusters with the phloem markers identified by single cell sequencing from roots (Wendrich et al., 2020).
Surprisingly, root phloem markers had the highest overlap with C10.2 (Supplemental Figure 11A). Markers
enriched in leaf C10.2 and the root phloem cluster include genes related to callose deposition, as found for
leaf PP1 (Supplemental Figure 11B). This finding may indicate the existence of a yet unidentified cell type
in roots with a leaf phloem parenchyma identity. Whether phloem parenchyma cells are present in the root
and whether they play analogous roles as in the leaf remains to be elucidated.

Unique and complementary metabolic landscapes of PP and CC

Amino acid transporters of the AAP and UmamiT families are relatively non-selective and transport many of
the proteogenic and other amino acids (Dinkeloo et al., 2018; Fischer et al., 1995). One may therefore assume
that the translocation of most amino acids is similar and that relative amino acid levels are mainly determined
by the relative rates of biosynthesis, that the amino acids all enter the translocation stream in similar ways
and that the relative levels do not change substantially during translocation. However, labeling studies have
shown that amino acids behave very differently, with some being effectively metabolized along the path of
source-to-sink partitioning, while other stay largely unmetabolized (Atkins, 2000). Surprisingly, the amino
acid distribution in stems is also varying for different amino acids (Metzler et al., 1995). These phenomena
might be explained by differential distribution of metabolic activities in different vascular cell types. We
therefore carried out a pathway activity analysis to define a pathway activity score (PAS) that quantifies the
average expression of the pathway’s genes in one cell type relative to the other cell types (Xiao et al., 2019).
The PAS values of the CC and PP were strikingly different for both amino acid biosynthetic and degradation
pathways (Figure 8). While the activity of biosynthetic amino acid pathways was low in CC, PP-containing

 9
clusters showed elevated metabolic activity. A comprehensive analysis of pathway activities across all
clusters revealed many other interesting features unique to specific cell types (Supplemental Figure 13). For
instance, the epidermis cluster (C13) was enriched with biosynthetic activities for wax esters, cuticular wax,
the suberin monomer and very long chain fatty acids. These substances function as coatings in the epidermis,
serving as a moisture barrier and protecting plants from pathogens. The PP-including cluster, C18, showed
high activity of hormone pathways such as ABA, ethylene, JA, and GA, and the BS and XP clusters (C4) and

 Downloaded from https://academic.oup.com/plcell/advance-article/doi/10.1093/plcell/koaa060/6067477 by guest on 03 May 2021
the two PP-including clusters (C10 and C18) were enriched for glucosinolate biosynthesis activity
(Supplemental Figures 12 to 15). C19 may represent so-called S-cells, likely involved in defense responses,
based on the enrichment of programmed cell death pathways and PAS values for insect chewing-induced
glucosinolate breakdown (Koroleva et al., 2010) (Supplemental Data Set 14. The two PP clusters (C10, C18)
showed high PAS values for callose biosynthesis, consistent with callose deposition in PP transfer cells
(Maeda et al., 2014).

Cluster 19 as a candidate for putative S-cell cluster

Glucosinolate-rich cell type (S-cells) are found in floral stems of Arabidopsis but also described as sulfur‐
rich cells in the phloem parenchyma of the leaf (Koroleva et al., 2010). S cells contain more than tenfold
higher sulfur levels, and high levels of glucosinolate compared to the rest of the cells and have been the
functional shield of the plant vascular system from herbivores and pathogens. As the S-cells were suggested
to be found in the abaxial area of phloem parenchyma in leaves, we questioned whether the S-cells are present
in the PP clusters. Markers for S-cells are presently unavailable, therefore, we searched for markers that are
known to be absent in S-cells. Proteomic analysis of S-cells has suggested that glucosinolates are not
produced in S-cells, as biosynthetic enzymes could not be detected in isolated S-cell extracts. The promoter
activities of key enzymes and markers for glucosinolate biosynthesis such as CYTOCHROME P450
83A1(CYP83A1) and BRANCHED-CHAIN AMINOTRANSFERASE 4 (BCAT4) were not detected in S-cells
(Li et al., 2010; Nintemann et al., 2018; Hunziker et al., 2019). We detected transcripts of CYP83A1, BCAT4,
as well as other transcripts encoding proteins involved in the synthesis of aliphatic and indolic glucosinolates
in the bundle sheath, xylem (C4) and PP/PC/XP (C10, C18) clusters (Supplemental Figure 14). The
enrichment of HIG1 transcription factor which activate promoters of genes involved in glucosinolate
biosynthetic genes (Gigolashvili et al., 2007) (Supplemental Data Sets 4 and 7) also exclude the cells in the
PP clusters (C10.2, C18.1) from containing S-cells and suggest the phloem parenchyma, procambium, xylem,
and bundle sheath cells as sites for glucosinolate biosynthesis.

 A unique characteristic of the S-cells is that these cells undergo programmed cell death at the early
stages of differentiation. We therefore, searched for cells that could be enriched with the transcripts related
to programmed cell death. We identified Cluster 19, a cluster distinct from, but closely spaced to the bundle

 10
sheath cells. This cluster was enriched with transcripts related to programmed cell death, hypersensitive
response, and defense and immune response (Supplemental Dataset 14). This cluster also showed high
activity scores in insect chewing-induced glucosinolate breakdown pathway (Supplemental Figure 12B). This
result is in line with the primary role of S-cells in releasing toxic compounds through glucosinolate
breakdown upon chewing insects induced-mechanical disruption. Although we cannot rule out that these
subset cells were clustered based on the stress response from the protoplasting process, they could serve as

 Downloaded from https://academic.oup.com/plcell/advance-article/doi/10.1093/plcell/koaa060/6067477 by guest on 03 May 2021
candidates as putative S-cells.

Cell-type specific expression of plasmodesmatal proteins

Plasmodesmata (PD) are highly complex channels that interconnect plant cells, likely transporting solutes,
metabolites, small RNAs and proteins. Different cell types have unique types of plasmodesmata, including
that which connects CC to enucleate sieve elements to supply all components necessary for function. The
PDs typically are branched on the CC side and have a single pore on the sieve element side. We here found
that transcripts of PD genes such as the PLAMODESMATA-LOCATED PROTEIN (PDLP)s and MULTIPLE
C2 DOMAINS AND TRNAMEMBRANE REGION PROTEIN (MCTP)s showed distinct expression patterns
in different cell types (Figures 9A to 9D, Supplemental Figures 16A and 16B) (Lee et al., 2011; Brault et al.,
2019). For example, PDLP6, 7, and 8 transcripts were found in PP and CC, while PDLP2 and 3 transcripts
were present in mesophyll cells (Figures 9A to 9D, Supplemental Figure 16A). The cell-type specificity of
PDLPs was correlated with their phylogenetic relationships (Figure 9E). Our results are consistent with data
from GUS reporter fusions for the PDLP7 and 8 promoters (Tanvir, 2016). MCTP1 (FTIP1) and 3 transcripts
were mainly enriched in the vasculature (Figure 3, Supplemental Figure 16B). In particular, MCTP1 (FTIP1)
transcript was specifically enriched in CC, consistent with a role in trafficking the florigen protein
FLOWERING LOCUS T (FT), from companion cell to sieve elements (Liu et al., 2012). In comparison,
MCTP4, MCTP6 and MCTP15 are ubiquitously expressed in vascular and mesophyll cells (Supplemental
Figure 16B). Overall, our data supports the concept of PD-type specific assembly of PDs.

DISCUSSION

Despite the advances in scRNA-seq technologies, application to plant cells still faces challenges since the
cell walls of plant cells must be removed for the release of individual cells. Different cell types are likely
under different osmotic pressure in the intact plant which might result in breakage if the osmotic conditions
are not adequate. Recent studies using Arabidopsis (Liu et al., 2020), rice (Wang et al., 2020), as well as
maize (Bezrutczyk et al., 2021) aerial tissues clearly demonstrate difficulty in capturing vascular cell types
reflecting the need for careful strategy development. A key cell type in the vasculature, the PP, was not
identified in any of the recently published scRNA-seq data from roots (Denyer et al., 2019; Ryu et al., 2019;
Zhang et al., 2019; Shulse et al., 2019; Jean-Baptiste et al., 2019; Wendrich et al., 2020).

 11
Here, we systematically optimized protoplast isolation protocols to enrich vascular cell types and
produced a single cell transcriptome and metabolic activity score atlas that covers essentially all known cell
types in the Arabidopsis leaf. The scRNA-seq confirmed that except for trichomes, abaxial epidermis and
guard cells which were intentionally removed, all known nucleus-containing cells of the leaf were represented
in the data set. In particular, all cells from the leaf vasculature were identified.

 Downloaded from https://academic.oup.com/plcell/advance-article/doi/10.1093/plcell/koaa060/6067477 by guest on 03 May 2021
 The vascular cells had identities clearly distinct from those of the epidermis, guard cells and
mesophyll. The bundle sheath formed a supercluster, together with all vascular cells including the vascular
meristem, except the companion cells (CC). A major finding within this atlas was that the kinship relation of
vascular cells was highly similar to the actual morphology of the vasculature, with the exception of the CC,
which formed a unique island separate from BS, xylem, procambium and the phloem parenchyma.
Surprisingly, although we used 6-weeks old plants for the analysis, in which the developmental processes
were expected to be completed, the arrangement of the XP-PCXP-PCPP-PP clusters in the UMAP plot reflected
a potential developmental trajectory. Future pseudotime trajectory analyses from the data set, or comparison
to data from younger leaves, will allow us to better understand the transition from meristematic cells to
differentiated phloem or xylem cell types and trans-differentiation processes from phloem parenchyma into
transfer cells. Some clusters showed gradients, indicating a transition, in which transcriptional modules (for
example, for xylem identity) decreased in favor of phloem modules. One example is the PC, in which cells
closer to the xylem shared some xylem properties, while those closer to PP shared PP properties. A similar
behavior was seen for the VP. It is conceivable that the well-studied dorsoventral cues, or cues from
neighboring cells, are responsible for these gradients.

 From their positioning inside the phloem, one may naively have expected the PP and CC to cluster
together. CC are unique since they have to fulfil their own tasks, e.g. import sucrose from PP, and at the same
time maintain the function of the adjacent enucleate sieve elements, living cells that act as conduits for
assimilate translocation (Bel and Knoblauch, 2000). Based on this dual role, it is possibly not surprising that
they form such a distinct island. Whether PP and CC derive from a common ancestor remains unclear since
the ontogeny of PP is unknown. The ontogenesis of CC is much better understood (Bonke et al., 2003).
SE/CC mother cells divide asymmetrically to produce CC and SE. The APL transcription factor is a master
regulator for SE/CC development, and a repressor of xylem identity (Bonke et al., 2003). Based on our data,
it seems unlikely that APL is responsible for driving PP ontogeny but may implicate alternative pathways for
PP differentiation.

 A major discovery was the assignment of Clusters 10.2 and 18.1 as PP, providing insights into the
PP transcriptome. Although C10.2 and 18.1 appear to represent different states, C10.2 having transfer cell
identity and C18.1 being enriched in photosynthetic activity, it will be interesting to determine if these

 12
clusters represent spatially different cells types or developmental trajectories. The PP has essential roles in
sucrose transfer to the SE/CC, but also likely many other functions in transport, metabolism and signaling.
SWEET13 is a gene that may act in a compensatory role, as evidenced by higher mRNA levels in sweet11;12
mutants. Here we detected SWEET13 in the same cells as SWEET11 and 12 (Chen et al., 2012). Notably, in
a parallel study we found that while in main veins and rank-1 intermediate veins of maize, the orthologs in
maize, named ZmSWEET13a, b and c, are likely also expressed in PP, in the C4 specific rank-2 intermediate

 Downloaded from https://academic.oup.com/plcell/advance-article/doi/10.1093/plcell/koaa060/6067477 by guest on 03 May 2021
veins that are mainly responsible for phloem loading, the three ZmSWEET13s are not in PP, but in two abaxial
bundle sheath cells (Bezrutczyk et al., 2021). These data indicated to us that maize uses a different path for
phloem loading of sucrose as compared to for example Arabidopsis or potato (Kühn et al., 1997).

 In addition to the clade III SWEETs, scRNA-seq provided extensive insights into other genes
enriched in PP, in particular identifying transcripts of seven members of the UmamiT amino acid transporter
family. UmamiTs are rather non-selective transporters involved at sites where cellular amino acid efflux is
required. For example, UmamiT18/SIAR1 transcripts, similar to SWEET11 and 12, were detected in the
chalazal region of developing seed (Ladwig et al., 2012; Chen et al., 2015). Knockout mutants showed
reduced accumulation of amino acids in seeds, likely due to both a reduction in efflux from leaves and reduced
efflux from the chalaza (Ladwig et al., 2012). Of note, the SWEETs and UmamiTs showed high coexpression
indices. One may thus hypothesize that the genes share transcriptional control, and thus it will be interesting
to analyze whether common transcription factors binding sites are present in the PP-specific genes. SWEETs
and SUTs seem to act as a pair, one responsible for sucrose efflux from PP, the other for active import into
the SE/CC. UmamiTs also seem to act in pairs, with UmamiTs in PP and AAP amino acid H+/symporters
including AAP2, 4 and 5 in the CC (Fischer et al., 1998; Figure 10). These complementary functions are
consistent with the clear separation of the clusters in the UMAP plots. A striking result from the comparison
of PP and CC was that their metabolism was also highly differentiated. In particular, we found major
differences regarding amino acid metabolic pathways. Both isotope labeling studies as well as amino acid
localization by 2D-NMR had indicated that amino acids behave very differently regarding entry into
metabolism along the translocation pathway and entry into the phloem (Atkins, 2000; Metzler et al., 1995).
This difference could thus likely be explained by the metabolic activities along the path, rather than their non-
selective transporters.

 Cell type-specific metabolic pathway analysis revealed many other interesting aspects. For example,
hormone metabolism varied between cell types. Cell types responsible for hormones biosynthesis are largely
unknown. The metabolic analysis provides a map that may guide identification of hormone biosynthesis and
transport pathways in leaves. For instance, high activities of ABA, ethylene, JA, and GA biosynthesis
pathways were detected in C18 (which includes the PP), consistent with the high number ABA, JA, and GA
transporters in the phloem (Kuromori et al., 2014; Kanno et al., 2016, 13; Ye et al., 2016; Nguyen et al.,

 13
2017). As most transporters show functional redundancy and display diverse substrate specificity, this data set serves as a source to identify cell type-specific redundant family members for the generation of multiple mutants, to eliminate or verify interacting partners, and to identify yet -unknown transporters. Besides the insights into both metabolism and into apoplasmic transport pathways, the study also showed that cell types with unique types of plasmodesmata express particular paralogs of plasmodesmata- Downloaded from https://academic.oup.com/plcell/advance-article/doi/10.1093/plcell/koaa060/6067477 by guest on 03 May 2021 specific proteins, such as PDLPs or MCTPs. The combined analysis of sym- and apoplasmic fluxes of ions, metabolites and signaling molecules at the cellular level will likely enable a much better understanding of the physiology of the leaf. In summary, scRNA-seq enabled us to identify unique and distinct features of the different vascular cell types present the leaf. Through transcriptomic and metabolic pathway analyses at the single cell level, we identified potential roles of PP not only in the transport of sugars, but also in amino acid transport. Importantly, we also identified unexpected roles of PP in hormone biosynthesis and defense-related responses. The information provided in this study provides key resources to develop strategies influencing the flux of ions, metabolites and signals. METHODS Enrichment of vascular protoplasts. Protoplasts were isolated from mature leaves of 6-weeks-old Arabidopsis Col-0 plants grown under short-day (8 h light / 16 h dark) conditions at a PAR of 60 µmol m-2 s-1. For protoplast isolation, the tape-sandwich method (Wu et al., 2009) was modified and applied for removal of the abaxial epidermis, guard cells and trichomes. The adaxial side of the fully developed leaves was stabilized by placing on the time tape, and the abaxial side was adhered to the 3M Magic tape. The abaxial epidermis was removed by pulling off the 3 M Magic tape. Two cuts were made on each side of the major vein of the peeled leaves using a razor blade (Swann-Morton, Sheffield). Seven to nine abaxial epidermis-peeled and cut leaves attached to time tape were immediately immersed in the petri dish containing 15 mL freshly prepared protoplast isolation solution (1% Cellulase Onuzuka R-10 (Duchefa, Haarlem), 0.3% macerozyme R-10, (Duchefa, Haarlem), 0.6 M Mannitol, 20 mM MES pH 5.7, 20 mM KCL, 1 mM DTT, 10 mM CaCl2, and 0.1 % BSA). Dithiothreitol (DTT) and bovine serum albumin (BSA) were added to the enzyme solution to protect the protoplasts. Leaves were shaken at 30 rpm on a platform shaker for 2 hours. The release of the protoplasts was monitored every 30 min by checking released cells under the microscope or by monitoring what was left on the time tape. After confirming the release of the protoplasts into the solution, 10 mL of wash buffer (0.6 M Mannitol, 20 mM MES pH 5.7, 20 mM KCl, 1 mM DTT, 10 mM CaCl2, and 0.1 % BSA) was slowly added to the petri dish containing the protoplasts. The solution was filtered into a round bottom 20 mL tube using a 70 m pore size filter (Corning, New York). The protoplast solution was centrifuged at 100 x g for 3 min in a swinging rotor. The protoplasts were washed four times with 20 mL 14
washing buffer. After the final wash step, protoplasts were slowly resuspended in 1 mL wash buffer and gently filtered twice using a 40 m Flowmi cell strainer (Bel-Art SP Scienceware, New Jersey). The number of protoplasts was counted with the C-Chip Neubauer improved hemocytometer (NanoEnTek, Seoul) under a light microscope (Leica VT1000, Wetzlar). The viability of protoplasts was determined using trypan blue solution (Gibco; Thermo Fisher Scientific, Massachusetts). Downloaded from https://academic.oup.com/plcell/advance-article/doi/10.1093/plcell/koaa060/6067477 by guest on 03 May 2021 Quantitative reverse transcription (RT-qPCR). Total RNA was extracted using the RNeasy Kit (Qiagen, Hilden). cDNA synthesis and gDNA removal steps were performed using QuantiTect Reverse Transcription Kit (Qiagen, Hilden), qPCR was performed on Stratagene Mx3000P (Agilent Technologies, California) using the Lightcycler 480 SYBR Green I Master Mix (Roche, Penzberg). Transcript levels were quantified using the relative standard curve method. Values were normalized to the level of the internal control, UBQ10. Primers used for RT-qPCR are listed in Supplemental Table 1. For RT-qPCR of apl mutants, segregating seeds from heterozygous parents were sown on MS media. RNA was extracted using 2-weeks-old plants grown under LD conditions. Single cell RNA-seq library preparation and sequencing. Two biological replicates were performed with the aim of capturing ~7,000 leaf protoplasts for each replicate. Two batches of freshly isolated protoplasts were obtained from 8 leaves from different plants (per batch) adjusted to 700-900 cells/μL and loaded into the 10X Genomics Chromium single cell microfluidics device according to the Single Cell 3’ Reagent Kit v2 protocol (10x Genomics, California). Eleven cycles were used for cDNA amplification and 12 cycles were used for final PCR amplification of the adapter-ligated libraries. The quality and size of the final library was verified on a DNA High Sensitivity Bioanalyzer Chip (Agilent Technologies, California), and libraries were quantified using the NEBNext Library Quantification Kit for Illumina (New England Biolabs, Massachusetts). scRNA-seq library sequencing was performed on a NextSeq platform (Illumina Inc, California), using the sequencing parameters 26,8,0,98 (c.ATG, Tübingen). Generation of single cell expression matrices. Reads were aligned to the Arabidopsis thaliana reference genome (Araport 11) using Cell Ranger 3.0.2 (10X Genomics, California) with default parameters. The output files for the two replicates were aggregated into one gene-cell expression matrix using Cell Ranger aggregate with the mapped read depth normalization option. Dimensionality reduction, UMAP visualization, cell clustering analysis, and correlation analysis. The Seurat R package (version 3.1.0) (Satija et al., 2015; Butler et al., 2018) was used for dimensionality reduction analysis. The SCTransform option was used for normalization, scaling the data and finding variable genes using default parameters(Hafemeister and Satija, 2019). During normalization, potential variation due to mitochondrial mapping percentage was removed. We did not remove rRNA before sample preparation and did not filter cells with higher rRNA transcript levels, since rRNA levels can vary among cells. Fifty principal 15
components (PCs) were selected as input for a graph-based approach to cluster cells by cell type using a
resolution value of 0.8 in all clustering analyses. Uniform Manifold Approximation and Projection (UMAP)
dimensional reduction (McInnes et al., 2018) was used for two-dimensional visualization using ten PCs, 30
neighboring points and a minimum distance of 0.1. Subclustering was performed using the same parameters.
For the correlation analysis between single cell replicates across individual clusters, the average expression
of cells within a cluster was calculated and the Pearson-correlation coefficient was determined.

 Downloaded from https://academic.oup.com/plcell/advance-article/doi/10.1093/plcell/koaa060/6067477 by guest on 03 May 2021
Identification of Differentially Expressed Genes and Cluster-Specific Marker Genes. Genes
differentially expressed across clusters or subclusters were identified by comparing average transcript levels
in cells of a given cluster to that of cells in all other clusters using the Seurat package likelihood ratio test
(Bimod). The following cutoffs were applied: average expression difference ≥0.25 natural Log and q 10% of cells within the cluster (PCT1), and
protoplasted bulk tissues, the Log2 (mean FPKM+1) expression values were calculated for each gene.
Pearson-correlation coefficient was determined in R.

Pathway activities in different cell types. We followed the formulation introduced in Xiao et al. (Xiao et
al., 2019) to calculate a pathway activity score, which depends on the mRNA level of its constituent genes.
The mRNA count of gene i in cell k was denoted as gi,k. We first normalized the mRNA count of a gene in a

 Downloaded from https://academic.oup.com/plcell/advance-article/doi/10.1093/plcell/koaa060/6067477 by guest on 03 May 2021
cell by the average for all genes in the cell, and denoted this normalized level as g'i,k. The mean transcript
 1 ′
level Ei,j of gene i in cell type j is then defined as the mean g'i,k over all cells of that type, , = ∑ =1 , ,

where nj is the number of cells classified as cell type j, and k is the index for individual cells. Ei,j is normalized
by the average transcript level of gene i across all cell types to become the relative transcript level ri,j of gene
 1
i in cell type j: , = , / ( ∑
 =1 , ), where N is the total number of cell types. The pathway activity

score (PAS) of pathway t in cell type j, denoted as pt,j, is then a weighted average of the relative transcript

 ∑ =1 ,
levels across the pathway genes: , =

 ; here, mt is the number of genes in pathway t, and the
 ∑ =1

weight wi of gene i is defined as the reciprocal of the number of pathways that include gene i, to ensure a
stronger influence of pathway-specific genes. As the relative mRNA levels ri,j are centered around 1, the same
is true for the pathway activity pt,j, with pt,j 1 indicates a higher than average
activity in cell type j. To assess the statistical significance of a pt,j value, we performed a permutation test,
shuffling the cell type labels of the genes a thousand times to simulate the null distribution of pt,j under the
assumption of no systematic cell type specific pathway activity; we defined an empirical p-value by
comparing pt,j to this null distribution. AraCyc pathway lists (Mueller et al., 2003) used for the analysis can
be found in Supplemental Data Set 15.

Transgenic plants and T-DNA insertion lines. For the generation of pbZIP9:GFP-GUS lines, a 2,289 bp
fragment of the bZIP9 gene promoter was amplified using bZIP9pro attB1 and bZIP9pro attB2 primers using
Col-0 genomic DNA as template. The corresponding PCR fragment was purified and used for GATEWAY
BP reaction into pDONR221 and cloned into the destination vector pBGWFS7,0 through LR reaction. For
generating pSWEET11:SWEET11-2A-GFP-GUS lines, a 4,784bp fragment consisting of promoter and
SWEET11 genomic region including all exons and introns was amplified using SWEET11-2A-attB1 and
SWEET11-2A-attB2 primers. The SWEET11-2A-attB2 reverse primer contained the 2A cleavage sequence.
The genomic SWEET11 with the 2A cleavage site was cloned into pDONR221 and subcloned into the
pKGWFS7,0 vector through LR reaction. To generate pSWEET13:SWEET13-YFP, a 3,941 bp fragment
including SWEET13 promoter and its genomic region was amplified using SWEET13attB1 and
SWEET13attB2 primers and cloned into the donor vector pDONR221-f1 by BP reaction. Subsequently, the

 17
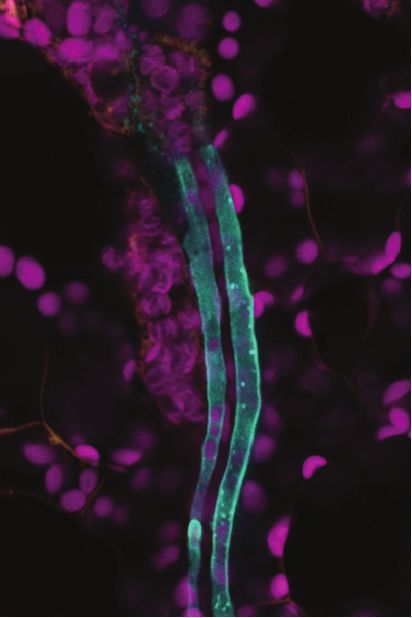
fragment was sub-cloned into a gateway-compatible vector, pEG-TW1 (Kim et al., 2019) to generate pSWEET13:SWEET13-YPF construct by LR reaction. Transformation of plants was performed using the floral dip method (Zhang et al., 2006). Primers used for amplification are listed in Supplemental Table 1. The bzip9 mutant (salk_093416c) was obtained from the Nottingham Arabidopsis Stock Centre (NASC). Homozygous mutants were identified by PCR as described (http://signal.salk.edu/tdnaprimers.2.html) using the primer pairs listed in Supplemental Table 1. Downloaded from https://academic.oup.com/plcell/advance-article/doi/10.1093/plcell/koaa060/6067477 by guest on 03 May 2021 GUS histochemistry. GUS staining was performed as described with minor modifications (Martin et al., 1992). Tissues were fixed with 90% ice-cold acetone. After applying vacuum for 10 min, acetone was removed and replaced by prestaining solution (1 mM EDTA, 5 mM potassium ferricyanide, 5 mM potassium ferrocyanide, 100 mM sodium phosphate (pH 7.0), 1% Triton-X-100). After 10 min vacuum, the prestaining solution was replaced with staining solution containing 1 mM EDTA, 5 mM potassium ferricyanide, 5 mM potassium ferrocyanide, 100 mM sodium phosphate (pH 7.0), 1% Triton-X-100, and 2 mM X-Gluc and further vacuum infiltrated for 15 min in the dark. The tissues in staining solutions containing X-Gluc were incubated at 37 ºC in the dark for 4 hours. Ethanol series were performed from 25% to 70% ethanol in 30 min steps. Sample preparation for imaging leaf vasculature. Rosette leaves were excised by cutting the leaf petiole from 5 weeks old plants grown under SD conditions. Double-sided tape was used to attach the petiole and the upper lamina of the leaf on the slide glass (abaxial side facing upward, as in the tape-sandwich method). The abaxial epidermis was peeled using the 3M Magic tape and immediately covered with water. The region of interest was excised with a razor blade and moved to a new slide glass. Samples were applied with FM4- 64FX (Sigma-Aldrich, Missouri) (5 g/ml) for 5 min for staining the cell membrane and imaged immediately. PP cells were identified based on several criteria only clearly detectable in longitudinal sections, i.e. plasma membrane invaginations, and cell diameter (about 8-10 μm). CC were distinguished from the PP cells based on the regularly aligned chloroplast strings. BS cells were identified by their large size and chloroplast alignment on one side of the cell (Cayla et al., 2019). Confocal imaging. Fluorescence images were captured using a Leica TCS SP8 confocal microscope with a 20x or 40x objective with water immersion. GFP, YFP, FM4-64FX, and chlorophyll autofluorescence signals were acquired using the following settings: GFP, excitation 488 nm (white-light laser) and emission 492-552 nm; YFP, excitation 514 nm and emission 510-565 nm; FM4-64FX, excitation 561 nm and emission 599– 680 nm; chlorophyll autofluorescence, excitation 638 nm and emission 645-738 nm. Phylogenetic Analysis. Reported amino acid sequences from Arabidopsis thaliana PDLPs were aligned using the tool MAFFT with 0.123 and 1.53 gap extend penalty and gap opening penalty values, respectively. Maximum likelihood tree was constructed with full-length amino acid sequences with the software 18
You can also read