Transcriptional drug repositioning and cheminformatics approach for differentiation therapy of leukaemia cells
←
→
Page content transcription
If your browser does not render page correctly, please read the page content below
www.nature.com/scientificreports
OPEN Transcriptional drug repositioning
and cheminformatics approach
for differentiation therapy
of leukaemia cells
Yasaman KalantarMotamedi1,6, Fatemeh Ejeian2,6, Faezeh Sabouhi2,3,6, Leila Bahmani2,4,
Alireza Shoaraye Nejati2, Aditya Mukund Bhagwat5, Ali Mohammad Ahadi2,3,
Azita Parvaneh Tafreshi4, Mohammad Hossein Nasr‑Esfahani2* & Andreas Bender1*
Differentiation therapy is attracting increasing interest in cancer as it can be more specific than
conventional chemotherapy approaches, and it has offered new treatment options for some cancer
types, such as treating acute promyelocytic leukaemia (APL) by retinoic acid. However, there is a
pressing need to identify additional molecules which act in this way, both in leukaemia and other
cancer types. In this work, we hence developed a novel transcriptional drug repositioning approach,
based on both bioinformatics and cheminformatics components, that enables selecting such
compounds in a more informed manner. We have validated the approach for leukaemia cells, and
retrospectively retinoic acid was successfully identified using our method. Prospectively, the anti-
parasitic compound fenbendazole was tested in leukaemia cells, and we were able to show that it
can induce the differentiation of leukaemia cells to granulocytes in low concentrations of 0.1 μM and
within as short a time period as 3 days. This work hence provides a systematic and validated approach
for identifying small molecules for differentiation therapy in cancer.
Differentiation therapy has several advantages compared to chemotherapy, such as its irreversible effect and the
rapid clearance of tumour bulk, following terminal maturation of blast cells1. One prominent example of this
type of therapy is the treatment of acute promyelocytic leukaemia (APL, an aggressive type of acute myeloid
leukaemia or AML) by a combination of all-trans retinoic acid (ATRA) and a rsenic1. In acute myeloid leukaemia
(AML) cells, differentiation is blocked in the cellular maturation stage2 which prevents leukaemia cells from
terminal differentiation. It is assumed that many neoplastic cells have reversible defects in their differentiation
patterns, where small molecules can cause tumour reprogramming and thereby induce terminal differentiation
and apoptosis3. Despite the importance of differentiation therapy, selecting particular small molecules to induce
such differentiation is challenging. However, the recent availability of large-scale biological data can uncover
mechanisms in the differentiation process one would like to modulate to achieve this aim, with one such approach
being compound selection and drug repurposing based on gene expression (transcriptomics) data.
Transcriptional drug repositioning has recently gained significant attention, both due to increased data avail-
ability, as well as several success stories that have been reported4,5. The key idea is that a modulation of a biological
system by a process (such as a disease) should be counteracted by compound treatment, in the particular readout
space that is available, such as transcriptomics space. This is rather distinct from single-target approaches in drug
discovery, where first a target of interest is isolated and then a ligand is desired—in the case here, rather modu-
lation of the whole system is taken into account. This in particular enables identifying compounds that would
modulate multiple genes and pathways of a disease simultaneously. One of the key elements of transcriptional
repurposing is that it is an unbiased approach and enables scientists to come up with a testable hypothesis, both
in terms of compounds and modes of action of the compounds selected, in a disease or biological process of
1
Centre for Molecular Informatics, Department of Chemistry, University of Cambridge, Lensfield Road,
Cambridge CB2 1EW, UK. 2Department of Animal Biotechnology, Cell Science Research Center, Royan Institute
for Biotechnology, ACECR, Isfahan, Iran. 3Department of Genetics, Faculty of Science, Shahrekord University,
Shahrekord, Iran. 4Molecular Medicine Department, Institute of Medical Biotechnology, National Institute
of Genetic Engineering and Biotechnology, Tehran, Iran. 5Open Analytics, Jupiterstraat 20, 2600 Antwerp,
Belgium. 6These authors contributed equally: Yasaman KalantarMotamedi, Fatemeh Ejeian and Faezeh
Sabouhi. *email: mh.nasr-esfahani@royaninstitute.org; ab454@cam.ac.uk
Scientific Reports | (2021) 11:12537 | https://doi.org/10.1038/s41598-021-91629-x 1
Vol.:(0123456789)
www.nature.com/scientificreports/
interest. Its application in oncology, neurodegenerative, infectious6 and rare diseases has enabled the identifica-
tion of new indications for approved drugs4.
Various scoring systems exists that enable the scoring (and ranking) of compounds in the database against
a disease of interest quantitatively, given a set of transcriptomics data7. In the absence of a gold standard to
compare all scoring systems, we can only evaluate methods fully by experimental validations for the disease of
interest, or, in the absence of this, by retrospective literature validation. Moreover, gene expression data is noisy
and for each compound we usually have several instances of application of the compound available, with dose,
time and cell line being major experimental factors to c onsider8. Some studies integrate all different instances
of the same compound into a unified signature representing the c ompound9; however, given that e.g. dose/
exposure is a significant factor that influences treatment response this is not the option preferred by the authors
of the current work.
To address some of the challenges that still exist in the transcription layer of the data, we have integrated the
transcriptional drug repositioning approach with cheminformatics approaches for incorporating protein level
inference data and selecting compounds in a more informed manner. The cheminformatics side of the work
benefits from learning from large scale databases of compound target pairs (385,126 pairs) and predicting activity
profile of compounds in the connectivity map (CMap)10 database against 1,643 protein targets11 which is further
annotated with importance of the predicted target for the disease of interest and leads to a cheminformatics based
scoring system that complements the transcriptional based bioinformatics scores.
Even though connectivity map approaches have been studied before for cancer. Its application in differentia-
tion therapy is an emerging and attractive area12,13. In this work, we evaluate and validate our transcriptional drug
repositioning approach in the emerging application area of differentiation therapy for acute myeloid leukaemia.
For this purpose, the disease state is defined as comparison of HL60 leukaemia cells compared to healthy granu-
locytes. This comparison raises to a blueprint of differentiation and we hypothesise that finding a compound that
can target those genes effectively would induce differentiation of leukaemia cells to granulocytes. This rationale
was chosen because such differentiation is known to induce apoptosis in the cancer cells, and it is hence more
suitable for therapeutic purposes than more broad cytotoxic modes-of-action14.
Our computational approach presented here, integrates transcriptional drug repositioning and cheminfor-
matics approaches, and enables identifying compounds that can induce differentiation of leukaemia cells to
granulocytes (Fig. 1). In this work we prospectively validated fenbendazole that was identified by the approach
and validated that it can truly induce the differentiation of leukaemia cells to granulocytes.
Results
Our integrated drug repositioning and cheminformatics approach was applied for selecting compounds that can
induce differentiation of leukaemia cells to granulocytes. Figure 1 depicts the workflow and data sources used for
this purpose. The Bioinformatics part of the work (Fig. 1a) extracts disease signature (HL60 leukaemia cells vs.
granulocyte) from G EO15 dataset and rank orders genes based on differential expression. 5764 gene signatures
extracted from connectivity map database were used to query the disease profile using Gene Set Enrichment
analysis (GSEA)16 and rank ordered to target most differentially expressed genes of the disease profile most
efficiently in a reverse way. The Cheminformatics part of the work (Fig. 1b) used an artificial intelligence (AI)
engine that is based on Laplacian modified naïve bayes approach developed earlier11. The underlying principal
is that structurally similar compounds tend to bind to similar targets and is capable of predicting targets for
any compound given its structure. The AI engine trained a model on compound target pairs extracted from
ChEMBL11 database and predicts probability of binding of all the compounds in the connectivity map database
to 1643 protein targets. This facilitates incorporating all known and potential targets of each compound into
the model. The model also takes into account relevance of each predicted target to leukaemia by incorporating
relevance scores extracted from Comparative Toxicogenomics database (CTD)17. The Cheminformatics score
highly ranks compounds that target most relevant protein targets of the disease estimated by averaging relevance
score to leukaemia for top seven predicted targets for each compound. Moreover, protein–protein interaction
network is incorporated to elucidate mode of action of selected compounds based on the bioinformatics and
cheminformatics scoring system.
Retrospective validation in leukaemia. It was found that 20 out of the 30 highest-ranked compounds
from CMap with negative connectivity were supported by literature according to their relevance to leukaemia
(Table 1). Notably current standard differentiation therapy for leukaemia, tretinoin (retinoic acid, ATRA) was
ranked 15 based on the bioinformatics score among 5765 CMap signatures. It is also showing over the aver-
age (12.5) cheminformatics score (14.5). One example of active compounds on leukaemia cells is Thioridazine
(ranked 11) which is known to inhibit proliferation and induce apoptosis in leukaemia cells, but does not affect
normal lymphocytes18. We predicted from the cheminformatics side of the analysis that Thioridazine targets
the Histamine H1 receptor, the Dopamine D1-3 receptors, and the Muscarinic acetylcholine receptors M4 and
M5. Binding to all of these targets are supported in ChEMBL19 for Homo sapiens (with IC50 values of 0.07 µM,
0.19 µM, 0.03 µM, 0.01 µM, 0.09 µM and 0.009 µM, respectively). Interestingly, all these proteins are frequently
targeted among the 50 highest-ranking compounds selected for this disease, based on gene expression data (P
values: 0.1, 0.02, 0.08, 0.03, 0.03, and 0.06). Wortmannin (ranked 14) inhibits K562 myelogenous leukaemia cells
proliferation and induces apoptosis by regulating survival signalling pathways, such as PI3K/Akt/Nκ-KB. This
pathway is known to be important in the development of leukaemia20. The most probable predicted target for
Wortmannin is the PI3-kinase p110-alpha subunit (PIK3CA). PIK3CA is a member of the PI3K-Akt signalling
pathway, and the activity against which is reported in ChEMBL with an I C50 of 0.013 µM. The CMap instance of
this compound (ID 6202) downregulates TRIB3, FYN and MLST8 in the “PI3K-Akt Signalling” pathway. Among
Scientific Reports | (2021) 11:12537 | https://doi.org/10.1038/s41598-021-91629-x 2
Vol:.(1234567890)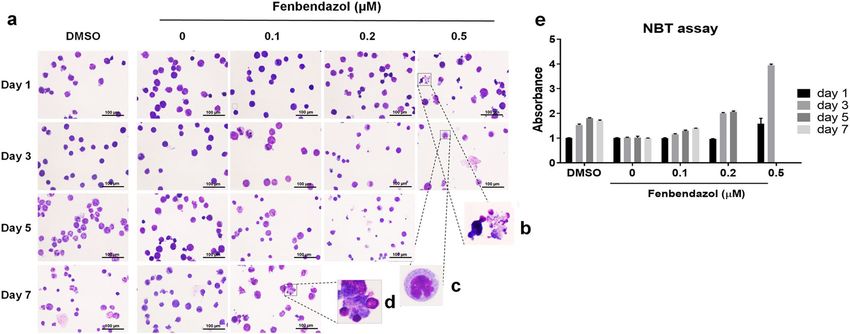
www.nature.com/scientificreports/
Figure 1. Combination of gene expression and in silico target prediction approaches for compound selection
and mode-of-action analysis: (a) bioinformatics part of the work involves extracting disease signature from
GSEO database and rank ordering differentially expressed genes as well as extracting gene signatures of
compounds from the connectivity map database. Gene set enrichment analysis was used to rank order al
the compounds in CMap database that can optimally reverse most dysregulated genes in the leukaemia
signature. Highly ranked compounds based on the bioinformatics were supported by literature. It also displays
differentially expressed genes in the leukaemia signature (on the right side). (b) Cheminformatics part of the
work involves training an Artificial Intelligence engine on a database of compound target pairs extracted from
ChEMBL and predicting binding scores for all compounds in CMap vs. a large range of protein targets. It also
involves extracting inference scores that identifies relevance of each target to leukaemia. The Cheminformatics
score calculates average relevance of top seven predicted targets of CMap compounds to leukaemia.
Combination of the bioinformatics score and the cheminformatics score led to the identification of fenbendazole
which was followed up with in-vitro validation. Gene signature and protein targets of fenbendazole as well as
gene signature of leukaemia was mapped to a protein–protein interaction network to rationalise mode of action.
the top 30 ranked compounds based on the Bioinformatics score, 14 had over the average (12.5) cheminformat-
ics score (Table 1). 13 out of that 14 had literature support for leukaemia and only fenbendazole, one type of
benzimidazole, was novel and hence was selected for experimental validation in this work.
A recent study explored application of transcriptional drug repositioning in differentiation therapy of leu-
kaemia blast c ells21. Notably, mebendazole, another member of benzimidazole family, was highly ranked in the
results of that study as well as ours. It was also prospectively validated in that study that mebendazole treat-
ment of leukaemia cells at doses of 1 μM for 9 days induced morphology changes. There are several differences
in terms of computational approach and the findings. The signature in the previous study was retrieved from
multiple data sets, including normal haematopoiesis, the classical model of ATRA differentiation therapy, and
drugs known to modulate differentiation, and all contributed to the scoring using a computational approach
called Lineage Maturation Index. However, the computational approach in this study does not include ATRA in
the dataset and comes directly from the comparison of HL60 cells to granulocytes, which makes the rediscovery
of mebendazole and ATRA as a current therapy more remarkable. In terms of comparison of the findings, we
discover mebendazole as well in our top results along with another member of the same family, fenbendazole.
However, the cheminformatics approach enabled us to select fenbendazole over mebendazole due to its more
relevant predicted bioactivity profile as discussed in results. To compare the experimental side of the studies of
this work and the previous w ork21, we should mention that phenotypically, mebendazole in the previous work
induced morphological changes but did not induce granulocytes differentiation; however with fenbendazole in
this work we show in the next section that granulocytes were formed. Fenbendazole induces the differentiation
in lower doses of 0.1–0.5 μM for shorter duration of 3 days and after 7 days at dose of 0.1 μM apoptotic cells
appeared. For mebendazole, full morphological changes appeared after 9 days at dose of 1 μM. However, it is dif-
ficult to compare the two studies quantitatively due to differences in the use of NBT assay (calculating absorbance
in this study vs. the percentage of dark blue cells in the previous study). Etoposide is also another drug predicted
in both studies which was shown to induce the differentiation with 44% of cells identified as positive in the NBT
Scientific Reports | (2021) 11:12537 | https://doi.org/10.1038/s41598-021-91629-x 3
Vol.:(0123456789)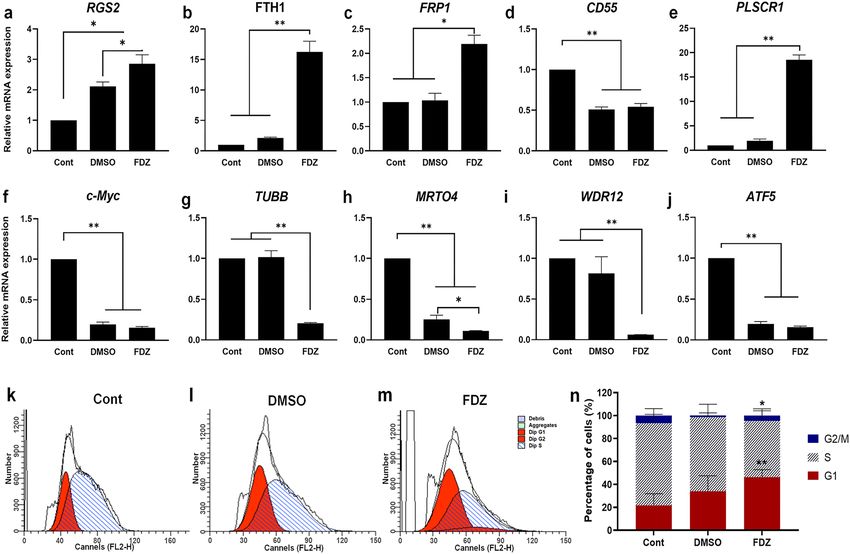
www.nature.com/scientificreports/
Retrospective Retrospective Selected for Target 1 Target 2 Target 3 Target Target 4 Target 5 Target 6 Target 7
Bioinformatics Cheminformatics Compound validation for validation for experimental Target 1 Target 1 disease Target 2 Target disease Target 3 Target 3 disease Target 4 4 disease Target 5 Target disease Target 6 Target 6 disease Target 7 Target disease
Rank score score name leukaemia other cancers validation name score score name 2 score score name score score name score score name 5 score score name score score name 7 score score
Podophyl-
1 − 0.81 23 *76 EDNRB 26 30 EDNRA 21 11 F3 20 40 PDE11A 13 3 FKBP1A 13 12 CYP3A4 10 44 NR3C1 9 22
lotoxin
2 − 0.79 15 Leflunomide *77 MTTP 21 2 APOB 19 20 DHODH 16 0 ATF1 14 2 TRPV1 13 12 NFKB1 13 46 RAF1 12 22
3 − 0.79 16 Colchicine *78 TUBB1 37 3 F3 8 40 STS 5 24 BDKRB1 2 11 ALK 2 2
4 − 0.79 5 Terazosin * EHMT2 20 18 CCR4 18 3 ADRA1B 18 4 ADRA1A 15 3 EHMT1 14 0 UBE2N 14 0 PDPK1 8 9
5 − 0.78 7 Prenylamine *79 ADRB2 18 9 CASR 16 2 ADRB3 13 3 ADRB1 12 6 C3AR1 9 7 CAPN2 8 17 SSTR2 8 2
Trimethyl-
6 − 0.78 21 colchicinic *80 TUBB1 23 3 STS 14 24 DRD1 8 0 F3 7 40 ALK 6 2 ABCC1 6 57 ACHE 5 18
acid
81
7 − 0.78 29 Etoposide * NCOA3 30 100 F3 23 40 NCOA1 20 16 RORC 15 0 TOP1 13 17 SLC5A1 12 0
8 − 0.78 14 Mebendazole*21 TEK 30 14 RAF1 20 22 KDR 17 25 F9 10 0 GRB7 6 14 CHEK2 6 22 ITK 5 3
Adenosine
9 − 0.78 5 *82 RSEL 99 3 IMPDH1 91 4 P2RY2 87 12 P2RY1 70 0 P2RX1 69 0 AHCY 68 12
phosphate
Cefopera-
10 − 0.78 5 SLC22A8 72 9 SLC22A6 66 7 CMA1 44 3 ELANE 35 0 PGF 15 5
zone
11 − 0.77 2 Thioridazine *18 HRH1 34 0 DRD1 24 0 DRD2 23 3 CHRM5 20 6 DRD3 18 0 CHRM4 18 3 HRH2 18 0
12 − 0.77 14 Nocodazole *83 TEK 36 14 KDR 21 25 STK33 17 3 ITK 15 3 F9 13 0 RAF1 12 22 ABL1 9 32
13 − 0.77 4 Tetryzoline ADRA2A 27 4 ADRA2B 24 7 NISCH 23 0 ADRA2C 23 3 BDKRB1 21 11 DRD1 12 0 ADRA1A 12 3
14 − 0.77 20 Wortmannin *20 PIK3CA 72 11 MTOR 58 23 MYLK 18 17 ABCB1 10 63 SOAT2 10 3 CYP19A1 9 23 ADCY1 9 4
15 − 0.77 15 Tretinoin *84 RARG 65 11 RARB 65 28 RXRA 64 12 RARA 59 20 RXRG 53 11 RXRB 53 8 RBP4 49 11
16 − 0.77 46 Genistein *85 ALDH2 40 15 ESR2 25 16 ESR1 23 100 TOP2A 20 100 XDH 15 17 CYP1A1 15 38 CYP1B1 15 36
17 − 0.76 15 Ly-294002 *86 PRKDC 68 18 PIK3CA 38 11 PIK3CB 32 6 PIK3CD 26 24 PIK3CG 25 18 PIK3C2B 14 3 MTOR 11 23
Proxymeta-
18 − 0.76 4 * UBE2N 11 0 HTR4 10 0 P2RY12 6 0 PDGFRA 1 4 BCHE 1 18 CHRM4 1 3 MBTPS1 1 3
caine
19 − 0.76 9 Sulfapyridine*87 NTRK1 7 5 CYP2C18 6 10 GRM4 6 0 EDNRA 6 11 HTR6 4 0 EDNRB 4 30 PIK3C3 3 7
Fenbenda-
20 − 0.75 22 *31 * TEK 27 14 AURKB 11 21 RAF1 11 22 KDR 10 25 AURKA 8 13 ITK 7 3 MCL1 5 56
zole
Mephenter-
21 − 0.75 4 CASR 12 2 GHSR 10 4 ADRB2 8 9 ADRB1 6 6 ADRB3 5 3 TACR3 2 3 CCKBR 2 3
mine
22 − 0.75 5 Dobutamine ADRB2 32 9 ADRB1 31 6 ADRB3 30 3 PGF 5 5 OPRD1 5 0 OPRM1 4 4 KISS1R 4 11
23 − 0.75 11 Clenbuterol ADRB2 27 9 ADRB1 27 6 ADRB3 18 3 BACE1 3 8 CTSD 1 25 IGF1R 0 16 CYP2D6 -1 11
Thioridazine 18
24 − 0.75 2 * HRH1 34 0 DRD1 24 0 DRD2 23 3 CHRM5 20 6 DRD3 18 0 CHRM4 18 3 HRH2 18 0
(rep)
Ly-294002
25 − 0.75 15 *86 PRKDC 68 18 PIK3CA 38 11 PIK3CB 32 6 PIK3CD 26 24 PIK3CG 25 18 PIK3C2B 14 3 MTOR 11 23
(rep)
Trichosta-
26 − 0.75 8 *88 HDAC6 28 3 HDAC10 25 3 HDAC1 24 17 HDAC8 23 3 HDAC2 23 9 HDAC9 23 11 HDAC11 22 7
tin a
27 − 0.74 2 Remoxipride *89 DRD2 28 3 DRD3 10 0 UTS2R 9 0 HCRTR1 9 7 HCRTR2 9 0 HTR4 7 0
28 − 0.74 5 Nadide IMPDH1 105 4 P2RY2 90 12 RSEL 86 3 GAPDH 77 18 P2RX1 74 0 P2RY1 70 0 P2RY4 66 0
29 − 0.74 4 Terfedine *26 TACR2 28 3 NPY2R 22 7 HRH1 18 0 CHRM3 11 2 KCNH2 11 10 NPC1L1 10 0 CCR5 10 5
30 − 0.74 27 Ouabain *y26 KLF5 39 0 NR3C1 37 22 ATP12A 30 0 SHBG 28 7 STAT3 24 42 FGF2 23 16 FGF1 23 100
Table 1. Top 30 ranked compounds for leukaemia: the table shows the highest ranked compounds along
with their predicted targets and the scores for the predicted targets (Target score). High target scores show
high probability of the compound to bind to that protein target based on our in-silico prediction approach.
The “Target disease score” shows how much the target is related to the disease according to Comparative
Toxicogenomic Database (CTD). Compounds that have retrospective validation and literature support for
leukaemia or other cancer types and the ones selected for experimental validation in this work are marked with
a * for each relevant column. The Bioinformatics score is the score calculated based on anti-correlation of the
compound gene signature and leukaemia differentiation signature. The Cheminformatics score is the rounded
average of Target Disease Score for the top seven predicted targets of each compound.
assay. Also another recent study confirmed the use of mebendazole for leukaemia patients in pre-clinical and
clinical settings22. Another recent study used network pharmacology and applied it in the area of differentiation
therapy for l eukaemia13. Remarkably, among the compounds that came up in top results of our and their study,
ATRA (our rank = 15), mebendazole (rank = 8), colchicine (rank = 3), podophyllotoxin (rank = 1), nocodazole
(rank = 12) and dinoprost (rank = 230) were shared. They further confirmed that mebendazole, podophyllotoxin
and dinoprost can also induce the differentiation of leukaemia cells. Moreover, a quantitative proteomics study
also identifies one of our highly ranked compound genistein (rank = 16) to induce apoptosis in both MV4-11
and HL-60 cells via caspase activation23. Genistein is also known to induce granulocytic differentiation and
DNA Strand Breakage in HL60 and K562 c ells24,25. Terfenadine (rank = 29) and ouabain (rank = 30) in our top
results were also discovered using a connectivity map approach previously for AML leukaemia and validated
experimentally but were not tested for differentiation t herapy26.
Prospective validation on leukaemia. Among the highest-ranked predictions based on the bioinfor-
matics score without any current literature support proxymetacaine (ranked 18), fenbendazole (ranked 20) and
terazosin (ranked 4) were selected to be tested in vitro on the HL60 leukaemia cell line with genistein (ranked
16) serving as a control. Here, proxymetacaine and terazosin were selected based on high bioinformatics score
only, whilst fenbendazole was selected based on the combined bioinformatics- and cheminformatics-approach
as it had both high bioinformatics and cheminformatics score (see Table 1). As shown in Table 1, fenbendazole is
Scientific Reports | (2021) 11:12537 | https://doi.org/10.1038/s41598-021-91629-x 4
Vol:.(1234567890)www.nature.com/scientificreports/
Figure 2. Prospective validation of selected compounds on HL60 cell line. Among the compounds tested on
the HL60 cell line fenbendazole (a) shows highest efficacy with LC50 values of 0.5 µM, 0.36 µM and 0.31 µM
after 24, 48 and 72 h, respectively. The LC50 of Fenbendazole on BMSC cells was 5 µM (b). Genistein (c) was
only minimally active (with LC50s of 12 µM after 48 h) while terazosin (d) and proxymetacaine (e) were inactive
in HL60 cells. Fenbendazole exhibited 14.5-fold selectivity at 72 h over BMSC cells (f).
the only compound with both high bioinformatics (in the top 30) and cheminformatics score with no previous
literature on leukaemia. As shown in Fig. 2a–f the prospective validation revealed that genistein (Fig. 2c) was
only minimally active (with LC50s of 12 µM after 48 h) while terazosin (Fig. 2d) and proxymetacaine (propa-
racaine, Fig. 2e) were inactive in HL60 cells. On the other hand, fenbendazole exhibited a profound effect on
HL60 cells with L C50 values of 0.50 µM, 0.36 µM and 0.31 µM at 24, 48 and 72 h, respectively (Fig. 2a). In order
to establish functional selectivity over healthy cells, the toxicity of fenbendazole was further evaluated on human
bone marrow stem cells (BMSC) and exhibited LC50 values of 5.1 µM and 4.5 µM after 48 and 72 h, respectively
(Fig. 2b). Hence, at time point of 72 h, fenbendazole exhibits 14.5-fold selectivity in killing HL60 cells over
BMSC cells was observed (Fig. 2f).
We further investigated if selectivity is driven by the slower cell cycle of BMSC cells, compared to HL60 cells.
Therefore, toxicity of fenbendazole was also measured on HFF cells, which gave rise to the same L C50 values to the
BMSCs and hence same 14.5-fold selectivity. Hence, overall, the data show that the LC50 values of fenbendazole
Scientific Reports | (2021) 11:12537 | https://doi.org/10.1038/s41598-021-91629-x 5
Vol.:(0123456789)www.nature.com/scientificreports/
Figure 3. Fenbendazole-induced differentiation of HL60 cells to granulocytes followed by cell death: (a) Cell
morphology at 1, 3, 5 and 7 days post treatment with 0.1 µM, 0.2 µM and 0.5 µM of fenbendazole via staining
with Wright–Giemsa; (b) necrotic cells; (c) granulocytes; (d) apoptotic cells. (e) Different concentrations of
fenbendazole were employed in the NBT reduction assay at different time points. The assay demonstrates
that 0.5 µM of fenbendazole increased NBT reduction upon neutrophil differentiation significantly compared
to positive control treatment with DMSO). Hence it can be concluded that the mode-of-action hypothesis
fenbendazole inducing cell death via differentiation to granulocytes is supported by experiment.
were ca. 35 times lower than that of the positive control, genistein (with L C50 values of 12.5 µM and 10.8 µM at
48 and 72 h, respectively). Moreover, fenbendazole exhibits 14.5-fold selectivity of cancer cells over somatic cells.
Next, the mode-of-action of fenbendazole on HL60 cells was investigated by cellular imaging in 1, 3, 5
and 7 days after treatment with three different concentrations (0.1, 0.2 and 0.5 µM) of fenbendazole via stain-
ing with Wright–Giemsa (Fig. 3a) in order to determine the possible transformation of leukaemia cells to the
granulocyte lineage as predicted. After 1 day in the presence of 0.5 µM fenbendazole, we found a heterogeneous
cell population of apoptotic cells (marked by nuclear fragmentation and apoptotic body formation, Fig. 3d)
along with necrotic cells (marked by intact nuclei and increased cell volume, Fig. 3b) and cells with a lobulated
nucleus. The latter indicates the presence of granulocytes (Fig. 3c). In the presence of 0.2 µM of fenbendazole,
many indented cells were observed after 1 day of treatment. After day three, the 0.1 µM-treated cells revealed
nuclear indentation while lobulated cells were seen at 0.2 µM concentration. On the other hand, most of the cells
incubated with 0.5 µM fenbendazole underwent cell death while others showed multi-lobed nucleus. Apoptotic
morphology was observed in 0.2 µM and 0.1 µM-treated cells after 5 and 7 days, respectively (Fig. 3d). Hence, it
can be concluded that at lower concentrations, the majority of cells appear to go through apoptosis via induced
differentiation to granulocytes which is consistent with our prediction. However, in higher concentrations of
fenbendazole treatment (around LC50) we found a mixture of three physiological events (apoptosis, necrosis
and neutrophil differentiation) after a short time (day 1). It seems that in this concentration, some of the cells are
killed directly, which may occur by necrosis or apoptosis, and unspecific effects are frequently observed at such
higher concentrations. Comparison of these findings with 1.25% DMSO treatment, as a well-known inducer of
granulocytic differentiation27, revealed a similar response at a later time point in case of DMSO treatment (on
day 7), compared to 0.1 and 0.2 µM fenbendazole-treatment at an earlier time point (day 5, Fig. 3a). An NBT
reduction assay, as a marker of granulocyte and monocyte d ifferentiation24, was used to quantitatively verify the
hypothesis of granulocytic differentiation. It was revealed that an acute treatment with fenbendazole (0.5 µM)
resulted in a sharp increment in NBT reduction upon neutrophil differentiation (Fig. 3e). We observed a moder-
ate (but significant) increase in absorbance of formazan deposits by lower concentrations of fenbendazole during
the time. These findings were comparable to positive control treatment with DMSO, which hence supported the
hypothesis of a transformation of leukaemia cells to granulocytes (Fig. 3e). Taken together, the results obtained
are consistent with the hypothesis that fenbendazole induces cell death via induction of differentiation.
In the next step, the nature of cell death and selectivity of the compound was further investigated. Flow
cytometry analysis of cells treated for 24 h with fenbendazole via Annexin V-FITC demonstrated a concentration-
dependent selective cell death induced in leukaemia cells, around the LC50 of the compound, with no significant
effect on normal HFF cell population (Fig. 4a). Further experiments revealed that in a shorter time point (16 h)
post 0.5 µM fenbendazole treatment, necrotic cells (23%) outnumbered apoptotic cells (16%, see Fig. 4b), while
after incubating the HL60 cells with 0.2 µM fenbendazole for 72 h apoptotic cells (8%) outnumbered necrotic
cells (2%, Fig. 4c). Based on these findings it was observed that higher concentrations of fenbendazole lead cells
to a sudden death, which much resembles necrosis, while lower concentrations convert cells to granulocytes
and subsequently induce programmed cell death, in agreement with the previous findings from microscopy.
Although some derivatives of benzimidazole anthelmintics, such as mebendazole, albendazole, and fluben-
dazole, draw increasing attention as potent anticancer a gents28, to the best of our knowledge, fenbendazole has
not been previously used in the treatment of leukaemia. It has however been tested against other cancer types
Scientific Reports | (2021) 11:12537 | https://doi.org/10.1038/s41598-021-91629-x 6
Vol:.(1234567890)www.nature.com/scientificreports/
Figure 4. Flow cytometry analysis of fenbendazole treated cells with Annexin V-FITC: (a) concentration
dependent selective cell death induced in HL60 leukaemia cells by fenbendazole compared to Human
Foreskin Fibroblast cells (HFF); (b) 16 h post 0.5 µM fenbendazole treatment (16% apoptotic (Annexin+) and
23% necrotic cells (Annexin−, PI+)); (c) 72 h post 0.2 µM of fenbendazole (8% apoptotic (Annexin+) and
2% necrotic cells (Annexin−, PI+)). It can be seen that longer time point, and less concentration increases
percentage of apoptotic cells over necrotic one.
where it was found to induce apoptosis in a lung cancer cell line by accumulating apoptosis regulatory proteins
such as cyclins, tumour proteins p53 (TP53), and IĸBα and induced stress-associated genes like HSPA5(GRP78),
DDIT3(GADD153), ATF3, ERN1 (IRE1α) and PMAIP1(NOXA)29. Fenbendazole alone was previously reported
to be ineffective in a lymphoma mice xenograft model, but efficacious when co-administered with a vitamin-
supplemented diet30. The highest dose of fenbendazole did not change the growth of mammary tumours (EMT6
cell line) or radiation efficacy in one study31, and did not alter the dose–response curves when combined with
Docetaxel31.
Analysis of the mode‑of‑action of fenbendazole. As mentioned before, the mode-of-action of a com-
pound can be considered on a systems level, e.g. via the induced gene expression changes, or on a protein level,
both approaches of which have significant strength in different areas (most notably when it comes to efficacy in
the former case, and understanding ligand–protein interactions, and hence supporting lead optimization, in the
latter case). We now aimed to understand the mode-of-action of fenbendazole on both a systems level, and a
protein level, in agreement with the whole algorithmic approach presented in this work.
rediction11 suggests that on the protein level, fenbendazole targets the Angiopoi-
In silico mode-of-action p
etin-1 receptor (TIE-2), Aurora kinase B, RAF proto-oncogene serine/threonine-protein kinase (RAF1) and
Vascular endothelial growth factor receptor 2 (VEGFR2), as well as Aurora kinase A (Table 1). Aurora kinase
B has been previously suggested to be a promising therapeutic target for leukaemia32. RAF1 is important in
inducing apoptosis in leukaemia cells and is related to relapse-free survival of AML p atients33,34. Also on a
compound-set level in silico target prediction identified RAF1 as the most enriched targeted protein among the
top 50 compounds (with a P value of 0.0016, see Table 2). The Comparative Toxicogenomics Database (CTD)17
Scientific Reports | (2021) 11:12537 | https://doi.org/10.1038/s41598-021-91629-x 7
Vol.:(0123456789)www.nature.com/scientificreports/
Count in top 50 Count in all CMap Average position of
Target ID Target name Gene symbol predicted compounds compounds Probability the target Average rank P value
Serine/threonine-
CHEMBL1906 RAF1 4 61 0.066 4.5 10.5 0.00165
protein kinase RAF
CHEMBL4308 Bradykinin B1 receptor BDKRB1 4 62 0.065 5.3 21.3 0.00175
CHEMBL4081 Coagulation factor III F3 5 116 0.043 2.6 11.2 0.00267
Beta-2 adrenergic
CHEMBL210 ADRB2 7 279 0.025 1.4 26.3 0.00716
receptor
Beta-1 adrenergic
CHEMBL213 ADRB1 7 283 0.025 3.0 26.3 0.00768
receptor
CHEMBL1941 Histamine H2 receptor HRH2 4 97 0.041 5.5 31.0 0.00819
Beta-3 adrenergic
CHEMBL246 ADRB3 7 337 0.021 2.7 26.3 0.01720
receptor
CHEMBL2056 Dopamine D1 receptor DRD1 7 369 0.019 2.6 27.6 0.02529
CHEMBL234 Dopamine D3 receptor DRD3 6 296 0.020 5.0 31.2 0.02833
Muscarinic acetylcho-
CHEMBL1821 CHRM4 5 220 0.023 5.6 27.2 0.02944
line receptor M4
Muscarinic acetylcho-
CHEMBL2035 CHRM5 4 194 0.021 4.3 29.5 0.06092
line receptor M5
CHEMBL217 Dopamine D2 receptor DRD2 6 416 0.014 3.0 30.8 0.08312
CHEMBL231 Histamine H1 receptor HRH1 6 450 0.013 1.3 33.3 0.10076
Table 2. Most enriched protein targets in the top results. Frequency of all predicted protein targets were
counted in the top 50 results compared to all compounds in the Connectivity map database. Probability of
observing each protein target (count in top 50/count in all compounds) is displayed as Probability. P value
displays significance of observing each target in the top results compared to all the compound signatures
extracted from CMap (5,764 signatures). Average position of the target denotes average rank of the protein
target for the top 50 compounds using in silico target prediction.
also identified relatively high scores (14, 20, 21, 25, 12, with an average of 18) for these predicted protein targets
in leukaemia, agreeing with our predictions. The average of the five top target scores of terazosin and proxym-
etacaine were lower (5 and 4 retrospectively), indicating that there is more evidence linking fenbendazole to
this indication, compared to terazosin and proxymetacaine, based on both bioinformatics and cheminformatics
information.
The cheminformatics approach enabled us to select fenbendazole over mebendazole due to its more relevant
predicted bioactivity profile. The bioactivity profile predicted for both fenbendazole and mebendazole included
Tyrosine-protein kinase TIE-2, Serine/threonine-protein kinase RAF and Vascular endothelial growth factor
receptor 2. However, fenbendazole’s predicted bioactivity profile only included Serine/threonine-protein kinase
Aurora-A and B. It is known that inhibition of Aura A and B32 induces apoptosis in leukaemia AML cells35. Also,
Aurora kinase A is required for hematopoiesis36 and its expression is increased in leukaemia stem cells37. This
advantage on the cheminformatics side enabled us to select fenbendazole over mebendazole (Table 1).
The GSEA algorithm also identified the genes most upregulated by fenbendazole treatment of HL60 cells
(instance ID 2360), which are in turn downregulated in the disease, to be RGS2, FPR1, SAT1, PLSCR1, PTPRE,
FCER1G and CD55 (Supplementary Table S1). Among those RGS2 showed highest upregulation in the compound
signature, and literature shows that this gene is involved in myeloid differentiation and leukemic transformation,
thereby providing a biological rationale for compound selection38. SAT1 is overexpressed in intestinal cancer,
breast cancer and melanomas, compared to c ontrol39, while PLSCR1 has been previously linked with prolifera-
tion arrest of leukaemia cells and granulocyte-like differentiation, as well as causing downregulation of MYC,
which is also implicated in the latter process (as discussed below)40. Also the upregulation of other genes has
been mechanistically liked to the development and progression of leukaemia (or other cancers): protein phos-
phatases including PTPRE are important regulators of cell signalling and their deregulation contribution to cell
transformation41, while expression of PTPRE is reported to be significantly upregulated in AML leukaemia i tself41,
and FCER1G is significantly downregulated in CML leukaemia patients where it is also associated with T-cell
immunodeficiency42. On the other hand, fenbendazole treatment on HL60 cells downregulates WDR12, MYC,
WDR3, CTH, TTC27 and ATF5, which are in turn significantly upregulated in the disease state. Here, WDR12,
MYC, WDR3, are critical in the regulation of cell cycle progression in cancer c ells43,44. MYC is important in cell
cycle progression and transformation as well as induction of apoptosis (http://w ww.n cbi.n
lm.n
ih.g ov/g ene/4 609)
and it has been associated with the differentiation of HL60 cells to g ranulocyte24,45. Tretinoin (ranked 15) and
genistein (ranked 16) as known inducers of differentiation of HL60 cells also downregulate MYC. ATF5 is widely
expressed in carcinomas and has previously been shown to be a selective target for breast cancer t reatment46. On
the pathway level, fenbendazole is predicted to target the “PI3K-Akt signalling” pathway, which is known to be
active in acute myeloid l eukaemia47, by inhibiting TIE-2, RAF-1 and VEGF and downregulating the Myc proto-
oncogene protein (MYC), while upregulating cyclin-D3 (CCND3). The “Cell Cycle” pathway is also enriched
by inhibiting Aurora kinase-B and Aurora kinase-A and downregulating TUBB, TUBB4B, MYC and TUBA1A
and upregulating CCND3. Another important enriched pathway is the “Acute myeloid leukaemia” pathway by
Scientific Reports | (2021) 11:12537 | https://doi.org/10.1038/s41598-021-91629-x 8
Vol:.(1234567890)www.nature.com/scientificreports/
Figure 5. Protein–protein interaction network of the proteins associated to fenbendazole-induced gene
expression changes and its protein targets: each node represents a gene specified by the gene symbol, arrows
indicate up- and downregulation of genes by fenbendazole (according to CMap data) and the rest of genes
are in a rectangle. The genes that were up/down regulated in leukaemia disease signature are highlighted in
red and blue, respectively. Predicted protein targets of fenbendazole are highlighted with green border. MYC,
transcription factor that plays a role in cell cycle progression, apoptosis and cellular transformation, is a key gene
in the topology of this network; it shows highest ‘betweenness’ in the connected part of the network. MYC is
upregulated in the disease signature and in turn is downregulated by fenbendazole. On the other hand, RAF1,
which is predicted as a target from the cheminformatics-side, is a first neighbour of many genes dysregulated in
leukaemia, indicating the multi-faceted nature of the mode-of-action of a compound.
inhibiting RAF1 and down-regulating MYC. We can hence conclude that genes targeted by fenbendazole accord-
ing to CMap data has biological relevance to leukaemia according to literature.
Based on the above information, we next attempted to understand the mode-of-action of fenbendazole with a
network analysis approach. Figure 5 depicts the differentially expressed genes in leukaemia as well as gene targets
(from CMap) and the predicted protein targets of fenbendazole. In agreement to the above GSEA approach, the
network approach points out the particular importance of MYC. It appears that MYC has a particular impor-
tance in leukaemia where it is significantly upregulated (six folds), while at the same time being connected to 23
other upregulated genes and having highest ‘betweenness’ (0.87) of the most connected part of the network. It is
known that MYC regulates several other genes involved in growth, cell cycle, signalling, and adhesion48 which
is in agreement with the network visualization. fenbendazole targets MYC by downregulating it and based on
all information available this seems to be of major relevance for its mode-of-action. One of the likely supportive
activities of fenbendazole is the predicted inhibition of RAF kinase, which has a high ‘betweenness’ (ranked
third for betweenness, 0.17) in the network and its indirect inhibition appears to lead to efficient disruption of
the network. Even though RAF is not significantly differentially expressed in the leukaemia signature itself, it is
the first neighbour of significantly differentially expressed genes of the disease, such as PBK, OIP5 and CDC25A,
and may thereby exert indirect effects on the system. In agreement with the above discussion, The importance of
Scientific Reports | (2021) 11:12537 | https://doi.org/10.1038/s41598-021-91629-x 9
Vol.:(0123456789)www.nature.com/scientificreports/
RAF1 has been previously established for leukaemia33,34. TUBB (ranked second for betweenness, 0.26), TUBA1A,
TUBB6 and TUBB4B are also similarly important as they have high betweenness and connected to differentially
expressed genes of TTK, EPRS, PSAT1, LMAN1 and BUB1B even though they are not differentially expressed
themselves.
Furthermore, we explored whether pathway annotations such as Gene Ontology (GO) would add informa-
tion to understanding the mode-of-action of fenbendazole. The network analysis suggests that fenbendazole
enriches the rather broad “negative regulation of biological process” (GOID: 48519) by upregulating HBEGF,
TIMP1, ANXA1, PTPRE, FTH1, RGS2, IER3 and downregulating CTH, ATF5, MYC, ADRB2 and inhibiting
RAF1 and MCL1 proteins as suggested by the target prediction algorithm. More specific in the current context,
the compound enriches the “Apoptosis” pathway by inhibiting RAF1 and MCL1 and “natural killer mediated
cytotoxicity” by downregulating TUBB and TUBB4B. CTH, which is downregulated by fenbendazole, is also a
member of the “negative regulation of apoptotic signalling” pathway (GO: 2001234). The experimental validation
of the effects of fenbendazole to induce differentiation followed by programmed cell death is hence consistent
with the enriched biological processes from this section of the work.
Experimental validation of the mechanism of fenbendazole. Expression of few up/down regulated
genes in the fenbendazole signature extracted from CMap were confirmed experimentally in this work after
longer time point. The fenbendazole instance from CMAP was at dose 13 µM after 6 h treatment on HL60 cells
(instance ID: 2360). Here we check those genes at longer timepoint of 5 days in mRNA level. Among up-regu-
lated genes in response to fenbendazole, the expression of RGS2, FPR1, FTH1, PLSCR1, and CD55 was assessed
after 5 days of treatment with fenbendazole as well as DMSO, which were normalized to the expression level in
cells prior to induction (see Fig. 6a–e). It can be seen that all genes except CD55 were significantly upregulated
as the result of fenbendazole treatment with the higher level, in comparison to DMSO treated cells.
We experimentally checked RNA expression of PI3K-Akt signalling genes to investigate effect of fenbendazole
in this pathway which was in agreement with pathways enriched based on fenbendazole signature in CMap data.
We found a remarkable decline in the expression of MYC, MRTO4, and ATF5 due to the induction by either
fenbendazole or DMSO (Fig. 6f,h,j). On the other hand, significant down regulation occurred for TUBB and
WDR12 only following fenbendazole treatment (Fig. 6g,i). To determine whether fenbendazole treatment is
accompanied with the accumulation of cells in the non-division phase, cell cycle analysis was carried out, using
propidium iodide (PI) s taining49. As expected, fenbendazole triggered significant G1-phase cell cycle arrest in
HL60 cells, mainly via decreasing of cell population in S phase (Fig. 6k–n). However, DMSO treatment slightly,
but not significantly, increased cells in G1 phase from 22% in control to 34%.
In order to investigate the role of PI3K/AKT, MEK/ERK or JAK/STAT pathways in the induction of neu-
trophil differentiation in HL-60 cells by DMSO or fenbendazole, the activation of key effector proteins of these
signalling pathways were evaluated through Western blot analysis. Figure 7a displays the expression level of
total AKT, ERK1/2, and STAT3 as well as the amount of the phosphorylated form of each protein. Densito-
metric quantification of bands relative to GAPDH showed a slight, but not significant increase in total AKT for
fenbendazole and DMSO treated samples (Fig. 7b,c). However, only fenbendazole treatment (but not DMSO)
resulted in a significant increase in phosphorylation of Ser-473 of AKT. In contrast, level of ERK and p-ERK
were reduced in response to both interventions, which was specifically effected by ERK activation (Fig. 7d,e). In
addition, total expression level of STAT3 was highly elevated in response to fenbendazole (Fig. 7f). However, the
activated p-STAT3 (Tyr-705) was not detected in HL60 cells in either DMSO- and fenbendazole-treated groups.
We also found that the mRNA expression of AKT and ERK were showed almost similar pattern as their proteins
(Fig. 7g,h). The mRNA level of STAT3 significantly declined after application of both fenbendazole and DMSO
(Fig. 7i). These were accompanied with a marked rise in the expression of GCSF and GSFR mRNA, following
fenbendazole treatment (Fig. 7j,k).
Although several studies have highlighted the role of STAT3 activity in myeloma cell lines50,51, there is con-
troversy about its importance in HL60 c ells52,53. According to the undetectable level of p-STAT3 in all groups,
the regulatory effect of JAK/STAT pathway in this process requires further investigation. Notably, HL-60 as
a cancer cell line has several new mutations over time and exhibits genetic/epigenetic heterogeneity in cells
provided from different s ources54. Furthermore, the mRNA expression of STAT3 did not show any significant
changes in response to fenbendazole treatment, however, total STAT3 proteins after fenbendazole treatment is
significantly higher. On the other hand, there have been partially contradictory findings on the involvement
of the MAPK/ERK pathway on the maturation of granulocyte progenitors. While some studies support the
olecule55, other studies approve its role in d
proliferation effect of this m ifferentiation56,57. Concerning this, we
provide some evidence that DMSO, independent of fenbendazole, significantly decreased ERK expression in
both mRNA and protein level.
Discussion
In this work, we have employed an integrated transcriptional drug repositioning and cheminformatics approach
to find novel small molecules that can induce differentiation of leukaemia cells to granulocytes. The approach
rediscovered current standard of care, retinoic acid, for APL (HL60 cells) that is a well-known drug for dif-
ferentiation therapy along with some novel candidates. Among highly ranked compounds, fenbendazole was
shortlisted as a suitable candidate and validated experimentally that it can induce differentiation of HL60 cells
to granulocytes. Moreover, it was shown that the compound exhibits 14.5-fold selectivity in killing HL60 leu-
kaemia cells at low doses of 0.36 µM and 0.31 µM at 48 and 72 h compared to bone marrow stem cells (5.1 µM
and 4.5 µM after 48 and 72 h). This confirms that the compounds that induce the differentiation are generally
less toxic than chemotherapy agents3.
Scientific Reports | (2021) 11:12537 | https://doi.org/10.1038/s41598-021-91629-x 10
Vol:.(1234567890)www.nature.com/scientificreports/
Figure 6. Mode-of-action analysis of fenbendazole (compared to DMSO control and relative to HL60 cells
prior to treatment). The relative RNA expression level of genes expected to undergo upregulation after treatment
according to our model: (a) RGS2, (b) FTH1, (c) FRP1, (d) CD55, and (e) PLSCR1 as well as downregulation:
(f) c-Myc, (g) TUBB, (h) MRTO4, (i) WDR12, and (j) ATF5. Representative histograms of cell cycle analysis of
(k) Control, (l) DMSO-, and (m) fenbendazole- treated HL-60 cells, and (n) number of cells per cell cycle phase
following DMSO and fenbendazole treatment. *P < 0.05 and **P < 0.01. Each value is presented as mean ± SEM
of three independent experiments.
In this work, we have also investigated the mechanisms underlying neutrophilic differentiation induced by
fenbendazole via studying three major pathways underlying granulocyte differentiation, including PI3K/AKT,
JAK/STAT and, MAPK pathways. To this end, we studied expression and activation of key effector proteins of
mentioned pathways. Our results showed that following induction of neutrophil differentiation, expression
of AKT in both mRNA and protein level, have not significantly changed, thus it seems that this process was
induced independent of AKT expression. Whereas AKT activation (via ser-473 phosphorylation) elevated dur-
ing fenbendazole treatment and this result occurred independent of DMSO, as vehicle. PI3K/AKT pathway is
known as an important regulator of various physiological events such as apoptosis, progression of cell cycle, dif-
ferentiation, and metabolism. Notably, up-regulation of this pathway can be detected in majority of cancers and
facilitates tumour growth, angiogenesis and therapy resistance58. Furthermore, constitutive activation of PI3K/
AKT signalling has been known as a common event in AML p atients59. Therefore, efficient blocking of PI3/AKT
pathway, seems to be a potent regulator to inhibit proliferation of cancerous cells, especially in AML. Despite the
mentioned overall role of this pathway, activation of AKT induced by G-CSF resulted in differentiation, but not
proliferation, in myeloid precursor c ells60. Also activation of this pathway has been reported during granulocytic
differentiation of HL_60 and NB4 cell lines following ATRA induction61,62. To elucidate the potential impact of
GCSF on AKT activation, the effect of fenbendazole on G-CSF signalling, G-CSF and G-CSFR expression were
measured in mRNA level, which showed remarkable overexpression of both genes. G-CSF is known as a hemat-
opoietic cytokine, which have critical role on neutrophil progenitors survival and stimulates them in bone mar-
row to proliferate and differentiate to functional neutrophils63,64. It is known that G-CSF receptor show highest
eutrophils65. In addition, various mutations in the CSF3R have been reported in myeloid
level of expression in n
disorders including, chronic neutrophilic leukaemia (CNL), myelodysplastic syndrome (MDS), Acute Myeloid
Leukaemia (AML), and atypical chronic myelogenous leukaemia (aCML)55, which confirmed the importance of
this receptor in neutrophil differentiation. GCSF cytokine binds to extra cellular domain of GCSFR and through
its cytoplasmic domain, activates two major protein tyrosine kinases: SRC family kinase and Janus kinase which
effect on multiple intracellular signalling cascades. During GCSF stimulation, SRC kinase activates AKT protein
in a separate mechanism from STAT and ERK. Mediating PI3K protein and JAK kinase likely have major role on
Scientific Reports | (2021) 11:12537 | https://doi.org/10.1038/s41598-021-91629-x 11
Vol.:(0123456789)www.nature.com/scientificreports/
Figure 7. Pathway analysis of HL-60 cells treated with DMSO and fenbendazole determined by Western
Blotting. (a) Expression and phosphorylation levels of AKT, ERK, and STAT3; the quantitative analysis of
relative protein level of (b) Total AKT, (c) p-AKT, (d) Total ERK, (e) p-ERK (f) Total STAT3 vs GAPDH; and the
relative RNA expression level of (g) AKT, (h) ERK, (i) STAT3, (j) GCSF, and (k) GCSFR following fenbendazole
and DMSO (control) treatment, compared to HL-60 cells prior treatment (day 0). *P < 0.05 and **P < 0.01. Each
value is presented as mean ± SEM of three independent experiments. As the blots were cropped, full length blots
are provided in Supplementary Figure S1.
activation of STAT66. So, it seems that the impact of fenbendazole, at least partially, is associated with activation
of GCSF/GCSFR signalling, which increased AKT activity through SRC cascade.
In this work, we highlight one important application of drug repositioning approaches in differentiation
therapy and how our combined bioinformatics and cheminformatics approaches can facilitate selection of small
molecules for this purpose. We also show that the choice of disease signature and the two states that are being
compared is directly influencing the biological outcome we would want to achieve. As opposed to conventional
approaches of drug repositioning, the comparison does not have to necessarily be between disease and healthy
states. It should be viewed as comparison of two biological states. One representing the current state and one as
a target state. Here we have shown using a differential transcriptional profile between HL60 cells with granulo-
cytes serves as a blueprint for selecting compounds that induce dedifferentiation of cell types, of relevance for
cell differentiation therapy in leukaemia. After identifying the right signature for differentiation, the challenging
part is to prioritise compounds. The Bioinformatics scoring system rank ordered all drug signatures in the CMap
database from 1 to 5,765. Then, the list was filtered to the top 30 drugs. For prioritisation, we took into account
the cheminformatics scoring system that scores compounds based on the predicted targets and their relevance
to leukaemia. These two scoring systems accompanied with novelty literature search only prioritised one single
novel drug, fenbendazole, with good scores in bioinformatics and cheminformatics scoring system. The Network
visualisation approach discussed, facilitated elucidating mode of action of selected compound candidate and
enabled visualising all potential targets of a candidate drug and how it is placed in the protein–protein interac-
tion network of differentially expressed genes in the leukaemia differentiation signature. All bioinformatics,
cheminformatics and network approaches are useful for shortlisting compounds and after that further literature
search might be useful for selecting compounds for experimental validation.
The authors have also shown previously that comparing stem cell and cardiomyocyte gene expression profiles
can lead to blueprint of differentiation of stem cells to cardiomyocyte and compounds that come up out of the
drug repositioning can cause the differentiation of stem cell to cardiomyocytes67. This highlights a new way of
observing transcriptional drug repositioning approaches in general and how its application can facilitate iden-
tifying small molecules for differentiation therapy and beyond.
Online methods
Pre‑processing of CMap. CMap8 provides a rank matrix of all genes for all compound instances. This data
was used for the generation of rank-ordered list of compounds for breast cancer (GDS2626). In case of leukaemia
and large-scale diseases, raw CEL files of CMap were preprocessed. For this purpose, CEL files were obtained
from the CMap website and Factor Analysis for Robust Microarray Summarization (FARMS)68 was utilised in R
Scientific Reports | (2021) 11:12537 | https://doi.org/10.1038/s41598-021-91629-x 12
Vol:.(1234567890)www.nature.com/scientificreports/
to preprocess the cell files. The data consisted of three cell lines (MCF7, PC3, and HL60) and three different array
types (HGU133A, HTHGU133A, and EA.HTHGU133A). Different combinations of array types and cell types
were pre-processed separately. Custom CDF definitions (from Brainarray) were utilized and then I/NI filtering69
was performed, using the informative (I)/non-informative (NI) calls approach integrated in FARMS. This allows
filtering out genes for which the probes did not show a consistent behaviour across different samples. FARMS
was performed with a Laplacian prior with default settings in order to keep even the least informative genes.
Log fold changes of gene expression were calculated by dividing the intensity value for each gene by the inten-
sity value of the respective vehicle. When multiple vehicles were present, the vehicle closest to the spatial median
of all vehicles was chosen. The spatial median was preferred over the standard median because it maintains the
correlational structure of the genes of each sample.
Transcriptional drug repositioning approach. For identifying compounds and diseases correlated and
anti-correlated in gene expression space, Gene Set Enrichment Analysis (GSEA) as implemented by the Broad
Institute16 was employed in this work. This method checks whether a query gene signature is occurring at the
extremes (top or bottom) of a rank-ordered list of genes, or whether it shows closer to random distribution
(i.e., there is no correlation between both spaces). An enrichment score was calculated by descending the rank-
ordered list of genes and incrementing a variable when encountering a gene in the given query signature. The
magnitude of increment depends on the position of the gene in the list, which is chosen corresponding to a
weighted Kolmogorov–Smirnov statistic. The enrichment score can range between − 1 and 1, where − 1 shows
strong negative connectivity, 1 identifies strong positive connectivity and 0 represents zero connectivity. The
query signature in the GSEA approach is a short list of differentially expressed genes of a disease, which are used
to search the full rank-ordered gene expression profile of drugs. However, in the current work, the query signa-
ture was chosen to be the differentially expressed genes caused by compound treatment, which were screened
against the full gene expression profile of a disease. The reason for this choice was that the disease signal was
generally found to be stronger than the gene expression signal after compound treatments. In addition, due to
the noisy nature and low fold-changes of gene expression data from compound treatments, only the 20 most
over- and under-expressed genes were employed. The optimal cut-offs were chosen after using various different
cut-offs and selecting the one with maximum precision (percentage of predicted compounds in top results which
were supported by literature) for leukaemia. For each compound, two query signatures, namely one of the most
upregulated genes ( scoreup), and one of the most downregulated genes ( scoredown) were used. For each disease
vs. drug the following formula was used to combine the two scores:
scoreup − scoredown
score =
2
The combined score was used to rank order the compounds in CMap database for the leukaemia differentia-
tion gene expression profile.
Cheminformatics approach. A target prediction algorithm as established b efore11 has been utilised to
predict protein targets of compounds in the CMap databases using the Naïve Bayes approach. This algorithm
predicts a score for each protein target included in the training set, which represents the probability of the
compound ability to bind to this target (without considering the nature of the particular effect, say agonism,
antagonism, etc.). The extraction of compound-target pairs was identical to the benchmarking dataset query
introduced in the previous w ork11 (which included targets with binding affinity less than 10 µM and confidence
level of 9 or 10) except that it was applied on ChEMBL19 v.17 and hence left us with a training database of 385,126
compound-protein pairs, 1643 distinct proteins and 226,791 unique compounds. Compounds were standard-
ised and ECFP4 fingerprints were generated using the JChem package of ChemAxon (Jchem 6.1.2. ChemAxon,
http://www.chemaxon.com, 2013). The standardisation options were Aromatise, RemoveExplicitH, Clean 2D,
Clean 3D, RemoveFragment and Neutralise. The Laplacian modified Naïve Bayes version of the algorithm provided
in the previous publication11 was then trained on the extracted data.
The cheminformatics part of the integrated approach includes prediction of targets for all compounds. In
order to identify the importance of predicted targets for a disease of interest, the Comparative Toxicogenom-
ics Database (CTD)17 has been used. Disease-gene links were downloaded separately as provided on the CTD
website. The CTD database provides an inference score for each target which indicates the level of relevance
of each target with each disease, based on text mining approaches of a large set of scientific publications. The
gene-protein links were retrieved from ChEMBL19 to map gene identifiers to proteins implicated in diseases.
A cheminformatics score for all compounds in CMap was calculated. This involved averaging relevance score
to leukaemia (Extracted from CTD) for top seven protein targets predicted (using the in-silico approach) for
each of the compounds in the connectivity map database.
Network visualization method. The list of up/downregulated genes of fenbendazole Instance in CMap
(instance-ID 2360) as well as protein targets predicted with the target prediction a lgorithm11 was prepared. This
list was searched in Cytoscape70 public network databases and the proteins-protein interactions of those genes
were retrieved from the Mentha d atabase71. This yields a visualisation of proteins as nodes and their interactions
as undirected edges. The nodes in Cytoscape are linked to a table carrying all the information of the protein
including the protein Uniprot ID, Gene Symbol and Entrez Gene ID. Gene expression data of leukaemia was
retrieved from the GEO database GSE48558, where HL60 cells were compared to granulocytes. GenePattern72
was used to pre-process the leukaemia database and following this log fold changes of the HL60 samples over
granulocytes were calculated. In order to load this information to Cytoscape, it was required to map probe IDs to
Scientific Reports | (2021) 11:12537 | https://doi.org/10.1038/s41598-021-91629-x 13
Vol.:(0123456789)You can also read