Combined Large-Scale Phenotyping and Transcriptomics in Maize Reveals a Robust Growth Regulatory Network1 OPEN
←
→
Page content transcription
If your browser does not render page correctly, please read the page content below
Combined Large-Scale Phenotyping and Transcriptomics in
Maize Reveals a Robust Growth Regulatory Network1[OPEN]
Joke Baute, Dorota Herman, Frederik Coppens, Jolien De Block, Bram Slabbinck, Matteo Dell’Acqua,
Mario Enrico Pè, Steven Maere, Hilde Nelissen, and Dirk Inzé*
Department of Plant Systems Biology, Vlaams Instituut voor Biotechnologie, 9052 Ghent, Belgium (J.B., D.H.,
F.C., J.D.B., B.S., S.M., H.N., D.I.); Department of Plant Biotechnology and Bioinformatics, Ghent University,
9052 Ghent, Belgium (J.B., D.H., F.C., J.D.B., B.S., S.M., H.N., D.I.); and Institute of Life Sciences, Scuola
Superiore Sant’Anna, 56127 Pisa, Italy (M.D., M.E.P.)
ORCID IDs: 0000-0003-0507-6904 (J.B.); 0000-0001-6565-5145 (F.C.); 0000-0003-0047-4380 (J.D.B.); 0000-0002-4961-6231 (M.D.);
0000-0002-5341-136X (S.M.); 0000-0001-7494-1290 (H.N.); 0000-0002-3217-8407 (D.I.).

Leaves are vital organs for biomass and seed production because of their role in the generation of metabolic energy and organic
compounds. A better understanding of the molecular networks underlying leaf development is crucial to sustain global
requirements for food and renewable energy. Here, we combined transcriptome profiling of proliferative leaf tissue with in-
depth phenotyping of the fourth leaf at later stages of development in 197 recombinant inbred lines of two different maize (Zea
mays) populations. Previously, correlation analysis in a classical biparental mapping population identified 1,740 genes correlated
with at least one of 14 traits. Here, we extended these results with data from a multiparent advanced generation intercross
population. As expected, the phenotypic variability was found to be larger in the latter population than in the biparental
population, although general conclusions on the correlations among the traits are comparable. Data integration from the two
diverse populations allowed us to identify a set of 226 genes that are robustly associated with diverse leaf traits. This set of genes
is enriched for transcriptional regulators and genes involved in protein synthesis and cell wall metabolism. In order to
investigate the molecular network context of the candidate gene set, we integrated our data with publicly available
functional genomics data and identified a growth regulatory network of 185 genes. Our results illustrate the power of
combining in-depth phenotyping with transcriptomics in mapping populations to dissect the genetic control of complex traits
and present a set of candidate genes for use in biomass improvement.

   In plants, leaves are the main organs for fundamental                      growth rate and final size, is of great interest, in par-
biological functions, such as photosynthesis and respi-                       ticular since the demands in food, feed, and renewable
ration. The size, shape, and number of leaves strongly                        bioenergy are envisaged to increase strongly in the next
determine a plant’s photosynthetic capacity and the                           decades (Godfray et al., 2010).
efficiency with which water and nutrients are used.                               Leaf size is a complex trait determined by the inter-
Consequently, the size of the leaves influences plant                          play of several factors. The dynamics of leaf develop-
biomass and yield (Linkies et al., 2010; Pérez-Pérez                          ment have been studied in detail in various plant
et al., 2010). Therefore, understanding the mechanisms                        species at the organ and cellular levels, but insight into
controlling various aspects of leaf development, such as                      the underlying molecular mechanisms remains limited.
                                                                              Typically, leaf development starts with the recruitment
   1
                                                                              of founder cells at the peripheral zone of the shoot ap-
     This work was supported by the European Research Council                 ical meristem, followed by a phase of cell proliferation
(grant no. [339341–AMAIZE]11) and by Ghent University (Bijzonder              and successive cell expansion. During this postprimordial
Onderzoeksfonds Methusalem grant no. BOF08/01M00408).
   * Address correspondence to dirk.inze@psb.vib-ugent.be.
                                                                              development, leaf differentiation progresses basipetally
   The author responsible for distribution of materials integral to the       in monocots: the region containing proliferating cells
findings presented in this article in accordance with the policy de-           becomes gradually restricted to the base of the organ; as
scribed in the Instructions for Authors (www.plantphysiol.org) is:            a consequence, a growing leaf shows a developmental
Dirk Inzé (dirk.inze@psb.vib-ugent.be).                                       gradient with dividing cells at the base, fully differen-
   D.I. conceived and coordinated the study; J.B., M.E.P., M.D., S.M.,        tiated mature cells at the tip, and in between a region of
H.N., and D.I. designed the study; J.B. and J.D.B. carried out the plant      expanding cells (Poethig, 1984; Sylvester et al., 1990). At
measurements; J.D.B. carried out the sampling and RNA prepara-                the molecular level, some genes that affect leaf size
tions; F.C. performed the RNA sequencing analysis; J.B., D.H., and
B.S. performed computational data analyses; J.B., S.M., H.N., and D.I.
                                                                              have been identified, primarily in the model species
interpreted the results; J.B. wrote the article with input from the other     Arabidopsis (Arabidopsis thaliana; for review, see
authors; all authors read and approved the final article.                      Gonzalez et al., 2012; Hepworth and Lenhard, 2014).
   [OPEN]
          Articles can be viewed without a subscription.                      Although regulators of both cell division and cell ex-
   www.plantphysiol.org/cgi/doi/10.1104/pp.15.01883                           pansion have been identified, mutants or transgenic
1848     Plant PhysiologyÒ, March 2016, Vol. 170, pp. 1848–1867, www.plantphysiol.org Ó 2016 American Society of Plant Biologists. All Rights Reserved.

                                    Downloaded on February 18, 2021. - Published by https://plantphysiol.org
                                   Copyright (c) 2020 American Society of Plant Biologists. All rights reserved.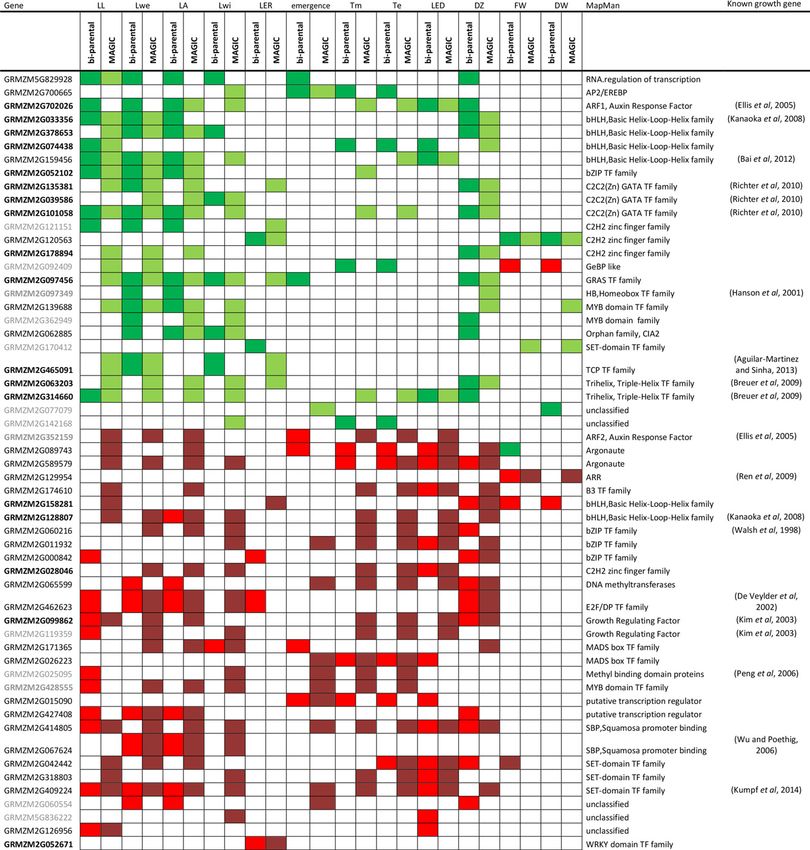
Combining Phenotyping and Transcriptomics in Maize

lines with larger leaves tend to be composed of more                       process on those tissues where the process takes place.
cells rather than larger cells (Niklas, 1994; Gonzalez                     Since leaf growth is driven by proliferation and ex-
et al., 2010). For instance, leaves of maize (Zea mays)                    pansion, zooming in on proliferative and/or expanding
plants with altered levels of GA are affected in their                     tissue is required to identify the regulatory networks
growth rates, and the size of the division zone (DZ) is                    underlying leaf development. The developmental gra-
changed correspondingly (Nelissen et al., 2012). Ex-                       dient in growing maize leaves and the large size of the
amples in Arabidopsis of genes that are regulators of                      leaf makes it possible to dissect these specific growth
final leaf size by influencing cell proliferation are AVP1,                  zones for further analysis (Nelissen et al., 2012). Since it
JAW, and BRI1 (Gonzalez et al., 2010), GROWTH-                             was recently suggested that it is the final number of
REGULATING FACTOR1 (GRF1) and GRF2 (Kim and                                cells that primarily determines final leaf size (Gonzalez
Kende, 2004), GRF5 (Horiguchi et al., 2005), DA1 and                       et al., 2010; Nelissen et al., 2012), we focus our
ENHANCER OF DA1 (Li et al., 2008), ANGUSTIFOLIA3                           transcriptome analysis specifically on proliferative tis-
(AN3)/GRF-INTERACTING FACTOR (Lee et al., 2009),                           sue of the growing leaf.
and KLUH (Kazama et al., 2010). These examples il-                            Although analyses of transcriptional variation dur-
lustrate that cell proliferation seems to be a key con-                    ing maize leaf development have provided us with new
tributing factor to final leaf size.                                        insights, all these studies were restricted to one genetic
   Exploiting natural variation has been proposed as                       background (Li et al., 2010; Pick et al., 2011; Liu et al.,
a complementary approach to the traditional, gene-                         2013b; Wang et al., 2013, 2014; Yu et al., 2015). Adding
centric reverse and forward genetics approaches to                         an additional layer of information, phenotypic varia-
identify new genes (Weigel, 2012). Knockdown or                            tion in mapping populations, and combining this with
overexpression of single genes does not capture the                        transcriptome variation in these populations offers new
extensive genetic variation present in natural popula-                     opportunities to identify genes and regulatory mecha-
tions, which results from a combination of single-                         nisms that are at the basis of phenotypic differences
nucleotide substitutions, insertions, deletions, copy                      (Andorf et al., 2012).
number variations, epigenetic changes, and expression                         Recently, we associated phenotypic variation with
differences. In the monocotyledonous species maize,                        transcriptome variation in 103 lines of a biparental re-
the intraspecific variation is large and offers great po-                   combinant inbred line (RIL) population (Baute et al.,
tential to relate genotype to phenotype. Also, several                     2015). We described the relationship of leaf size traits,
mapping populations are available, but until now, only                     such as final leaf area and leaf weight, and transcrip-
a few were used to determine the genetic control of leaf-                  tional variation in fully proliferative tissue sampled
related traits via quantitative trait locus (QTL) or                       during early leaf development. Although the genetic
genome-wide association studies (Pelleschi et al., 2006;                   and phenotypic variation in a classical biparental RIL
Ku et al., 2010, 2012; Tian et al., 2011; Dignat et al.,                   mapping population provides a valuable source of in-
2013). Although several small-effect QTLs were iden-                       formation, the possibility to detect variation in expres-
tified in these studies, further fine-mapping using                          sion that is associated with phenotypic variation
complementary approaches or a priori knowledge is                          remains limited, since it depends on the polymor-
required to find the genes underlying the quantitative                      phisms between only two parents. In multiparent ad-
trait.                                                                     vanced generation intercross (MAGIC) populations,
   Previous studies found evidence that the phenotypic                     RILs are generated from multiple parents by mixing the
diversity in maize is mainly under transcriptional                         genomes of the founder lines through several rounds of
control (Li et al., 2012; Wallace et al., 2014). The recent                mating, followed by inbreeding to obtain a set of stable
availability of cost-efficient and high-throughput se-                      homozygous lines (Churchill et al., 2004; Cavanagh
quencing technologies to analyze transcriptomes pro-                       et al., 2008; Kover et al., 2009). Such a MAGIC popu-
vides new opportunities to gain further insights into the                  lation was recently established for maize, and a panel of
molecular basis of leaf size. In maize, several recent                     529 lines was genotyped (Dell’Acqua et al., 2015). The
studies applied next-generation sequencing technolo-                       population has a larger genetic diversity than bipa-
gies to assess transcriptomic differences between                          rental populations, and as such, the number of com-
leaf developmental stages and leaf cell types.                             ponents in the regulatory network that can be identified
Transcriptomes of different regions of a growing leaf,                     is expected to be higher. Moreover, integrating results
representing different developmental stages, were                          from different populations may allow for the identifi-
compared by Li et al. (2010) and Pick et al. (2011).                       cation of the most robust players in the growth-related
Transcriptional dynamics during early development of                       molecular network across different lines. In this study,
embryonic leaves were surveyed by Liu et al. (2013b)                       we performed detailed phenotyping and transcriptome
and Yu et al. (2015). Additionally, the regulatory and                     analysis of 94 lines of the MAGIC population and
functional differentiation of various leaf cell types was                  combined this with the previously described
examined by transcriptome analysis (Li et al., 2010;                       phenotyping and transcriptome analysis of 103 lines of
Wang et al., 2013, 2014). The transcriptional variation                    the biparental B73 3 H99 population. We identified a
between tissue types and cell types during develop-                        set of 226 genes with expression levels in the DZ of the
ment (Li et al., 2010; Wang et al., 2013, 2014) illustrates                growing leaf (anti)correlating with leaf phenotype
the importance of focusing the analysis of a given                         measurements in both populations. Some of these
Plant Physiol. Vol. 170, 2016                                                                                                       1849

                                 Downloaded on February 18, 2021. - Published by https://plantphysiol.org
                                Copyright (c) 2020 American Society of Plant Biologists. All rights reserved.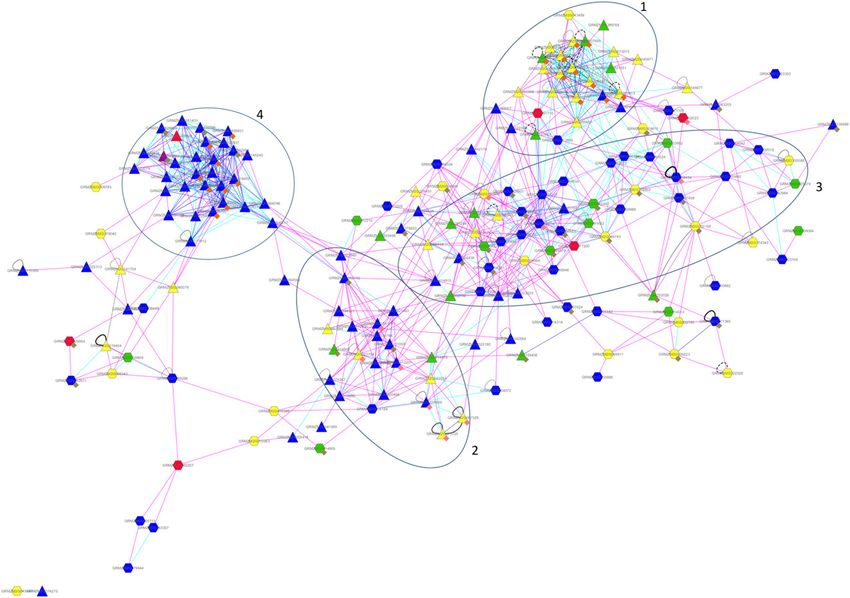
Baute et al.

genes have homologs in Arabidopsis with a known                              established multiparent MAGIC population (Dell’Acqua
function in leaf development. However, the majority of                       et al., 2015), and results of both analyses were inte-
the genes had no known function or were not annotated                        grated. Concerning phenotyping, final leaf size-related
before as having a role in this process, implying that                       traits, such as leaf length (LL), leaf width (Lwi), leaf area
these might be interesting candidates to further deci-                       (LA), and leaf weight (Lwe), were complemented with
pher the molecular network underlying leaf develop-                          measurements that capture growth kinetics, such as
ment. Additionally, integration of publicly available                        growth rate (leaf elongation rate [LER]) and duration
functional genomics data (De Bodt et al., 2012) led to                       (emergence, time point of maximal LER [Tm], time
the identification of a subset of 185 genes that are                          point when leaf 4 reaches its final length [Te], and leaf
interconnected through expression correlations or                            elongation duration [LED5-e]; Voorend et al., 2014),
protein-protein interactions.                                                and cellular measurements, such as the size of the cell
                                                                             DZ. In addition, whole-shoot variables were measured
                                                                             at the seedling stage: fresh weight, dry weight, leaf
RESULTS AND DISCUSSION                                                       number (LN), and vegetative (V)-stage (maize leaf
Correlation between Leaf Size and Shoot Traits Is Similar                    stage; Baute et al., 2015; Fig. 1; Supplemental Table S1).
in the Two Different Populations                                                Pearson correlation coefficients (PCCs) between the
                                                                             traits were determined based on the data obtained for
  Previously, in-depth phenotyping of 103 lines of a                         the MAGIC population (Table I), for the combined data
biparental RIL population derived from the inbred                            of both populations (Supplemental Table S2), and
parents B73 and H99 (Marino et al., 2009) was com-                           compared with our previous analysis for the biparental
bined with transcriptome profiling to dissect leaf size,                      RIL population (Table I; Baute et al., 2015). All three
growth, and shoot-related traits into phenotypic and                         analyses gave comparable results and supported the
molecular components (Baute et al., 2015). Here, a                           separation of the traits into three groups: leaf size traits
similar analysis was conducted on the recently                               (LL, Lwe, LA, Lwi, LER, and DZ size), shoot-related

          Figure 1. Schematic representation of maize leaf development as a function of time and phenotyping strategy. Shown is the leaf
          growth of B73. LL was measured daily from emergence from the surrounding leaves until 27 d after sowing. LER, Tm, Te, and LED5-e
          were deduced from these daily measurements. DZ size was determined 2 d after leaf emergence, at the same time that leaf
          material was sampled for RNA sequencing. End measurements, LL, LA, Lwe, Lwi, fresh weight (FW), dry weight (DW), V-stage,
          and LN, were determined 27 d after sowing, when leaf 4 had reached its mature size for all RILs.

1850                                                                                                                   Plant Physiol. Vol. 170, 2016

                                   Downloaded on February 18, 2021. - Published by https://plantphysiol.org
                                  Copyright (c) 2020 American Society of Plant Biologists. All rights reserved.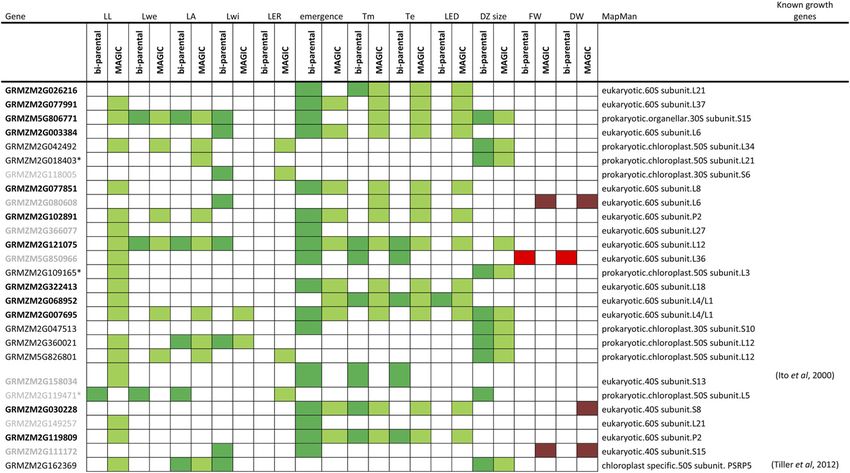
Combining Phenotyping and Transcriptomics in Maize

Table I. PCC for the analyzed traits, grouped as leaf size, shoot-related, and timing-related traits for biparental and MAGIC RIL populations
  Significant correlations are indicated by asterisks (**, P , 0.01 and *, P , 0.05); highly significant positive correlations are indicated in italics, and
highly significant negative correlations are indicated in bold.

traits (fresh weight, dry weight, LN, and V-stage),                              traits, while additional power is available in the
and timing-related traits (emergence, Tm, Te, and                                MAGIC population for the leaf size traits. This is
LED5-e; Table I; Supplemental Table S2; Supplemental                             confirmed if we determine the positions of the parental
Fig. S1). Also between groups of traits, the correla-                            lines in the distributions of the two populations
tions were largely the same in the two populations.                              (Supplemental Fig. S2): for the leaf size traits LL, Lwe,
   In general, the PCCs were higher for the MAGIC                                LA, and Lwi, values for the parental lines B73 and H99
population than for the biparental RIL population, es-                           are very similar, while they are more diverse for the
pecially among leaf, shoot, and timing traits and be-
                                                                                 other traits.
tween leaf-shoot and leaf-timing traits, which may be
due to the fact that the phenotype variation in
the MAGIC population is generally larger than that
                                                                                 Correlation between Traits Is Fully Supported at the
of the biparental RIL population (i.e. the phenotype
                                                                                 Transcriptome Level
distributions are broader; Supplemental Table S1;
Supplemental Fig. S2), which may suppress the nega-                                 In both populations, DZ size correlated positively
tive influence of stochastic and measurement noise on                             with the leaf size traits and, to some extent, with
PCC values. A larger phenotypic variation in the eight-                          shoot fresh weight and dry weight (Table I;
way RIL population was expected, given the increased                             Supplemental Table S2; Supplemental Fig. S2). This
variation in the phenotypes of the parents com-                                  supports the hypothesis that the number of dividing
pared with the biparental mapping population                                     cells is one of the key factors in the determination of
(Supplemental Fig. S2). As an exception, the PCC be-
                                                                                 final organ size and that the transcriptional differ-
tween LER and DZ size was lower in the MAGIC
population than in the biparental population, 0.347                              ences between genotypes in proliferative tissue may
and 0.507, respectively. Also, the anticorrelations be-                          inform us on important players that determine final
tween the timing traits and shoot traits fresh weight                            size traits. We previously performed RNA sequenc-
and dry weight were slightly stronger in the biparental                          ing of proliferative leaf tissue of 103 lines of the bi-
population than in the MAGIC population (Table I).                               parental RIL population (Baute et al., 2015) and
Possibly, the biparental population already covers a                             extended this here with RNA sequencing of compa-
large part of the variability for the timing and shoot                           rable tissue of 94 lines of the MAGIC population.
Plant Physiol. Vol. 170, 2016                                                                                                                          1851

                                 Downloaded on February 18, 2021. - Published by https://plantphysiol.org
                                Copyright (c) 2020 American Society of Plant Biologists. All rights reserved.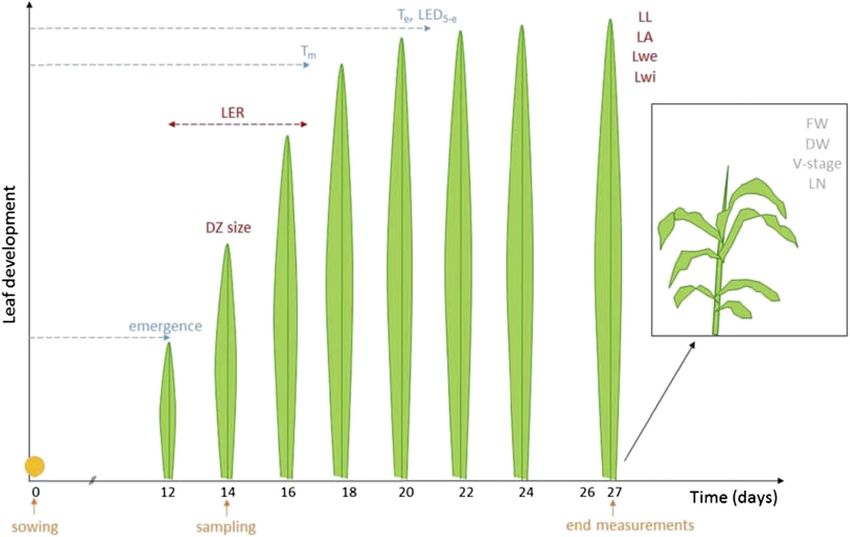
Baute et al.

   Linear correlation between phenotypes and tran-                           population, and the number of genes in the intersection
script levels was determined by calculating PCCs be-                         of both populations was limited and not higher than
tween the expression level of each transcript and each                       expected by chance (Table II). Also for LER, the per-
trait in both populations separately. The q0.99 and q0.01                    centage of genes found in common for the two popu-
PCC (i.e. the correlation coefficient of the 1% best [anti]                   lations was small and not higher than expected by
correlating transcripts) were determined before and                          chance (P . 0.05), while for all other traits, the overlap
after permutation of the trait data (for details, see                        was significant (Table II). In both populations, the q0.99
“Materials and Methods”). For the majority of the traits,                    and q0.01 PCC for LER were lower than for the other
the q0.99 and q0.01 PCC values were significantly higher                      traits (Fig. 2). The lack in significant overlap between
than those expected at random (Fig. 2), indicating that                      the two populations of transcripts whose expression
the gene sets identified by this arbitrarily chosen limit of                  correlated to LER, fresh weight, and dry weight indi-
1% contain genes whose expression levels in prolifera-                       cates that another range of growth mechanisms and
tive tissue of a growing leaf correlate significantly with                    networks may be active and/or captured for these three
final size measurements. For the leaf size traits in par-                     traits in the different populations.
ticular, the q0.99 and q0.01 PCC were higher in the                             Further analyses were restricted to the 1% best cor-
MAGIC population than in the biparental RIL popu-                            relating and anticorrelating genes for each trait, or 286
lation. As the cutoffs defined by permuting the data                          genes for each trait, referred to below as the correlated
were very comparable for both populations (Fig. 2), this                     and anticorrelated gene sets. Importantly, although
resulted in a higher number of genes with a PCC greater                      some traits had q 0.99 and q 0.01 PCC close to the
than the q0.99,random PCC in the MAGIC population                            corresponding qrandom PCC, in all cases the selected
(Table II), indicating that the higher variability in the                    286 genes had a PCC higher or lower than the q0.99 and
MAGIC population facilitates the identification of sig-                       q0.01 thresholds, respectively, and thus higher or lower
nificant transcript-phenotype correlations for leaf size                     than the corresponding qrandom PCC. The total number
traits. On the other hand, q0.99 and q0.01 PCC for fresh                     of genes thus selected for at least one trait was 22%
weight and dry weight were considerably lower in the                         lower in the MAGIC population (1,367) than in the bi-
MAGIC population than in the biparental RIL popu-                            parental RIL population (1,740), since the gene selection
lation, suggesting that the relationship between gene                        for the MAGIC population contains a higher proportion
expression and fresh weight and dry weight traits in the                     of genes that correlate with several traits compared
eight-way population may be more complex and non-                            with the biparental RIL population (Fig. 3A). This
linear in nature than in the two-way population, due to                      might be due to the higher correlation between the leaf
an increased number of different alleles that play a role.                   size traits in the MAGIC population. In the MAGIC
Accordingly, the number of genes with a PCC higher                           population, we found 21 genes (Supplemental Table S3)
than the q0.99,random PCC or lower than the q0.01,random                     associated with nine traits, the maximum in the bipa-
PCC for dry weight and fresh weight in the                                   rental RIL population being eight traits. One of these
MAGIC population was lower than in the biparental                            21 genes, GRMZM2G389768, with homology to cold shock

Figure 2. The 0.99 and 0.01 quantiles of
distribution of Pearson correlation be-
tween transcript expression levels and
traits. Real data are shown in dark gray
(biparental RIL population) and light
gray (MAGIC RIL population) bars; per-
muted data are shown in dark gray (bi-
parental RIL population) and light gray
(MAGIC RIL population) lines. Error
bars indicate SD of the permuted data
(n = 1,000) in dark gray for the biparental
population and in light gray for the
MAGIC population. DW, Dry weight;
FW, fresh weight.

1852                                                                                                                 Plant Physiol. Vol. 170, 2016

                                      Downloaded on February 18, 2021. - Published by https://plantphysiol.org
                                     Copyright (c) 2020 American Society of Plant Biologists. All rights reserved.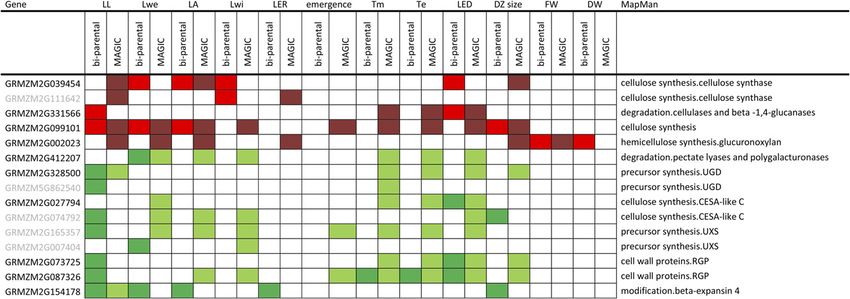
Combining Phenotyping and Transcriptomics in Maize

Table II. Number of genes correlating with traits in biparental and MAGIC RIL populations, and number and percentage of genes in the intersections
  Significance is designated as follows: *, significantly enriched (P , 0.05); NS, not significant (P . 0.05), according to hypergeometric probability
testing.

          Trait                      Correlation (Random)a                     Significance               Correlation (Quantiles)b             Significance
                        Biparental        MAGIC          Intersection                            Biparental      MAGIC          Intersection
      LL                 2,206            3,111           740 (34%)                 *              286             286           51   (18%)         *
      Lwe                2,596            3,141           928 (36%)                 *              286             286           54   (19%)         *
      LA                 2,230            3,165         1,039 (47%)                 *              286             286           71   (25%)         *
      Lwi                2,477            2,504           789 (32%)                 *              286             286           30   (10%)         *
      LER                1,073            1,174            70 (7%)                 NS              286             286            6   (2%)         NS
      DZ size            1,927            2,228           765 (40%)                 *              286             286           82   (29%)         *
      Emergence          2,490            1,463           436 (30%)                 *              286             286           25   (9%)          *
      Tm                 3,171            2,368           903 (38%)                 *              286             286           24   (8%)          *
      Te                 3,260            2,892         1,202 (42%)                 *              286             286           34   (12%)         *
      LED5-e             3,003            3,419         1,335 (44%)                 *              286             286           58   (20%)         *
      Fresh weight       2,259              530            77 (15%)                NS              286             286            4   (1%)         NS
      Dry weight         1,707              401            56 (14%)                NS              286             286            5   (2%)         NS
  a                                                                 b
      Numbers of genes with PCC greater than qrandom PCC.               Genes in q0.01 and q0.99 in the intersection of two data sets.

domain proteins, correlated with eight traits in the                                  DZ size (Table II). For all traits except LER, fresh
biparental RIL population. In both populations, the                                   weight, and dry weight, the number of genes in the
numbers of (anti)correlating genes shared between                                     intersection was larger than expected by chance
traits was higher within the three trait groups (leaf                                 (hypergeometric test; P , 0.05), and overall, the
size, timing, and shoot) than between these groups                                    number of genes in the intersection was highest for leaf
(Fig. 3, B and C), in accordance with the correlations                                size traits. It is worth noting that for none of the traits
found at the phenotype level. As for the biparental                                   were there correlating genes in one population and
population (Baute et al., 2015), no opposite gene-trait                               anticorrelating genes in the other population. The
correlations with traits that were categorized in the                                 strong reduction of the number of correlated genes by
same group were found for the MAGIC population                                        combining the two populations, combined with the
(numbers in blue in Fig. 3, B and C). Opposite corre-                                 fact that the overlap remains significantly higher than
lation of a transcript with multiple traits was very                                  expected by chance for the majority of the traits, in-
limited in both populations, 84 and 28 genes in the                                   dicates that this approach is efficient in identifying the
two-way and eight-way populations, respectively,                                      genes that are more robustly associated with a specific
and was observed only for timing-related traits versus                                trait, regardless of the population context, and thus
shoot-related traits, traits that are also anticorrelated at                          might be more relevant to characterize functionally.
the phenotype level.

                                                                                      Enriched Functional Categories Are Partially Overlapping
Combining the Two Populations Identifies Genes That Are                                for the Two Populations
Robustly Associated with the Traits
                                                                                         All genes were assigned to MapMan functional
   In the separate populations, expression levels of                                  categories (Thimm et al., 2004), and tests for the en-
1,740 and 1,367 genes in the biparental and MAGIC                                     richment of functional categories in the correlating
populations, respectively, correlated with at least one                               gene sets for the different traits were performed for the
of the traits. Of these genes, 226 were (anti)correlating                             two populations separately, to verify if gene sets were
with at least one of the traits in both populations, a                                enriched for comparable categories in the two popu-
strong reduction compared with the numbers found in                                   lations (Supplemental Fig. S3). For positively corre-
the populations separately (Supplemental Table S3).                                   lating genes, the major enriched functional category in
The expression levels of the 226 (anti)correlating genes                              both populations was regulation of transcription. The
in all RILs and their association with the traits were                                functional categories hormone metabolism, protein
visualized in a clustered heat map (Fig. 4), revealing a                              modifications, and protein degradation were enriched
clear gradient in expression levels that were coinciding                              for several traits in the biparental RIL population but
with (Fig. 4A) or opposite to (Fig. 4B) the phenotypic                                not or for only one trait in the MAGIC population.
variation observed in the RILs. The 226 genes in                                      Regulation of transcription, protein synthesis, and cell
common for both populations were unevenly distrib-                                    wall synthesis and degradation were significantly
uted over the different traits. The percentage of (anti)                              enriched categories for the negatively correlated gene
correlating genes in the quantiles that was shared be-                                sets for multiple traits in both populations. Thus, the
tween the two populations ranged from a few percent                                   major enriched functional categories are regulation of
for LER, fresh weight, and dry weight up to 29% for                                   transcription, protein synthesis, and cell wall synthesis
Plant Physiol. Vol. 170, 2016                                                                                                                             1853

                                  Downloaded on February 18, 2021. - Published by https://plantphysiol.org
                                 Copyright (c) 2020 American Society of Plant Biologists. All rights reserved.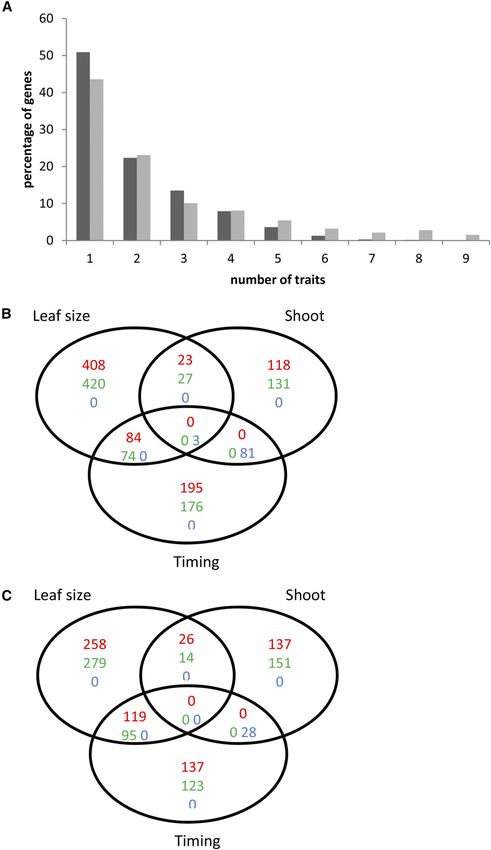
Baute et al.

Figure 3. Number of genes correlating
with one or multiple traits. A, Percentage
of genes (anti)correlating with the traits in
the biparental RIL population (dark gray)
and the MAGIC population (light gray). B
and C, Venn diagrams of the number
of genes correlating (numbers in red),
anticorrelating (numbers in green), or
both (numbers in blue) with at least one of
the leaf size, shoot, and timing traits in the
biparental RIL population (B) and the
MAGIC population (C).

and degradation, with 56, 28, and 15 genes in common                          (i.e. the 226 genes) with their frequencies in the popu-
between the two populations.                                                  lations independently (i.e. the 1,740 and 1,367 genes in
  Next, we compared the frequencies of all functional                         the biparental and MAGIC populations, respectively)
categories in the intersection of both populations                            to try to understand the nature of processes conserved
1854                                                                                                                  Plant Physiol. Vol. 170, 2016

                                       Downloaded on February 18, 2021. - Published by https://plantphysiol.org
                                      Copyright (c) 2020 American Society of Plant Biologists. All rights reserved.
Combining Phenotyping and Transcriptomics in Maize
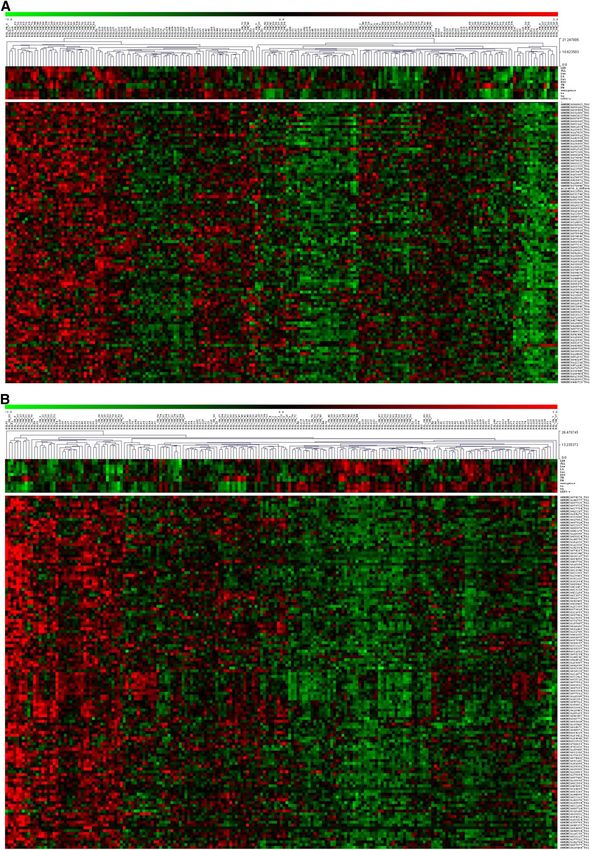
Figure 4. Expression levels of the 226 correlating and anticorrelating genes in all RILs. A, Correlated genes. B, Anticorrelated
genes. Columns represent RILs of the two populations that were hierarchically clustered, and rows represent gene expression
profiles with, on top, above the white separation, a heat map of the phenotypic traits. Green indicates low values and red indicates
high values.
Plant Physiol. Vol. 170, 2016 1855
Downloaded on February 18, 2021. - Published by https://plantphysiol.org
Copyright (c) 2020 American Society of Plant Biologists. All rights reserved.Baute et al.
across the two populations. The functional categories identified in the subset of 56 TFs. GNC and GNL
regulation of transcription, protein synthesis, and cell overexpressors show phenotypic similarities with arf2
wall synthesis and degradation were significantly (P , mutants (Richter et al., 2013). In agreement, ARF2 ex-
0.05) enriched 1.8-, 3-, and 2.5-fold, respectively, in the pression levels were positively correlated with several
intersection compared with the complete gene set cor- traits (i.e. LL, Lwe, and LA), while expression levels
related with the biparental population, while compared of the GATA-type TFs were negatively correlated
with the MAGIC population, the two functional cate- with these traits (Fig. 5). In addition, other TFs that
gories regulation of transcription and cell wall synthesis are likely implicated in hormone regulation, such as
and degradation were enriched significantly (P , 0.05) Arabidopsis Response Regulator (ARR, cytokinin signal-
1.4- and 1.8-fold, respectively. This underscores the ing; GRMZM2G129954; Ren et al., 2009) and GRAS (GA
usefulness of focusing on the intersection for identify- signaling; GRMZM2G097456) family members (Hirsch
ing the processes conserved in different populations, and Oldroyd, 2009), also correlated with the traits in
since largely the same processes are enriched in both both populations. A bHLH TF (GRMZM2G159456) with
analyses. homology to the Arabidopsis and rice (Oryza sativa)
The three major functional categories we identified, paclobutrazol-resistant family of TFs, which mediate
regulation of transcription, protein synthesis, and cell growth responses to multiple environmental and hor-
wall synthesis and degradation, are described in more monal signals (Zhang et al., 2009; Bai et al., 2012),
detail in the following sections. was negatively correlated with leaf size-related traits
(Fig. 5).
Also correlated with leaf size traits were some TFs
Transcription Factors Involved in Hormone Regulation, that are known to define leaf architecture traits.
Leaf Architecture Traits, and Chromatin Structure For example, the expression profile of LIGULELESS2
Correlate Robustly with Leaf Size (LG2), a bZIP TF involved in establishing the position of
the ligule (Walsh et al., 1998), was found to be positively
To obtain a better understanding of the nature of the correlated with leaf size- and timing-related traits (Fig.
regulatory processes during leaf growth, we focused on 5). Mutations in LG2 affect leaf architecture due to a
the 56 transcription factor (TF) genes whose expression change in the leaf angle. However, no clear effect on leaf
levels were correlating with traits in both populations. size has been reported (Tian et al., 2011), although LG2
Breakdown of the functional category regulation of was mapped within a meta-QTL for leaf length and leaf
transcription into the different TF families revealed that width (Ku et al., 2012). Moreover, LG2 functions in the
the major classes of TFs in the gene sets that are posi- same pathway as LIGULELESS NARROW (LGN) and
tively correlated with the traits are ARGONAUTE, lg2 transcripts are reduced in lgn mutants, which dis-
MADS box, SQUAMOSA PROMOTER-BINDING play a severe reduction in leaf size and total plant
PROTEIN (SBP), SET, GRF, and bZIP, while the major height (Moon et al., 2013).
classes of TFs that are negatively correlated with the As another example, the expression levels of two
traits are bHLH, GATA, and TRIHELIX (Fig. 4). As de- SBP/SBP-LIKE (SPL) genes, which regulate a wide va-
termined with the Bio-Analytic Resource for maize riety of processes associated with shoot development,
gene expression (http://bar.utoronto.ca/efp_maize), correlated with leaf size traits in our data set (Fig. 4):
about one-third of these TFs are expressed specifically one maize-specific gene (GRMZM2G414805) and
in the DZ (Fig. 5). This is less than expected, since, one gene (GRMZM2G067624) with homology to
according to Li et al. (2010), approximately 70% of all Arabidopsis SPL4, which is involved in vegetative
TFs show DZ-specific expression. Among the 56 TFs, phase change (Wu and Poethig, 2006). Another class of
we could identify 22 reported before to be linked to genes known to affect leaf architecture traits are the
growth (Fig. 5). Many of these are related to hormone TCP TFs that contain a bHLH domain and are involved
signaling, leaf architecture, and chromatine structure, in the coordination of cell proliferation, cell differenti-
three classes that are discussed in more detail below. ation, and growth; as such, they play a role in leaf de-
Our data set contains three GATA-type TFs that velopment (Ori et al., 2007). One of the genes identified
show a negative correlation with the leaf size-related as correlated with leaf size traits, GRMZM2G465091,
traits (Fig. 5). In Arabidopsis, two redundant GATA- shows homology to Arabidopsis class I TCP proteins.
type TFs, GATA, NITRATE-INDUCIBLE, CARBON- Quadruple and pentuple loss-of-function mutants of
METABOLISM INVOLVED (GNC) and GNC-LIKE/ class I TCP genes in Arabidopsis have larger but fewer
CYTOKININ-RESPONSIVE GATA FACTOR1 (GNL/ rosette leaves (Aguilar-Martínez and Sinha, 2013), in
CGA1), were identified to regulate multiple aspects of agreement with the negative correlation between leaf
plant development by repressing GA signaling. In size traits and expression levels of this maize homolo-
agreement with the anticorrelation between the tran- gous gene.
script level and leaf size, double mutants displayed A third set of TFs that correlated with leaf size traits
increased rosette sizes, while overexpression resulted in were related to chromatin structure. Three positively
smaller plants (Richter et al., 2010). Moreover, it was correlating SET domain TF family proteins were iden-
shown that these GATA factors act downstream of tified with homology to Arabidopsis SU(VAR)3-9
AUXIN RESPONSE FACTOR2 (ARF2), which was also RELATED4 (SUVR4) and ASH1-RELATED3 (ASHR3),
1856 Plant Physiol. Vol. 170, 2016
Downloaded on February 18, 2021. - Published by https://plantphysiol.org
Copyright (c) 2020 American Society of Plant Biologists. All rights reserved.Combining Phenotyping and Transcriptomics in Maize
Figure 5. TFs with expression profiles correlating or anticorrelating with at least one of the traits in both populations. Bright red
indicates positive correlation in the biparental population, dark red indicates positive correlation in the MAGIC population, dark
green indicates negative correlation in the biparental population, and light green indicates negative correlation in the MAGIC
population. DZ-specific TFs are indicated in boldface (Li et al., 2010). DW, Dry weight; FW, fresh weight.
involved in histone modification (Veiseth et al., 2011; 2014); in agreement, expression levels of E2F/DP TF
Kumpf et al., 2014). ASHR3 is required for coordinated (GRMZM2G462623) correlated positively with final leaf
DNA replication and cell division, and the ashr3 mutant size traits and DZ size in both RIL populations (Fig. 5).
has a reduced root apical meristem size and pri- Maintenance of epigenetic signatures by setting up the
mary root size (Kumpf et al., 2014). Moreover, it was appropriate epigenetic marks is essential to regulate
shown that expression levels of ASHR3 are controlled gene expression and establish euchromatin and
by the E2Fa/E2Fb-DPa TF complex (Kumpf et al., heterochromatin. Furthermore, histone modification
Plant Physiol. Vol. 170, 2016 1857
Downloaded on February 18, 2021. - Published by https://plantphysiol.org
Copyright (c) 2020 American Society of Plant Biologists. All rights reserved.Baute et al.
pathways are intertwined with DNA methylation, for proteins in our data set, except for the chloroplast ri-
instance by interaction between chromatin modifiers bosomal proteins that showed the highest expression
such as SET domain proteins and DNA methyltrans- toward the elongation zone, were specifically expressed
ferases (Cedar and Bergman, 2009) and/or methyl- in the DZ, as determined by the Bio-Analytic Resource
CpG-binding domain proteins (MBDs; Zemach and expression viewer (Fig. 6). The energy status of the cell
Grafi, 2007), which read out the DNA methylation tunes the transcription of ribosomal RNA and the
pattern. The subset of 56 TFs also includes a DNA production and maintenance of ribosomal proteins,
methyltransferase, of which the expression levels in the which are substantial indirect costs of protein synthesis.
DZ were positively correlated with Lwe, LA, DZ size, Since protein synthesis is one of the most energy-
and the timing-related traits, and a MBD also positively consuming processes in the cell, one can expect selec-
correlated with the traits (Fig. 5). In agreement, the tive pressure to achieve a frugal use of the translational
down-regulation of some Arabidopsis MBD genes machinery (Perry, 2007). Thus, a more efficient trans-
results in developmental defects comparable to the lational machinery that minimizes the indirect costs of
down-regulation of genes with a role in chromatin re- protein synthesis is likely to allow a higher rate of cell
modeling and RNA-mediated silencing (Berg et al., proliferation and growth (Lempiäinen and Shore, 2009;
2003; Peng et al., 2006). Also, two ARGONAUTE (AGO) Piques et al., 2009), a possible explanation for the
genes with homology to Arabidopsis AGO4 involved in anticorrelation we observe between transcript levels of
RNA-directed DNA methylation (Zilberman et al., genes encoding for ribosomal proteins and leaf size and
2004) showed a positive correlation with leaf size traits timing traits.
and timing-related traits (Fig. 5). In addition to the co- The importance of the translational machinery is
valent histone modifications, chromatin remodeling reflected in the effect that many mutations in ribosomal
also depends on ATP-dependent chromatin remodel- proteins have on leaf development (for review, see
ing complexes that move, eject, or restructure nucleo- Byrne, 2009; Horiguchi et al., 2012). For instance,
somes. For instance, the transcription of GRFs is Arabidopsis RPS13A encodes a 40S ribosomal protein
regulated by recruitment of the SWITCH/SUCROSE S13 involved in early leaf development. An insertion
NONFERMENTING (SWI/SNF) chromatin-remodeling mutant of RPS13A gives rise to a whole range of phe-
complexes to their promoters by the transcriptional notypic abnormalities, including an altered leaf shape
coactivator AN3 (Vercruyssen et al., 2014; Nelissen et al., of the first leaves and an increased number of leaves
2015). The phenotypes upon differential expression compared with the wild type (Ito et al., 2000). In our
of AN3, BRAHMA, or SWI/SNF-ASSOCIATED data set, transcript levels of the homologous maize gene
PROTEIN73B, subunits of the SWI/SNF complex, re- GRMZM2G158034 were anticorrelating with the leaf
flect the importance of this chromatin-remodeling size and timing traits in both populations (Fig. 6). Also,
complex in the regulation of leaf growth (Farrona the expression levels of several chloroplast ribosomal
et al., 2004; Horiguchi et al., 2005; Vercruyssen et al., proteins were anticorrelated with the leaf size traits
2014), and constitutive overexpression of GRF1 and (Fig. 6). Many of the nucleus-encoded components of
GRF2 also increased leaf and cotyledon size (Kim et al., the plastid ribosomes are essential for plant growth and
2003). In agreement, the subset of 56 TFs enclosed two development, since their absence results in diverse
GRFs that displayed a positive correlation with leaf phenotypic effects, such as embryo lethality, paleness,
size- and timing-related traits (Fig. 5). and reduced overall sizes (Magnard et al., 2004;
More than one-third of the 56 TFs that were corre- Asakura et al., 2012; Romani et al., 2012). The
lated with leaf-related traits in the two populations Arabidopsis TF CHLOROPLAST IMPORT APPARATUS2
had homologs with a known role in growth, while (CIA2) was shown to up-regulate the expression of
most of the other TFs had an unknown function. We genes encoding chloroplast ribosomal proteins to ac-
primarily identified genes required for hormone sig- complish the high protein demands of chloroplasts
naling, leaf architecture, and chromatin remodeling, (Sun et al., 2009). Three of the eight chloroplast ribo-
next to TFs involved in other processes, such as Suc somal proteins in our data set were homologs of the
signaling (homeobox TF family; Hanson et al., 2001) Arabidopsis genes up-regulated by CIA2. Also, the
and cell cycle regulation (Trihelix TF; Breuer et al., maize homolog of CIA2, GRMZM2G062885, was neg-
2012). atively correlated with leaf size traits (Fig. 4).
Protein Synthesis Is Negatively Correlated to Leaf Growth Leaf Growth Is Strongly Correlated with Cell
Wall Characteristics
In the functional category protein synthesis, all 26
genes shared between the two populations are ribo- To allow cells to grow, cell wall expansion is indis-
somal proteins. Ribosomes provide the basis for protein pensable, and this was also reflected in the overrepre-
production, which is essential to sustain cell growth. sentation of the functional category cell wall synthesis
Therefore, the majority of the genes that encode for ri- and degradation for genes with expression levels cor-
bosomal proteins are highly expressed at the base of the related with leaf size traits. The BioArray tool revealed
leaf in the DZ (Li et al., 2010), and all selected ribosomal that the 15 correlating genes in this functional category
1858 Plant Physiol. Vol. 170, 2016
Downloaded on February 18, 2021. - Published by https://plantphysiol.org
Copyright (c) 2020 American Society of Plant Biologists. All rights reserved.Combining Phenotyping and Transcriptomics in Maize
Figure 6. Ribosomal proteins with expression profiles correlating or anticorrelating with at least one of the traits in both pop-
ulations. Bright red indicates positive correlation in the biparental population, dark red indicates positive correlation in the
MAGIC population, dark green indicates negative correlation in the biparental population, and light green indicates negative
correlation in the MAGIC population. Asterisks indicate genes that are homologs of the Arabidopsis chloroplast ribosomal genes
up-regulated by CIA2 (Sun et al., 2009). DZ-specific genes are indicated in boldface (Li et al., 2010). DW, Dry weight; FW, fresh
weight.
are all highly expressed in the DZ (Li et al., 2010). Five GRMZM2G328500, and GRMZM5G862540, involved in
of these genes are involved in cellulose synthesis, of the biosynthesis of UDP-Xyl (Harper and Bar-Peled,
which three were positively correlated with the traits 2002; Kärkönen et al., 2005; Reboul et al., 2011), a nu-
while two showed anticorrelation (Fig. 7). Expression cleotide sugar required for the synthesis of diverse
levels of the catalytic subunits of the cellulose synthase plant cell wall polysaccharides including xyloglucan,
complex CELLULOSE SYNTHASE3 (ZmCESA3; had expression levels in the DZ that also negatively
GRMZM2G039454), ZmCESA5 (GRMZM2G111642), correlated with the leaf size traits (Fig. 7).
and GRMZM2G099101 were positively correlating In addition to cell wall biosynthesis genes, genes in-
with leaf size traits (Fig. 7). Mutations in the respec- volved in cell wall degradation were also identified.
tive Arabidopsis orthologs CESA1, CESA3, and Expression levels of the cell wall-loosening enzyme
KORRIGAN (KOR), which interact with specific CESA endo-1,4-b-glucanase/cellulase (GRMZM2G331566)
complexes (Mansoori et al., 2014), cause an abnormal were positively correlated with LL and timing-related
plant morphology and severe dwarfism due to traits in our data set (Fig. 7). In accordance, it was
defects in cell wall formation (Sato et al., 2001; demonstrated in transgenic Arabidopsis plants that the
Beeckman et al., 2002; Persson et al., 2007). On the other expression of poplar (Populus spp.) CELLULASE1
hand, expression levels of GRMZM2G027794 and resulted in enhanced growth rates (Park et al., 2003).
GRMZM2G074792, which show homology to the Expression levels of b-EXPANSIN4, another cell wall-
CESA-like C family in Arabidopsis, were negatively loosening enzyme, were negatively correlated with leaf
correlated with leaf size traits (Fig. 7). This family is size traits (Fig. 7), although up- and down-regulation of
most likely involved in the biosynthesis of the glucan expansin expression in Arabidopsis and rice resulted
backbone of the hemicellulosic polysaccharide in larger and smaller leaves, respectively (Cho and
xyloglucan rather than cellulose (Liepman and Cavalier, Cosgrove, 2000; Choi et al., 2003; Goh et al., 2012).
2012). Lower amounts of xyloglucans in growing tissue However, more pleiotropic phenotypes were observed
possibly increase the accessibility of the primary cell wall after constitutive modification of expansin gene ex-
for cell wall-loosening enzymes to promote cell wall ex- pression, including a reduction in overall plant growth
tension and cell expansion (Pauly et al., 2001). In addition, (Rochange and McQueen-Mason, 2000), demonstrating
four genes, GRMZM2G165357, GRMZM2G007404, that the effect of expansin expression on leaf growth is
Plant Physiol. Vol. 170, 2016 1859
Downloaded on February 18, 2021. - Published by https://plantphysiol.org
Copyright (c) 2020 American Society of Plant Biologists. All rights reserved.Baute et al.
Figure 7. Cell wall-related proteins with expression profiles correlating or anticorrelating with at least one of the traits in both
populations. Bright red indicates positive correlation in the biparental population, dark red indicates positive correlation in the
MAGIC population, dark green indicates negative correlation in the biparental population, and light green indicates negative
correlation in the MAGIC population. DW, Dry weight; FW, fresh weight.
context dependent and influenced by the growth phase The resulting network incorporates 185 genes and
of the leaf (Sloan et al., 2009). 943 edges (Fig. 8). Of the other 41 genes, for seven no
Intriguingly, for many of the cell wall-related genes reliable probe sets were identified on the arrays used to
that were negatively correlated with leaf and shoot size generate the CORNET data sets, while for 34 genes
traits in our data set, down-regulation of these genes or no coexpression or interaction links were found.
their orthologs has been shown previously to result in a Functional information and correlation to the three
growth reduction (Sato et al., 2001; Roberts et al., 2004; trait groups were visualized in the network for each
Rautengarten et al., 2011) or even embryo lethality gene, and four subnetworks were determined using
(Goubet et al., 2003). We hypothesize that the difference CytoCluster (Fig. 8). Two of these subnetworks were
between the direction of the correlation in our data set enriched in the functional category protein synthesis.
and the phenotypes of Arabidopsis homologs might be ribosomal proteins; subnetwork 1 contained genes
due to the comparison of more subtle variations in ex- anticorrelating primarily with the timing traits, and
pression because of allelic effects in natural variants subnetwork 4 was primarily anticorrelated with leaf
with more drastic effects of knockout or constitutive size traits (Fig. 8). The genes within the two subnet-
overexpression often in one genetic background in works were highly connected to each other and to a
Arabidopsis. Most likely, to obtain growth-promoting limited set of other genes. For subnetwork 1, one of
effects, more subtle changes in expression levels should these other genes, GRMZM2G038032, shows homology
be applied during specific phases of development to Arabidopsis RECEPTOR FOR ACTIVATED C
and/or by combinatorial perturbation of several genes. PROTEIN KINASE1 (RACK1) genes involved in ribo-
some biogenesis (Guo et al., 2011); it was shown that loss-
of-function mutations in RACK1 genes in Arabidopsis
Toward a Robust Growth Regulatory Network severely affect rosette leaf production and root growth
(Guo and Chen, 2008). The ribosomal genes in this
Of the 226 genes we identified with expression levels first subnetwork were also highly connected to
in the DZ (anti)correlating with at least one of the traits GRMZM2G067877, a homolog of an Arabidopsis mi-
in both populations, some were described previously to tochondrial adenine nucleotide transporter (ADNT1)
be associated with leaf size and growth. However, the that plays a role in energy supply in heterotrophic tis-
majority of these genes was not identified until now as sues. This protein catalyzes the exchange between cy-
linked to growth, and 48 of these genes even had no tosolic AMP and intramitochondrial ATP, and plants
assigned function. To obtain a better insight into the with decreased ADNT1 expression show an inhibition
putative coregulation of these 226 genes, we used of root growth (Palmieri et al., 2008). A third gene that
CORNET Corn (De Bodt et al., 2012) to identify net- was coexpressed with the ribosomal genes in subnet-
works of coexpressed genes based on the expression of work 1 is GRMZM2G389768, a putative COLD SHOCK
these query genes in two publicly available expression DOMAIN (CSP) gene. In Arabidopsis it was shown that
compendia. Additionally, protein-protein interactions CSP1 associates with polysomes by binding to a specific
based on experimental and computational data set of mRNAs and acts as a chaperone under low
(primarily inferred from Arabidopsis) were added to temperatures. CSP1 primarily binds mRNAs encoding
this network. for energy-consuming processes, such as ribosome
1860 Plant Physiol. Vol. 170, 2016
Downloaded on February 18, 2021. - Published by https://plantphysiol.org
Copyright (c) 2020 American Society of Plant Biologists. All rights reserved.Combining Phenotyping and Transcriptomics in Maize
Figure 8. Coexpression and interaction network of genes with expression levels in the DZ correlating with leaf size traits in both
populations. Negatively correlating genes are represented by triangles and positively correlating genes by hexagons. Node colors
represent correlation with timing traits (yellow), leaf size traits (blue), shoot traits (red), timing and leaf size traits (green), and leaf
size and shoot traits (purple). Small diamonds attached to the nodes represent the functional classification of the genes; orange
squares indicate genes encoding ribosomal proteins, brown squares are TFs, and pink squares are cell wall-related genes; other
functional categories are not indicated. Edges colored blue connect coexpressed genes with a PCC of at least 0.8, pink edges
represent a PCC between 0.7 and 0.8, while black edges represent protein-protein interactions that were experimentally validated
(solid lines) or computationally predicted (dashed lines). Subnetworks as determined by CytoCluster are indicated by numbers.
biogenesis, to maintain the translation of these specific embryogenesis (Yin et al., 2012; Tiller and Bock, 2014),
mRNAs under stress conditions (Juntawong et al., while reduced gene expression of the plastid-specific
2013). Thus, this first subnetwork of coexpressed genes ribosomal protein PSRP5 resulted in severely delayed
seems to be linked to energy consumption and supply, plant growth due to reduced plastid translation (Tiller
suggesting that the duration of leaf growth is associated et al., 2012). Additionally, this subnetwork contained
with energy availability, as the genes in this subnet- one GATA TF (GRMZM2G039586) homologous to
work are anticorrelated with timing traits. Arabidopsis GCN, described to function in chloroplast
The network contained a second subset of strongly development, likely by regulating chloroplast division
coexpressed genes encoding ribosomal proteins and a (Chiang et al., 2012). Interestingly, the majority of the
limited number of other negatively correlated genes, other genes in this subnetwork were chloroplast
subnetwork 4 (Fig. 8). In contrast to subnetwork 1, these targeted and involved in chloroplast development and/or
genes showed anticorrelating primarily to the leaf size functioning. We identified genes functioning in chlo-
traits (Fig. 8). Of the 31 nodes in this subnetwork, nine roplast biogenesis, for instance tetrapyrrole biosynthe-
were ribosomal proteins all targeted to the chloroplasts. sis genes (Huang et al., 2009; Quesada et al., 2013) and
For most of these genes, the effect of perturbed ex- the FZO-like protein FZL coding for a dynamin-related
pression was not analyzed before now (Tiller and Bock, membrane-remodeling protein (Gao et al., 2006); genes
2014). However, two of the Arabidopsis orthologs of with metabolic functions in chloroplast coding, for in-
these ribosomal proteins, RPL21C and RPL3, were stance, for components of the NAD(P)H dehydrogen-
shown to be essential for plastid development and ase complex (Ishida et al., 2009) essential for the supply
Plant Physiol. Vol. 170, 2016 1861
Downloaded on February 18, 2021. - Published by https://plantphysiol.org
Copyright (c) 2020 American Society of Plant Biologists. All rights reserved.Baute et al.
of ATP for photosynthesis (Endo et al., 2008); and genes ATP-citrate lyase whose down-regulation of Arabidopsis
involved in plastid gene expression, such as the ribo- orthologs results in pleiotropic phenotypes, includ-
somal proteins, components of the plastid-encoded ing reduced size (Fatland et al., 2005). Also, three TFs
RNA polymerase complex, the pfkB-type carbohy- were highly coexpressed with the genes in subnet-
drate kinase FRUCTOKINASE-LIKE PROTEIN work 2: GATA TF (GRMZM2G101058) described
(Gilkerson et al., 2012), MurE (Garcia et al., 2008), above, a bZIP TF (GRMZM2G052102) of which the
and PLASTID TRANSCRIPTIONALLY ACTIVE Arabidopsis orthologous mutant shows cell wall de-
CHROMOSOME6 (Pfalz et al., 2006), CIA2 (Sun et al., fects in pollen (Gibalová et al., 2009), and a TRIHELIX
2009), genes involved in chloroplast protein import TF (GRMZM2G314660). The latter shows homology to
(Chiu and Li, 2008), and pentatricopeptide repeat pro- Arabidopsis GTL1, a master regulator that nega-
teins (Liu et al., 2013a). As a consequence, many mu- tively regulates cell growth (Breuer et al., 2012). Other
tants in these genes are chlorotic, white, or pale green examples of genes in this subnetwork that were
due to abnormal plastid development and reduced already functionally annotated were ZmPIN1b, an
photosynthetic competence. However, evidence for the auxin efflux carrier (Carraro et al., 2006), and Zmb-
impact of chloroplast development and plastid protein GLUCOSIDASE1, involved in the (in)activation of
synthesis on leaf development and morphology inde- cytokinins (Brzobohatý et al., 1993).
pendent of photosynthetic capacity has been suggested Subnetwork 3 consisted of 45 genes that were
for a long time (for review, see Tiller and Bock, 2014). primarily positively correlated to leaf size and tim-
Since the genes with a role in leaf development that ing traits (Fig. 8). This subnetwork was enriched for
are currently described are nucleus encoded, it seems two functional categories, regulation of transcrip-
likely that this effect of plastid translation on leaf de- tion (12 genes) and cell wall synthesis and degra-
velopment is the consequence of plastid-nucleus com- dation (three genes). The node with the most edges
munication known as chloroplast retrograde signaling in this subnetwork was a cell wall-related gene,
(Larkin, 2014). Recently, it was shown that chloroplast KOR (GRMZM2G099101), and was coexpressed
retrograde signaling regulates the spatial expression with eight TFs: three bHLH TFs, GRMZM2G074438,
levels of genes involved in the expansion of leaf pri- GRMZM2G128807, and GRMZM2G158281, the lat-
mordia, probably to avoid the expansion of leaves with ter showing orthology to Arabidopsis LONESOME
reduced photosynthesis due to impaired plastid HIGHWAY, which is required for establishing and
activity (Tameshige et al., 2013). Furthermore, in maintaining the normal vascular cell number and
Arabidopsis, it was postulated that chloroplast retro- pattern in roots (Ohashi-Ito and Bergmann, 2007);
grade signaling is an important regulator of the onset of two SET domain TFs, GRMZM2G409224 and
cell expansion and photosynthesis (Andriankaja et al., GRMZM2G318803, the latter being a homolog of
2012). Although the chloroplasts are still undifferenti- Arabidopsis SUVR4; E2F/DP (GRMZM2G462623)
ated in the most basal part of the DZ we sampled for and GRF (GRMZM2G099862), both having homologs in
RNA sequencing (Majeran et al., 2010), it can be as- Arabidopsis with known roles in leaf development
sumed that signaling between plastids and the nucleus (De Veylder et al., 2002; Kim et al., 2003); and an
starts early on, as plastid biogenesis is highly coordi- AGO gene with homology to Arabidopsis AGO4
nated with organ development to ensure the presence (GRMZM2G589579). Other genes coexpressed in this
of the appropriate number of plastids of the correct type subnetwork with know annotations include the cell cycle
in each stage of development (Terry and Smith, 2013). gene CYCLIN A2 (GRMZM2G017081), involved in vein
Subnetwork 4 with nucleus-encoded genes targeted to development in Arabidopsis (Donner and Scarpella,
the chloroplasts and functioning in chloroplast devel- 2013), and BRASSINOSTEROID SIGNALING KINASE2
opment, and some possibly also in chloroplast retro- (GRMZM2G054634), affecting growth through its role in
grade signaling (Strand et al., 2003; Garcia et al., 2008; the initial steps of brassinosteroid signal transduction in
Gilkerson et al., 2012), showed a variation in expression Arabidopsis (Sreeramulu et al., 2013). Still other genes
levels in both RIL populations. This expression varia- in this subnetwork were primarily linked to metabolic
tion in the DZ between RILs and the anticorrelation processes and/or are not well described to date.
with leaf size traits suggests an early coordination of Within the set of 226 genes identified in the two-way
extrachloroplastic processes with chloroplast function and eight-way RIL populations, we found 185 genes to
via chloroplast retrograde signaling. be coexpressed and four subnetworks could be distin-
Besides the two highly intraconnected subnetworks guished, of which two were enriched in the functional
of genes encoding ribosomal proteins, two other sub- category protein synthesis.ribosomal proteins. Of the
networks were identified. Subnetwork 2 consisted of 22 185 genes, 32 were TFs, and for some a function in leaf
nodes, primarily anticorrelated with leaf size traits (Fig. development and growth had already been described
8). This subnetwork was enriched in cell wall biogenesis (see above). Coexpression relationships between these
and degradation: six of the 22 genes in this subnetwork TFs and other genes may suggest potential regulatory
were involved in this process, and all negatively cor- influences; however, clear causal links between these
related with leaf size or timing traits. These cell wall- TFs and potential targets cannot be established from the
related genes as well as other genes of subnetwork coexpression network alone, and further analyses are
2 were coexpressed with GRMZM2G045534, an necessary to confirm these links.
1862 Plant Physiol. Vol. 170, 2016
Downloaded on February 18, 2021. - Published by https://plantphysiol.org
Copyright (c) 2020 American Society of Plant Biologists. All rights reserved.You can also read