Complex refractive indices in the ultraviolet and visible spectral region for highly absorbing non-spherical biomass burning aerosol - Recent
←
→
Page content transcription
If your browser does not render page correctly, please read the page content below
Atmos. Chem. Phys., 21, 7235–7252, 2021
https://doi.org/10.5194/acp-21-7235-2021
© Author(s) 2021. This work is distributed under
the Creative Commons Attribution 4.0 License.

Complex refractive indices in the ultraviolet and visible spectral
region for highly absorbing non-spherical biomass burning aerosol
Caroline C. Womack1,2 , Katherine M. Manfred1,2,a , Nicholas L. Wagner1,2,b , Gabriela Adler1,2,c ,
Alessandro Franchin1,2,d , Kara D. Lamb1,2,e , Ann M. Middlebrook2 , Joshua P. Schwarz2 , Charles A. Brock2 ,
Steven S. Brown2,3 , and Rebecca A. Washenfelder2
1 Cooperative  Institute for Research in Environmental Sciences, University of Colorado, Boulder, CO 80309, USA
2 Chemical  Sciences Laboratory, National Oceanic and Atmospheric Administration, Boulder, CO 80305, USA
3 Department of Chemistry, University of Colorado, Boulder, CO 80309, USA
a now at: Wolfson Atmospheric Chemistry Laboratories, Department of Chemistry, University of York, York, UK
b now at: Ball Aerospace, Broomfield, CO 80021, USA
c now at: Breezometer, Haifa, Israel
d now at: the National Center for Atmospheric Research, Boulder, CO 80305, USA
e now at: Department of Earth and Environmental Engineering, Columbia University, New York, NY 10027, USA

Correspondence: Caroline C. Womack (caroline.womack@noaa.gov)

Received: 20 November 2020 – Discussion started: 24 November 2020
Revised: 1 April 2021 – Accepted: 6 April 2021 – Published: 12 May 2021

Abstract. Biomass burning aerosol is a major source of            1   Introduction
PM2.5 , and significantly affects Earth’s radiative budget. The
magnitude of its radiative effect is poorly quantified due        Biomass burning is one of the largest global contributors to
to uncertainty in the optical properties of aerosol formed        accumulation-mode aerosol mass, with estimated emissions
from biomass burning. Using a broadband cavity-enhanced           of 15–57 Tg yr−1 (Pan et al., 2020). In the United States,
spectrometer with a recently increased spectral range (360–       biomass burning is calculated to contribute 2.4 Tg yr−1 of
720 nm) coupled to a size-selecting aerosol inlet, we re-         PM2.5 aerosol, which accounts for one-third of the primary
trieve complex refractive indices of aerosol throughout the       aerosol sources (Watson, 2002; Wiedinmyer et al., 2006). In
near-ultraviolet and visible spectral region. We demonstrate      the western US, increased wildfire frequency, wildfire du-
refractive index retrievals for two standard aerosol sam-         ration, and active fire season have been associated with in-
ples: polystyrene latex spheres and ammonium sulfate. We          creased spring and summer temperatures (Westerling et al.,
then retrieve refractive indices for biomass burning aerosol      2006; Dennison et al., 2014). Biomass burning aerosol plays
from 13 controlled fires during the 2016 Missoula Fire Sci-       an important role in Earth’s radiative budget by absorbing
ence Laboratory Study. We demonstrate that the technique          and scattering light (Boucher et al., 2013). Biomass burning
is highly sensitive to the accuracy of the aerosol size dis-      smoke contains a complex mixture of particles with varying
tribution method and find that while we can constrain the         composition, morphology, size, and refractive index. The two
optical properties of brown carbon aerosol for many fires,        major absorbing components are fractal-like graphitic ma-
fresh smoke dominated by fractal-like black carbon aerosol        terial (black carbon; BC) and light-absorbing spherical or-
presents unique challenges and is not well-represented by         ganic aerosol (brown carbon; BrC), with smaller contribu-
Mie theory. For the 13 fires, we show that the accuracy of        tions from dust (Li et al., 2003; Pósfai et al., 2003; China
Mie theory retrievals decreases as the fraction of black car-     et al., 2013). One recent study estimated that biomass burn-
bon mass increases. At 475 nm, the average refractive index       ing contributes 27 % of black carbon emissions and 62 % of
is 1.635 (±0.056) +0.06 (±0.12)i, and at 365 nm, the aver-        primary organic aerosol globally (Wiedinmyer et al., 2011).
age refractive index is 1.605 (±0.041) +0.038 (±0.074)i.

Published by Copernicus Publications on behalf of the European Geosciences Union.
7236                                          C. C. Womack et al.: Complex refractive indices for biomass burning aerosol

   The interaction of an aerosol particle with light can be cal-   plex populations of non-spherical, highly absorbing black
culated from its size, morphology, mixing state, and complex       and brown carbon that are representative of biomass burning
refractive index (RI). The RI is an intrinsic physical property    aerosol.
of the particle and is described as m = n + ki (Moosmüller            In this paper, we determined complex refractive indices
et al., 2009; Moise et al., 2015). Light scattering by spherical   for biomass burning aerosol across a very broadband region
particles is well described by Mie theory, which is a set of       from 360–720 nm. We measured wildfire smoke samples
solutions to Maxwell’s equations representing the scattering       from representative fuels and burn conditions at the Missoula
of light by a homogeneous sphere with dimensions similar           Fire Sciences Laboratory (Manfred et al., 2018; Selimovic et
to the wavelength of the radiation (Moosmüller and Arnott,         al., 2018). We used the broadband extinction measurements
2009; Moosmüller et al., 2009). Many global models and             and two independent measurements of the aerosol size dis-
satellite retrieval algorithms assume atmospheric aerosol par-     tribution together with a retrieval algorithm and several the-
ticles are predominately spherical and calculate total aerosol     oretical scattering models to determine complex refractive
extinction using Mie theory with a small set of constant RIs       indices. We validate the retrieval algorithm with spherical,
for different aerosol types (Liao et al., 2003; Levy et al.,       monodisperse populations of polystyrene latex spheres and
2007; Omar et al., 2009; Lamarque et al., 2012). These RIs         polydisperse populations of ammonium sulfate. We analyze
are often determined experimentally at a few wavelengths           smoke from 13 fires at the Fire Sciences Laboratory, present
(Nakayama et al., 2010; Zhang et al., 2016) and extrapolated       detailed examples where the retrieval algorithm can and can-
to the full solar spectrum.                                        not be used to accurately characterize the complex refrac-
   Simple assumptions of sphericity and wavelength-                tive index, and discuss the implications for remote-sensing
independent RI are not accurate for biomass burning par-           retrievals.
ticles, which consist of BC with complex morphology
(Bond et al., 2013) and BrC with wavelength-dependent RIs
(Washenfelder et al., 2013; Flores et al., 2014b; Laskin et        2     Experimental
al., 2015; Bluvshtein et al., 2017). The fractal-like agglom-
                                                                   2.1    Overview of the Fire Sciences Laboratory 2016
erates of highly absorbing black carbon are known to be
                                                                          study
poorly represented as spheres (Forrest and Witten, 1979)
and are better described by more complex optical equations,        The Fire Influence on Regional and Global Environments
such as Rayleigh–Debye–Gans (Sorensen, 2001; Manfred et            Experiment (FIREX) 2016 study was conducted at the U.S.
al., 2018). Accurate measurements of the size distributions,       Forest Service’s Missoula Fire Sciences Laboratory dur-
morphology, and wavelength-dependent refractive indices of         ing October–November 2016 (Manfred et al., 2018; Se-
biomass burning aerosol are important to better model their        limovic et al., 2018). The Fire Science Laboratory contains
climate forcing.                                                   a ∼ 3400 m3 indoor combustion room for controlled burns
   One technique to measure wavelength-dependent RIs is            (McMeeking et al., 2009; Selimovic et al., 2018). The mea-
broadband cavity-enhanced spectroscopy (BBCES), which              surements reported here are for “room” burns, where in-
combines a broadband light source with highly reflective mir-      struments sampled well-mixed smoke from the combustion
rors to measure total light extinction by particles or gas-phase   room. First, dry fuels weighing 0.24–4.4 kg were placed on a
species at multiple wavelengths simultaneously (Fiedler et         ceramic fuel bed and ignited by a heating plate to produce a
al., 2003; Washenfelder et al., 2008; Varma et al., 2013; Zhao     small, controlled burn that lasted several minutes (Selimovic
et al., 2017). The absorption and scattering of an aerosol pop-    et al., 2018). The smoke became well-mixed in the com-
ulation can be determined by making multiple size-selected         bustion room within 15–20 min and persisted under steady-
measurements of extinction and using Mie theory to retrieve        state, low-light conditions for 3–4 h with minimal dilution
the RI (Washenfelder et al., 2013; Flores et al., 2014a; Zhao      and wall loss (Stockwell et al., 2014). Fuels were represen-
et al., 2017; He et al., 2018). This method has been used          tative of western US wildfires and included ponderosa pine
successfully for retrievals of RI in the near-ultraviolet at       (Pinus ponderosa), lodgepole pine (Pinus contorta), Douglas
360–420 nm using LEDs (Washenfelder et al., 2013; Flo-             fir (Pseudotsuga menziesii), Engelmann spruce (Picea engel-
res et al., 2014a) and for spectral regions as broad as 380–       mannii), subalpine fir (Abies lasiocarpa), manzanita (Arc-
650 nm using laser-driven arc lamps (He et al., 2018; Li et al.,   tostaphylos), chamise (Adenostoma fasciculatum), juniper
2020). Complex RIs have been reported for standard aerosol         (Juniperus), and sage (Artemisia) (Selimovic et al., 2018). A
samples, such as nigrosin and Suwannee River Fulvic Acid           shared aerosol inlet was connected to the combustion room,
(Washenfelder et al., 2013; Zhao et al., 2017), and for aged       and it provided flow to a size-selected inlet and the BBCES
organic aerosol (Flores et al., 2014a, b; He et al., 2018; Li      instrument, as described below.
et al., 2020). However, these measurements have all been
conducted with spherical, homogeneous particles generated
in laboratory or chamber experiments. This method has not
been previously demonstrated for measurements of com-

Atmos. Chem. Phys., 21, 7235–7252, 2021                                             https://doi.org/10.5194/acp-21-7235-2021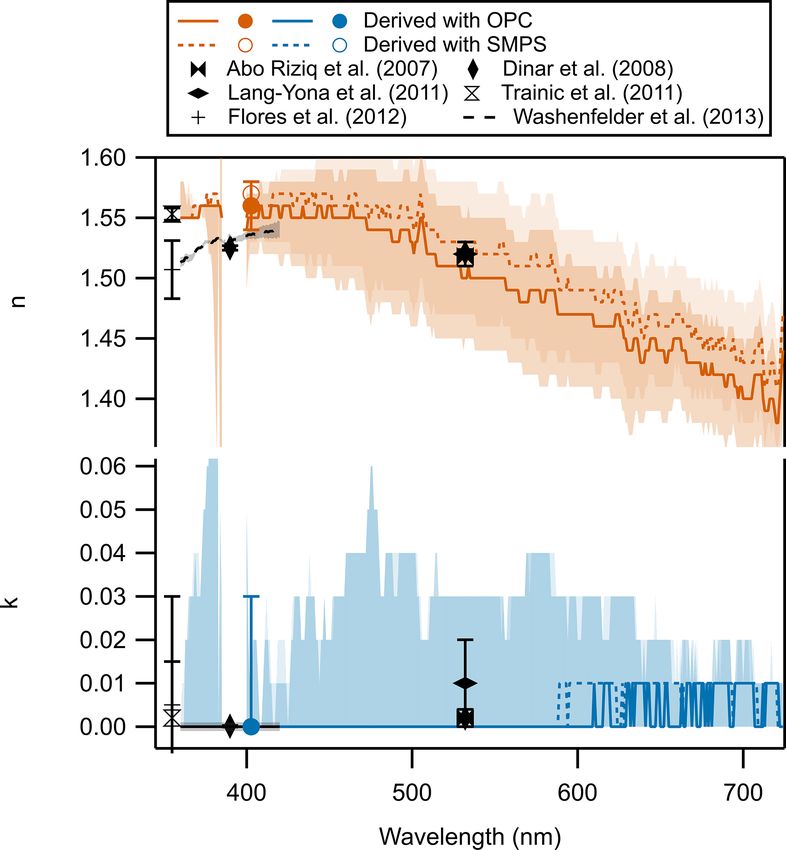
C. C. Womack et al.: Complex refractive indices for biomass burning aerosol                                                 7237

2.2   Broadband cavity-enhanced spectrometer for                  time was 0.57 s, and so a full spectrum was taken every
      aerosol extinction at 360–720 nm                            0.87 s. Narrow emission lines from a Hg lamp were mea-
                                                                  sured multiple times each day to determine the wavelength
The optical system shown in Fig. 1a is a modified version         calibration and spectral resolution (average full width at half-
of the two-channel instrument used previously to measure          maximum resolution of 1.4 nm between 360–720 nm).
broadband aerosol extinction at 355–420 nm with two LEDs
(Attwood et al., 2014; Washenfelder et al., 2015). The light      2.3     Cavity ring-down spectrometer for aerosol
source, optical filters, cavity mirrors, and spectrometer grat-           extinction at 403 nm
ing were replaced to measure aerosol extinction over a very
broadband region, covering 360–385 and 400–720 nm.                A cavity ring-down spectrometer (CRDS) at 403 nm pro-
   We used a single laser-driven white-light source (EQ-          vided an extinction measurement between the two BBCES
99FC LDLS; Energetiq, Woburn, MA, USA), containing a              channels at 360–385 and 400–720 nm and was used as an in-
continuous-wave laser at 974 nm that pumps a Xenon plasma         dependent validation of the BBCES extinction. The CRDS
and outputs a broad spectrum from 170–2100 nm (Islam              method has been described previously (Fuchs et al., 2009)
et al., 2013). The light source was temperature-controlled        and was not modified from Washenfelder et al. (2013).
to ∼ 20 ◦ C and purged with N2 to eliminate O3 produc-
tion (Washenfelder et al., 2016). The light was transmitted       2.4     Automated flow system
by fiber-optic to an off-axis parabola with a 0.36 numeri-
cal aperture (RC04SMA-F01; Thorlabs, Newton, MA, USA)             2.4.1    Aerosol size selection and size characterization
for collimation and coupling into the optical cavities. Two
colored glass filters (WG345 and WG320) were used to re-          The custom automated inlet for aerosol size selection is
move UV wavelengths shorter than 345 nm. A dichroic long-         shown in Fig. 1b. The materials and geometry of the flow
pass filter with a 400 nm cut point (69–897; Edmund Optics,       system were chosen to maximize particle transmission and
Barrington, NJ, USA) divided the light before it was pas-         minimize inertial losses. The BBCES provides a direct mea-
sively coupled to the two optical cavities. Additional colored    surement of wavelength-dependent aerosol extinction, but re-
glass filters and a custom interference filter (MLD Technolo-     trievals of complex RIs require extinction measurements of
gies LLC, Mountain View, CA, USA) eliminated out-of-band          two or more size-selected aerosol populations with consistent
wavelengths.                                                      composition (Washenfelder et al., 2013). Particle size selec-
   The optical cavities consisted of two pairs of 2.5 cm di-      tion was achieved with a custom-built differential mobility
ameter, 1 m radius of curvature plano-concave mirrors with        analyzer (DMA; now available from Brechtel Manufactur-
a high-reflectivity coating covering 360–385 nm (Advanced         ing Inc, Hayward, CA, USA (Knutson and Whitby, 1975)).
Thin Films, Boulder, CO, USA) and 400–720 nm (MLD                 In these experiments, the sample flow through the DMA was
Technologies LLC, Mountain View, CA, USA). The broad-             0.5 or 1 vlpm (volumetric L min−1 ), with a sheath : sample
band reflectivity of the visible mirrors was achieved with        flow ratio of 10 : 1 or 5 : 1.
multiple layers of thin film coatings applied by ion beam            As shown in Fig. 1b, the concentration and size distribu-
sputtering to the super-polished substrate. Although the vis-     tion of the size-selected aerosol were determined using two
ible mirrors span a very broad range with high reflectivity       separate methods. The first method was a condensation par-
(0.9993–0.9999), their losses vary strongly as a function of      ticle counter (CPC; 3022A, TSI Inc., Shoreview, MN, USA),
wavelength (Fig. S1) (He et al., 2018), due to the coating        which sampled at a flow rate of 0.3 vlpm and measured the
properties and possible contributions from surface rough-         total number of particles with a lower aerosol size cutoff of
ness, interface roughness, and internal defects. The mirrors      7 nm. At regular intervals, the DMA and CPC were operated
were mounted in stainless steel mounts, at either end of a        as a scanning mobility particle sizer (SMPS) to determine
101.5 cm long aluminum flow cell (2.21 cm i.d.) with inlets       the aerosol size distribution by scanning the DMA column
for the aerosol flow and mirror purge flows. The broadband        voltage up and then down between 0–5000 V over 240 s and
light exiting each cavity was collected by an F/3.1 lens, cou-    applying an inversion algorithm (Twomey, 1975; Markowski,
pled to a bifurcated fiber-optic bundle, and imaged linearly      1987). An instrument transfer function was then used to cal-
onto the entrance slit of a grating spectrometer (IsoPlane-       culate the particle size distribution for each DMA set point.
160; Princeton Instruments, Trenton, NJ, USA). The spec-          The inversion algorithm for the SMPS size distribution is
trometer contained a 300 grooves mm−1 grating with 300 nm         most accurate for spherical aerosol with well-known mobil-
blaze (centered at 507 nm with 290–724 nm bandwidth) and a        ity diameters. The second measurement of the particle size
16-bit back-illuminated 2048 × 512 pixel charge-coupled de-       distribution was made using an optical particle counter. The
vice (CCD) detector (PIXIS 2kBUV; Princeton Instruments,          optical particle counter (OPC) used here was a laser aerosol
Trenton, NJ, USA). During data acquisition, individual spec-      spectrometer (LAS 3340, TSI Inc., Shoreview, MN, USA),
tra were acquired with 0.3 s integration time using the physi-    which detects light scattered by individual particles inter-
cal shutter of the IsoPlane spectrometer. The CCD readout         cepting a 633 nm laser beam and reports the signal for each

https://doi.org/10.5194/acp-21-7235-2021                                           Atmos. Chem. Phys., 21, 7235–7252, 2021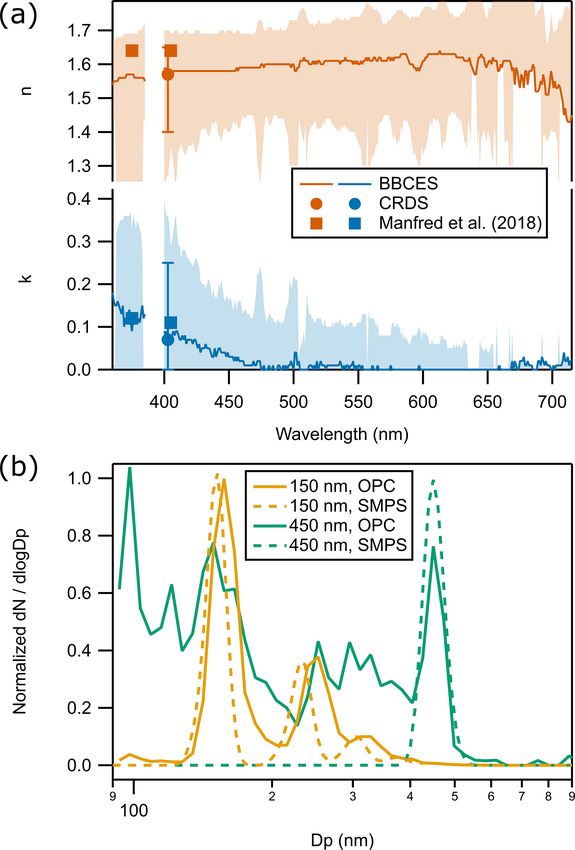
7238                                              C. C. Womack et al.: Complex refractive indices for biomass burning aerosol

Figure 1. A schematic of the BBCES instrument and inlet at the Fire Sciences Laboratory. (a) The optical components of the BBCES
instrument include a laser-driven arc lamp, off-axis parabola, colored glass filters, dichroic beam splitter, two BBCES cavities, and a grating
spectrometer. (b) The automated flow system developed for the Fire Sciences Laboratory. Aerosol is size-selected by a DMA, with the
number concentration continuously measured by a CPC and the size distribution periodically measured by an OPC. The flow is evenly
divided between the two BBCES channels and the CRDS channel. An automated two-position valve allows flow to be directed through a
filter to measure particle-free air, and a second two-position valve allows the introduction of calibration gases. (c) The common inlet shared
by multiple aerosol instruments at the Fire Sciences Laboratory, including the SP2 and the AMS. Smoke was sampled at 2 vlpm through an
impactor (1 µm cut-point), silica gel dryer, and NOy scrubber before traveling through a bypass channel or thermodenuder. A two-way valve
alternately directed fresh and denuded aerosol to the BBCES and CRDS at 10 min intervals.

particle in 100 logarithmically spaced diameter bins. A to-               7.7 mm i.d. for CRDS), and all tubing between the DMA and
tal flow of 0.06 vlpm was used. During laboratory tests after             the optical cavities was made of stainless steel or flexible sil-
the field campaign, we used a similar optical particle counter            icone tubing to minimize electrostatic particle losses. To pro-
with a 1054 nm laser (UHSAS, Droplet Measurement Tech-                    tect mirror cleanliness, particle-free zero air flowed over each
nologies, Longmont, CO, USA) because the LAS 3340 was                     cavity mirror at a rate of 55–80 sccm.
not available. Optical particle counters are designed to mea-                 Two automated two-position valves (MDM-060DT-3;
sure scattering, and the mathematical interpretation of the               Hanbay Inc, Pointe-Claire, Quebec, Canada) allowed addi-
signal for highly absorbing biomass burning aerosols is de-               tional calibrations and zeros. The first two-position valve
scribed in detail in Sect. 3.                                             rotated to direct the sample flow through an aerosol fil-
                                                                          ter, providing an aerosol-free reference measurement for the
2.4.2   BBCES and CRDS flow system                                        BBCES and CRDS cavities. The second two-position valve
                                                                          allowed pure gases to be introduced for periodic measure-
As shown in Fig. 1b, the size-selected aerosol flow was                   ments. As shown in Fig. 1b, gas cylinders of He, CO2 , zero
diluted with 5.0 slpm (standard liters per minute) of dry,                air (Norco, Inc., Missoula, MT, USA), and NO2 in N2 (Scott-
particle-free zero air after exiting the DMA. The resulting               Marrin, Inc., Riverside, CA, USA) were connected to auto-
6.0 slpm of diluted sample flow was directed to the BBCES                 mated valves and a mass flow controller (MFC). Pure CO2
and CRDS channels (2.0 slpm per channel). Each cavity was                 and He were used to characterize the mirror reflectivity by
constructed of aluminum tubing (22.1 mm i.d. for BBCES,                   filling the cavities and purge volumes with each gas for 1.5

Atmos. Chem. Phys., 21, 7235–7252, 2021                                                      https://doi.org/10.5194/acp-21-7235-2021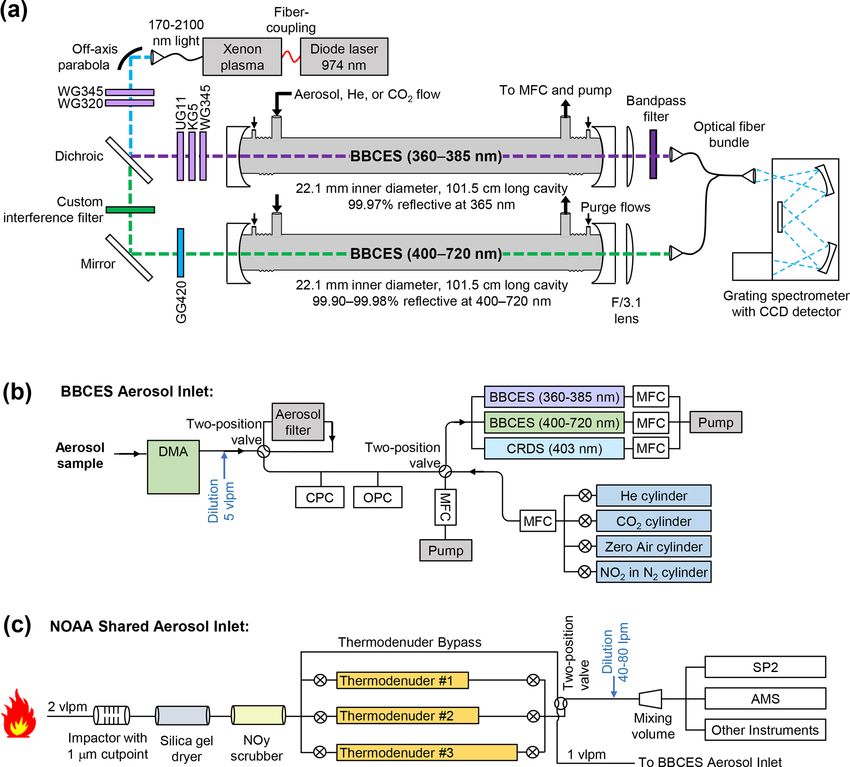
C. C. Womack et al.: Complex refractive indices for biomass burning aerosol                                                 7239

min at intervals of ∼ 1 h. Pure zero air provided an aerosol-     2.6   Black carbon and organic aerosol measurements
free extinction measurement, similar to the filter method de-
scribed above. The cylinder containing ∼ 3 ppmv NO2 in            Additional instruments sampled from the shared aerosol in-
N2 provided additions of 0–72 ppbv NO2 for flows of 0–            let’s mixing volume, shown in Fig. 1c, and those data were
100 sccm. Due to known discrepancies between the reported         used to assess the fraction of black carbon in the total aerosol
and actual concentrations of NO2 calibration tanks (Chilton       mass loading of smoke from each fire. A single-particle
et al., 2005), this method was not used as a calibration but      soot photometer (SP2; Droplet Measurement Technologies,
rather as an assessment of long-term stability of the instru-     Longmont, CO, USA) measured the concentration of re-
ment with respect to the NO2 spectral features. When the          fractory black carbon aerosol, rBC (Schwarz et al., 2006,
two-position valve was rotated for overflow of calibrant gas,     2008). The rBC mass concentration was only retrieved in the
the inlet sample flow and pressure were maintained using an       mass range corresponding to particles with a volume equiv-
MFC and pump to minimize disturbances to the DMA and              alent diameter of 90–550 nm, assuming a void-free density
other instruments.                                                of 1.8 g cm−3 . This range typically covers 90 % or more of
                                                                  the accumulation-mode rBC emitted from wildfires. Refrac-
2.5   Shared aerosol inlet                                        tory black carbon has been shown to be experimentally con-
                                                                  sistent with elemental carbon measured after a thermal de-
The flow to the BBCES and CRDS channels was provided by           nuder within 15 % (Kondo et al., 2011). The uncertainty of
a shared aerosol inlet, shown in Fig. 1c. The shared aerosol      the black carbon mass at this concentration is 30 %. A com-
inlet consisted of ∼ 30 m of 6.4 mm o.d. copper tubing con-       pact time-of-flight aerosol mass spectrometer (c-TOF AMS;
nected to an inertial impactor with 50 % cut point at an aero-    Aerodyne Research Inc., Billerica, MA, USA) measured or-
dynamic diameter of 1.0 µm (TE296, Tisch Environmental,           ganic aerosol (OA) mass (Bahreini et al., 2008, 2009). The
Cleves, OH), a silica gel dryer, an activated carbon denuder      uncertainty of the OA mass is typically ∼ 38 % due to stan-
to remove NOy and O3 (Washenfelder et al., 2015), and             dard uncertainties in AMS measurements (Bahreini et al.,
three available thermodenuders. The 2.0 volumetric L min−1        2009) but was greater for biomass burning aerosol at the
(vlpm) flow from the burn room was evenly split between           Fire Sciences Laboratory because of additional variability in
one of the thermodenuders and a bypass channel. An auto-          aerosol volatility due to dilution of the dense smoke. There-
mated two-position valve (Hanbay Inc, Pointe-Claire, Que-         fore, we use relative AMS masses in this analysis.
bec, Canada) alternately directed 1.0 vlpm of thermodenuded
and 1.0 vlpm of fresh smoke to the BBCES aerosol inlet and        2.7   BBCES instrument operation at the Fire Sciences
to a mixing volume with dilution for a collection of other              Laboratory
aerosol instruments (Manfred et al., 2018; Adler et al., 2019).
The DMA, valves, MFCs, and all other components shown             Each measurement day at the Fire Sciences Laboratory in-
in Fig. 1 were controlled by custom LabVIEW software and          cluded two controlled burns, with 3–4 h of sampling of each
synchronized to the timing of the two-position valve shown        burn. The instruments and inlet components were turned on
in Fig. 1c as part of the NOAA shared aerosol inlet.              at least 1 h prior to the first burn. Each sample cycle required
   The inlet apparatus included three separate thermodenud-       30 min and began with measurements of CO2 and He to de-
ers to enable comparison between different temperatures, but      termine the BBCES mirror reflectivity, followed by measure-
this paper reports data from only one. This denuder con-          ment of the dark noise of the CCD detector with the physi-
sisted of an 80 cm screen tube (1.3 cm i.d.) wrapped in ac-       cal shutter closed. During these BBCES calibrations, the size
tivated charcoal fabric to remove volatilized organic com-        distribution of the aerosol sample was measured by SMPS.
ponents. The first 40 cm was heated to 250 ◦ C, and the re-       Next, the BBCES and CRDS measured fresh and denuded
maining 40 cm served as a cool-down region. With a flow           (250 ◦ C) aerosol with mobility diameters (Dp ) of 150, 225,
rate of 1.0 vlpm, the calculated residence time was 3.2 s and     300, 375, and 450 nm for 2 min each (20 min total). The
Reynolds number was 114. The denuders were similar to             aerosol mass loading was very high in the burn room (typ-
the design of Huffman et al. (2008), with the major differ-       ically ∼ 1 g m−3 ) but was reduced by a factor of ∼ 100 by
ence that the heated section had charcoal fabric to absorb the    the DMA and the dilution flows prior to measurement by the
volatilized species. The throughput efficiency was found to       BBCES. Therefore the 2 min averaging time ensured suffi-
be less than unity (86 ± 4 % for particles between 100 and        cient precision in the spectra and the particle counting, par-
300 nm) due to thermophoretic wall losses, but the analysis       ticularly at the larger diameter set points. These DMA di-
of the aerosol size-independent RI, which is an intrinsic prop-   ameter set points were chosen to span the observed aerosol
erty of the aerosol (Moise et al., 2015), is largely unaffected   size distribution of the smoke. Filtered sample air was mea-
by these losses. We therefore do not make any corrections to      sured before and after each set of five measurements. The five
these data.                                                       mobility diameter measurements allowed RI to be retrieved
                                                                  once every 10 min, alternating between fresh and denuded
                                                                  biomass burning smoke. Between the two daily fires, NO2

https://doi.org/10.5194/acp-21-7235-2021                                           Atmos. Chem. Phys., 21, 7235–7252, 2021
7240                                                C. C. Womack et al.: Complex refractive indices for biomass burning aerosol

additions were made to assess the spectrometer stability. The            very high. We selected CO2 as a stable, inexpensive, non-
spectrometer wavelength and resolution were calibrated with              toxic gas with a large Rayleigh scattering cross section. The
the output of a Hg lamp before the first burn, between the               Rayleigh scattering cross section of CO2 has been reported
first and second burns, and after the second burn.                       (Shardanand and Rao, 1977; Sneep and Ubachs, 2005; He et
   After the FIREX 2016 study, the BBCES extinction mea-                 al., 2018), but it is not as well-known as N2 or O2 . We de-
surements and complex RI retrievals were validated us-                   termined it here by introducing mixtures of CO2 in He to the
ing standard samples of polystyrene latex spheres (PSLs;                 BBCES instrument, measuring the extinction spectrum for
Nanosphere size standards, Thermo Fisher Scientific Inc.,                each addition, and deriving the slope of the linear fit of the
Waltham, MA, USA) and ammonium sulfate (Sigma                            extinction relative to the CO2 number density.
Aldrich, St. Louis, MO, USA). For these measurements, the
aerosols were generated using a custom-built atomizer, and               3.2   Correction of optical extinction for optical intensity
dilution make-up flow was provided by scrubbed and dried                       and spectral drift
air from a compressor. Five or six aerosol sizes were selected,
spanning a similar range to those sampled during FIREX.                  Spectral fitting of trace gas absorbers in BBCES extinction
The sampling scheme shown in Fig. 1a and b remained the                  spectra often includes a fourth-order polynomial to account
same, but the shared inlet shown in Fig. 1c was not used.                for drifts in the cavity, spectrometer, and light source inten-
Particle-free air and mirror reflectivity measurements were              sity (Platt et al., 2009; Thalman and Volkamer, 2010; Min et
performed before and after each set of aerosol sizes.                    al., 2016). While this can be effective for trace gases with
                                                                         highly structured absorbing features measured using mirrors
                                                                         with smoothly varying reflectivity, it is not appropriate for
3     Data analysis                                                      smoothly varying aerosol extinction spectra or for cavity mir-
                                                                         rors with reflectivity that varies strongly with wavelength
3.1    Determination of aerosol optical extinction and
                                                                         (see Fig. S1). Here, we describe a new method to explicitly
       mirror reflectivity
                                                                         account for drifts in the cavity, spectrometer, and light source
The aerosol optical extinction, α(λ), can be determined from             intensity that affected the calculated α(λ) extinction for the
the observed change in light intensity in the cavity according           visible channel.
to                                                                          We determined that each measured spectrum may be af-
                                                                     fected by drift in the light source intensity, drift in the
                 1 − R(λ)                      IZA (λ) − I (λ)           spectrometer dark current background counts, and a wave-
α (λ) = dL                + αRayleigh,ZA (λ)                     , (1)
                     d                              I (λ)                length shift incurred by the temperature-dependent drifts in
                                                                         the spectrometer optics and that these can each be repre-
where λ is wavelength, dL is the ratio of the physical cell              sented by a scalar parameter. Using a nonlinear Levenberg–
length to the sample cell length, R(λ) is the measured mir-              Marquardt least-squares fitting algorithm, the scalar parame-
ror reflectivity, d is the physical cell length, αRayleigh,ZA (λ)        ters for these different types of drift were fitted and the drifts
is the Rayleigh scattering of zero air, IZA (λ) is the reference         removed. The fitting algorithm was tested successfully on
intensity spectrum, and I (λ) is the measured intensity spec-            spectra of zero air and found to remove nearly all the struc-
trum (Washenfelder et al., 2013). The extinction cross sec-              ture due to intensity and spectrometer drift. This correction
tion, σ (λ), is defined as the optical extinction divided by the         was subsequently used on all extinction spectra. Further de-
total number concentration of aerosol particles, N , for the             tails for this correction can be found in the Supplement and
given size distribution:                                                 in Fig. S2.
          α(λ)
σ (λ) =        .                                                  (2)    3.3   Complex refractive index retrieval
           N
   The most common method for determining R(λ) in Eq. (1)                The aerosol optical extinction derived in Eq. (1) depends on
is through extinction measurements of two gases with known               wavelength, aerosol size distribution, and the RI. Measure-
Rayleigh scattering cross sections, typically He and N2 or               ments of aerosol optical extinction for different size selec-
zero air (Washenfelder et al., 2008). Previous BBCES appli-              tions can be used to retrieve n(λ) and k(λ) (Washenfelder
cations in the UV wavelength region often used He and N2 ,               et al., 2013; Flores et al., 2014a; He et al., 2018) with as-
which have substantially different cross sections (Washen-               sumptions that the aerosol population is internally and ex-
felder et al., 2013; Flores et al., 2014a; Bluvshtein et al.,            ternally well-mixed and that the refractive index does not
2017; Zhao et al., 2017). However, Rayleigh scattering is                vary systematically with size. For PSL and ammonium sul-
proportional to λ−4 , and more accurate characterizations of             fate aerosol, this approach was used as described previously
mirror reflectivity at visible wavelengths can be achieved by            (Washenfelder et al., 2013; Flores et al., 2014a). Each 2 min
using a gas with a larger Rayleigh scattering cross section              group of spectra for a single aerosol population was averaged
than N2 or O2 , particularly when the mirror reflectivity is not         to determine I (λ). The aerosol extinction cross section, σ (λ),

Atmos. Chem. Phys., 21, 7235–7252, 2021                                                    https://doi.org/10.5194/acp-21-7235-2021
C. C. Womack et al.: Complex refractive indices for biomass burning aerosol 7241
was then calculated using Eqs. (1) and (2), with values of to yield accurate size distributions, as the contribution of
IZA (λ) and R(λ) linearly interpolated from the nearest mea- multiply charged particles is straightforward to calculate for
surements. The set of aerosol extinction cross section spectra spherical particles with well-known mobility diameters. If
(σDp =150 nm (λ), σDp =225 nm (λ), . . . ) and the average aerosol the aerosol is significantly non-spherical, such as fractal BC
size distribution N (Dp ) for each time interval can then be expected from some biomass burning smoke, then the trans-
used to retrieve the complex refractive index, n(λ) + ki(λ) mission through the DMA is affected by the aerodynamic
using a scattering theory. resistance of the sheath flow (Adler et al., 2019), the contri-
We use a retrieval algorithm that calculates the expected bution of multiply charged particles is difficult to ascertain,
extinction cross section for a given wavelength, a given RI, and the resulting size-selected aerosol may not match the ac-
and the measured N (Dp ) and compares it to the measured tual particle size. We therefore do not attempt any correction
extinction cross section. Since the RI consists of both n and k, to the SMPS scans for BC aerosol; the inverted size distribu-
at least two extinction measurements are required to retrieve tions represent electrical mobility diameter rather than geo-
these two parameters (Bluvshtein et al., 2012). We use five metric diameter.
diameter set points to increase the accuracy of the retrieval. An alternate aerosol sizing instrument is the OPC, which
A least-squares minimization fit is used to identify the n and sizes particles by measuring the light scattered into a wide-
k values that minimize χ 2 for each wavelength: angle lens or mirror mounted perpendicularly to the direction
χ 2 (λ) = of laser propagation. The integrated side-scattering intensity
!2 increases monotonically with particle size for non-absorbing
XN=5 σcalculated n, k, λ, Dp − σmeasured (λ, Dp ) particles. However, a theoretical correction must be made for
Dp
, (3)
σmeasured (λ, Dp ) slightly or highly absorbing particles. By calculating the scat-
where σ represents the extinction cross section from Eq. (2). tered light expected as a function of angle, using either Mie
Previous work has assumed spherical aerosol populations or RDG theory (see Sect. 3.3.2), one can integrate over the
that are well-represented by Mie theory and have easily mea- solid angle of the LAS measurement optics to get a corrected
sured size distributions (Washenfelder et al., 2013; Flores et LAS size distribution. We discuss this correction further in
al., 2014a; He et al., 2018). The biomass burning aerosol pro- Sect. 4.6.
duced from some of the fires at the Fire Sciences Laboratory Theoretical particle losses between the DMA and the
was fractal and strongly absorbing. This required two im- BBCES instrument were calculated (von der Weiden et al.,
provements to the retrieval algorithms, described further be- 2009) as a function of particle diameter and were accounted
low: (1) the incorporation of two methods for size distribu- for in the size distribution calculations. These losses were
tion measurements (the OPC and the SMPS) to better char- generally small, with fewer than 1 % loss in the relevant par-
acterize N (Dp ) and (2) the incorporation of two scattering ticle diameter range of 100–800 nm for this analysis.
theories, Mie and Rayleigh–Debye–Gans (RDG), to repre-
sent both spherical and fractal aerosol. 3.3.2 Mie theory and Rayleigh–Debye–Gans theory
3.3.1 Treatment of the aerosol size distribution Two theories are used in this paper to characterize the optical
properties of the measured aerosol. Mie theory is a solution
The DMA transmits ionized particles of a specified mobility- to Maxwell’s equations that describes the interaction of light
to-charge ratio, resulting in a small number of doubly and with homogeneous, spherical particles when the diameter of
triply charged particles that appear as particles with mobil- the sphere is similar to the wavelength of light (Bohren and
ity diameters approximately 2 and 3 times greater than ex- Huffman, 1983). It is a truncated infinite series representing
pected. The relative contribution of the singly, doubly, and the electromagnetic field scattered from spheres. For the rep-
triply charged particles to the total size distribution depends resentation used in this work, the theory is valid when the di-
on the ambient aerosol size distribution as well as the ratio mensionless size parameter (x = π d/λ) is approximately 1.
of sheath flow to aerosol flow in the DMA. To determine the We adapted the Fortran code presented in Bohren and Huff-
aerosol size distribution, we iteratively adjusted an assumed man (1983) for use in Igor Pro (Igor Pro; WaveMetrics, Inc.,
input size distribution transmitted through the DMA trans- Lake Oswego, OR, USA). The code calculates light scat-
fer function until the theoretical particle concentration pro- tering and absorption for homogeneous spheres or homoge-
duced by the inversion matched that measured by the CPC neous spheres with a concentric coating.
(Twomey, 1975; Markowski, 1987). Once the input size dis- Rayleigh–Debye–Gans theory has often been applied to
tribution was determined, the DMA transfer function was calculate the interaction of light with fractal aggregates from
used to estimate the size distribution of the aerosol exiting biomass burning (Sorensen, 2001). Spherical approximations
the DMA as the voltage was changed to select different peak and Mie theory are poor representations of these particles,
diameters. and more detailed models such as the discrete dipole ap-
For spherical, non-absorbing particles, such as ammonium proximation are very computationally expensive. RDG the-
sulfate aerosol, we expect the SMPS scans and inversions ory divides a particle into small-volume elements, which are
https://doi.org/10.5194/acp-21-7235-2021 Atmos. Chem. Phys., 21, 7235–7252, 20217242 C. C. Womack et al.: Complex refractive indices for biomass burning aerosol
each treated as independent Rayleigh scatterers. Fractal ag- 4 Results and discussion
gregates can be represented by the relatively simple parame-
terization We present the results of measurements taken during and af-
Df ter the FIREX 2016 deployment. First, the measurement of
Rg the CO2 Rayleigh scattering cross section between 360 and
N = k0 , (4)
a 720 nm is presented, along with the measurement of daily ad-
where N is the number of monomer spherules per aggregate, ditions of known concentrations of NO2 throughout the dura-
k0 is the fractal prefactor, Rg is the radius of gyration, a is the tion of the Fire Sciences Laboratory experiments, to ascertain
monomer radius, and Df is the fractal dimension (Sorensen, the long-term stability and accuracy of the BBCES extinc-
2001; Smith and Grainger, 2014). The theory is valid when tion cross section measurements. Next, we present retrievals
the relative refractive index and the dimensionless size pa- of the RI of known laboratory standards – PSL and ammo-
rameter of the monomer can be described as |n − 1|C. C. Womack et al.: Complex refractive indices for biomass burning aerosol 7243
conversion of NO2 , as the BBCES is designed to minimize
particle losses, not NO2 conversion on surfaces. It is also
possible that the NO2 calibration tank concentration changes
over time, as the output of these tanks is known to deviate
significantly from the manufacturer’s specified concentration
(Chilton et al., 2005). The two fires examined in this paper
– Fires A and B – occurred on 31 October and 1 Novem-
ber 2016, and Fig. S3 shows agreement of ±7 % with the
nominal NO2 concentration on those 2 d.
4.3 Refractive index retrieval for PSL
We atomized five aqueous solutions of monodisperse PSL
with diameters from 150 to 400 nm and passed the result-
ing aerosol flow through a DMA to remove any clumped
particles or small spheres of surfactant (Miles et al., 2010;
Thalman and Volkamer, 2010). The size-selected aerosol was
monitored by a UHSAS OPC and found to be consistent
within uncertainty with the manufacturer-specified mode di-
ameter and Gaussian distribution. SMPS-derived size distri-
butions of PSL were not measured, due to their narrow di-
Figure 2. The measured Rayleigh scattering cross section of CO2 . ameter distribution. The intensity spectra and size distribu-
The red solid line and filled diamond show the measurement by tions were averaged for approximately 90 s at each diameter
BBCES and CRDS, respectively, with the black dashed line show- set point, and extinction cross sections were derived using
ing the power law fit to the measured data. Several other literature Eqs. (1) and (2), as described in Sect. 4.1 and 4.2. To min-
parameterizations are shown as solid colored lines and discussed imize errors due to changes in the light source and optical
further in the text. The ratio of each trace relative to the power law stability, we measured the mirror reflectivity before and after
fit derived here is shown at the bottom, and all are within 10 % of
each PSL diameter set point, in addition to using the fitting
the fit derived here. The small peaks and valleys observed in the
experimental fit are due to imperfect subtraction of peaks from O2
algorithm described in Sects. 3.2 and S1.
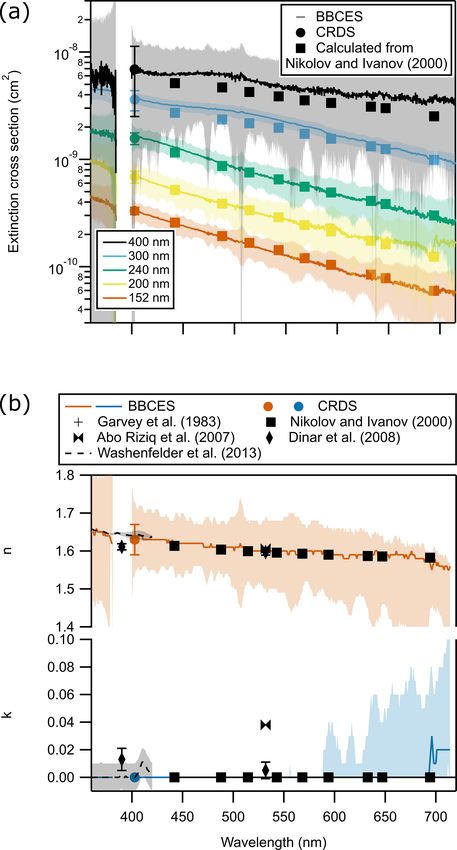
and the O4 oxygen dimer. The resulting extinction cross sections for the five PSL
diameters are shown in Fig. 3a. Calculated extinction cross
sections from the measured OPC size distribution and the
is greater. We use the power law parameterization of CO2 RI reported by Nikolov and Ivanov (2000) are also shown,
Rayleigh scattering cross section for the retrievals described and these agree with our measured extinction cross sections
below. within the instrument uncertainty. The largest error bars ap-
pear in the Dp = 400 nm extinction cross section. It was dif-
4.2 Standard additions of NO2 ficult to produce PSL solutions with sufficiently high con-
centrations at the larger diameters, and the extinction cross
To assess the long-term stability of the instrument, we in- section, which is the total extinction divided by the total par-
troduced concentrations of NO2 during each of the 16 mea- ticle counts, is therefore highly sensitive to the accuracy of
surement days at the Fire Sciences Laboratory, using the flow the particle counting. To reduce error in the RI retrieval, we
system shown in Fig. 1b. Each set of additions included four exclude the 400 nm spectrum from the RI retrieval.
NO2 concentrations from 0 to 72 ppbv. Measured NO2 num- The retrieved RI is shown in Fig. 3b. We find that n
ber densities were retrieved by fitting the NO2 absorption varies from 1.65 to 1.57 between 360 and 700 nm, while
cross section (Vandaele et al., 1998) to the extinction, α(λ), k = 0 throughout, as expected for purely scattering particles.
with shift and stretch of the literature spectrum to account We empirically fit n to a third-order polynomial function
for discrepancies in the BBCES wavelength calibration (Min of wavelength as n = 2.30 − 0.0035 × λ + (6.05 × 10⁻⁶ ) ×
et al., 2016). A small amount of HONO was observed in the λ2 − (3.62 × 10⁻⁶ ) × λ3 across the measured spectral range.
UV channel, but it has distinct spectral peaks and did not in- Nikolov and Ivanov (2000) measured the RI of PSL spheres
terfere with the NO2 fits. The measured NO2 concentrations using a direct scattering photodetector and found a gradual
are compared to the nominal concentrations determined by decrease from 1.62 + 0.00i to 1.59 + 0.00i over the wave-
the flow rates and shown in Fig. S3. The r 2 values are greater length region 450 to 700 nm, as shown in Fig. 3b. Several
than 0.99 and the slopes vary from 0.8–1, with a slight down- other recent experimental studies (Garvey and Pinnick, 1983;
ward drift in both parameters over time. This could be due to Abo Riziq et al., 2007; Dinar et al., 2008; Washenfelder et al.,
https://doi.org/10.5194/acp-21-7235-2021 Atmos. Chem. Phys., 21, 7235–7252, 20217244 C. C. Womack et al.: Complex refractive indices for biomass burning aerosol
Figure 4. The RI retrieved for dry ammonium sulfate aerosol, using
two particle size distribution methods: an OPC (LAS 3340) and a
DMA operating in SMPS mode. Both retrievals agree well with lit-
erature values for ammonium sulfate between 350 and 550 nm. As
in Fig. 3, the RI is retrieved to the nearest 0.01, and an absence of
a visible error bar implies that the calculated error is smaller than
0.01.
2013) at 390 and 532 nm are also shown and agree well with
our results.
4.4 Refractive index retrieval for ammonium sulfate
Figure 4 shows the retrieved RI for ammonium sulfate
aerosol, using the two different size distribution methods.
Ammonium sulfate particles were atomized from a 6.0 g L−1
aqueous solution of ammonium sulfate in distilled water and
then dried to less than 5 % RH to minimize the water content.
Extinction cross sections were determined at diameter set
Figure 3. (a) Measured extinction cross sections for five diameters
points from 150–450 in 75 nm increments. The aerosol size
of PSLs are shown as solid lines, with 2σ error bars designated
by shaded regions. The theoretical extinction cross section calcu-
distribution was measured continuously after the DMA by
lated from the RI of Nikolov and Ivanov (2000) and the measured a UHSAS OPC, which was independently calibrated for am-
aerosol size distribution is shown as filled squares for each diame- monium sulfate particles prior to the experiment (Kupc et al.,
ter set point. (b) The retrieved RI of PSL spheres derived from the 2018). Additionally, SMPS scans were taken before and after
measurement in (a) and the size distribution measured by the OPC. each set of aerosol diameter set points, and an inversion al-
The RI is retrieved to the nearest 0.01, and the absence of a visible gorithm was used to derive the full size distribution of the at-
upper or lower error bar implies that the calculated error is less than omized aerosol entering the DMA. Spurious peaks in the size
0.01. The RIs retrieved by Nikolov and Ivanov (2000) are shown distribution at diameters greater than 750 nm were removed.
as black squares. The error increases at longer wavelengths due to Section S2 describes this correction further. The DMA trans-
increased uncertainty in the CO2 Rayleigh scattering spectrum. fer function was then used to determine the aerosol size dis-
tribution at each diameter set point.
Atmos. Chem. Phys., 21, 7235–7252, 2021 https://doi.org/10.5194/acp-21-7235-2021C. C. Womack et al.: Complex refractive indices for biomass burning aerosol 7245
The RI values in Fig. 4 range from 1.55 + 0.00i at 360 nm
to 1.40 + 0.01i at 720 nm, though the error bars for the imag-
inary component span 0i and thus cannot be distinguished
from a non-absorbing aerosol. The results from the two size
distribution methods agree well, indicating that the SMPS
size distribution is an accurate assessment of the aerosol
population. We empirically fit the n derived by OPC as a
third-order polynomial function of wavelength as n = 0.69+
0.0052 × λ − (9.85 × 10⁻⁶ ) × λ2 + (5.51 × 10⁻⁶ ) × λ3 across
the entire spectral range. Recent literature values measured
by CRDS at 355, 390, 405, and 532 nm are shown and sum-
marized in Washenfelder et al. (2013). Few measurements
of ammonium sulfate RI have been reported at wavelengths
greater than 532 nm. The calculated uncertainty is higher
at longer wavelengths due to increased uncertainty in the
Rayleigh scattering at those wavelengths.
4.5 Refractive index retrieval for aerosol dominated by
brown carbon (Fire A)
Fire A (no. 086) was a lodgepole pine (Pinus contorta) fire,
with a mixture of small logs, litter duff, and canopy branches
with low moisture content, intended to be representative of
wildfire fuel composition. The smoke was dominated by BrC
with a small contribution from fractal soot-like particles, as
shown by the large decrease in number and mode volume
when the aerosol was thermodenuded (Manfred et al., 2018).
This implies that the majority of the particles consisted of
volatile organic matter that was efficiently vaporized in the
thermodenuder. We assume that the volatile organic matter
has spherical or near-spherical morphology that can be rep- Figure 5. (a) Retrieved RI of undenuded smoke during Fire A, a
resented using Mie theory. primarily brown carbon fire. The BBCES and CRDS retrievals are
The retrieved RI values for undenuded aerosol measured shown as solid lines and circular markers and are calculated to the
1 h after fire ignition are shown in Fig. 5a for one 10 min mea- nearest 0.01. The squares indicate the assumed RI in Manfred et
surement cycle. Both SMPS and OPC size distributions were al. (2018) for this fire. The increase in k with decreasing wave-
available for this set of extinction cross sections, and two di- length is characteristic of brown carbon aerosol. (b) The normal-
ized size distribution of the aerosol from the OPC and the SMPS
ameters are displayed in Fig. 5b. However, there are some
for two size set points: 150 and 450 nm. The 150 nm OPC measure-
differences between the two size distribution measurements. ment has a small peak near 100 nm but otherwise shows reasonable
First, as in the ammonium sulfate retrieval in Sect. 4.4, the agreement with the SMPS, while the 450 nm set point OPC distri-
SMPS inverted full size distribution has some spurious val- bution shows that a significant fraction of the aerosol is smaller than
ues at diameters above 550 nm which are not observed in the 450 nm, which is not reflected in the SMPS estimate. The other size
OPC and which skew the size distributions to higher diame- set points lie in between these two extremes.
ters. Therefore, we again apply an upper diameter threshold,
above which the SMPS size distributions are set to zero. Sec-
ond, the OPC size distribution for every diameter set point fore, we must explicitly include these small particles as part
shows a small peak near 100 nm. That these small particles of the size distribution.
passed through the DMA at larger diameter set points sug- Finally, it can be seen in Fig. 5b that the main mode di-
gests that they are small fractal particles, which were selected ameter for each set point is approximately 5 % higher in the
by the DMA due to their relatively large aerodynamic diam- OPC than the intended set point, as indicated by the mode
eter. Scanning electron microscopy images from the denuded diameter in the SMPS. The LAS OPC is calibrated for am-
channel for this fire confirm the presence of small fractal par- monium sulfate particles, assuming an RI of 1.52 + 0.00i.
ticles (Manfred et al., 2018). These particles are quite small If these brown carbon particles scatter light more effectively
and therefore do not contribute much to the total aerosol ex- than ammonium sulfate particles, then the OPC will inter-
tinction, but for the larger diameter set points they comprise a pret this increased light scattering as a larger particle. This
significant percentage of the total number of particles. There- also holds true for the small ∼ 100 nm peaks, which likely
https://doi.org/10.5194/acp-21-7235-2021 Atmos. Chem. Phys., 21, 7235–7252, 20217246 C. C. Womack et al.: Complex refractive indices for biomass burning aerosol
consist of BC particles with an RI very different from that certain solid angle range, which is later attributed to a certain
of ammonium sulfate. Therefore, the sizing of these particles particle diameter. Only purely scattering and very slightly ab-
by the OPC may be somewhat incorrect. sorbing particles display monotonically increasing scattering
Despite these caveats, we use the LAS size distribu- as a function of increasing particle diameter. Highly or mod-
tion without further modification for the RI retrieval in erately absorbing particles tend to side-scatter significantly
Fig. 5a. We find that the real component of the retrieved less than scattering particles to the angles the LAS is most
RI varies from 1.55 to 1.60, while the imaginary compo- sensitive to, and the scattering often non-monotonically in-
nent steadily increases from ∼ 0i to 0.25i as the wavelength creases as particle size increases (Szymanski et al., 2009).
decreases from 550–360 nm. This is highly characteristic of Therefore, a large diameter range of absorbing particles has
BrC aerosol and consistent with previous estimates of the similar scattering properties and cannot be distinguished,
complex refractive index of fresh biomass burning aerosol as illustrated in Fig. S5. However, we can make an adjust-
summarized in Bluvshtein et al. (2017). Furthermore, these ment to the measured OPC size distributions. As described
observations differ significantly from the measured RI of in Sect. 3.3.2, we use RDG theory to predict the side scatter
∼ 1.8 + 0.01i for spherical BC described as tar balls by into the OPC collection optics for particles as a function of
Chakrabarty et al. (2010), indicating that the aerosol popu- the number of monomers, Np , while holding the other param-
lation measured here does not have a significant contribution eters in Eq. (4) constant. This allows us to treat the nominal
from tar balls. At the OPC laser wavelength of 663 nm, the OPC size distribution as a distribution of monomers in the
retrieved RI is (1.61 ± 0.14) + (0.00 ± 0.06)i. Particles with fractal particle. We can then use the same RDG parameters
this RI will scatter light slightly more efficiently than ammo- to estimate the extinction cross section and compare it to the
nium sulfate particles, and therefore the LAS will attribute measured spectra. Because the RI retrieval is so sensitive to
this scattered light to a slightly larger particle. Therefore, this an accurate representation of the particle size, we do not at-
result is consistent with our finding that the LAS mode di- tempt to fit any of the RDG parameters. Instead, we show the
ameters are slightly higher than the diameter set point. How- expected cross sections for two plausible RDG parameteriza-
ever, we do not attempt to correct the LAS diameters further, tions of BC particles.
as that analysis is complicated by the small number of frac- Figure 6 shows the measured extinction cross sections
tal particles also observed. Manfred et al. (2018) assumed for the five diameter set points. These spectra were taken
a typical RI for brown carbon (Dinar et al., 2008), shown 1 h after the fire was ignited and represent the aerosol that
as filled squares at 375 and 405 nm, to model the measured passed through the thermodenuder. Therefore, the major-
phase function from this fire, with good results. We find good ity of organic coatings that might complicate the analysis
agreement with those assumed RIs within instrumental un- are removed prior to measurement. Following Manfred et
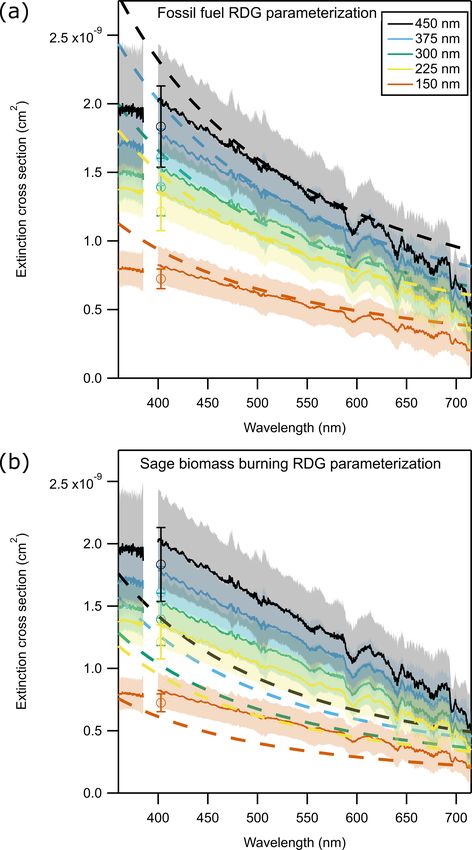
certainty. al. (2018), we use two parameterizations. Both assume an
RI for BC of 1.95 + 0.8i (Bond and Bergstrom, 2006) and
4.6 Refractive index retrieval for aerosol dominated by an individual monomer diameter of 50 nm. The first is meant
black carbon (Fire B) to represent fractal particles from fossil fuel combustion. It
assumes a prefactor of 1.2 and a fractal dimension of 1.75
Fire B (no. 085) was a sage (Artemisia) fire that produced (Sorensen, 2001). The second represents sage biomass burn-
smoke with a high BC content, as evidenced by the minimal ing and consists of a prefactor of 2.56 and a fractal dimen-
change in particle counts and volume between the fresh and sion of 1.79 (Chakrabarty et al., 2006). The two parameter-
thermodenuded smoke (Manfred et al., 2018). Furthermore, izations are shown in Fig. 6a and b. The fossil fuel param-
Manfred et al. (2018) demonstrated that the measured phase eterization yields the closer approximation of the measured
function for this aerosol population could not be accurately data, but the measurement lies in between the two parame-
fit assuming Mie theory and a typical BrC RI. Instead, they terizations. This is consistent with the results of Manfred et
used Rayleigh–Debye–Gans theory, along with two different al. (2018), in which the measured phase function for ther-
parameterizations of the fractal particles, to fit the measure- modenuded smoke from Fire B lay in between the two pa-
ment. As described in Sect. 3.3.2, RDG theory treats frac- rameterizations.
tal particles as an aggregate of many smaller monomers, and
the input parameters describe the number of monomers, their 4.7 Summary of refractive index retrievals for 13 fires
configuration in the aggregate, and the extinction properties during FIREX
of each monomer.
Unfortunately, neither size distribution method used here We place the Fire A and B retrievals in the context of
can accurately constrain these parameters well. The SMPS the other FIREX measurements by analyzing the quality of
size distributions are inaccurate because fractal particles have the RI retrieval method assuming Mie theory and relating
mobility diameters that differ significantly from their geo- these values to the fraction of aerosol that is black carbon.
metric diameters. The OPC size distributions yield more use- The BC / (BC + OA) fraction was calculated relative to the
ful information because they measure scattered light within a largest BC fraction for 13 fires for which the data were avail-
Atmos. Chem. Phys., 21, 7235–7252, 2021 https://doi.org/10.5194/acp-21-7235-2021C. C. Womack et al.: Complex refractive indices for biomass burning aerosol 7247
Figure 7. An analysis of 13 fires at the Fire Sciences Laboratory,
including the two presented in detail in this paper. Each fire was an-
alyzed identically in this figure. For each fire, the χ 2 of the retrieval
fit at λ = 475 nm assuming Mie theory is plotted against the relative
fraction of total aerosol that is BC. There is a correlation between
the BC fraction and the quality of the fit assuming Mie theory. Fire
B has a far higher fraction of BC than the other fires and is fit very
poorly assuming Mie theory, while Fire A is fit more accurately by
Mie theory. The majority of fires have a smaller BC contribution
than either Fire A or B and are generally fit reasonably well as-
suming Mie theory. Note that we have plotted relative BC fraction
rather than absolute fraction. Significant uncertainties in the AMS
data make the absolute fraction difficult to accurately assess, as de-
scribed in Sect. 2.6, but the relative fraction is still robust. Therefore,
Fire B, which had the highest BC fraction, is defined here as 1, and
the BC fractions for the other fires are scaled relative to Fire B.
correlate with single scattering albedo and the Ångström ab-
sorption coefficient (Pokhrel et al., 2016). The RI retrievals
were performed using the SMPS size distributions, as the
LAS data were often not available. Therefore, this analysis is
also a function of how well the SMPS size distributions char-
acterize the aerosol geometric diameter. Figure S6 shows the
Figure 6. Measured extinction cross section of thermodenuded
black carbon dominated aerosol in Fire B are shown as the thin retrieved wavelength-dependent RI for each fire across the
solid lines. Calculated extinction cross section for different RDG entire 360–720 nm wavelength range. To demonstrate the ef-
parameters (Eq. 4) are shown in each panel. (a) Fossil fuel RDG fectiveness of the retrieval method, we report the χ 2 of the
parameters from Sorensen (2001). (b) Biomass burning RDG pa- RI retrieval in Fig. 7 at a single wavelength, 475 nm, where
rameters for sage from Chakrabarty et al. (2006). The measurement the BBCES instrument had high mirror reflectivity and there-
lies between these two parameterizations, thereby constraining the fore good precision. The reported χ 2 for each fire is from a
RDG prefactor and fractal dimension, but is closer to the fossil fuel single set of measurements through the bypass channel, ap-
parameterization. proximately 1 h after the fire start, and therefore represents
well-mixed smoke. The derived real part of the RI for the
low-BC fires ranged from 1.54 to 1.69 at 475 nm with an av-
able from the average SP2 black carbon mass and the rel- erage value of 1.635 ± 0.056, and the imaginary part ranged
ative AMS organic aerosol mass, and the error bars were from 0.00i to 0.23i with an average value of 0.06i ± 0.12. At
derived from propagating the two instrument uncertainties. 365 nm, the average value of the real part was 1.605 ± 0.041
Only aerosol that bypassed the thermodenuder was used in and the imaginary part was 0.038i ± 0.074. We note that the
this analysis, in order to quantify fresh non-denuded smoke. average k value is slightly greater at 475 nm than at 365 nm,
We elected to evaluate the RI retrieval as a function of the but the two values are consistent within the error bars of the
BC / (BC + OA) ratio instead of the mass combustion effi- averaged measurements of aerosol from different fuel types
ciency, as BC / (BC + OA) has been shown to more strongly and fire conditions.
https://doi.org/10.5194/acp-21-7235-2021 Atmos. Chem. Phys., 21, 7235–7252, 2021You can also read